Orginal Article

Moisture content variations in soil and plant of post-fire regenerating forests in central Yunnan Plateau, Southwest China

  • CHEN Lifang , 1 ,
  • DOU Qun 2 ,
  • ZHANG Zhiming 3 ,
  • SHEN Zehao , 1, *
Expand
  • 1. Institute of Ecology, College of Urban and Environmental Science, the MOE Laboratory of Earth Surface Processes, Peking University, Beijing 100871, China
  • 2. Graduate School of Life and Environmental Sciences, University of Tsukuba, Ibaraki 305-8572, Japan
  • 3. College of Ecology and Environment, Yunnan University, Kunming 650504, China

*Corresponding author: Shen Zehao, Professor, specialized in landscape ecology. E-mail:

Author: Chen Lifang, graduate student of landscape ecology. E-mail:

Received date: 2018-05-10

  Accepted date: 2019-01-22

  Online published: 2019-07-25

Supported by

National Natural Science Foundation of China, No.41371190

Copyright

Journal of Geographical Sciences, All Rights Reserved

Abstract

Plant moisture content (PMC) is used as an indicator of forest flammability, which is assumed to be affected by climate drought. However, the fire-induced drought stress on PMC and its spatial and temporal variations are unclear. Based on a parallel monitoring experiment from 2014 to 2015, this study compared the PMCs and soil moisture contents (SMC) at five post-fire sites in central Yunnan Plateau, Southwest China. The number of years since last fire (YSF), season, topographic position, plant species and tissue type (leaf and branch) were selected as causal factors of the variations in PMC and SMC. A whole year parallel monitoring and sampling in the post-fire communities of 1, 2, 5, 11 and 30 YSF indicated that drought stress in surface soils was the strongest in spring within the first 5 years after burning, and the SMC was regulated by topography, with 64.6% variation in soil moisture accounted for by YSF (25.7%), slope position (22.1%) and season (10.8%). The temporal variations of PMC and SMC differed at both interannual and seasonal scales, but the patterns were consistent across topographic positions. PMC differed significantly between leaves and branches, and among three growth-forms. The mean PMC was lower in broad-leaved evergreen species and higher in conifer species. Season and soil temperature were the primary determinants of PMC, accounting for 19.1% and 8.3% of variation in PMC, respectively. This indicated phenology-related growth rather than drought stress in soil as the primary driver of seasonal changes in PMC. The significant variations of PMC among growth forms and species revealed that seasonal soil temperature change and dominant species in forest communities are useful indicators of fire risk assessment in this region.

Cite this article

CHEN Lifang , DOU Qun , ZHANG Zhiming , SHEN Zehao . Moisture content variations in soil and plant of post-fire regenerating forests in central Yunnan Plateau, Southwest China[J]. Journal of Geographical Sciences, 2019 , 29(7) : 1179 -1192 . DOI: 10.1007/s11442-019-1652-8

1 Introduction

Wildfire is one of the most common natural disturbances affecting ecosystems worldwide. It is considered as an intrinsic driver of succession in many vegetation types (Lohman et al., 2007; Pausas et al., 2015). A vast body of literatures has revealed the critical role of fires in shaping species strategies (Schutte et al., 1995; Bowman and Murphy, 2010), regulating community assembly (Cavender-Bares and Reich, 2012), driving the dynamics of ecosystem function and biogeochemical cycling (Houghton et al., 2000; DeLuca et al., 2006; Morris et al., 2014).
The spatial and temporal variation of wildfires is generally related to four main natural factors: fire source, climate, fuel moisture, and topography (Pausas and Paula, 2012). Fire intensity varied spatially relative to topographic positions, generally more intense fires occur on south-facing slopes and hilltops than north-facing slopes and valley bottoms (Han et al., 2015). At a regional scale, wildfires are more likely to occur in climate conditions where periods of significant drought are common (Johnson et al., 1990; Marlon et al., 2008), and wind by reducing the air humidity can increases vegetation flammability as well as fire propagation (Cumming 2001; Trouet et al., 2009; Sanjuan et al., 2014). At the stand scale, moisture content of litters and living plants directly determine the fuel flammability (Viegas et al., 1992; Dimitrakopoulos and Papaioannou, 2001). In recent studies, fuel moisture has been mostly estimated with remote sensing or climate-derived data, and been used in wildfire prediction and mapping at regional to global scales (Albertson et al., 2010; Chuvieco et al., 2004b; Maffei and Menenti, 2014; Tanase et al., 2015), and studies have differentiated the effects of moisture between living plants and litters (Reid et al., 2012; Clark et al., 2014). Moreover, surface soil temperature and moisture were also used as indicators of fuel moisture in estimating fuel flammability, and over time, the fire risk (Krueger et al., 2015).
At a landscape scale, occurrences of forest fire are typically point-based events that are directly associated with fuel flammability at local habitats (Clark et al., 2014). Therefore, the estimate of fuel flammability is critical for the accuracy of fire risk prediction, and fuel flammability should be sensitive to the spatial and temporal resolutions of information on fuel moisture content. However, high resolution data on temperature and moisture content of soils and plants, as indicators of fuel combustibility, are difficult to obtain. This challenge is due to the spatial heterogeneity of vegetation in structure and composition (Hunt et al., 1987; Chuvieco et al., 2004a), and the lack of required accuracy in fuel moisture information that mostly derived from remote sensing data (Valette, 1993; Castro et al., 2003) or modeling output (Matthews, 2006), instead of direct field measurement. For these reasons, the availability of high resolution data for variations of soil and plant moisture is crucial for a better understanding of the relationship between fire risk and fuel condition, and the reliable prediction of fire risks.
Fire regime characteristics, such as the frequency distributions of returning interval and burned area, are determined by a particular combination of climate and fuel features in different fire-prone ecosystems (Hunter, 1993; Taylor and Skinner, 2003). Because of uncertainties in the ignition condition and severity for wildfires and the challenges in controlling prescribed burning, the long-term monitoring of post-fire restoring processes across multiple environmental gradients are not common, especially in forest ecosystems (Cavender-Bares and Reich, 2012; Menke et al., 2015). As a fire-prone ecosystem, mixed coniferous and broad-leaved forests that dominated by Yunnan Pine (Pinus yunnanensis) and several species in Quercus and Lithocarpus are a typical forest landscape in central Yunnan Plateau, Southwest China (Li and Sun, 1998; Han et al., 2015). This region possesses a semi-humid subtropical climate, which is characterized by an eminent dry season from December to the following May, creating a period of high fire vulnerability (Zhang et al., 1994; Su et al., 2015). Although the spatial and temporal distributions of fires in this region have been described and predicted with regard to climate condition (Zhang et al., 1994; Wang et al., 2015; Ying, 2017), and the fuel flammability has been explored with experiments (Li et al., 2006; Li et al., 2016; Wang et al., 2016), there is little knowledge about the fuel moisture variation that is known to be critical for fire risk in this region. This study tried to compare the moisture content of surface soils and tissues of common woody species at post-fire sites of different years-since-last fire (YSF) in central Yunnan Plateau. Specifically we aimed to address the following questions:
1) How do moisture contents in living plants and soil differ with regard to intra- and inter-annual temporal scales and topography-related spatial variation?
2) How do ecological and taxonomic features affect the spatio-temporal variation of plant moisture content (PMC) in the common woody plant species of the studied forests?

2 Materials and methods

2.1 Site description

The study area is located near Qinfeng town in Lufeng County of the central part of Yunnan Province (101°38′-102°25′E, 24°51′-25°30′N). The terrain gradually inclines from northwest to southeast, with an average elevation of 2000 m above sea level (a.s.l.) (Figure 1a). The region is affected by the southwest monsoon from the Indian Ocean. The subtropical climate in central Yunnan is characterized by a long, dry season occurring from December to May, followed by a prominent rainy season from June to October, with a mean annual precipitation of 912 mm and a mean annual temperature of 13.8℃ (Han et al., 2015). The air temperature in spring is fairly high, due to the low latitude of the study region and low rainfall (equal to only 10%-20% of annual precipitation during spring) (Figure 1b) which results in high frequency forest fires (Figure 1c). In contrast, rainfall in summer is quite abundant, accounting for 60% of annual precipitation (Su et al., 2015).
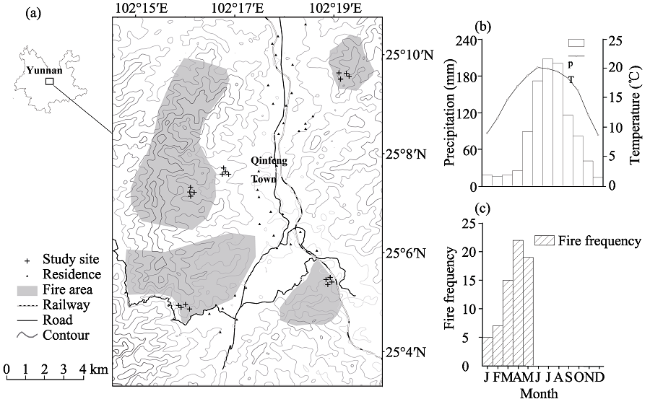
Figure 1 Geographical location and climatic features of the burned sites in central Yunnan Plateau: a) Location of the study area and the burned sites of 1, 2, 5, 11 and 30 years-since-last-fire (YSF); b) monthly mean precipitation and temperature in Qinfeng County; and c) monthly frequency distribution of fire records from 2003-2012
The main vegetation types are characterized by secondary, mixed forests of conifers and broad-leaved evergreen species, dominated by Lithocarpus dealbatus, Cyclobalanopsis glaucoides, Myrica nana, Quercus acutissima, Lyonia spp., Pinus yunnanensis and Keteleeria evelyniana (Su et al., 2015; Fan et al., 2011). Studies have shown that vegetation types in central Yunnan Plateau are typically fire-prone (Li, 2000; Zhao et al., 2009; Chen et al., 2014). Human activities are pervasive across the mountainous sections of the study area, including tree cutting for firewood and mushroom and medicinal plants harvesting. These activities are directly associated with igniting almost all of the recorded forest fires. During the pre-monsoon season (March to May), when temperature is already high, the relative air humidity is only 32%-65%, thus creating highly flammable conditions in forests (Huo and Liu, 1987; Zheng et al., 1994) (Figures 1b and 1c).

2.2 Data sampling and experiments

We used the space-for-time research approach (Legendre et al., 1989) to locate five post-fire sites in the study area, which were burned in 2013, 2012, 2009, 2003 and 1984, corresponding to 1, 2, 5, 11 and 30 YSF, respectively. The restored vegetation types included shrubs and young forests of mixed conifers and broad-leaved trees, with the canopy heights ranging from 1 to 7 m.
We began to collect samples of surface soils and plant tissues on burned sites (n=20) in October 2014, in the post-monsoon autumn, and then repeated collections during the following winter, spring and summer. Plant and soil samples were collected in three random replicates at each topographic position within 10×10 m plots set at four topographic positions (i.e., hilltop, valley bottom, south slope, and north slope). The elevation of the plots ranged 1851-2122 m a.s.l. We collected and measured soil and plant tissues moisture in the middle of each season, starting collections after three consecutive sunny days between 8:00 am and 12:00 am. A total of 18 most common woody plant species of three growth-forms, evergreen coniferous (EC), evergreen broad-leaved (EB) and deciduous broad-leaved (DB) in the studied stands were measured for moisture content. To continuously obtain surface soil temperature dynamics over one year, we placed one automatic temperature recorder (HOBO) at each of the four topographic positions in each burned site at a depth of 2 cm below the soil surface. Temperature was recorded at one-hour intervals.
During each season, we randomly collected three topsoil samples (at 5-cm depth) in each of the 20 plots, and measured the wet weight of each sample using an aluminum cylinder with 5 cm depth by 5 cm diameter, removing surface litter and gravels > 0.5 cm diameter. We then measured the dry weight in the lab after drying the samples at 105℃ for 12 h. For the 18 plant species sampled, we collected a few healthy leaves and a section of branches with 5 cm in length (formed during the current year) from the same three plant species during each of the four seasons, placed each sample in a labeled paper envelope and immediately measured the fresh weight in the field, and reweighed each sample after drying at 85℃ for 24 h. The wet and dry weights for each sample were measured using a portable electronic balance with an accuracy of 0.01 g. In total, we sampled 11,433 samples of branches and leaves from 5716 individuals belonging to the 18 woody plant species of three growth-forms.

2.3 Data analysis

We calculated plant moisture content based on both fresh and dry weights (Slavik, 1974):
$${{\text{M}}_{\text{B}}}=({{\text{W}}_{\text{B}}}-{{\text{D}}_{\text{B}}})/{{W}_{\text{B}}}*100\text{ }\!\!\%\!\!\text{ }\ \ \ \ \ (1)$$
$${{\text{M}}_{\text{L}}}=\text{(}{{\text{W}}_{\text{L}}}-{{\text{D}}_{\text{L}}}\text{)/}{{\text{W}}_{\text{L}}}*100\text{ }\!\!\%\!\!\text{ }\ \ \ \ \ (2)$$
where MB and ML are moisture percentage of branch and leaf samples, ${{\text{W}}_{\text{B }}}\text{and }{{\text{W}}_{\text{L}}}$ are wet weights, and DB and DL are dry weights of branch and leaf samples.
We calculated soil moisture content using the gravimetric method:
$${{\text{M}}_{\text{S}}}\text{ = }({{\text{W}}_{\text{S}}}-{{\text{D}}_{\text{S}}})/{{W}_{\text{S}}}*100\text{ }\!\!\%\!\!\text{ }\ \ \ \ \ (3)$$
where MS is soil moisture content, WS is wet weight and DS dry weight of each soil sample.
The records of soil temperature were aggregated daily to obtain a daily mean value over one year period of monitoring.
Generalized linear model (GLM) was applied to explore the multivariate relationships between MS or PMC and potential determinants including YSF, season, topographic position, soil temperature, and growth-forms. All data analyses were performed in R 3.2.2. Multifactor comparisons were performed using “multcomp” and hierarchical variance partitioning was analyzed using the “hier.part” statistical package. The common general linear model was utilized in multiple comparisons:
$$\text{y=X}\cdot \text{ }\!\!\beta\!\!\text{ }+\text{ }\!\!\varepsilon\!\!\text{ }\ \ \ \ \ (4)$$
where y = (${{y}_{1}}$, …, ${{y}_{n}}$ )T denotes the n×1 vector of observations, X = ${{({{x}_{ij}})}_{ij}}$ denotes the fixed and known n×p design matrix, and $\text{ }\!\!\beta\!\!\text{ }={{({{\beta }_{1}},\ldots ,{{\beta }_{p}})}^{\text{T}}}$ denotes the fixed and unknown parameter vector. The random, unobservable n×1 error vector ε is assumed to follow an n-dimensional normal distribution with mean vector 0 = (0, v 0)T and covariance matrix ${{\sigma }^{2}}{{I}_{n}}$, ε~Nn (0, ${{\text{ }\!\!\sigma\!\!\text{ }}^{2}}{{I}_{n}}$) (Bretz et al., 2016). Hierarchical partitioning calculates goodness-of-fit measures for the entire hierarchy of models with all combinations of the N independent variables using the function ‘all.regs’. This algorithm takes the list of goodness-of-fit measures, and uses the partition function, applies the hierarchical partitioning algorithm to return a simple table listing each variable, including its independent contribution (I), and its joint contribution with all other variables (J) (Walsh et al., 2003). The distribution of joint effects shows the relative contribution of each variable to shared variability in the full model. Negative joint effects are possible for variables that act as suppressors of other variables (Chevan and Sutherland, 1991). In addition, we used randomized elements in each column and recalculated ‘hier.part’ 100 times for a randomization test for hierarchical partitioning (Walsh et al., 2003).

3 Results

3.1 Temperature variations of surface soil

In the study area, the variations in surface soil temperature revealed a consistent seasonal pattern, irrespective of YSF or slope position. In general, surface soil temperature decreased after August 2014 to a minimum value in January 2015 (all > 2℃), and turned to increase and reach a peak value in June and July, then decreased a little until late July, and increased again to reach a secondary peak temperature in September (Figure 2a).
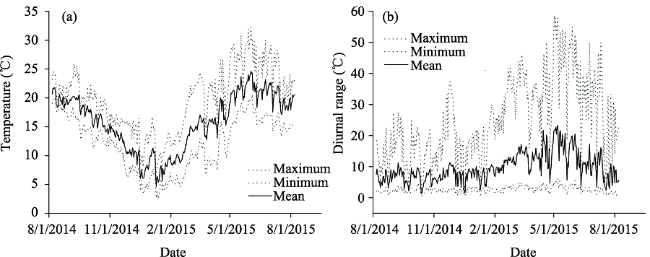
Figure 2 Temporal (a) and diurnal (b) dynamics of soil surface temperature, pooled for records collected on different slope positions of the five study sites in central Yunnan Plateau
The mean of diurnal temperature range of surface soil (pooled for records on all 20 monitoring sites) in the spring and summer of 2015 varied much wider than that during the autumn and winter of 2014, and the maximum of mean daily range in soil temperature occurred in early May. The annual variation of maximum records of daily range of surface soil temperature followed a similar pattern with a more intensive seasonal variation, whereas minimum values of the 20 simultaneous recordings of daily temperature range changed little across the year of observation. Noteworthy, the daily range in surface soil temperature in early August of 2015 was similar to the range measured for the same period in 2014 (Figure 2b).

3.2 Variations of moisture contents in soil and plant

Although the moisture contents of plant samples (52.9%±1.3% for branches in Figure 3a and 57.5%±0.7% for leaves in Figure 3b) was three times higher than those of surface soil (16.5%±0.3%, Figure 3c), the variability of moisture content in plant samples was much less than that of soil moisture content (SMC) across different levels of YSF, season, or topographic position. Nevertheless, for each level of a specific factor (YSF, topographic position and season), the variability of moisture content was much larger for branches and leaves than soil samples.
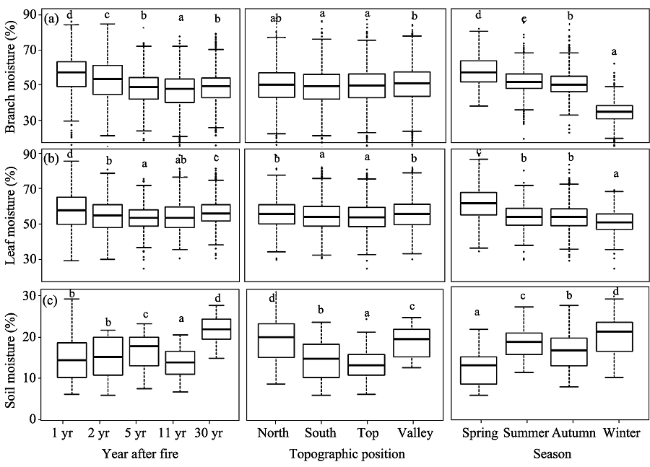
Figure 3 Plant branches/leaves moisture and soil moisture variation tendency at spatial and temporal scales in central Yunnan Plateau
For soil samples, the 30 YSF site was significantly more humid (with mean SMC >20%) than the other four sites burned more recently (SMC = 13%-18%), although SMC did not increase continually with YSF (a decrease on 11th YSF, Figure 3c). With respect to season, SMC was the lowest in spring, increased during summer, decreased slightly in autumn, and reached its maximum value in winter. As for topographic position, SMC was obviously lower at south-facing slopes and hilltops than at north-facing slopes and valley bottoms.
In contrast to the increasing trend of SMC with the increase of YSF, except a low value in the 11 YSF site, the highest PMC for both branches and leaves was recorded at the site of 1st YSF site (mean PMC ≈ 60%), this value then declined by 5%-10% in plant samples collected at sites of larger YSFs. The seasonal pattern of moisture was similar for branches and leaves, declined from spring to summer, autumn, and reached the minimum in winter, this trend was also opposite to that of SMC, which reached the highest value in winter and lowest in spring. Moreover, the moisture content of branches and leaves showed little difference among the four topographic positions (Figures 3a and 3b).

3.3 Variations of PMC across growth-forms and species

In general, the moisture content of vegetation was the lowest in the evergreen broad-leaved (EB) species (51.3%±11.0% in branches and 56.6%±8.5% in leaves), and the highest in evergreen conifer (EC) species (58.0%±11.9% in branches and 61.0%±6.9% in leaves). Deciduous broad-leaved (DB) tree species had intermediate values (53.4%±11.1% in branches and 57.4%±9.0% in leaves). The moisture content of leaves was significantly different among three growth-forms for the sites of different YSF.
The moisture content of branches and leaves of three plant growth-forms followed a consistent pattern among the sites relative to YSF (Table 1). The highest value was recorded in the first year after fire, the lowest value was generally observed in the 5th or 11th YSF for different tissues and growth-forms. The seasonal patterns of PMC were also similar for the three growth-forms, the highest in spring, not significantly different between summer and autumn, and the lowest in winter. In contrast, topographic patterns of PMC were not the same for three growth-forms. For DB species, there were no significant differences in PMC (for either branches or leaves) between different topographic positions. However, for both EB and EC species, the PMC of branches and leaves were slightly but significantly (p<0.05) lower at south-facing slopes and hilltops than those at north-facing slopes and valley bottoms.
Table 1 The variations of moisture contents in the branches and leaves of trees in three growth forms with regard to YSF, season, and topographic position, in central Yunnan Plateau. Superscript character indicates the difference among values for different levels of each predictive factor. DB, deciduous broad-leaved species; EB, evergreen broad-leaved species; EC, evergreen coniferous species; South, south slope; North, north slope.
Plant tissue Branch (%) Leaf (%)
Growth form DB EB EC DB EB EC
YSF


1st 60.8b±8.5 57.7d±8.8 61.3cd±7.9 60.0c±8.2 59.0b±8.5 66.3d±8.1
2nd 57.7b±8.3 53.3c±8.5 61.7d±8.9 59.1b±8.2 54.7a±8.6 63.6c±8.5
5th 50.5a±7.7 49.5b±7.3 57.9bc±7.8 54.6a±7.6 55.4a±7.5 57.2b±7.4
11th 50.0a±8.1 47.5a±6.9 56.7ab±8.5 57.9b±8.9 55.2a±7.1 59.8a±7.9
30th 51.6a±7.8 50.6b±7.7 54.3a±7.9 57.0b±7.3 58.9b±8.1 60.8a±6.9
Season


Spring 62.1d±8.5 59.7c±8.8 67.7c±7.9 67.3c±8.2 62.9c±8.5 62.7c±8.1
Summer 56.2c±8.2 54.0b±8.1 60.1b±7.8 55.3b±7.4 55.1b±7.7 61.1b±76
Autumn 53.1b±8.2 53.4b±7.8 59.6b±8.3 54.0b±8.8 55.8b±7.2 61.3b±8.3
Winter 38.3a±7.4 36.6a±7.0 40.1a±7.0 51.3a±7.2 52.4a±7.0 58.1a±7.5
Topographic feature

North 52.9a±8.5 51.8bc±8.8 58.3a±7.9 57.2a±8.2 57.3b±8.5 61.8b±8.1
South 53.5a±8.9 49.6a±8.4 57.9a±8.3 58.1a±9.1 55.2a±8.7 60.8ab±8.3
Top 53.3a±8.4 50.6ab±8.6 57.0a±8.1 57.5a±8.2 55.0a±8.4 60.2a±8.6
Valley 53.7a±8.6 52.7c±8.7 59.4a±8.4 56.8a±8.3 58.2b±8.8 61.3ab±8.7
Comparing the 18 woody species sampled, an obvious phylogenetic bias was revealed in the PMC variation of branches (Figure 4a) and leaves (Figure 4b). Eight species with the lowest leaf moisture content belonged to the Fagaceae Family (including Cyclobanalopsis and Quercus, Figure 4b). These species were mostly EB species and canopy dominants. Other common species in the communities possessed moderate moisture contents, these included Pinus yunnanensis, Lyonia ovalifolia, and two species of Myrica. The most common shrub species in the study possessed relatively high moisture content, although the highest moisture values for leaves and for branches were measured in the conifer species, Ketelerria evelyniana and P. yunnanensis, respectively.
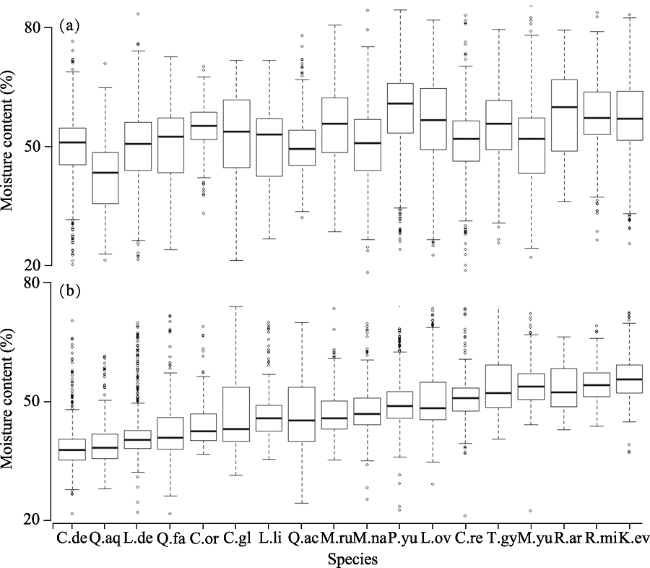
Figure 4 Branch (a) and leaf (b) moisture content of 18 plant species in central Yunnan Plateau. C.re, Camellia reticulata; C.or, Castanopsis orthacantha; C.de, Cyclobalanopsis delavayi; C.gl, C. glaucoides; K.ev, K. evelyniana; L.de, L. dealbatus; L.li, L. litseifolius; L.ov, Lyonia ovalifolia; M.yu, Michelia yunnanensis; M.na, M. nana; M.ru, M. rubra; P.yu, P. yunnanensis; Q.fa, Q. fabrei; Q.aq, Q. aquifolioides; Q.ac, Q. acutissima; R.mi, Rhododendron microphyton; R.ar, R. araiophyllum; T.gy, Ternstroemia gymnanthera

3.4 Determinants of soil and plant moisture variations

Hierarchical variation partitioning revealed that four habitat factors, i.e., YSF, season, topographic position, and surface soil temperature, accounted for 64.6% of variation in soil moisture, with YSF (25.7%), slope position (22.1%) and season (10.8%) comprising the top three factors that independently contributed to soil moisture (Figure 5a). In contrast, 36.4% of the PMC variation was attributed to eight variables. Season (19.1%) and soil temperature (8.3%) were the top two contributing factors. Plant tissue (branch or leaf) and growth-form were also important factors, whereas the effect of YSF was negligible for the PMC variation (Figure 5b).
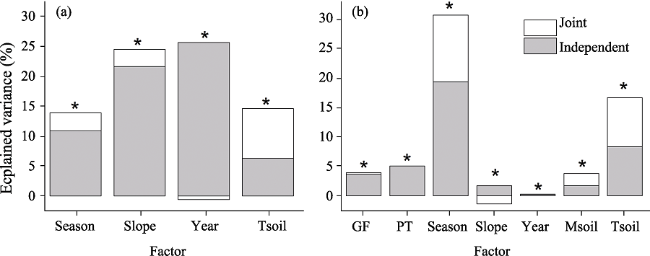
Figure 5 Hierarchical partition of moisture variation in (a) soil and (b) post-fire regenerated plant tissues in central Yunnan Plateau, based on GLM analysis (type includes three growth-forms covering DB, EB and EC, as indicated in the text, * means difference is statistically significant).
Variation in PMC of the three growth-forms was accounted for by 44.9% (for DB species), 35.1% (EB), and 30.1% (EC), respectively. Seasonal and soil temperature were the most important factors in all cases. The soil moisture was also important for PMC in DB and EC species, while plant tissue type (branch or leaf) was critical for PMC in EB species. Separated HP analysis showed that the variations of moisture content in branch and leaf was accounted for 22.2% and 56.6%, respectively. Season remained the primary determinant of PMC for both branches and leaves, followed by growth-form for branches, and soil temperature for leaves (Table 2).
Table 2 Hierarchical variation partitioning for PMC of three growth-forms and two types of plant tissue in central Yunnan Plateau. DB, deciduous broad-leaved; EB, evergreen broad-leaved; EC, evergreen coniferous. Indep., independent effect (%); Joint, joint effect (%). SMC, soil moisture content; Tsoil, temperature of surface soil.
Exp. variable DB EB EC Branch Leaf
Indep. Joint Indep. Joint Indep. Joint Indep. Joint Indep. Joint
Plant tissue 3.74 0.00 6.85 0.00 2.29 0.00
Growth-form 3.55 0.06 4.35 0.40
Season 25.91 15.89 19.57 9.99 15.51 11.92 13.30 3.86 27.93 20.19
Slope position 1.17 -1.09 2.60 -1.15 1.82 -1.37 1.24 -0.60 2.57 -2.33
YSF 0.69 0.49 0.17 -0.16 1.17 1.18 0.52 -0.26 1.12 0.73
SMC 3.88 5.58 1.23 0.63 2.43 3.29 0.81 0.18 3.10 4.62
Tsoil 11.35 12.78 7.48 6.46 9.82 9.15 2.76 1.85 17.49 15.95

4 Discussion

4.1 Contrasting variations of moisture contents in soils and plants

Habitat degradation is widely observed after fires (Lamont et al., 1993). The loss of canopy cover and ground litter layer largely increases the risk of plant mortality for some species during early post-fire regeneration but plant regeneration can also benefit from these open conditions (Lloret et al., 2003; Bonnet et al., 2005). However, the direct impacts of forest fires on moisture content of soil and plants of post-fire sites have rarely been studied, and the adaption of plants to fire-induced environmental stress is therefore elusive.
In this study, the gradual recovery of SMC over time after burning indicates a possible drought stress in early stages of post-fire regeneration. However, the PMC of all three growth-forms of woody species were the highest in the first year after burning, and decreased significantly thereafter, this suggests that SMC was not a primary determinant of PMC, at least when it was below a threshold value. In fact, Han et al. (2015) found that the post-fire tree regeneration in the study region was very rapid and abundant compared to many fire-prone vegetation types in other regions. The abundance of summer rainfall, >500 mm on average (Figure 1b), might play a critical role in releasing drought stress in soil following fires, thus allowing the ecosystem to recover rapidly from fires.
The contrast between seasonal dynamics and topographic patterns of SMC and PMC (both branches and leaves) also reveal the adaptive capacity (i.e. resilience) of common woody species to the spatio-temporal variations of water availability in a heterogeneous landscape. Specifically, although soil moisture availability is significantly modified by topography, the difference of PMC between branches and leaves are negligible across topographic positions. Thus, the seasonal dynamics of PMC is dominated by plant phenology rather than the dynamics of SMC, even during the drought stress that occurs in spring. Despite numerous studies on the homeostasis of plant stoichiometry (Ågren, 2008), which mostly focused on chemical elements, this study provides a direct evidence for the stability of moisture content in woody plant species facing drought stress caused by fires.

4.2 Biotic and abiotic controls on PMC

Fuel moisture content is an important predictor of fuel flammability (Castro et al., 2003; Pellizzaro et al., 2007), and has been increasingly applied in fire risk assessment (Chuvieco et al., 2004a; Tanase et al., 2015). Since fine fuel, including leaves and thin shoots, is highly combustible, fuel type plays a critical role in wildfire initiation and propagation (Castagneri et al., 2013; Clark et al., 2014). Therefore, to better understand how differences in fuel flammability may affect fire risk in forests with different species composition and structure, we should compare the moisture content of fine fuels among different communities (Johnston et al., 2015).
We found that PMC is significantly related to both growth-form and fuel types (branches vs. leaves). For the 18 most common woody species studied, broad-leaved evergreen species have the lowest moisture content in both branches and leaves, while the two evergreen conifer species, P. yunnanensis and K. evelyniana, have the highest moisture contents (Figure 4). Growth-form differences in moisture content were significant and changed little across sites of different YSFs (Table 2). Moreover, the eight species with the lowest moisture content were broad-leaved evergreen, belonging to the Family Fagaceae. The taxonomic and growth-form bias of moisture content thus supports the hypothesis that plant flammability is a naturally-selected trait (Burger and Bond, 2015; Zimmer et al., 2015).
Our data also showed that, besides season, surface soil temperature was also a critical determinant of leaf moisture (Table 2). Since the evergreen species of Fagaceae tend to dominate hilltops and south-facing slopes in the study region, the low moisture content of leaves and their sensitivity to soil temperature enable us to understand the spatial patterns related to the severity of forest fires (Bradstock et al., 2009; Fang et al., 2015; Han et al., 2015), and the high vulnerability of Fagaceae-dominated communities to forest fires. In contrast, the high moisture content in leaves and branches of K. evelyniana support its low flammability potential, which is locally well known.
In addition to moisture content, oil and aromatic compounds, such as terpenes, in plant tissue are also critical features influencing fuel flammability (Ormeño et al., 2008). Moreover, other studies have found the vertical structure of fuel materials is critical for the potential of fire propagation (Castagneri et al., 2013), and that forest litter has distinct spatial distribution and flammability from living fuel (Varner et al., 2015). Therefore, further studies need to integrate the physical and chemical features of fuel in order to better understand the inherent complexity of the flammability of different forest types and to more accurately predict the behavior of fire in this region.

4.3 Implications of forest management

Our results suggest that potential flammability, indicated by moisture content of living plants in the study region, is not significantly affected by drought stress in spring, and is largely invariant across topographic position. In contrast, species composition of forests can be a useful indicator for assessing fire risk in central Yunnan Plateau. In addition, since the moisture content of living plant tissue is not affected by spatial and seasonal variations in water availability, it would be important to focus on the distribution and moisture content of litters in forests to assess fire risk and manage fuel loads with optimal strategies. For example, prescribed burning in late autumn or early winter could be a useful strategy for decreasing litter accumulation, because the rainy season has passed so that the burning will not result in strong soil erosion in the following dry season of several months. Moreover, the growing season is almost finished, and moisture contents in both soil and plants are still high, thus the burning will be easier to control and less likely to cause severe harm to the living plants.

5 Conclusions

This study explored the spatial and temporal variations of moisture content in soils, tree branches and leaves of post-fire communities, as well as underlying drivers. Based on the approach of multiple comparisons and variation partition for the samples of different YSF sites, several preliminary conclusions can be drawn as follows:
(1) The post-fire drought stress in soil is obvious in central Yunnan Plateau, and is most severe in spring, regulated by topographic position. However, drought stress almost disappears in a forest stand about 10 years after a fire. A total of 64.6% variation in SMC was accounted for by YSF (25.7%), slope position (22.1%) and season (10.8%).
(2) The drought stress showed a limited effect on the variation of PMC in living tissues, both branches and leaves, for the 18 most common woody plant species in the study. PMC differs significantly among growth-form and taxa, is primarily related to seasonal phenology and soil temperature, accounting for 19.1% and 8.3% of variation in PMC, respectively. Tree species of Fagaceae had the lowest PMC in general, and thus should be vulnerable to wildfire.
(3) The contrast in moisture content between soil and plant tissue reveals a prominent resilience of extant vegetation to fire-induced drought stress, possibly facilitated by abundant rainfall in summer, implying that the local ecosystem is adapted to the monsoon-dominated regional climate.

The authors have declared that no competing interests exist.

1
Ågren G̈ I, 2008. Stoichiometry and nutrition of plant growth in natural communities. Annual Review of Ecology & Systematics, 39: 153-170.

2
Albertson K, Aylen J, Cavan G et al., 2010. Climate change and the future occurrence of moorland wildfires in the Peak District of the UK. Climate Research, 45: 105-118.

DOI

3
Bonnet V H, Schoettle A W, Shepperd W D, 2005. Postfire environmental conditions influence the spatial pattern of regeneration for Pinus ponderosa.Canadian Journal of Forest Research, 35: 37-47.

4
Bowman D M, Murphy B P, 2010. Conservation Biology for All: Fire and Biodiversity. Beijing: Oxford University Press Inc., 163.

5
Bradstock R A, Hammill K A, Collins L et al., 2009. Effects of weather, fuel and terrain on fire severity in topographically diverse landscapes of south-eastern Australia. Landscape Ecology, 25: 607-619.

6
Bretz F, Hothorn T, Westfall P, 2016. Multiple Comparisons Using R. Florida: CRC Press, 41-42.

7
Burger N, Bond W J, 2015. Flammability traits of Cape shrubland species with different post-fire recruitment strategies. South African Journal of Botany, 101: 40-48.

DOI

8
Castagneri D, Esposito A, Bovio G et al., 2013. Fuel vertical structure affects fire sustainability and behavior of prescribed burning in Spartiumjunceum shrublands. Annals of Forest Science, 70: 863-871.

9
Castro F X, Tudela A, Sebastià M T, 2003. Modeling moisture content in shrubs to predict fire risk in Catalonia, Spain. Agricultural and Forest Meteorology, 116(1/2): 49-59.

DOI

10
Cavender-Bares J, Reich P B, 2012. Shocks to the system: Community assembly of the oak savanna in a 40-year fire frequency experiment. Ecology, 93(8): S52-S69.

DOI

11
Chen F, Fan Z, Niu S, Zheng J, 2014. The influence of precipitation and consecutive dry days on burned areas in Yunnan Province, Southwestern China. Advances in Meteorology, 2014: 748923.

12
Chevan A, Sutherland M, 1991. Hierarchical partitioning. The American Statistician, 45(2): 90-96.

13
Chuvieco E, Cocero D, Aguado I et al., 2004a. Improving burning efficiency estimates through satellite assessment of fuel moisture content. Journal of Geophysical Research: Atmospheres, 109: D14S07.

14
Chuvieco E, Cocero D, Riano D et al., 2004b. Combining NDVI and surface temperature for the estimation of live fuel moisture content in forest fire danger rating. Remote Sensing of Environment, 92: 322-331.

DOI

15
Cumming S G, 2001. Forest type and wildfire in the Alberta boreal mixed wood what do fires burn?Ecology Applications, 11(1): 97-110.

DOI

16
DeLuca T H, MacKenzie M D, Gundale M J et al., 2006. Wildfire-produced charcoal directly influences nitrogen cycling in ponderosa pine forests. Soil Science Society of America, 70: 448-453.

DOI

17
Dimitrakopoulos A P, Papaioannou K K, 2001. Flammability assessment of Mediterranean forest fuels. Fire Technology, 37(2): 143-152.

DOI

18
Fan Z X, Bräuning A, Thomas A et al., 2011. Spatial and temporal temperature trends on the Yunnan Plateau, Southwest China, during 1961-2004. International Journal of Climatology, 31: 2078-2090.

DOI

19
Fang L, Yang J, Zu J et al., 2015. Quantifying influences and relative importance of fire weather, topography, and vegetation on fire size and fire severity in a Chinese boreal forest landscape. Forest Ecology and Management, 356: 2-12.

DOI

20
Flannigan M D, Krawchuk M A, de Groot W J et al., 2009. Implications of changing climate for global wildland fire. International Journal of Wildland Fire, 18: 483-507.

21
Han J, Shen Z, Ying L et al., 2015. Early post-fire regeneration of a fire-prone subtropical mixed Yunnan pine forest in Southwest China: Effects of pre-fire vegetation, fire severity and topographic factors. Forest Ecology and Management, 356: 31-40.

DOI

22
Houghton R A, Hackler J L, Lawrence K T, 2000. Changes in terrestrial carbon storage in the United States (2): The role of fire and fire management. Global Ecology and Biogeography, 9: 145-170.

DOI

23
Hunt E R, Rock B N, Nobel P S, 1987. Measurement of leaf relative water content by infrared reflectance. Remote Sensing of Environment, 22: 429-435.

DOI

24
Hunter M L, 1993. Natural fire regimes as spatial models for managing boreal forests. Biological Conservation, 65(2): 115-120.

DOI

25
Huo Z, Liu H, 1987. The characteristics of forest fire in Yunnan Province. Forest Fire Prevention, 1: 12-14. (in Chinese)

26
Johnson E A, Fryer G I, Heathcott M J, 1990. The influence of man and climate on frequency of fire in the interior wet belt forest, British Columbia. Journal of Ecology, 78: 403-412.

DOI

27
Johnston D C, Turetsky M R, Benscoter B W et al., 2015. Fuel load, structure, and potential fire behavior in black spruce bogs. Canadian Journal of Forest Research, 45: 888-899.

DOI

28
Krueger E S, Ochsner T E, Engle D M et al., 2015. Soil moisture affects growing-season wildfire size in the southern Great Plains. Soil Science Society of America, 79: 1567-1576.

DOI

29
Lamont B B, Witkowski E T F, Enright N J, 1993. Post-fire litter microsites safe for seeds, unsafe for seedlings. Ecology, 74: 501-512.

DOI

30
Legendre P, Fortin M J, 1989. Spatial pattern and ecological analysis. Vegetatio, 80(2): 107-138.

DOI

31
Li G, 2000. Forest fire causes analysis and management countermeasures in Yunnan province. Forest Fire Prevention, 7(2): 10-11. (in Chinese)

32
Li S Y, Wang Q H, Li B F et al., 2006. Comparative study on flammability of fresh leaves and living branches of 10 tree species in central Yunnan province. Journal of Southwest Forestry College, 26(1): 56-58. (in Chinese)

33
Li X, Wang Q H, Zhang Y Y, 2016. Studies on combustibility of 15 woody plants in the high fire risk area of central Yunnan. Forest Inventory and Planning, 41(2): 62-68. (in Chinese)

34
Li Z, Sun H, 1998. The architecture of leaves from dominant and common species of semi-humid evergreen broadleaved forest occurring in central Yunnan. Acta Botanica Yunnanica, 20(1): 49-57. (in Chinese)

35
Lloret F, Pausas J G, Vilà M, 2003. Responses of Mediterranean plant species to different fire frequencies in Garraf Natural Park, Catalonia, Spain, field observations and modeling predictions. Plant Ecology, 167: 223-235.

DOI

36
Lohman D J, Bickford D, Sodhi N S, 2007. The burning issue. Science, 316(5823): 376.

DOI

37
Maffei C, Menenti M, 2014. A MODIS-based perpendicular moisture index to retrieve leaf moisture content of forest canopies. International Journal of Remote Sensing, 35: 1829-1845.

DOI

38
Marlon J R, Bartlein P J, Carcaillet C et al., 2008. Climate and human influences on global biomass burning over the past two millennia. Nature Geoscience, 1: 697-702.

DOI

39
Martínez J, Vega-Garcia C, Chuvieco E, 2009. Human-caused wildfire risk rating for prevention planning in Spain. Journal of Environmental Management, 90: 1241-1252.

40
Matthews S, 2006. A process-based model of fine fuel moisture. International Journal of Wildland Fire, 15(2): 155-168.

DOI

41
Menke S B, Gaulke E, Hamel A et al., 2015. The effects of restoration age and prescribed burns on grassland ant community structure. Environmental Entomology, 44(5): 1336-1347. doi: 10.1093/ee/nvv110.

42
Mondal N, Sukumar R, 2014. Characterizing weather patterns associated with fire in a seasonally dry tropical forest in southern India. International Journal of Wildland Fire, 23(2): 196-201.

DOI

43
Morris J L, Mueller J R, Nurse A et al., 2014. Holocene fire regimes, vegetation and biogeochemistry of an ecotone site in the Great Lakes Region of North America. Journal of Vegetation Science, 25: 1450-1464.

DOI

44
Oliver C D, Larson B C, 1990. Forest Stand Dynamics. New York: McGraw-Hill Inc., 467.

45
Ormeño E, Baldy V, Ballini C et al., 2008. Production and diversity of volatile terpenes from plants on calcareous and siliceous soils: Effect of soil nutrients. Journal of Chemical Ecology, 34: 1219-1229.

DOI

46
Pausas J G, 2015. Evolutionary fire ecology lessons learned from pines. Trends in Plant Science, 20: 318-324.

DOI

47
Pausas J G, Paula S, 2012. Fuel shapes the fire-climate relationship: Evidence from Mediterranean ecosystems. Global Ecology and Biogeography, 21: 1074-1082.

DOI

48
Pellizzaro G, Duce P, Ventura A et al., 2007. Seasonal variations of live moisture content and ignitability in shrubs of the Mediterranean Basin. International Journal of Wildland Fire, 16(5): 633-641.

DOI

49
Reid A M, Robertson K M, Hmielowski T L, 2012. Predicting litter and live herb fuel consumption during prescribed fires in native and old-field upland pine communities of the southeastern United States. Canadian Journal of Forest Research, 42(8): 1611-1622.

DOI

50
Sanjuan G, Brun C, Margalef T et al., 2014. Wind field uncertainty in forest fire propagation prediction. Procedia Computer Science, 29: 1535-1545.

DOI

51
Schutte A L, Vlok J H J, Van Wyk B E, 1995. Fire-survival strategy: A character of taxonomic, ecological and evolutionary importance of fynbos legumes. Plant Systematics and Evolution, 195(3): 243-259. doi: 10.1007/BF00989299.

DOI

52
Slavik B, 1974. Methods of Studying Plant Water Relations. Berlin: Springer-Verlag Berlin Heidelberg, 173-174.

53
Su W, Shi Z, Zhou R et al., 2015. The role of fire in the central Yunnan Plateau ecosystem, southwestern China. Forest Ecology and Management, 356: 22-30.

DOI

54
Tanase M A, Panciera R, Lowell K et al., 2015. Monitoring live fuel moisture in semiarid environments using L-band radar data. International Journal of Wildland Fire, 24(4): 560-572.

DOI

55
Taylor A H, Skinner C N, 2003. Spatial patterns and controls on historical fire regimes and forest structure in the Klamath Mountains. Ecological Applications, 13(3): 704-719.

DOI

56
Trouet V, Taylor A H, Carleton A M et al., 2009. Interannual variations in fire weather, fire extent, and synoptic-scale circulation patterns in northern California and Oregon. Theoretical and Applied Climatology, 95(3/4): 349-360.

DOI

57
Valette J C, 1993. Flammabilities of Mediterranean species INRA’s methodology. INRA Document interne PIF9328.

58
Varner J M, Kane J M, Kreye J K et al., 2015. The flammability of forest and woodland litter: A synthesis. Current Forestry Reports, 1(2): 91-99.

DOI

59
Viegas D X, Viegas M, Ferreira A D, 1992. Moisture content of fine forest fuels and fire occurrence in central Portugal. International Journal of Wildland Fire, 2(2): 69-86.

DOI

60
Walsh C, Mac Nally R, Walsh M C, 2003. The hier. Part package. Hierarchical Partitioning. R project for statistical computing. URL .

61
Wang Q H, Li W, Liu S Y et al., 2015. A study on the fire environment of forest fire in Kunming Area. Acta Agriculturae Universitatis Jiangxiensis, 37(1): 108-113. (in Chinese)

62
Wang Q H, Xiao H J, Li S Y et al., 2016. Retrogressive study and analysis of the burning features of the shrubs in the fire taking place on 29 March, 2006, in Anning, Yunnan. Journal of Safety and Environment, 16(1): 138-141. (in Chinese)

63
Zhang Y T, Duan X, Li J F, 1994. The partition in the forest conflagration and climate in the middle of Yunnan Province. Journal of Southwest Forestry College, 14(3): 172-176. (in Chinese)

64
Zhao F, Shu L, Tiao X et al., 2009. Change trends of forest fire danger in Yunnan Province in 1957-2007. Chinese Journal of Ecology, 28(11): 2333-2338. (in Chinese)

65
Zheng H, Di X, Yao S, 1994. Forest fire and control strategy in China. Journal of Natural Disasters, 3(3): 37-40. (in Chinese)

66
Zimmer H, Auld T, Hughes L et al., 2015. Fuel flammability and fire responses of juvenile canopy species in a temperate rainforest ecosystem. International Journal of Wildland Fire, 24(3): 349-360.

DOI

Outlines

/