
Journal of Geographical Sciences >
How forest gaps shaped plant diversity along an elevational gradient in Wolong National Nature Reserve?
*Corresponding author: Liu Guohua (1965-), Professor, E-mail: ghliu@rcees.ac.cn
Author: Chen Li (1989-), PhD, specialized in landscape ecology. E-mail: lichen_st@rcees.ac.cn
Received date: 2018-05-10
Accepted date: 2019-01-22
Online published: 2019-07-25
Supported by
National Key Research and Development Program of China, No.2016YFC0502102
Copyright
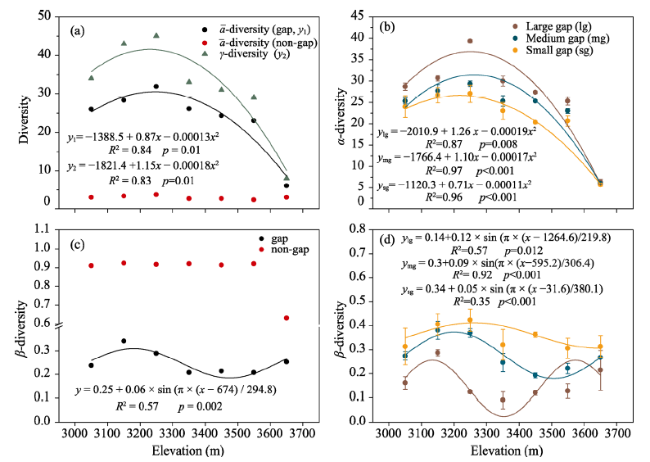
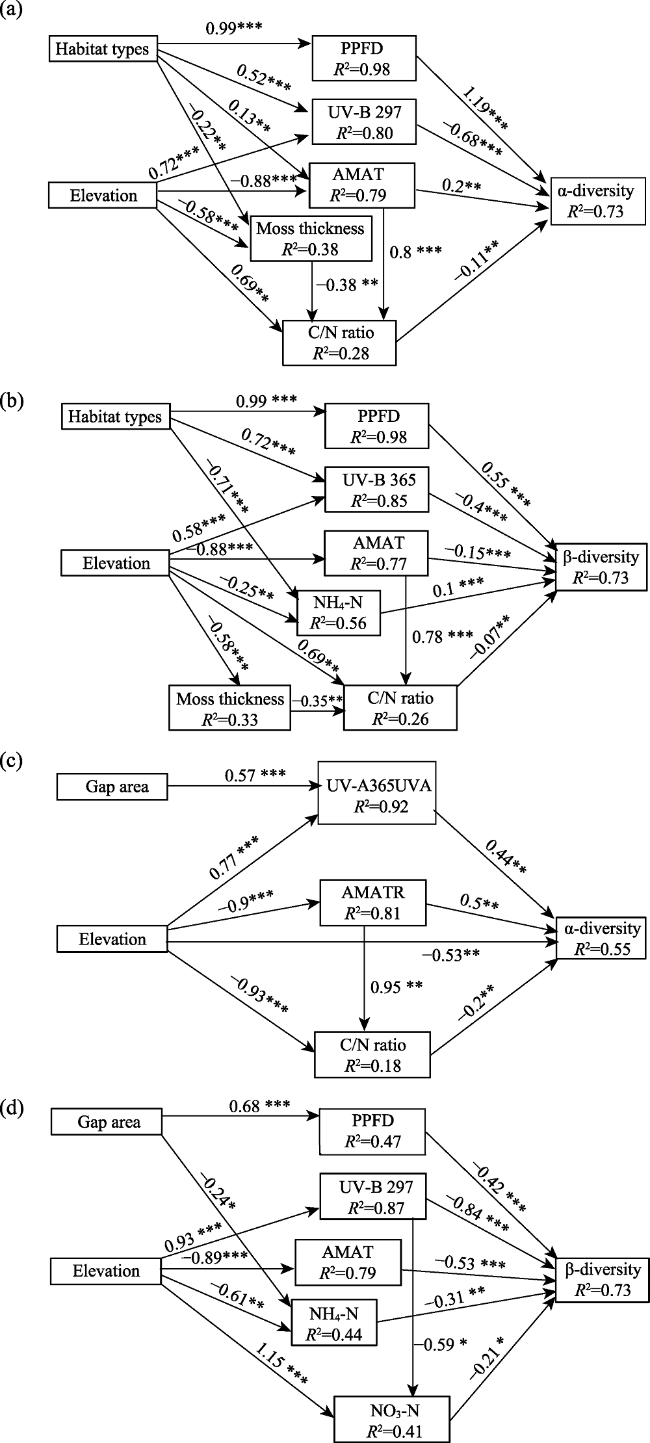
Understanding the underlying ecological processes that control plant diversity within (α-diversity) and among (β-diversity) forest gaps is important for managing natural forest ecosystems, and it is also a prerequisite for identifying the formation and maintenance mechanisms of forest plant communities. In this study, we focused on the interrelationships among habitat type (gap/non-gap plots), gap size, elevation and environmental factors, and we explored their effects on plant diversity (α-diversity and β-diversity). To do this, a total of 21 non-gap (i.e., closed canopy) plots (100 m2) and 63 gap plots, including 21 with large gaps (200-410 m2), 21 with medium gaps (100-200 m2) and 21 with small gaps (38.5- 100 m2),were selected along an elevational gradient in a subalpine coniferous forest of southwestern China. Using structural equation models (SEMs), we analyzed how forest gaps affected plant diversity (α-diversity and β-diversity) along an elevational gradient. The results showed that (1) as elevation increased, unimodal patterns of α-diversity were found in different-sized gaps, and β-diversity showed a consistent sinusoidal function pattern in different-sized gaps. The gap size was positively related to α-diversity, but this effect disappeared above 3500 masl. Moreover, the patterns of α-diversity and β-diversity in non-gap plots were irregular along the elevational gradient. (2) SEMs demonstrated that many environmental factors, such as the annual mean air temperature (AMAT), ultraviolet-A radiation (365 nm, UV-A365), ultraviolet-B1 radiation (297 nm, UV-B297), moss thickness (MT), soil carbon/nitrogen ratio (C/N ratio), NH4-N and NO3-N, were significantly affected by elevation, which then affected α-diversity and β-diversity. The photosynthetic photon flux density (PPFD), UV-A365 and UV-B297 were significantly higher in plots with forest gaps than in the non-gap plots. Moreover, the PPFD and UV-A365 were positively and directly affected by gap size. Surprisingly, except for the NH4-N and the C/N ratios, the below-ground environmental factors showed little or no relationships with forest gaps. All of these effects contributed to plant diversity. Overall, the above-ground environmental factors were more sensitive to gap-forming disturbances than the below-ground environmental factors, which affected α-diversity and β-diversity. The predicted pathway in the SEMs of the elevational effects on α-diversity and β-diversity was relatively complicated compared with the effects of forest gaps. These results can provide valuable insights into the underlying mechanisms driving the diversity-habitat relationship in the subalpine coniferous forests of southwestern China.
CHEN Li , HAN Wangya , LIU Dan , LIU Guohua . How forest gaps shaped plant diversity along an elevational gradient in Wolong National Nature Reserve?[J]. Journal of Geographical Sciences, 2019 , 29(7) : 1081 -1097 . DOI: 10.1007/s11442-019-1646-6
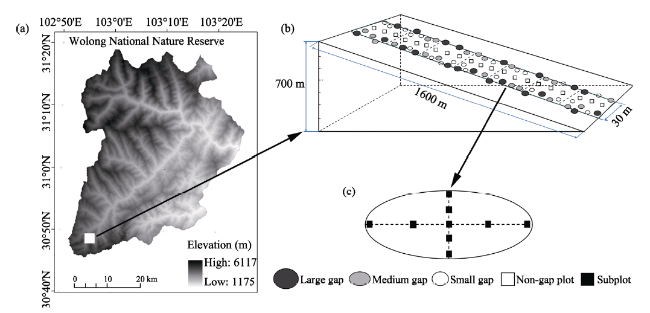
Figure 1 Diagram showing the information about location and topography (a), sampling pots (b) and subplots (c) in the Wolong National Nature Reserve in southwest China. In panel b, each elevation interval contains three plots of each category. Panel c illustrates how the nine subplots were distributed within a plot. |
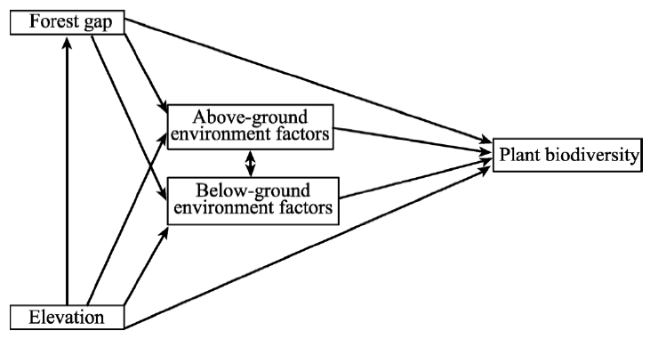
Figure 2 Conceptual model used to test the link among forest gaps (gap/non-gap plots and gap sizes), elevation, environmental factors (above- and below-ground environmental factors) and plant diversity (α-diversity and β-diversity) |
Table 1 One-way ANOVA results comparing the effects of habitat type, gap size and elevation. F and P values are derived from ANOVA. |
| Variables | Habitat types N=84 | Elevation (all plots), N=84 | Gap size N=63 | Elevation (gaps), N=63 |
|---|---|---|---|---|
| Above-ground environmental factors | ||||
| Annual mean air temperature (℃) | 1.34 | 47.07*** | 0.115 | 36.42*** |
| PPFD (μ mol m-2 s-1) | 3771.46*** | 0.02 | 37.41*** | 0.576 |
| UV-A365 (μ W cm-2) | 91.30*** | 5.52*** | 20.43*** | 12.73*** |
| UV-B297 (μ W cm-2) | 30.50*** | 15.78*** | 1.00 | 144.94*** |
| UV-B254 (μ W cm-2) | 78.16*** | 6.78*** | 12.044*** | 21.503*** |
| Moss thickness (cm) | 4.2* | 6.81*** | 0.876 | 4.74*** |
| Below-ground environmental factors | ||||
| Annual mean soil temperature (℃) | 1.02 | 285.51*** | 0.03 | 314.76*** |
| Soil water content (%) | 0.17 | 10.80*** | 0.03 | 13.96*** |
| Soil pH | 1.83 | 3.45** | 0.93 | 3.65** |
| Soil total carbon (%) | 3.18 | 17.33*** | 2.83 | 9.87*** |
| Soil total nitrogen (%) | 7.84** | 38.77*** | 2.63 | 37.38*** |
| Soil total sulfur (%) | 5.83*** | 2.64* | 5.60*** | 3.56*** |
| Carbon/nitrogen ratio | 1.94 | 2.40* | 0.35 | 1.64 |
| NH4-N (mg kg-1) | 8.20*** | 1.71 | 2.47 | 11.82*** |
| NO3- N (mg kg-1) | 3.64* | 5.71* | 0.33 | 18.06*** |
***p<0.001, **p<0.01, *p<0.05 |
Table 2 Pearson correlation results between environmental factors (above- and below-ground environmental factors) and diversity (α-diversity and β-diversity) |
| Above-ground environment factors | ||||||||||
|---|---|---|---|---|---|---|---|---|---|---|
| PPFD | UV-A365 | UV-B297 | UV-B254 | MT | ||||||
| All plots (N=84) | ||||||||||
| α-diversity | 0.81*** | 0.43*** | 0.02 | 0.39*** | 0.03 | |||||
| β-diversity | -0.944*** | -0.83*** | -0.57*** | -0.79*** | -0.35** | |||||
| Gaps (N=63) | ||||||||||
| α-diversity | 0.44*** | -0.34*** | -0.72*** | -0.36*** | 0.28** | |||||
| β-diversity | -0.54*** | -0.61*** | -0.3** | -0.54*** | 0.14 | |||||
| Below-ground environment factors | ||||||||||
| AMST | pH | SWC | STC | STN | C/N ratio | NH4-N | NO3-N | STS | ||
| All plots (N=84) | ||||||||||
| α-diversity | 0.44*** | 0.14 | -0.1 | 0.38*** | 0.55*** | 0.04 | -0.51*** | -0.003 | -0.09 | |
| β-diversity | 0.01 | -0.1 | 0.07 | -0.2 | -0.23** | -0.25** | 0.74*** | -0.25** | 0.17 | |
| Gaps (N=63) | ||||||||||
| α-diversity | 0.653*** | 0.03 | -0.13 | 0.38** | 0.59*** | -0.14 | 0.21 | -0.29** | 0.21 | |
| β-diversity | 0.224 | 0.12 | 0.15 | -0.13 | 0.02 | -0.13 | 0.05 | -0.25** | -0.22 | |
***p<0.001, **p<0.01, *p<0.05 |
Table 3 Values of the fit indices of the four structural equation models for α-diversity and β-diversity in a subalpine coniferous forest (For the information associated with models a, b, c, and d, see Figure 3) |
| Models | Model fit indices | ||||||
|---|---|---|---|---|---|---|---|
| χ2 | DF | p | RMSEA | GFI | CFI | AIC | |
| a | 3.869 | 8 | 0.869 | <0.001 | 0.988 | 1 | 59.869 |
| b | 9.609 | 13 | 0.726 | <0.001 | 0.974 | 1 | 73.609 |
| c | 0.216 | 3 | 0.975 | <0.001 | 0.99 | 1 | 36.216 |
| d | 10.119 | 14 | 0.753 | <0.001 | 0.959 | 1 | 54.119 |
| Criterion | - | - | >0.05 | <0.05 | >0.9 | >0.9 | Lowest |
Figure 3 Nonlinear fitting results of α (a, b), β (c, d), and γ (a) diversity in non-gap plots or different-sized gaps along the elevation gradient with the mean α in different-sized gaps at the same elevation interval |
Figure 4 Best-fitting structural equation models. Four models are presented in relation to the four aspects of forest gaps (gap/non-gap and gap area) and elevational effects on diversity (α-diversity and β-diversity). Positive and negative pathways are indicated by black and gray lines, respectively. Arrow thickness is scaled to illustrate the relative strength of effects, and significant coefficients are indicated with asterisks (* p < 0.05; ** p< 0.01; *** p< 0.001). The coefficient of determination (R2) is shown in the black box for all response variables. The independent variable, as a predictor, is the habitat type coded as plots with gaps = 2 and non-gap plots = 1; thus, in the SEMs, the habitat type is an ordered categorical variable. |
Table 4 Standardized total effect, indirect effect and direct effect of predictor variables on α-diversity and β-diversity for the best SEMs, as shown in Figure 3 |
| All plots (N=84) | |||||||||
|---|---|---|---|---|---|---|---|---|---|
| Elevation | Habitat types | AMAT | PPFD | UV-B297 | UV-A365 | C/N ratio | MT | NH4-N | |
| Total effect | |||||||||
| α-diversity | -0.7 | 0.77 | 0.13 | 1.13 | -0.68 | — | -0.11 | 0.04 | — |
| β-diversity | -0.14 | -0.9 | -0.21 | -0.55 | — | -0.4 | -0.07 | 0.03 | 0.1 |
| Direct effect | |||||||||
| α-diversity | 0 | 0 | 0.21 | 1.13 | -0.68 | — | -0.11 | 0 | — |
| β-diversity | 0 | 0 | -0.15 | -0.55 | — | -0.4 | -0.07 | 0 | 0.1 |
| Indirect effect | |||||||||
| α-diversity | -0.7 | 0.77 | -0.09 | 0 | 0 | — | 0 | 0.04 | — |
| β-diversity | -0.14 | -0.9 | -0.06 | 0 | — | 0 | -0.07 | 0.03 | 0 |
| Gaps (N=63) | |||||||||
| Elevation | Gap area | AMAT | PPFD | UV-A365 | UV-B297 | C/N ratio | NH4-N | NO3-N | |
| Total effect | |||||||||
| α-diversity | -0.66 | 0.25 | 0.31 | — | 0.44 | — | -0.2 | — | — |
| β-diversity | -0.26 | -0.21 | -0.53 | -0.42 | — | -0.72 | — | -0.31 | -0.21 |
| Direct effect | |||||||||
| α-diversity | -0.53 | 0 | 0.5 | — | 0.44 | — | -0.2 | — | — |
| β-diversity | 0 | 0 | -0.53 | -0.42 | — | -0.84 | — | -0.31 | -0.21 |
| Indirect effect | |||||||||
| α-diversity | -0.13 | 0.25 | -0.19 | — | 0 | — | 0 | — | — |
| β-diversity | -0.26 | -0.21 | 0 | 0 | — | 0.12 | — | 0 | 0 |
The authors have declared that no competing interests exist.
| 1 |
|
| 2 |
|
| 3 |
|
| 4 |
|
| 5 |
|
| 6 |
|
| 7 |
|
| 8 |
|
| 9 |
|
| 10 |
|
| 11 |
|
| 12 |
|
| 13 |
|
| 14 |
|
| 15 |
|
| 16 |
|
| 17 |
|
| 18 |
|
| 19 |
|
| 20 |
|
| 21 |
|
| 22 |
|
| 23 |
|
| 24 |
|
| 25 |
|
| 26 |
|
| 27 |
|
| 28 |
|
| 29 |
|
| 30 |
|
| 31 |
|
| 32 |
|
| 33 |
|
| 34 |
|
| 35 |
|
| 36 |
|
| 37 |
|
| 38 |
|
| 39 |
|
| 40 |
|
| 41 |
|
| 42 |
|
| 43 |
|
| 44 |
|
| 45 |
|
| 46 |
|
| 47 |
|
| 48 |
|
| 49 |
|
| 50 |
|
| 51 |
|
| 52 |
|
| 53 |
|
| 54 |
|
| 55 |
|
| 56 |
|
| 57 |
|
/
| 〈 |
|
〉 |