Measuring the area of cultivated land reclaimed from rural settlements using an unmanned aerial vehicle

  • YANG Cunjian , 1 ,
  • XU Guanghong 2 ,
  • LI Hechao 3 ,
  • YANG Defei 4 ,
  • HUANG He 5 ,
  • NI Jing 1 ,
  • LI Xiao 6 ,
  • XIANG Xiao 3
Expand
  • 1. Research Center of Remote Sensing and Geographic Information System Application, Key Laboratory of Land Resources Evaluation and Monitoring in Southwest, Ministry of Education, Sichuan Normal University, Chengdu 610068, China
  • 2. Chongqing University of Posts and Telecommunications, Chongqing 400065, China
  • 3. Sichuan Land Consolidation and Rehabilitation Center, Chengdu 610045, China
  • 4. College of Landscape Architecture, Nanjing Forestry University, Nanjing 210037, China
  • 5. College of Fundamental Education, Sichuan Normal University, Chengdu 610068, China
  • 6. Sichuan Land Survey and Planning Research Institute, Chengdu 610045, China

Author: Yang Cunjian (1967-), PhD, specialized in GIS and remote sensing. E-mail:

Received date: 2018-09-18

  Accepted date: 2019-01-10

  Online published: 2019-04-19

Supported by

National Key Research and Development Program of China, No.2018YFB0505303

Science and Technology Support Project of China, No.2014BAL01804

Science and Technology Project of Sichuan Provincial Department of Education, No.11ZA098

Copyright

Journal of Geographical Sciences, All Rights Reserved

Abstract

Investigating and monitoring the area of cultivated land reclaimed from rural settlements is important to optimize rural land use and understand spatial patterns. Measuring cultivated land area is costly and inefficient, however, as this land use type is often widely dispersed and scattered. A new method is therefore explored in this study that utilizes a Phantom2 Vision + (P2V), one kind of Dajiang (DJI) unmanned aerial vehicle (UAV). The method proposed here includes generating rural settlement images using a P2V UAV, subsequently correcting them using a camera lens model, matching them with geo-coded high resolution alternatives, mosaicking them, measuring the area of cultivated land reclaimed from rural settlements, evaluating measurement accuracy, and analyzing overall efficiency. The results of this study show that use of a P2V UAV is reasonable in price, less than 8000 yuan (RMB), and that this method is able to measure cultivated land area reclaimed from rural settlements with 99% accuracy. This method is therefore low cost, highly efficient, and low risk, as well as being easy to learn and use. This UAV-based approach is also likely to be easily popularized and be particularly useful both for application across plains and flats as well as over mountains and hills. The method proposed in this study is also likely to prove beneficial for monitoring and managing rural land use and future consolidation.

Cite this article

YANG Cunjian , XU Guanghong , LI Hechao , YANG Defei , HUANG He , NI Jing , LI Xiao , XIANG Xiao . Measuring the area of cultivated land reclaimed from rural settlements using an unmanned aerial vehicle[J]. Journal of Geographical Sciences, 2019 , 29(5) : 846 -860 . DOI: 10.1007/s11442-019-1632-z

1 Introduction

Land is an important resource for both economic growth and social development. This means that both the quantity and quality of cultivated land are important factors for ensuring food safety within China. Rural settlements are defined as residential areas within rural environments; areas where people have settled down and developed a close relationship with agriculture, both geographically and functionally (Li and Chen, 1994; Zhao et al., 2006). In tandem with rapid industrialization and urbanization, the area of urban construction land has also been rapidly increasing within P.R. of China as towns and cities have expanded. Large numbers of farmers have been attracted to find work within cities and towns for financial reasons, often leaving family members including parents and children behind in their home towns. These workers may only return to participate in festivals with their families, and some of them even leave their houses in their hometowns empty. As part of the Fifth Plenary Session of the 16th Central Committee (2002), the Communist Party of China (CPC) proposed that such countryside regions should be strongly developed in order to enhance production, enrich life, civilize the countryside, clean and tidy villages, and democratize management. Rural residential land consolidation is therefore one of the most important components of new countryside construction (Liu et al., 2010). A rural revitalization strategy was therefore proposed at the 19th CPC National Congress (2017) with the aim of realizing modern agriculture and countryside management by 2035. Similarly, it is aimed that fully revitalized countryside encompassing prosperous agriculture, beautiful villages, and a rich life for farmers will be realized by 2050 (Liu, 2018). Planning for major functional zones was issued on June 8th, 2011. On the basis of resource carrying capacities, the environment, current development intensity and future potential as well as projected population distribution, economic arrangements, national land use and urbanization patterns, land space within China was divided into a series of optimized, prioritized, restricted, and prohibited development zones (Fan, 2015). It is intended that national space development patterns in concert with population, economy, resources, and environmental harmonization will be gradually achieved by implementing major functional planning zones across China as well as by identifying major functional positions and development directions, controlling the intensity of development, normalizing its order, and perfecting policy. It is therefore of great importance to optimize land use patterns and efficiency nationally.
Industrial enterprises have been centralized within China since the 1990s in order to promote urbanization, industrialization, and agricultural modernization. These facilities have therefore been sited within industrial gardens and farmers have become centralized within cities, towns, and large settlements all over the country. An urban and rural construction land increase-decrease hook policy was created as a result and has subsequently been implemented (Zhao and Zhang, 2015). A large proportion of rural construction land has been reorganized and reclaimed as a result of this policy; it is intended that lands of similar area will be used for urban construction so that the overall proportions of urban and rural construction land will remain unchanged, as will the quantity and quality of cultivated land. This also means that the eventual distribution pattern of urban and rural construction land will become more rational. This is important because rural settlements are broadly distributed across China, a function of plain cultivation diameter and controlled by both topography and landforms on mountains and hills. Chinese rural settlements also vary greatly in size and constituents; those on plains tend to be composed of buildings, courtyards, and green land (Liu et al., 2018) and are generally larger than their counterparts on mountains or hills (Tan et al., 2015). A series of projects that aim to transform rural construction land into cultivated land are currently being carried out in Chinese rural areas under the auspices of the urban and rural construction land increase-decrease hook policy. Buildings within rural settlements have therefore been dismantled and have been reclaimed and converted to cultivation along with subsidiary lands. The area of cultivated land reclaimed from settlements in this context needs to be measured accurately and objectively, as this is important for both land owners and the government; rural settlement projects are distributed both broadly and sparsely within China. Measuring area is one important task within the scope of this project, but requires significant labor and cost when based on technologies such as field surveys. These results are also easily influenced by man-made factors and so injustice and corruption are also possible as a result. A new method aiming at measuring an area cheaply and objectively that leads to a fair outcome is therefore needed to meet current demands.
Satellite remote sensing (RS) images have been widely used to study land use changes in recent years. National changes within China between 2010 and 2015 were acquired using a digital interpretation method from RS images, including those collected by Landsat 8 OLI and GF-2 (Ning et al., 2018). Results based on these images suggest that the area of built-up land across China increased by 24,600 km2 over this time period while cropland decreased by 4900 km2 and woodland and grassland decreased by 16,400 km2. Unmanned Aerial Vehicle (UAV) technology has also developed rapidly in recent years and has been widely applied in land use planning (Zhang et al., 2012), for reorganizing land use (Luo et al., 2013; Ren, 2014), identifying rural land usage rights (Wang et al., 2014), detecting mountain disasters (Zhao et al., 2014), monitoring land reforms (Ji and Liu, 2014), surveying and evaluating mountain floods (Liu et al., 2014), and mapping land surface elevation changes (
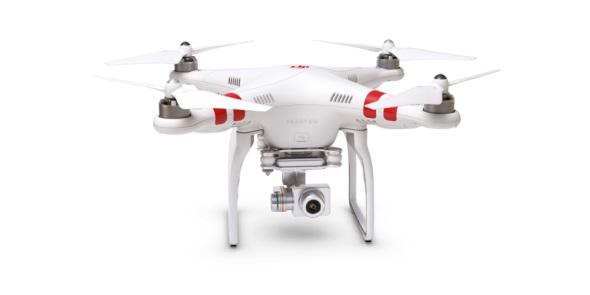
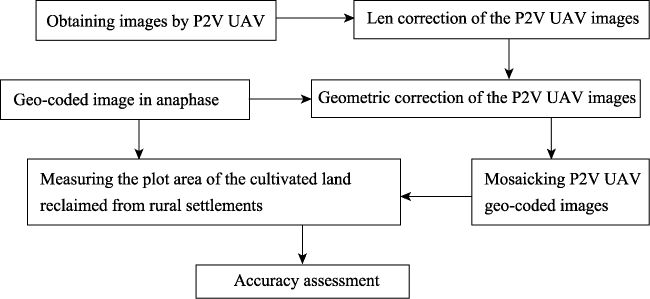
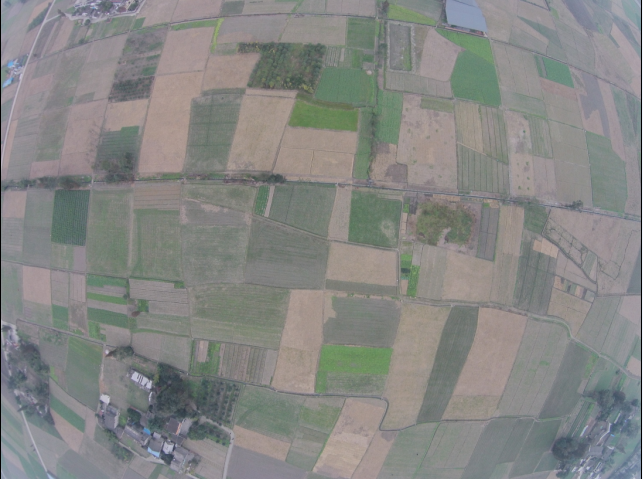
Lizarazo et al., 2016). Images obtained by UAVs also have a high level of resolution, between 5 cm and 40 cm, and so maps between 1:500 and 1:5000 can be generated. Generally, however, the price to utilize a high-quality UAV for RS exceeds several hundred thousand yuan (RMB) (Liu and Qi, 2014). In terms of types, UAVs are divided into large professional and small consumer models; the former are characteristically vulnerable to weather conditions and require professional manipulation and access to airspace (Zhang et al., 2018), while small consumer UAVs tend to be cheaper. Small consumer UAVs, especially the PHANTOM 2 VISION+ (P2V), one Dajiang (DJI) model, have already been used to monitor land consolidation and measure areas of cultivated land reclaimed from rural construction. This approach has potential because the price of a P2V UAV is less than 8000 yuan; it remains unclear, however, whether this model can be used to accurately and effectively measure the area of cultivated land reclaimed from rural construction. As discussed, images obtained by large professional UAVs are high resolution but generate huge data volumes which necessitate the use of expensive aerial photogrammetric software such as pixel grid and Modern Aerial Photogrammetry-Automatic Triangulation (MAP-AT) to realize precise Position and Orientation System (POS) data for producing ortho-images (Wang et al., 2014). Obtaining POS data from high resolution images also requires the use of high precision GPS. The use of a P2V UAV without high precision GPS cannot generate high precision POS data; this means that a method to produce ortho-images from P2V UAV images and how cultivated land area can be measured requires further investigation.

2 Study area and data

The study area assessed here is located in Qinliu Town within Xindu District, Chengdu City, Sichuan Province of China. This region is located inland in the southwest of the country, in the upstream part of the Yangtze River; Sichuan Province is a large and important constituent of the Chinese economy and is also notable for culture, industry, agriculture, science and technology, education, and tourism. This province encompasses about 486,000 km2. The city of Chengdu is a center for science and technology, trade, business, and finance distinct from the provincial capital of Sichuan, and is also a hub for transportation and communication in the southwest of China. Encompassing an area of approximately 14,600 km2, the city of Chengdu is located in the west of the Sichuan Basin and in the hinterland of the Chengdu Plain and so experiences a subtropical monsoonal moist climate. Chengdu has always enjoyed the reputation of Land of Abundance. This region is therefore an experimental district for comprehensive complementary urban and rural coordination reform. Xindu District is located within the north of Chengdu and encompasses an area of approximately 497 km2; within this area, Qinliu Town is positioned within the northwest of Xindu District. The area of this town is approximately 33 km2; Qinliu Town is located 30 km and 35 km from Xindu and Chengdu built-up areas, respectively. This region was chosen as the study area for this project because it comprises a typical agricultural town on the Chengdu Plain, a zone where the hook project has been in place for several years. Large numbers of farmers have demolished old buildings and built new houses within a substantial new settlement in this area. It is the case that older buildings tended to occupy more land area than their newer counterparts and so areas used for the former have often reclaimed and converted into cultivated land. The area of rural construction land has therefore decreased over time in this region while the area of cultivated land has increased. This means that the rural construction land index derived from rural construction land consolidation can be used as an urban construction land index. It is also the case that farmers can earn a certain amount of money based on their rural construction land index savings; a balance between cultivated and construction land has therefore been maintained across urban and rural areas. It is necessary to accurately measure the area occupied by older buildings that has then been reclaimed and converted to cultivated land. Thus, land use data or a map as well as a land use planning map and geo-coded RS images in prophase which document older buildings can also be captured and then used to determine which have been demolished and whether land has been converted for cultivation via comparisons with anaphase images. Geo-coded images at high resolution (0.6 m) obtained before reclamation were used for reference in this analysis.
A P2V UAV was used in this analysis to collect images (Figure 1). This model, the P2V, is produced by SZ DJI TECHNOLOGY CO.LTD and provides the capability to capture full High Definition (HD) video and pictures. A P2V UAV is a quad-copter that includes multi-rotor flight control technology, an intelligent GPS-based autopilot system, an integrated 14 megapixel HD camera, and an iOS app for full camera control. The system is also fully remote controlled; the P2V UAV returns to its take-off position and lands if it loses remote control signal. This system is stable, easy to fly, and boasts agile performance; features of the iOS App include low latency video monitoring downlink, full remote camera control, and wireless synchronization. P2V technology parameters are summarized in Table 1.
Figure 1 The P2V UAV used in this study
Table 1 P2V technology parameters
Parameters Values
UAV length 350 mm
Wing span 420 mm
Take-off and landing mode Vertical
Maximum take-off weight 1,400 g
Maximum flight speed 15 m/s
Maximum ascending speed/descending speed Ascending: 6 m/s; descending: 2 m/s
Maximum duration of flight 25 minutes
Power source Electricity
Material Plastics
Working environmental temperature Between zero and 40℃
Outdoor communication distance Between 500 m and 700 m
Controllable rotation range of the cloud platform Between -90° and 0°
Precise angle control of the cloud platform ± 0.03°

3 Method

A six-stage P2V UAV-based method is proposed here for measuring the area of cultivated land reclaimed from rural settlements (Figure 2):
Figure 2 Schematic method for measuring plot area using P2V UAV images
• Images are collected by the P2V UAV;
• Images are lens corrected;
• Images are geometrically corrected;
• Images are geo-coded and mosaicked;
• The plot area of cultivated land reclaimed from rural settlements is measured, and;
• Overall accuracy is assessed.

3.1 P2V UAV images

A series of P2V UAV images were obtained in 2015 around Qinliu Town in Xindu District. The flight battery, range extender, and remote controller were initially fully charged and propellers were screwed onto the four motors. The circular power button was then pressed once, then again and held for two seconds to power the flight battery and the range extender/linking camera was also powered up. Normal operation was denoted by the system indicator blinking green. The mobile device was then connected to the P2V UAV via a Wi-Fi network, and the camera icon was tapped in the DJI VISION App to enable a live view. The P2V system was then placed on flat ground in an open space with its rear LED flight indicators facing the operator, and the motors were started by pulling both control sticks down to the bottom corners and then releasing them once started. The left stick was slowly pushed up to allow the P2V system to take off; when an altitude of 150 m was reached, the DJI VISION App was used to control the UAV and to vertically capture a ground image. The right stick was slowly pushed forward to move the system in the same direction and another image was captured. Once images of the right area were completed, the right stick was slowly pushed to the left to move the P2V in this direction and to capture images of this region. Once all images had been captured, the P2V UAV was moved to an overhead position and the left stick was pulled down to lower the system until it touched the ground. Subsequent to landing, both sticks were pulled to the bottom corners to stop the motors, and the flight battery, remote controller, and range extender were all powered down. The fly line used in this analysis is shown in Figure 3.

3.2 Image lens correction

A fish eye camera was mounted on the P2V UAV system in order to capture wide field images, so-called fish eye images. A deformation is present in each fish eye image, however, and so resolution declines from the center to the edge. In contrast, away from the center of each fish eye image, deformation increases. This means that each fish eye image resembles a spherical surface which must be corrected before it can be used. The fish lens correction function in the software Adobe Photoshop CS6 extender was therefore used to geometrically correct all selected images by using the parameters such DJI as the fish eye camera producer, P2V FC2000 as the camera type, and P2V FC2000 as the lens type. These corrected images were then used for further study.

3.3 Image geometric correction

Geo-coded images documenting old buildings with a resolution of 0.6 m were used here for reference. It was found that old buildings were demolished, their land was reclaimed and converted into cultivation land with wheat and rape on by comparing the geo-coded images with P2V UAV images. Indeed, a number of obvious ground features including roads, rivers, and buildings could be located on both geo-coded and P2V UAV images; these comparisons enabled use of a polynomial geometric model to correct P2V UAV images to obtain subsequent ortho-images as the image area is flat. A number of ground control markers were then identified for analysis including cross and turn points and obvious points of roads, rivers, and settlements; these were selected and distributed uniformly on both geo-coded images and P2V UAV images following fish lens correction. The polynomial geometric correction model shown in Equation (1) was then used to correct each P2V UAV image. A nearest neighbor sampling was used to get a new value for each P2V UAV image, as follows:
$\left( \begin{align}& X=\sum\limits_{i=0}^{2}{\sum\limits_{j=0}^{2-i}{{}}{{a}_{i{{j}_{{}}}}}{{x}^{i}}{{y}^{j}}} \\& Y=\sum\limits_{i=0}^{2}{\sum\limits_{j=0}^{2-i}{{{b}_{ij}}}}{{x}^{i}}{{y}^{j}} \\ \end{align} \right.$ (1)
where X and Y denote the coordinate values of pixels on the X and Y axes of the reference image, respectively, while x and y denote coordinate values of pixels on the X and Y axes of the P2V UAV image.
A selection of RS image processing software packages (e.g., ERDAS, ENVI, or PCI) could then be used to complete the task. Thus, P2V UAV geo-coded images were obtained by geometrically correcting all images subsequent to fish lens correction using the polynomial geometric model in Equation (1), numerous ground control point pairs, and the nearest sampling method.

3.4 Mosaicking geo-coded images

A range of RS image processing software packages (e.g., PCI, ERDAS, or ENVI) were used to mosaic neighboring P2V UAV geo-coded images as there was a lot of overlay between adjacent ones. A geo-coded image was initially selected for this step and then an output mosaic file of suitable extent was created. A mosaic area was then identified within the P2V UAV geo-coded image and another was mosaicked onto the output file. Finally, another adjacent P2V UAV geo-coded image was then selected, its mosaic area identified, and added to the output file. All adjacent P2V UAV geo-coded images were mosaicked onto the output image file, and a large image extent was generated for further study. The border between two adjacent mosaic P2V UAV geo-coded images was located in the region with obvious features and without deformation when a mosaic area was selected in an image and the outside was avoided in each case for use as a mosaic area.

3.5 Measuring cultivated land area reclaimed from rural settlements

A reference image and its mosaic P2V UAV counterpart were simultaneously displayed using the software ARCGIS. Settlements were identified on the reference image in each case and then corresponding locations on the mosaic P2V UAV image were identified by overlaying the mosaic captured with the drone versus the reference. This enabled the determination of demolished buildings by comparing reference image with each mosaic counterpart. Similarly, demolished building plots and subsidiary land such as green land and courtyard that had been reclaimed and converted to cultivated land were visually interpreted and manually digitalized by comparing settlements on the reference image with those on the mosaic. On this basis, a geographic data base of plots where buildings and their subsidiaries had been reclaimed and changed into cultivated land was created, again using the software the ARCGIS, and the area of each plot was then calculated.

3.6 Accuracy

In order to assess the accuracy of the method proposed in this study, five plots with obvious boundaries on both the mosaic P2V UAV image and the reference were visually interpreted and manually digitalized using the software ARCGIS. Areas in each case were respectively calculated with the one derived from the reference image assumed to be true. Accuracies in area estimation were assessed using Equations (2) and (3), as follows:
Error = 100 × (MJUAV - MJREF)/MJREF % (2)
Accuracy = 100% - | Error | (3)
where MJUAV was calculated based on the mosaic P2V UAV image while MJREF was calculated based on the reference.

4 Results

4.1 Mosaic P2V UAV images

The results assembled here show that more than 40 images can be captured during one flight, encompassing an area of approximately 0.6 km2. It is possible for a P2V UAV system to remain in-flight for at most 25 minutes once the battery is fully recharged. The flying diameter of this system is also about 500 m because the functional distance of the range extender and remote controller encompasses this range. The on-board camera within this system is a fish eye incorporating a lens with a 180° field-of-view that can capture a large ground image. The size of one image taken by this camera is 4384 pixels × 3288 lines (Figure 4). A series of fish eye images were selected for further study on the basis of their quality and location; the fore-and-aft overlap between these was between 30% and 50%, while side overlap was between 15% and 50%.
Figure 4 One image captured by the P2V UAV system
Geometric deformation of fish eye images was removed using the extender option in the software Adobe Photoshop CS6. These corrected images resemble normal ones from an ordinary camera, without deformation (Figure 5). The fringe of each fish eye image was clipped away.
Figure 5 Example of a lens corrected DJI UAV image
Ortho-images with a resolution of 10 cm were obtained using a polynomial geometric correction model, the nearest neighbor sampling method, and a geo-coded image with a 0.6 m resolution for reference. The geometric correction error was less than two pixels in each case while the number of P2V UAV geo-coded images covering one settlement increases along with settlement size under definite resolution. The resolution of each P2V UAV image also depends on flight height.
Mosaic P2V UAV images were obtained using standard image software packages (e.g., PCI, ENVI, and ERDAS). Mosaic error in these cases was no more than 0.6 cm when a geo-image with a 0.6 cm resolution was used for reference. This mosaic error was reduced as the resolution of the reference image increases. A mosaic P2V UAV image is shown as Figure 6; these images encompass areas greater than 0.5 km2, including areas of consolidated land. Each mosaic P2V UAV image was then further inspected with emphasis on the edge between the two adjacent geo-coded examples. Results show that mosaic edges between two adjacent P2V UAV geo-coded images are matched well, especially matching line features in mosaic UAV cases. Inspecting and measuring distances shows that the line feature edge matching error was less than one pixel here; examples also show that ground features within mosaic P2V UAV images match well with those in reference images when mosaics were overlain onto reference images. Mosaic error depends on geometric correction error which, in turn, depends on reference image resolution.
Figure 6 A mosaic series of UAV images

4.2 Cultivated land reclaimed from rural settlements

Land consolidation results and rural settlement changes can be determined by comparing mosaic P2V UAV images in anaphase with reference images in prophase. Thus, plots where old buildings had been demolished and land was reclaimed and converted for cultivation were accurately delineated from mosaic P2V UAV images at a 10 cm resolution via comparisons with reference images (Figures 7-9). The area of each plot was then calculated using the software ARCGIS (Table 2).
Table 2 Areas of cultivated land plots following reclamation (m2)
Plot number No.1 No.2 No.3 No.4
Area 1,281.37 4,184.35 709.31 573.12
One of the images assembled in this study (Figure 7) clearly shows that rape had already been planted on some reclaimed cultivated land but that this crop did not grow as well as on originally cultivated land because of lower soil fertility. Original cultivated land quality is better than reclaimed cultivated land across the study area; this implies that the quality of cultivated land reclaimed from settlements requires improvement within this region. Data also show that plots are sparsely distributed and tend to be small in size across the field area, generally between 500 m2 and 5000 m2.
Figure 7 Cultivated land plot 1 following reclamation
Figure 8 Cultivated land plot 2 following reclamation
Figure 9 Cultivated land plot 3 and plot 4 following reclamation

4.3 Accuracy and efficiency

As discussed, area error was calculated using Equations (2) and (3) (Table 3).
Table 3 Mosaic P2V UAV image plot errors (m2)
Plot No. Reference image Mosaic P2V UAV image Difference Error(%) Accuracy (%)
Plot 5 1,638.84 1,645.25 6.41 0.391 99.609
Plot 4 1,378.08 1,375.24 -2.84 -0.206 99.794
Plot 1 1,250.38 1,242.64 -7.74 -0.619 99.381
Plot 2 1,138.4 1,148.75 10.35 0.901 99.099
Plot 3 758.95 759.9 0.95 0.125 99.875
Total 6,164.65 6,171.78 7.13 0.116 99.884
The data presented in Table 3 show that the largest difference seen within plot 2 was about 10.35 m2 while the smallest difference seen within plot 3 was 0.95 m2. At the same time (Table 3), the largest error seen within plot 2 was 0.901% and the smallest was 0.125%. Plot area errors were never greater than 1% throughout this analysis; in other words, the accuracy achieved by the P2V UAV approach was always greater than 99%. Total accuracy also improved as plot area increased (Table 3).
Experience shows that 40 settlement images in the Chengdu Plain could be captured in one day. Two days were then needed for one person to process these data and obtain results such a map, table, and report. A total of four person working days were therefore required to complete the plot area measurement task and to determine the area of cultivated land reclaimed from 40 settlements.

5 Discussion and conclusions

5.1 Discussion

The outcomes of this study show that a P2V UAV can easily take-off on an area of open ground around 9 m2 when no obstacles such as trees or buildings are present. This system can also fly below clouds as the height necessary to capture useable images is generally no more than 200 m above ground. A P2V UAV system cannot fly during weather when the wind velocity is above grade four or when snow, rain, or heavy fog are seen. This system also cannot be used to capture images at night. We have been able to show that it is easy to learn P2V UAV operation to capture images; the approach proposed here does not require expensive hardware and software in contrast to currently utilized methods that deploy professional UAVs. Indeed, as the cost of a P2V UAV is no more than 8000 yuan, this system will be affordable for many researchers and institutes. The method proposed here requires just a common microcomputer and widely available software such as Adobe Photoshop CS6 extender as well as image processing approaches that are easy to learn and use. A high resolution geo-coded image or digital map obtained before land consolidation is important for reference and ground control points must be easily identifiable in order to save time measuring them on the ground. The method proposed here generates a mosaic P2V UAV ortho-image at 10 cm resolution covering a ground area of around 0.6 km2. Resultant images clearly document crops, trees, bamboo, streams, roads, buildings, field ridges, and courtyards. The boundaries between cultivated land and settlements can be easily visually and accurately interpreted and delineated, and data show that resolution increases as flight height decreases. The maximum safe flying height of a P2V UAV is no more than 200 m, although optimal height is between 100 m and 200 m above ground. An image with a resolution of about 10 cm can be obtained when a P2V UAV flies about 200 m above ground; this image will cover an area of about 140,000 m2, larger than a small settlement. An optimal image area is about 70,000 m2, however, encompassing about 50% in total.
The resolution of one UAV image is generally higher than aerial photographs and satellite images. It is also the case that UAV-based RS tends to be more flexible than aerial photography and, again, more adaptable than satellite-based RS approaches. Similarly, the costs of P2V UAV RS are lower than both aerial photography and satellite approaches; the method proposed here also enables numerous sparse regions separated by several square kilometers to be surveyed at high resolution.
Rural settlements across our field area were surveyed in this study. The approach we propose enabled plots of cultivated land reclaimed from rural settlements to be accurately identified and delineated; we were also able to measure the area of these plots using a P2V UAV approach. This new approach has a number of advantages compared to conventional field survey methods, including lower cost and higher efficiency and precision of GIS data results alongside more objective high resolution images. The plot size assessed here ranged between 573.12 m2 and 1281.37 m2, no more than the area encompassed by one P2V UAV image. This meant that we were able to only utilize settlement regions in mosaic images, so that the efficiency was enhanced. The number of images used depended on the size of settlements; a single P2V UAV image is sufficient in small cases, saving a great deal of time. The method proposed here is especially suitable for obtaining images of sparsely distributed small settlements or plots.
Determining plot area is very important for land owners and the government. In such cases, a land owner will be encouraged to build a new house in a large nearby settlement. The land area of this new building will be calculated and cost will be granted by the government according to family size. A land owner might also be eligible for other allowances depending on the difference between old house land area and that of a new property. This system also means that an owner maintains any newly cultivated land. The area of rural construction land therefore decreases while the area of land under cultivation increases. An index of decreased rural construction land can be used to compensate for increased urban construction. Some families in groups living within settlements are able to keep their houses unchanged while others must demolish and create new building within a larger nearby agglomeration. This can result in the appearance of new settlements while original residential areas decrease in size. The farmers who live in new settlements must also return to cultivate original farmland which can result in increases in transportation costs and time.
It is also important to note that there are a number of limitations to the method proposed in this study. It is difficult to rapidly and automatically produce large mosaic images that encompass large areas using this method when compared to professional UAVs because of lower flying heights, shorter flight times (25 minutes), and a cheaper camera and software. Although satellite RS approaches can be used to generate images encompassing larger regions, these are also easily impacted by clouds and have resolutions no more than 35 cm. It is also difficult to produce digital terrain models using this approach (compared to professional UAVs) because P2V systems do not encapsulate a high precision GPS and no POS data are output because of less accurate internal and external image elements. The method proposed here can therefore only be used efficiently on plains, plateaus, and mountain flats or hills; this range of area applications is of considerable value, especially if high precision geo-images or thematic maps can be obtained and then used as reference images. This approach could also be used to monitor and measure land consolidation as well as for mapping land use and settlements, and investigating and monitoring crops in detail. A P2V system would provide important supplementary data when used in tandem with professional UAV RS, especially on plains, plateaus, and flats on top of mountains or hills.
Additional research in this field will emphasize the development of an automatic geometric correction model and an automatic interpretation model so that the efficiency can be improved. A more exact GPS system should also be mounted on UAVs so that more precise internal and external image elements can be obtained alongside a digital elevation model and ortho-images that can be built from pairs of images captured on hills and mountains. This technology is also unsuitable for obtaining images across large ground areas because a single picture encapsulates just 144,146 m2 and a UAV battery lasts just 25 minutes when fully recharged. It will therefore be necessary to also develop a new battery that lasts for a longer time. Insurance policies for P2V UAVs should also be issued and bought by researchers to reduce any losses caused by misplaced devices or damage to people and belongings.

5.2 Conclusions

A novel approach using a P2V UAV system is proposed in this study to measure the area of cultivated land reclaimed from rural settlements. Geo-coded images at 0.6 m resolution are used for reference; this approach boasts an area measurement accuracy higher than 99% and meets national land management requirements.
A P2V UAV system costing no more than 8000 yuan can be used to obtain land consolidation images within a given region. This approach has a number of clear advantages, including lower costs, risks, and ground take-off and air condition requirements as well as a higher level of efficiency. This system can also be easily learned; fish eye lens correction using the extender in Adobe Photoshop CS6 can be applied to remove geometric image deformations, and ortho-images with a resolution of 10 cm can be obtained using a polynomial geometric correction model, nearest neighbor sampling, and a geo-coded reference image. A P2V UAV mosaic image at 10 cm resolution can be obtained by using standard imaging software (e.g., PCI, ENVI, and ERDAS).
The results of this analysis show that land consolidation data and rural settlement changes can be easily evaluated by comparing anaphase UAV mosaic images with their prophase reference counterparts. The area of cultivated land reclaimed from rural settlements can thus be measured accurately by comparing P2V UAV mosaic images in anaphase with reference pictures in prophase using the software ARCGIS.
The plot sizes measured in this study were all between 573.12 m2 and 1,281.37 m2, no more than the area encompassed by one P2V UAV image. Data also show that the number of settlements does not decrease while original ones have become smaller over time because of land consolidation. A policy that is beneficial to the centralization of residences and the modernization of agriculture should therefore be implemented.
The method proposed in this study can be easily popularized and has a high potential application value for use on plains, plateaus, and the flats on top of mountains and hills. This approach will also prove beneficial for monitoring, managing, and controlling land use changes between settlements as well as assessing cultivated land in rural areas as settlements tend to be sparsely distributed within these regions.

The authors have declared that no competing interests exist.

[1]
Fan J, 2015. Draft of major function oriented zoning of China.Acta Geographica Sinica, 70(2): 186-201. (in Chinese)Major Function Oriented Zoning(MFOZ) is the blueprint for the future developmnt and protection pattern of China's territory, and has been raised to from major function zones planning to major function zoning strategy and major function zoning institution. From 2004 to2014, the author organized a series of research projects to compose MFOZ for the country,studied basic theory of regional function and MFOZ technical process, and proposed that space controlling zones of national and provincial scales can be divided into four types: urbanized zones, foodstuff-security zones, ecological safety zones, cultural and natural heritage zones. On this basis, major function zones of county scale should be transferred to optimized, prioritized,restricted, and prohibited zones. In this paper, a regional function identification index system comprising nine quantitative indicators(including water resources, land resources, ecological importance, ecological fragility, environment capacity, disaster risk, economic development level, population concentration and transport superiority) and one qualitative indicator of strategic choice is developed. Based on the single index evaluation, comprehensive evaluation using regional function suitability evaluation index is conducted, aiming at testing several key parameters including lower limit of protection zones and upper limit of development zones at the provincial level. In addition, a planning-oriented zoning method of major function zones is also discussed, which has brought the first MFOZ planning in China. According to the MFOZ caliber, it is forecasted that national spatial development intensity will rise from 3.48% in 2010 to 3.91% in 2020. Furthermore, according to caliber of the provincial integrated MFOZ planning, the area of optimized, prioritized and restricted zones accounts for 1.48%, 13.60%and 84.92%, respectively, and that of urbanized, foodstuff-security and ecological safety zones accounts for 15.08%, 26.11% and 58.81%, respectively. In combination of analyses of development level, resources and environmental carrying status and quality of the people's livelihood, the main characteristics of MFOZ were identified. Through verification, MFOZ draft of national and provincial scales, which is interactively accomplished with "MFOZ Technical Process" put forward by the author, is mostly above 80% identical with what have been forecasted.

DOI

[2]
Ji S H, Liu Y, 2014. Exploration of application of low altitude UAV remote sensing in monitoring land consolidation.Modern Surveying and Mapping, 37(3): 48-50. (in Chinese)

[3]
Li Y, Chen Z X, 1994. A spatial analysis of the system of rural communities in southern Shaanxi.Human Geography, 9(3): 13-21. (in Chinese)

[4]
Liu C J, Guo L, Yue C, 2014. Application of the UAV aerial technique in evaluation of flash flood disasters.China Flood & Drought Management, 24(3): 3-7. (in Chinese)

[5]
Liu Q, Wang Y K, Guo Y M et al., 2018. Morphological characteristics and composition of plant species and their distribution patterns in Linpan of Chengdu Plain. Acta Ecologica Sinica, 38(10): 3553-3561. (in Chinese)

[6]
Liu Y, Qi Q, 2014. Application of unmanned aerial technology in the field of land and resources.Geospatial Information, 12(1): 29-30. (in Chinese)

[7]
Liu Y S, 2018. Research on the urban-rural integration and rural revitalization in the new era in China.Acta Geographica Sinica, 73(4): 637-650. (in Chinese)Cities and villages are components of a specific organism.Only the sustainable development of two parts can support the prosperous development as a whole.According to the theory of man-earth areal system,urban-rural integrated system and rural regional system are the theoretical bases for entirely recognizing and understanding urban-rural relationship.To handle the increasingly severe problems of "rural disease" in rapid urbanization,accelerating rural revitalization in an all-round way is not only a major strategic plan for promoting the urban-rural integration and rural sustainable development,but also a necessary requirement for solving the issues related to agriculture,rural areas,and rural people in the new era and securing a decisive victory in building a moderately prosperous society in all respects.This study explores the basic theories of urban-rural integration and rural revitalization and analyzes the main problems and causes of rural development in the new era,proposing problem-oriented scientific approaches and frontier research fields of urban-rural integration and rural revitalization in China.Results show that the objects of urban-rural integration and rural revitalization is a regional multi-body system,which mainly includes urban-rural integration,rural complex,village-town organism,and housing-industry symbiosis.Rural revitalization focuses on promoting the reconstruction of urban-rural integration system and constructs a multi-level goal system including urban-rural infrastructure networks,zones of rural development,fields of village-town space and poles of rural revitalization.Currently,the rural development is facing the five problems:high-speed non-agricultural transformation of agriculture production factors,over-fast aging and weakening of rural subjects,increasingly hollowing and abandoning of rural construction land,severe fouling of rural soil and water environment and deep pauperization of rural poverty-stricken areas.The countryside is an important basis for the socioeconomic development in China,and the strategies of urban-rural integration and rural revitalization are complementary.The rural revitalization focuses on establishing the institutional mechanism for integrated urban-rural development and constructs the comprehensive development system of rural regional system,which includes transformation,reconstruction and innovation in accordance with the requirements of thriving businesses,pleasant living environments,social etiquette and civility,effective governance,and prosperity.Geographical research on rural revitalization should focus on the complexity and dynamics of rural regional system and explore new schemes,models and scientific approaches for the construction of villages and towns,which are guided by radical cure of "rural disease",implement the strategy of rural revitalization polarization,construct the evaluation index system and planning system of rural revitalization,thus providing advanced theoretical references for realizing the revitalization of China's rural areas in the new era.

[8]
Liu Yu, Liu Y S, Wang J Y, 2010. Zoning and evaluation of rural residential land consolidation: A case of Hebei Province.Geographical Research, 29(1): 145-153. (in Chinese)

[9]
Lizarazo I, Angulo C, Rodriguez J, 2018. Automatic mapping of land surface elevation changes from UAV-based imagery. International Journal of Remote Sensing, 38(8-10): 2603-2622.

[10]
Luo X Q, Wang Y, Yuan X Y, 2013. Exploration and practice of surveying and mapping technology method in rural land consolidation project.Geospatial Information, 11(5): 37-39. (in Chinese)The regulation of rural land surveying and mapping is the basis and premise for the study of feasibility for land consolidation project, making budget and plans, project final acceptance, the land resource management information technology. This paper expounded the application of the UAV aerial photographic surveying system in the rural land remediation projects in various stages, and provided reference for the perfection of rural land consolidation project management and mapping techniques.

[11]
Ning J, Liu J Y, Kuang W Het al., 2018. Spatiotemporal patterns and characteristics of land use change in China during 2010-2015.Journal of Geographical Sciences, 28(5): 547-562.Land use/cover change is an important theme on the impacts of human activities on the earth systems and global environmental change. National land-use changes of China during 2010–2015 were acquired by the digital interpretation method using the high-resolution remotely sensed images, e.g. the Landsat 8 OLI, GF-2 remote sensing images. The spatiotemporal characteristics of land-use changes across China during 2010–2015 were revealed by the indexes of dynamic degree model, annual land-use changes ratio etc. The results indicated that the built-up land increased by 24.6×10 3 km 2 while the cropland decreased by 4.9×10 3 km 2 , and the total area of woodland and grassland decreased by 16.4×10 3 km 2 . The spatial pattern of land-use changes in China during 2010–2015 was concordant with that of the period 2000–2010. Specially, new characteristics of land-use changes emerged in different regions of China in 2010–2015. The built-up land in eastern China expanded continually, and the total area of cropland decreased, both at decreasing rates. The rates of built-up land expansion and cropland shrinkage were accelerated in central China. The rates of built-up land expansion and cropland growth increased in western China, while the decreasing rate of woodland and grassland accelerated. In northeastern China, built-up land expansion slowed continually, and cropland area increased slightly accompanied by the conversions between paddy land and dry land. Besides, woodland and grassland area decreased in northeastern China. The characteristics of land-use changes in eastern China were essentially consistent with the spatial govern and control requirements of the optimal development zones and key development zones according to the Major Function-oriented Zones Planning implemented during the 12th Five-Year Plan (2011–2015). It was a serious challenge for the central government of China to effectively protect the reasonable layout of land use types dominated with the key ecological function zones and agricultural production zones in central and western China. Furthermore, the local governments should take effective measures to strengthen the management of territorial development in future.

DOI

[12]
Ren X H, 2014. Producing the ortho-image for land consolidation based on low altitude UAV images.Geomatics Technology and Equipment, 16(1): 48-51. (in Chinese)

[13]
Tan X L, Zhou G H, Zhu S Het al., 2015. Landscape pattern changes and the characteristic of spatio-temporal differentiation of rural residential area in Changsha in recent 20 years.Scientia Geographica Sinica, 35(2): 204-210. (in Chinese)

[14]
Wang J, Liang J H, Zheng J X, 2014. Application UAV in registering the use right of rural land.Geomatics & Spatial Information Technology, 37(8): 183-184. (in Chinese)

[15]
Wang Y P, Chen Y J, Xie D Het al., 2014. Automatic mosaic method for UAV water-area images.Journal of Yangtze River Scientific Research Institute, 31(5): 92-95. (in Chinese)The automatic mosaic method for unmanned aerial vehicle( UAV) water-area images was researched. When there was not only water-area but also one small land in images( the monitoring water area was relatively larger and the image gradation changed small),SIFT and Harris algorithms were used to extract the feature points, and RANSAC algorithm was used to filter the mismatched. When there was only water-area,POS directional data was used to help image mosaic. Oil spill monitoring for offshore surface was taken as an example to illustrate the practical application value of UAV in water resources monitoring and emergency relief.

DOI

[16]
Zhang C B, Yang S T, Zhao C Set al., 2018, Topographic data accuracy verification of small consumer.Journal of Remote Sensing, 22(1): 185-195. (in Chinese)Low-altitude remote sensing recently became a hot technology with rapid development and com-prehensive application. Small consumer UAV attracted wide attention with rapid, flexible, and cost-effective ad-vantages. Large professional UAV, which is vulnerable to weather conditions, requires professional manipulation and airspace application. These factors restrict its ability to access terrain data agilely and rapidly. A small consumer UAV can compensate for large professional UAV limitations. This study comprehensively verifies the accuracy of the data obtained through this type of UAV to improve application reliability.This study focuses on the precision verification of topographic data obtained by small consumer UAV(Phantom 3 Professional). Six kinds of flight heights(50 m, 60 m, 70 m, 80 m, 90 m, and 100 m) are set to acquire a stereoscopic image and generate Point Cloud, Digital Surface Model, and Digital Orthophoto Map. Ground Control Points(GCPs) are laid out uniformly in the standard experimental field to verify measurement accuracy, and their three-dimensional coordinates are derived using differential GPS with high-precision. The absolute position of the stereoscopic images is calibrated by GCPs. Finally, the measurement accuracy of the result is analyzed using the mean error and relative root mean square error(RMSE).Results show that the resolution of the UAV image is 2.22 4.23 cm for flight height 50-100 m and will decrease with increasing flight altitude. The mean error is 0.51 cm in the horizontal direction and 4.39 cm in the vertical direction. RMSE is 2.79 cm in the horizontal direction and 9.98 cm in the vertical direction. The errors in horizontal and vertical directions are within normal distribution, but the error range is larger in the vertical direction. Five or more images in the same area are recommended when shooting to avoid errors caused by insufficient image overlap and to generate high-quality data. Simultaneously, GCPs should be evenly laid in the survey area to ensure absolute positioning accuracy and should be found in more than five images.Experimental precision can be influenced by a number of factors, such as light and weather con-ditions and flight stability. The GCP selection,measurement method,and image spike processes include some errors. The research shows that the measurement accuracy of small consumer UAV can reach centimeter level with reliable flight control system condition; this condition provides a new measurement method for low-cost, fast, flexible, and accurate terrain information acquisition to geography and ecology researchers.

[17]
Zhang X C, Zhao Z Y, Zhou Z Yet al., 2012. Application of UAV remote sensing technology with CORS in land use plan at village level.China Land Science, 26(1): 82-85. (in Chinese)

[18]
Zhao R, Wang E Y, Zhang X L et al., 2006. Human Geography. Beijing: Higher Education Press. (in Chinese)

[19]
Zhao Q Y, Zhang Z L, 2015. Benefit allocation of rural residential land consolidation in Dongfan village, Shanxi Province.Resources Science, 37(7): 1376-1383. (in Chinese)

[20]
Zhao X T, Hu K,Lu X P et al., 2014. Precise detection method for mine geological disasters using low-altitude photogrammetry based on unmanned aerial vehicle.Science of Surveying and Mapping, 39(6): 49-52. (in Chinese)In order to identify the mine development and environmental targets with higher accuracy,and to promote the sustainable development of mining industry,the paper used high-resolution DOM and large-scene stereo orthophoto pair derived from UAV(Unmanned Aerial Vehicle)based on low-altitude photogrammetry,and further combined with mine subsidence contours,to qualitatively and quantitatively analyzed the impaction and destruction of mine development on land resources,buildings(or structures),major engineering facilities,and the type,scale,loss and harmness of mine geological disasters,and so on.Practical engineering application results demonstrated that compared with the conventional and satellite remote sensing monitoring technologies,the method could greatly reduce the workload of field work with higher accuracy and speed,which would provide a feasible ways and practical reference for the precise detection on mine geological environment.

Outlines

/