Spatiotemporal heterogeneity and influencing mechanism of ecosystem services in the Pearl River Delta from the perspective of LUCC

  • ZHOU Rubo ,
  • LIN Meizhen , * ,
  • GONG Jianzhou ,
  • WU Zhuo
Expand
  • School of Geographical Sciences, Guangzhou University, Guangzhou 510006, China
*Corresponding author: Lin Meizhen, Professor, E-mail:

Author: Zhou Rubo (1995-), Postgraduate, specialized in the study of ecosystem services. E-mail:

Received date: 2018-09-20

  Accepted date: 2019-01-20

  Online published: 2019-04-19

Supported by

National Natural Science Foundation of China, No.41771097, No.41671175

Copyright

Journal of Geographical Sciences, All Rights Reserved

Abstract

Land use/land cover change (LUCC) has considerable impact on ecosystem services. It is essential to quantify the spatiotemporal heterogeneity of ecosystem services from the perspective of LUCC, which will benefit regional land management and ecological protection. We analyzed land use change in the Pearl River Delta from 2000 to 2015, and we used a spatially explicit integrated modeling tool (InVEST) for quantification of ecosystem services-water yield, carbon storage, soil retention, and food supply. The results revealed increases in the areas of grassland and built-up land, and decreases in the areas of woodland, cropland, water body, and unused land during 2000 to 2015, which have caused increase in water yield and carbon storage, while decrease in soil retention and food supply. The dynamic changes of woodland, grassland, cropland, and built-up land were the main driving factors in the relationship of trade-offs and synergies among the four ecosystem services, which are ubiquitous. Those all illustrate the importance of considering ecosystem services in decision making related to land use and land management.

Cite this article

ZHOU Rubo , LIN Meizhen , GONG Jianzhou , WU Zhuo . Spatiotemporal heterogeneity and influencing mechanism of ecosystem services in the Pearl River Delta from the perspective of LUCC[J]. Journal of Geographical Sciences, 2019 , 29(5) : 831 -845 . DOI: 10.1007/s11442-019-1631-0

1 Introduction

Ecosystem services represent the benefits derived directly or indirectly by living organisms from ecological functions that maintain the earth’s life support system, including various products or services, e.g., fresh air and healthy food (Daily, 1997; Costanza et al., 1997). Consequently, ecosystem services constitute the foundation of human survival. However, with increasing population and increasing demand for materials, the destruction of the ecological environment by human beings has caused irreversible effects that have led to dramatic degradation of ecosystem services (Di Sabatino et al., 2013). According to the Millennium Ecosystem Assessment, approximately 63% of ecosystem services have experienced severe decline over the past 50 years, and various ecosystem services are forecast to continue to decline sharply over the next 50 years (MA, 2005). If ecosystem services could be developed and protected properly, the environment and living standards of human beings could improve. Conversely, failure to address this problem could seriously hinder normal activities of human beings and even bring about devastating disasters. Therefore, under the guidance of the common norms of “sustainable development,” ecosystem services have become an area of active research in many disciplines (Fu et al., 2014).
The spatiotemporal heterogeneity of ecosystem services is a complex process that is influenced by both human and natural factors, e.g., climate change, agricultural production activities, and policy (Fu et al., 2009; Ouyang et al., 2016; Liu et al., 2018b). However, as the most direct manifestation of human activities, land use/land cover change (LUCC) has the most intense impact on ecosystem services over short timescales (Li et al., 2013). LUCC can affect atmospheric, water, and land systems directly, resulting in dynamic changes in the overall ecosystem services of a region (Vidal-Legaz et al., 2013). Therefore, as LUCC becomes the focus of research on global change, its impact on ecosystem services is also receiving increasing attention (Rodríguez et al., 2006). At present, research on the impact of land use change on ecosystem services is concentrated mainly in the following areas: the impact of different land use types on ecosystem services, the impact of changes in land use patterns on ecosystem services, and the impact of different land use intensities on ecosystem services (Fu et al., 2014). For example, Braat et al. (2008) emphasized that the supply of various types of ecosystem services was seriously threatened when human activities were particularly intense and caused land degradation. Fu et al. (2016) found that some local soil erosion has been successfully controlled due to the increase in vegetation with large-scale restoration measures on the Loess Plateau, but the entire regional ecosystem is still very fragile. Liu et al. (2018a) found that the conversion from cropland to grassland led to changes in the biophysical effects of regional climatic regulation in the typical study area of the Loess Plateau of China, which affected regional ecosystem services.
However, research on the impact of LUCC on the relationships among ecosystem services is lacking. The relationships among ecosystem services generally exhibit trade-offs and synergies (Peng et al., 2017). A trade-off refers to the reduction or loss of other ecosystem services when attempting to optimize a single service. A synergy occurs when the provisions of several ecosystem services increase or decrease simultaneously (Li et al., 2013). Land use decision making is usually intended to maximize an individual service, such as agricultural production or timber production, which could result in a decline in the provision of other services (MA, 2005). For example, if decision makers blindly pursue high production of grain, they will greatly increase the area of cultivated land and invade original natural green space, which eventually will lead to a decline in the capacity of soil retention. Therefore, the relationships of the trade-offs and synergies among various ecosystem services are in part driven by LUCC. In summary, it is important to understand how to manage the changes in ecosystem services driven by LUCC and land use management for regional sustainable development of the economy and ecology.
Since the beginning of economic reforms in 1978, like many coastal cities, the Pearl River Delta has become one of the fastest growing regions in China and it has undergone dramatic changes in land use. According to the statistics, the rate of urbanization in the Pearl River Delta was 71.60% in 2000 and increased to 84.12% in 2015 (Zhou, 2015). The speed of urbanization in the Pearl River Delta during the past 15 years has not slowed down, which is rare in developed countries worldwide. Since 2000, ecosystems in the Pearl River Delta have been more seriously destroyed and degraded due to rapid urbanization and dramatic changes in land use (Wu et al., 2006; Yang, 2011). Widespread ecological and environmental problems like water pollution, soil erosion, and increased flooding have emerged, which have seriously hindered sustainable economic development (Xu et al., 2011). At the same time, local government is promoting the construction of the Guangdong-Hong Kong-Macao Greater Bay Area as a region for quality living and leisure. Because it is an important part of this area, the land management and ecological problems of the Pearl River Delta will have considerable impacts on the ongoing sustainable development of the regional economy. Therefore, this study aimed to explore the spatiotemporal heterogeneity of ecosystem services under the influence of LUCC in the Pearl River Delta and to provide a basis for ecological management and land use planning in the region. These aims were achieved via three analyses: (1) to quantify land use change in the Pearl River Delta from 2000 to 2015, (2) to characterize the spatiotemporal heterogeneity and mechanisms of ecosystem services (i.e., water yield, carbon storage, soil retention, and food supply) driven by land use change in the Pearl River Delta using the InVEST model, and (3) to understand the relationships of trade-offs and synergies among the above four ecosystem services in the Pearl River Delta from the perspective of LUCC using GeoDA software and spatial correlation analysis.

2 Study area

The Pearl River Delta, which is a complex delta formed by the sediments of the Xijiang, Beijiang, Dongjiang rivers and tributaries, is located in the southeast of Guangdong Province of China (Ye et al., 2013), covering an area of 53,900 km2 (21°17-24°24′N, 111°59′-115°25′E). The Pearl River Delta has a southern subtropical climate with abundant sunshine and rainfall. It has an average annual temperature of 21-23℃ and the average annual precipitation of 1500 mm. These conditions have enabled the people of the Pearl River Delta to create a special dike-pond environment that has become a model for China’s eco-agriculture. In 2016, the permanent population of the Pearl River Delta was 57.2 million and the gross domestic product of the region was 9.2 billion yuan. The rapid regional economic development and eco-environmental problems of all the regional cities have affected the sustainable development of the Pearl River Delta. The resources and environment of the Pearl River Delta have been largely destroyed, and the eco-environmental function has been degraded considerably. For the purposes of this study, the area of the Pearl River Delta includes nine prefecture-level cities: Guangzhou, Shenzhen, Foshan, Dongguan, Huizhou, Zhongshan, Zhuhai, Jiangmen, and Zhaoqing (Figure 1).
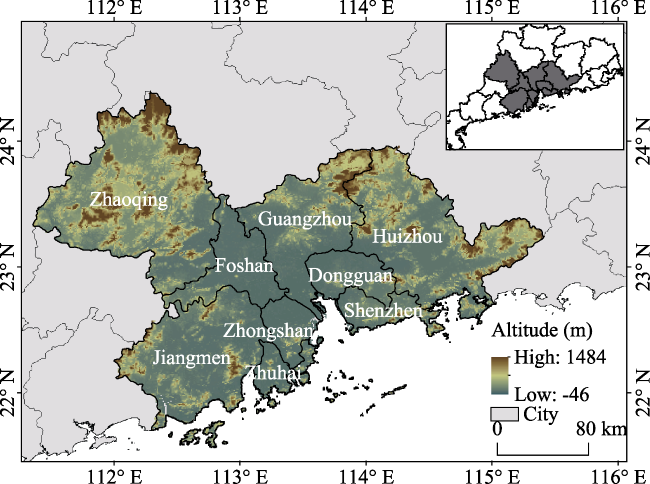
Figure 1 Location of the Pearl River Delta

3 Materials and methodology

3.1 Data source and processing

Considering the size and scale of the Pearl River Delta region, it is thought that land use data with a spatial resolution of 1 × 1 km can meet the research requirements. Land use maps (spatial precision is 1 × 1 km) of the Pearl River Delta in 2000 and 2015 were downloaded from the Resource and Environment Data Cloud platform (http://www.resdc.cn). According to the research needs, the land use data were classified into six categories: cropland, woodland, grassland, water body, built-up land, and unused land. Precipitation data of the Pearl River Delta from 2000 to 2015 were acquired from the National Meteorological Information Center (http://data.cma.cn/). Then, according to the actual situation of the study area, Kriging spatial interpolation was used to obtain maps of the distribution of the annual average precipitation of the Pearl River Delta. A digital elevation model (DEM) with spatial resolution of 30 m is available from the international scientific data-mirroring website (http://www.gscloud.cn) of the Computer Network Information Center of the Chinese Academy of Sciences. After filling, flow analysis, and other processing procedures, digital elevation data that met the research needs were obtained. Soil data for this study were generated from the Soil Map of China based on the Harmonized World Soil Database (version 1.1, with a 1:1 million map scale), which was created by the Cold and Arid Regions Sciences Data Center in 2009 (http://westdc.westgis.ac.cn). Carbon density for each land use was collected from other results (Gan et al., 2003; Zhang et al., 2011; Wu et al., 2016) based on the principle of similarity within the natural environment of the Pearl River Delta.

3.2 Methods

3.2.1 Ecosystem service evaluation
This study applied the Integrated Valuation of Environmental Service and Tradeoffs (InVEST) model to evaluate ecosystem services. The InVEST model is an ecosystem services modeling toolset implemented in a GIS environment, which was developed by the Natural Capital Project (Tang et al., 2015). The InVEST model is a modular, open-source, free toolset in which tabular and spatial data are combined with stand-alone biophysical models to quantify, visualize, and compare the delivery of key ecosystem services (Butsic et al., 2017). The InVEST model can also be used to analyze the impact of land use and land management on ecosystem services because it requires land use data to run. By varying the conditions of land use or land management, evaluation of the InVEST model output can provide information useful to managers and policy makers required to weigh the trade-offs among ecosystem services and other land use objectives. In this study, we used the four submodels of ecosystem services (i.e., water yield, carbon storage, soil retention, and food supply) in the InVEST model version 3.4.4. The principles and calculation method of each submodel were as follows.
(1) Water yield. The water yield module is based on the Budyko curve (1974) and annual precipitation, and taking the climate, vegetation, and soil into account (the interaction between surface water and groundwater is not considered), it uses a grid as an evaluation unit to quantify the capacity of water yield of different landscapes. The formula is as follows:
$Yxj=\left( 1-\frac{AETxj}{Px} \right)\times Px,$ (1)
where Yxj is the water yield (mm) at pixel x of LULC j, AETxj is the actual evapotranspiration (mm) at pixel x of LULC j, and Px is the annual average precipitation (mm) at pixel x. This study used the Modified-Hargreaves formula of Droogers (2002) to calculate the annual average potential evapotranspiration for the 87 meteorological stations in the Pearl River Delta from 2000 to 2015. Then, Kriging spatial interpolation was used to obtain a map of the annual average potential evapotranspiration of the Pearl River Delta.
(2) Carbon storage. The carbon module uses land use maps and the carbon density (i.e., aboveground biomass, belowground biomass, soil, and dead biomass) of each land use type to estimate the amount of carbon currently stored in a landscape. The formula is as follows:
$Ctot=Cabove+Cbelow+Csoil+Cdead,$ (2)
where $Ctot$is the total carbon storage (t), $Cabove$is the carbon storage (t) in aboveground biomass, $Cbelow$is the carbon storage (t) in belowground biomass, $Csoil$is the carbon storage (t) in soil, and $Cdead$is the carbon storage (t) in dead biomass. As the carbon storage of dead biomass is difficult to observe and its reserves are relatively small in comparison with the other terms, it was ignored in this study.
(3) Soil retention. The soil retention module, which is based on the Universal Soil Loss Equation (USLE), is used to estimate the amount of soil erosion within a region. This model takes into account the interception capabilities of the ground. The formula is as follows:
$USLE=R\times K\times LS\times C\times P,$ (3)
$RKLS=R\times K\times LS,$ (4)
$SD=RKLS-USLE,$ (5)
where RKLS is the total potential soil loss (t) per pixel in the original land cover without the application of factors C or P from the RKLS equation (i.e., equivalent to the soil loss for bare soil), USLE is the total potential soil loss (t) per pixel in the original land cover calculated from the USLE equation, SD is the amount of soil retention (t), and R is the rainfall erosivity ($\text{MJ}\cdot \text{mm/(h}{{\text{m}}^{\text{2}}}\cdot \text{h}\cdot \text{a)}$). This study used the formula of Wischmeier (Wang et al., 1995) to calculate$R$according to the average monthly precipitation and annual precipitation in the Pearl River Delta. In the above,$K$is the soil erodibility ($\text{t}\cdot \text{h}{{\text{m}}^{\text{2}}}\cdot \text{h/}(\text{h}{{\text{m}}^{\text{2}}}\cdot \text{MJ}\cdot \text{mm})$) calculated using the EPIC formula (Sharpley et al., 1990) based on relevant soil data, LS is the slope length gradient factor, C is the cover management factor obtained by the FAO (Roose, 1996), and P is the support practice factor that is available from the USDA Agriculture Handbook (Renard et al., 1997).
(4) Food supply. The food supply module is still in the testing stage and it cannot be applied fully. This study referred to its calculation principle that the capability of food supply can be expressed by the crop yield per unit of land area (Tallis et al., 2011). The formula is as follows:
$F(x)=\frac{CY(x)}{A(x)},$ (6)
where F(x) is the capability of food supply (t/km2), CY(x) is the food supply (t) within the region, and A(x) is the area (km2) of the region.
3.2.2 Calculation of the ecological services change index
To assess the temporal change of ecosystem services in the Pearl River Delta from 2000 to 2015, an ecosystem service change index (ESCI) (Leh et al., 2013) was introduced for the evaluation, and the results were spatialized using ArcGIS 10.2. The ESCI can determine and map ecosystem services states as time and location-dependent variables that quantify a particular service at a particular time. The ESCI indicates an increase in ecosystem service when ESCI > 0, it represents a decrease when ESCI < 0, and it indicates no change when ESCI = 0. The formula is as follows:
$ESCIx=\frac{ESCURx-ESHISx}{ESHISx},$ (7)
where ESCIx is the ecosystem service change index of x; $ESCURx$is the current ecosystem service state value of service x, and $ESHISx$is the historic ecosystem service state value of service x.
3.2.3 Quantitative expression of trade-offs and synergies among ecosystem services
Bivariate correlation analysis and Moran’s I index were used to analyze the trade-offs and synergies among the four ecosystem services of water yield, carbon storage, soil retention, and food supply.
(1) Measure of trade-offs and synergies among ecosystem services
First, the amounts of the four ecosystem services in the unit of a town or a district were calculated using the Zonal Statistics function in ArcGIS 10.2. Second, the amounts of change in ecosystem services from 2000 to 2015 were calculated. In addition, the data were standardized to eliminate dimensional relationships between the various data. Finally, the standardized data were imported to SPSS for bivariate correlation analysis, which produced a correlation coefficient matrix among water yield, carbon storage, soil retention, and food supply.
(2) Spatial expression of trade-offs and synergies among ecosystem services
First, the Weight module in the GeoDA software was used to establish a spatial weight matrix. Then, the bivariate local Moran’s I module was used to calculate the local autocorrelation Moran’s I index among the ecosystem services. Finally, the map for the local indicators of spatial association (LISA) was drawn.

4 Results

4.1 LUCC in the Pearl River Delta

In both 2000 and 2015, woodland was the main land use type in the Pearl River Delta, constituting 56.62% and 55.19% of the region’s total area, respectively (Figure 2), most of which was distributed in Zhaoqing, Huizhou, and northern regions of Guangzhou. In comparison, the proportion of cropland was relatively small, accounting for 26.48% and 22.65% of the total area in 2000 and 2015, respectively, which was mainly distributed in the central region of the Pearl River Delta. In 2000, built-up land was concentrated primarily in central and western parts of Guangzhou and southern part of Shenzhen, with sporadic distribution in Dongguan. However, by 2015, the expansion of built-up land in the Pearl River Delta was considerable, especially in central areas such as Guangzhou and Dongguan. In 2000 and 2015, the total area of water body, grassland, and unused land was small.
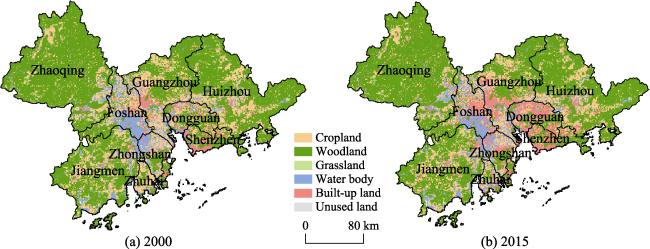
Figure 2 The Pearl River Delta land use map from 2000 to 2015
During 2000 to 2015, land use types in the Pearl River Delta underwent considerable change. Table 1 shows the land use and land cover change from 2000 to 2015 in detail. The areas of cropland, woodland, water body, and unused land decreased, while the areas of grassland and built-up land increased. During 2000 to 2015, the total area of cropland in the Pearl River Delta decreased by 2067.17 km2, which represents the largest area reduction (14.46%) of all land use types. The largest reductions in cropland area occurred in Guangzhou, Dongguan, and Foshan. During 2000-2015, the total area of woodland in the Pearl River Delta decreased by 773.00 km2 with the largest reduction in area in Dongguan. During the same period, the water body area also decreased by 326.03 km2. Conversely, during 2000-2015, the area of built-up land in the Pearl River Delta increased by 3144.14 km2 (77.33%). The largest area of increase was observed in Guangzhou, Dongguan, and Foshan. The second largest increase in area of land use was grassland, which increased by 23.65 km2 (2.50%). Overall, rapid expansion of built-up land and rapid reduction in cropland represent the main features of land use change in the Pearl River Delta during 2010-2015.
Table 1 Land-use structure and its transfer matrix of in the Pearl River Delta from 2000 to 2015 (km2)
Land use 2015 Total
Cropland Woodland Grassland Water body Built-up land Unused land
2000 Cropland 12007.96 227.96 8.50 285.46 1765.01 1.38 14296.27
Woodland 118.51 29477.28 126.46 44.27 806.18 0.78 30573.48
Grassland 3.17 45.80 827.54 0.09 67.74 944.34
Water body 56.90 22.49 4.39 3405.61 599.30 0.00 4088.69
Built-up land 42.50 26.76 1.10 26.37 3969.27 4066.00
Unused land 0.06 0.19 0.86 2.64 22.12 25.87
Total 12229.10 29800.48 967.99 3762.66 7210.14 24.28 53994.65
During the study period, conversion among land use types affected mainly grassland, cropland, built-up land, woodland, and water body, and conversion involving unused land was minimal. The areas of cropland, woodland, and water body transferred to built-up land during 2000-2015 were 1765.01, 806.18, and 599.30 km2, respectively, and these changes occurred mainly in central areas of the Pearl River Delta, i.e., Guangzhou, Foshan, Dongguan, and other cities. During the same period, the conversions of woodland to cropland and of water body to cropland were 118.51 and 56.90 km2, respectively. In addition, 126.46 km2 of woodland was transferred to grassland and 227.96 km2 of cropland and 45.80 km2 of grassland were converted to woodland. The conversions of other land use types to woodland, cropland, and grassland reflect the success of strengthened environmental protection in Guangdong Province.

4.2 Spatiotemporal heterogeneity and influencing mechanism of ecosystem services

The values of the four ecosystem services in the Pearl River Delta changed considerably from 2000 to 2015. Water yield and carbon storage showed increasing trends, whereas soil retention and food supply showed decreasing trends (Table 2).
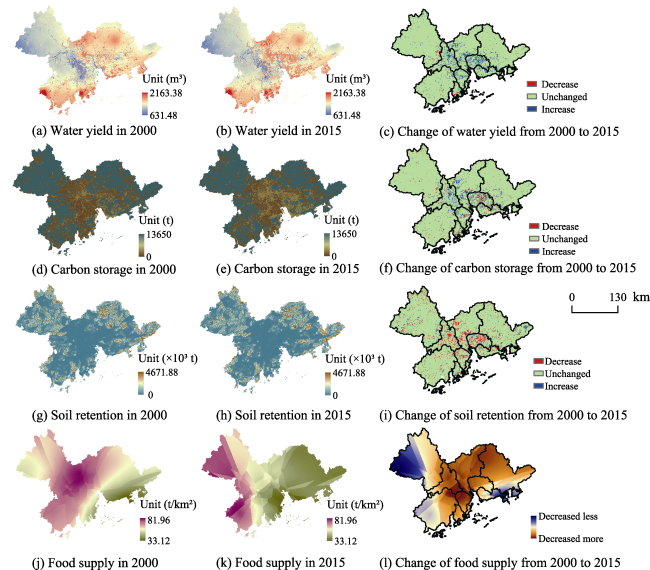
Table 2 Ecosystem services change in the Pearl River Delta from 2000 to 2015
Year Water yield(×108 m3) Carbon storage (×104 t) Soil retention (×108 t) Food supply (×104 t/km2)
2000 734.82 61984.81 40.53 601.15
2015 745.49 62242.02 40.46 291.71
Change 10.67 257.21 -0.07 -309.44
ESCI (-0.37, 0.76) (-1, 0.29) (-0.29, 0.42) (-0.69, -0.18)

Note: ESCI represents an increase or decrease in each ecosystem service. It indicates increase in ecosystem services when ESCI>0, otherwise it represents decrease, and it indicates unchange when ESCI=0.

(1) Water yield. Regions with high values of water yield were found to be located in eastern, central, and western coastal parts of the Pearl River Delta (Figures 3a and 3b). From 2000 to 2015, water yield in the Pearl River Delta increased by 10.67 × 10⁸ m3. The main area of increase was in central regions of the Pearl River Delta, including Guangzhou, Foshan, Dongguan, Zhongshan, and Shenzhen (Figure 3c). From the perspective of LUCC, the change in water yield was attributable mainly to woodland, including broad-leaved forests with considerable capacity for water evapotranspiration, because this was the main land use type in the Pearl River Delta during the study period. During the study period, large amounts of woodland were converted to other land use types such as cropland and grassland, which caused water evapotranspiration to decrease and water yield to increase.
Figure 3 Spatial distribution and change of ecosystem services in the Pearl River Delta from 2000 to 2015
(2) Carbon storage. The areas with high values of carbon storage were found to be distributed in eastern and western parts of the Pearl River Delta, while central areas had low values (Figures 3d and 3f). From 2000 to 2015, carbon storage increased from 61,984.81 × 104 to 62,242.02 × 104 t, i.e., an increase of 257.21 × 10⁴ t. As one of the most important carbon pools on land, an increase in the area of grassland will increase regional carbon storage (Li et al., 2014). From 2000 to 2015, the grassland area in the study region increased by 23.65 km2. In addition, built-up land generally also includes a certain proportion of artificial urban greening, which could have higher carbon density than a semi-artificial cropland ecosystem (Wei et al., 2014). During 2000-2015, 1765.01 km2 of cropland were converted to built-up land through Pearl River Delta urbanization, which had a certain impact on the increase of carbon storage.
(3) Soil retention. As is well known, the reduction of woodland and cropland can result in diminished coverage of ground-level vegetation. This situation will reduce the ability of woodland to intercept rainfall via the canopy, litter, and soil layers and reduce the ability of crops to resist soil erosion by rain. Therefore, because of the decline of woodland and cropland during the study period, the soil retention of the Pearl River Delta decreased by 0.07 × 10⁸ t. Regionally, the main areas of decrease in soil retention were found in central Foshan, Zhongshan, Dongguan, and Guangzhou (Figure 3i), indicating increased soil erosion in these areas.
(4) Food supply. Food supply decreased by 309.44 t/km2 from 2000 to 2015. This occurred mainly in central parts of the Pearl River Delta, including Guangzhou, Foshan, and Zhongshan. The rate of urbanization in the Pearl River Delta was 71.60% in 2000 and 84.90% in 2016; consequently, large amounts of cropland were transferred to built-up land and areas of dike-pond were lost in meeting the needs of the population and economic development. In summary, the capacity of the food supply dropped significantly during the study period.

4.3 Trade-offs/synergies and influencing mechanisms among ecosystem services

Table 3 shows the results of the bivariate correlation analysis and Moran’s I index among the four ecosystem services investigated in this study. In terms of temporal dynamics (R), positive correlations found between water yield and carbon storage, carbon storage and soil retention, carbon storage and food supply, and soil retention and food supply indicate synergies between these pairs of ecosystem services. Water yield was found correlated negatively with soil retention and food supply, which indicates trade-offs in these relationships. The correlation coefficient between water yield and carbon storage (0.632; passing the test of significance at the 0.01 level) indicates significant synergy among these ecosystem services. The reason is that water is evaporated into water vapor and then returned to the Pearl River Delta in the form of precipitation, which can promote woodland and grassland growth and increase carbon storage capacity via sequestration. This is why an increase in regional water yield will improve carbon storage. The most significant negative correlation was found between water yield and food supply (-0.334; passing the test of significance at the 0.01 level), indicating significant trade-offs among these ecosystem services. The trade-offs were caused by the rapid expansion of built-up land and the invasion of cropland in the Pearl River Delta during the study period, which meant the region had an increased capacity of water yield but a diminished capacity of food supply. Spatially (Moran’s I index), the trade-offs/synergies of ecosystem services in the Pearl River Delta were established as follows. Soil retention and carbon storage, soil retention and food supply, and carbon storage and water yield all showed synergies but the synergies were weak on the spatial scale. Food supply and carbon storage showed weak synergies on both temporal and spatial scales. The relationship of trade-offs/synergies between water yield and food supply was unclear because the value of Moran’s I index was small.
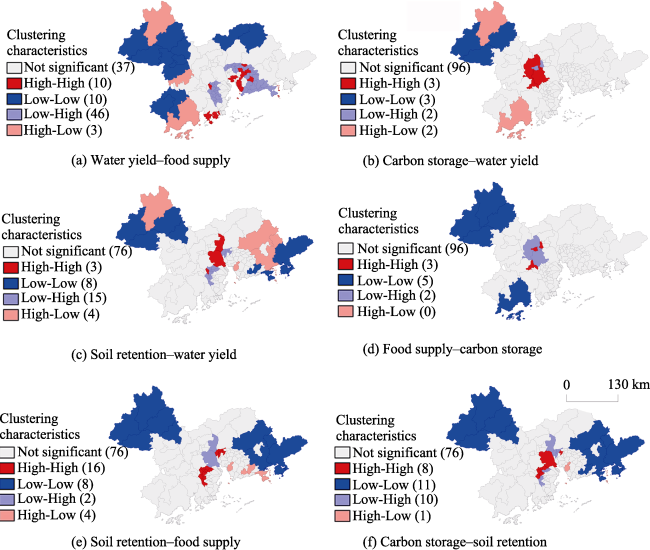
Table 3 Relationship among ecosystem services of the Pearl River Delta
Ecosystem
services
Water yield Carbon storage Soil retention Food supply
R Moran’s I Re. R Moran’s I Re. R Moran’s I Re. R Moran’s I
Water yield 1
Carbon storage 0.632** 0.115 S 1
Soil retention -0.294** 0.014 T/S 0.069 0.086 S 1
Food supply -0.334** -0.007 T 0.035 0.065 S 0.332** 0.200 S 1

Note: R represents correlation coefficient;Moran's I represents Moran's I index; Re. represents relationship between each double variables; ** represents significant correlation at the 0.01 level (both sides); S represents synergies; T represents trade-offs.

The spatial clustering characteristics for the four aforementioned ecosystem services in the Pearl River Delta area are shown in Figure 4. It can be seen that the relationship of trade-offs/synergies among the various ecosystem services in the Pearl River Delta between 2000 and 2015 had reasonably significant spatial heterogeneity. (1) The regions with synergies between water yield and food supply were found distributed in central and western parts of Zhaoqing, northern parts of Guangzhou, and western parts of Jiangmen. The regions with trade-offs among these ecosystem services were found distributed mainly in Dongguan and Zhongshan (Figure 4a). (2) Trade-offs between carbon storage and water yield were found mainly in northern parts of Zhaoqing and the south of Jiangmen (Figure 4b), while synergies were found mainly in Foshan and central and western parts of Zhaoqing. (3) Trade-offs between water yield and soil retention were found mainly in Huizhou and Zhongshan, while synergies were found in southern parts of Guangzhou and central and western parts of Zhaoqing (Figure 4c). (4) Synergies between soil retention and food supply and between carbon storage and soil retention were found primarily on the spatial scale and their spatial distributions were similar, i.e., mainly in Zhaoqing and Huizhou, while trade-offs between these pairs of ecosystem services were found mainly in the middle of the Pearl River Delta (Figures 4d and 4e). (5) Synergies between food supply and carbon storage were found distributed mainly in Zhaoqing and the south of Jiangmen, while their areas of trade-offs were small and found distributed mainly in Foshan (Figure 4f).
Figure 4 Spatial trade-offs/synergies between four ecosystem services in the study are: High-High and Low-Low represent synergies, while Low-High and High-Low represent trade-offs, numbers in the brackets indicate the number of towns/districts.

5 Discussion

5.1 Effect of LUCC on ecosystem services

Through analysis of both the LUCC in the Pearl River Delta from 2000 to 2015 and the spatiotemporal heterogeneity of the four ecosystem services, we found that changes in woodland, grassland, cropland, and built-up land were the main mechanisms of influence of the spatiotemporal heterogeneity of ecosystem services. This study also analyzed the relationships of trade-offs/synergies among the four ecosystem services in the Pearl River Delta. Negative correlation (trade-offs) was found between the two provisioning services (water yield and food supply), while positive correlation (synergies) was found between the two regulating services (carbon storage and soil retention). The relationships between the provisioning and regulating services have both trade-offs and synergies. The correlation coefficient of -0.294 between water yield and soil retention indicated trade-offs. The trade-offs found between this pair of ecosystem services are contrary to the results of most other studies. For example, Qian et al. (2018) found significant synergies between water yield and soil retention (correlation coefficient: 0.551) in their study of the Bailong River Basin in Gansu Province. Wu et al. (2017) also found significant synergies between water yield and soil retention in 2000 and 2015 (0.972 and 0.771, respectively) in the city of Erdos, China. From the perspective of LUCC, the reason for this difference could be that the areas of the Pearl River Delta in which water yield increased were approximately the same as those in which soil retention reduced, i.e., in central parts of the Pearl River Delta with high levels of urbanization and rapid economic development. Therefore, given the needs of economic development and population growth, considerable areas of woodland, cropland, and grassland in the Pearl River Delta were transferred to built-up land, which increased the area of impervious ground in urban areas, changed the water balance, reduced infiltration, and ultimately increased water yield. Furthermore, both the interception capacity of the surface and the capacity of soil retention were reduced because of the reduction in areas of woodland, grassland, and cropland. However, the four ecosystem services in the Pearl River Delta were found dominated by synergies on both temporal and spatial scales, which could be beneficial for the development of ecological restoration and protection policies in the Pearl River Delta. Therefore, this analysis of the spatiotemporal heterogeneity of ecosystem services from the perspective of LUCC not only provides a reference for the ecological management of the Pearl River Delta but also constitutes a basis for decision makers in relation to land management.

5.2 Applicability and limitations

The InVEST model was used in this study to assess the quality of four typical ecosystem services in the Pearl River Delta during 2000-2015. The results revealed that the water yield modulus in the Pearl River Delta in 2015 was 136.12 × 10⁴ m3/km2, similar to the value of 114.41 × 10⁴ m3/km2 published in the Guangdong Province Water Resources Bulletin 2015 (2015). Similarly, according to data published by the Pearl River Water Resources Commission (PRWRC, 2007), the average annual water loss and soil erosion modulus of the Pearl River Basin was 2795 t/km2 in the second national soil erosion remote sensing survey in 2000. However, the water losses and soil erosion modulus of the Pearl River Delta in 2000 and 2015 were found in this study to be 3009.74 (relative error: 7%) and 3132.41 t/km2 (relative error: 12%), respectively. Although the relative errors of water losses and soil erosion modulus in the two periods are small, they are higher than the average value published by the PRWRC. The main reasons for the differences are as follows. (1) The Pearl River Basin includes the provinces of Yunnan, Guizhou, Guangxi, and Guangdong but this study considered only the Pearl River Delta in Guangdong Province. The annual average precipitation of the Pearl River Delta is more than other regional river basins, and the speed of urbanization development is faster than in other surrounding provinces. Large amounts of woodland, cropland, and grassland in the Pearl River Delta were transferred to built-up land, which caused increased serious soil erosion. (2) The method adopted in the second national soil erosion remote sensing survey was an all-digital operation that used human-computer interaction mapping and direct generation of mapped areas, different to the method used in the soil retention module based on the USLE. Thus, the water losses and soil erosion modulus of the Pearl River Delta was higher than the average value. In summary, comparison of the evaluation results from the InVEST model with actual data published by the government reveals that the InVEST model has satisfactory applicability to the evaluation of ecosystem services in the Pearl River Delta.
Despite the established applicability of the InVEST model, certain limitations remain. (1) The water yield module does not differentiate between surface, subsurface, and baseflow; instead, it assumes the water yield from a pixel reaches the point of interest via one of these pathways. Thus, the water yield module ignores the influence of factors such as fog, groundwater, and the type and seasonal variation of plant leaf on water yield, which leads to certain deviation between the evaluated and measured values. (2) The carbon storage module simplifies the carbon cycle, which allows it to run with reasonably little information but leads to important limitations. Moreover, the module assumes that none of the LUCC types within a landscape gains or loses carbon over time, which will reduce the evaluation accuracy of carbon storage to some extent. (3) The spatial precision of the land use data used in this study was reasonably poor, which will also affect the research results.
This study analyzed the heterogeneity and mechanisms of ecosystem services in the Pearl River Delta from the perspective of LUCC, and the derived results have certain importance in relation to land management and ecosystem services protection. However, only four types of ecosystem services were studied and thus the results have certain limitations. Moreover, LUCC in the Pearl River Delta over a period of only 15 years was considered. In future work, it will be necessary to simulate future urban change and to quantify other ecosystem services (e.g., habitat quality and biodiversity). This would encourage government to pay attention to all ecosystem services when formulating relevant policies, to maintain ecological balance and ensure sustainable development of the economy and ecosystem.

6 Conclusions

We explored land use change in the Pearl River Delta from 2000 to 2015 and assessed its impact of LUCC on the heterogeneity of ecosystem services. There are some conclusions as follows:
(1) Rapid expansion in built-up land (3144.14 km2) and sharp reduction in cropland (2067.17 km2) were the major causes for land use change in the Pearl River Delta during 2010-2015. Various land uses, of which the largest area transferred is that of cropland (1765.01 km2), have been transferred to built-ups. Cropland shrinking mainly occurred in the central part of the Pearl River Delta due to fast urbanization there.
(2) LUCC played an inherently strong role in the spatiotemporal heterogeneity of ecosystem services, characterized by increasing in water yield and carbon storage (10.67 × 10⁸ m3 and 257.21 × 10⁴ t respectively) and decreasing in soil retention and food supply (0.07 × 10⁸ t and 309.44 t/km2 respectively). The ESCI for the four ecosystem services fluctuated each year from 2000 to 2015, revealing that the rapid economic development and urbanization in the Pearl River Delta, on some level, was at the expense of ecosystem services.
(3) Because the various ecosystem services were affected by land use change, trade-off/synergy effects were ubiquitous between them, for example, trade-offs between the two provisioning services (water yield and food supply), and synergies between the two regulating services (carbon storage and soil retention). The combination of provisioning and regulating services showed both trade-offs and synergies in their temporal patterns, but with a significant spatial heterogeneity. Therefore, management strategies should be formulated to keeping a reasonable configuration pattern for different land uses and balance between comprehensive ecosystem services.

The authors have declared that no competing interests exist.

[1]
Braat L C, Brink P T, Klok T C, 2008. Cost of Policy Inaction-COPI: The Case of Not Meeting the 2010 Biodiversity Target. Alterra: EU/IEEE Publication.The COPI methodology and valuation database. Change in land use, climate, pollution, water use; change in biodiversity; change in ecosystem functions; change in ecosystem services contributes to change in economic value. The Cost of Policy Inaction (COPI) is described in monitory terms. The outcome (of this project) is the valuation database. In this project worked together: Alterra, IEEP (Brussels), Ecologic (Germany), FEEM (Italy), GHK (UK), UNEP and Witteveen+Bos

[2]
Budyko M I, 1974. Climate and Life. New York: Academic Press.

[3]
Butsic V, Shapero M, Moanga Det al., 2017. Using InVEST to assess ecosystem services on conserved properties in Sonoma County, CA.California Agriculture, 71(2): 81-89.

DOI

[4]
Costanza R, d'Arge R, Groot R Det al., 1997. The value of the world’s ecosystem services and natural capital.Nature, 387(6630): 253-260.

[5]
Daily G C, 1997. Nature’s Services: Societal Dependence on Natural Ecosystems. Washington D C: Island Press.

[6]
Di Sabatino A, Coscieme L, Vignini Pet al., 2013. Scale and ecological dependence of ecosystem services evaluation: Spatial extension and economic value of freshwater ecosystems in Italy.Ecological Indicators, 32(9): 259-263.Using land cover datasets derived from satellite imagery as a proxy for ecosystem services (ES) mapping and evaluation generates a series of technical problems mainly related to the resolution at which spatial data are acquired. Small sized and highly fragmented ecosystems such as wetlands, streams and rivers are particularly underestimated when coarse resolution land cover datasets are used. However, even at finer resolution, a large fraction of the economic value provided by freshwater ecosystems may not be adequately captured by remote sensed data because, other than technical and methodological problems, the provision of many freshwater services is strictly dependent on the interactions and contacts of these ecosystems with contiguous environments. The paper analyzes and discusses the effectiveness of the CORINE land cover (CLC) dataset to represent the spatial extension and, indirectly, the economic value of freshwater biomes in Italy, with emphasis on rivers and streams. Using a georeferenced national hydrographic network database and applying a stream buffer of variable width to more than 20,000 water courses, we demonstrated that less than 10% of the estimated surface is captured by the CLC dataset with heavy negative consequences on the overall evaluation of ES at local, regional and national scale. Our approach, easily applicable also to other geographical and spatial contexts, may contribute to improve proxy-based methodologies in ES mapping/evaluation and may help to limit errors in the estimation of freshwater services.

DOI

[7]
Droogers P, Allen R G, 2002. Estimating reference evapotranspiration under inaccurate data conditions.Irrigation and Drainage Systems, 16(1): 33-45.Reference evapotranspiration (ET 0 )estimates have been computed on a globalscale using a high-resolution monthlyclimate dataset. Penman-Monteith (PM) andHargreaves (HG) methods have been compared,showing very reasonable agreement betweenthe two methods. Fitting the two parametersof HG using the PM derived ET 0 valuesdid not improve estimates by the HG methodsubstantially. Modifying the originalHargreaves method to a Modified-Hargreaves(MH) method by including a rainfall termimproved ET 0 estimates significantlyfor arid regions. When a certain level ofinaccuracy in the meteorologicalobservations was assumed, calculatingET 0 by PM and MH, given theseinaccuracy in observations, showed that MHperformed better than PM in reproducingoriginal calculations of ET 0 ascalculated by PM assuming no data error. Itis concluded that the PM is a recommendedmethodology if accurate weather datacollection can be expected, but otherwiseMH should be considered.

DOI

[8]
Fu B J, Wang S, Liu Yet al., 2016. Hydrogeomorphic ecosystem responses to natural and anthropogenic changes in the Loess Plateau of China.Annual Review of Earth and Planetary Sciences, 45(1): 223-243.China's Loess Plateau is both the largest and deepest loess deposit in the world, and it has long been one of the most severely eroded areas on Earth. Since the 1970s, numerous soil-and water-conservation practices have been implemented: terracing, planting of vegetation, natural vegetation rehabilitation, and check-dam construction. With the implementation of the Grain-for- Green Project in 1999, the Loess Plateau has become the most successful ecological restoration zone in China. However, these large-scale restoration measures and drought have significantly reduced both runoff and sediment from the Loess Plateau. This situation has both advantages and disadvantages for the lower Yellow River. Some local soil erosion has been successfully controlled, but the whole regional ecosystem remains very fragile. Therefore, it is necessary to balance each ecosystem service, for example, by determining the region's vegetation capacity and its spatial distribution for the sustainable development of the socioecological system of the Loess Plateau.

DOI

[9]
Fu B J, Zhang L W, 2014. Land-use change and ecosystem services: Concepts, methods and progress.Progress in Geography, 33(4): 441-446. (in Chinese)As a frontier and hot topic in ecology and geography,the study of ecosystem services has attracted the interest of many scholars and research institutions.By changing the structure and processes of ecosystems,landuse change affects the provisioning capability of ecosystems for products and services.Study of the relationships between ecosystem processes and services,the relationships among multiple ecosystem services,and the integration and optimization of these services at the regional scale in the context of land-use change urgently needs to be enhanced.The results of such research will be critically important for informing and supporting activities of ecosystem management.This paper introduces the concepts and methods of the study of land-use change and ecosystem services and discusses the shortcomings of existing studies and future prospects of land-use change and ecosystem services research.

DOI

[10]
Fu B J, Zhou G Y, Bai Y Fet al., 2009. The main terrestrial ecosystem services and ecological security in China.Advances in Earth Science, 24(6): 571-576. (in Chinese)

[11]
Gan H H, Wu S H, Fan X D, 2003. Reserves and spatial distribution characteristics of soil organic carbon in Guangdong Province.Chinese Journal of Applied Ecology, 14(9): 1499-1502. (in Chinese)Soil organic carbon is the main part of terrestrial carbon reservoir and important part of soil fertility. The spatial distribution and reserves of soil organic carbon are very important for studying soil carbon cycle. According to the data from the second soil survey, soil organic carbon reserves was estimated and its spatial distribution was analysed by using GIS technique. The results showed that the total amount of soil organic carbon is about 17. 52 108 t. The carbon density of laterite, lateritic red soil and red soil in Guangdong Province is 8. 83, 10.31, 9.15 kg.m-2, respectively;lower than the mean carbon density of China. The carbon density of yellow soil and rice soil is 12.08, 12.17 kg.m-2, respectively; higher than the mean carbon density of china. Soil carbon density is about 10. 44 kg . m-2 in Guangdong. The spatial distribution characteristic of soil organic carbon density in Guangdong is that the carbon density in south Guangdong Province is higher than that in north Guangdong Province, in that soil organic carbon density in north and middle Guangdong Province is 5 ~10 kg.m-2 and in east Guangdong Province is 10-15 kg.m-2. Soil organic carbon density mostly vary among 5~15 kg.m-2.

DOI PMID

[12]
Li S C, Zhang C Y, Liu J Let al., 2013. The tradeoffs and synergies of ecosystem services: Research progress, development trend, and themes of geography.Geographical Research, 32(8): 1379-1390. (in Chinese)Due to the diversity of ecosystem services,the heterogeneity of the spatial distribution and the selectivity of human use,the mutual relationships between ecosystem services show the dynamic variation under the influence of human activities and natural factors,which are characterized by different patterns such as reciprocal tradeoffs and mutual gain synergies.Understanding types,formation mechanism,scale dependence and regional differences of tradeoffs and synergies among the ecosystem services has great significance on formulating "win-win" policies and the implementation of measures for regional development and ecological protection.Therefore,the domestic and international research progress and limitation in interactions and nonlinear relationships,types,formation mechanism,scale effects,methods and tools,and uncertainty of ecosystem services were systematically reviewed in this paper.Furthermore,the research trend was identified,and the research issues on the tradeoffs and synergies of ecosystem services were put forward from a geographic perspective including spatial-temporal heterogeneity,formation mechanism,scale-dependence and regional differences.This paper will help to expand the research depth and breadth on tradeoffs and synergies of ecosystem services,and promote the level of geography comprehensive study.

[13]
Li X B, Fan R X, Liu X D, 2014. Advance in studies on carbon storage and carbon process in grassland ecosystem of China.Ecology and Environmental Sciences, 23(11): 1845-1851. (in Chinese)As the main body of terrestrial ecosystem, the grassland is the main carbon storage and one of carbon sink. In recent years, because of the implementation of major ecological projects, including the Grassland contract responsibility system, return farmland to forests or grassland, Nurture and grazing prohibition. Grassland ecosystem recovered and grassland productivity enhancing. The grassland ecosystem carbon reserve, carbon sequestration and keeping the carbon, mechanism of soil carbon cycle and stability are concerned by academic circles increasingly. This paper reviewed the research work of grassland ecosystem carbon storage and carbon process in China in recent years, summarized the characteristics and reserves of various types of grassland carbon library in our country through the different study, analyzed carbon process of grassland ecosystem, reviewed the research progress of related scientific problems of soil carbon process, pointed out the current research progress and the problems of soil carbon storage and carbon process in grassland ecosystem, analyzes the future focus in the study of soil carbon in grassland ecosystem research direction and development trend. The result shows that grasslands play a decisive role in the global carbon cycle. Improving carbon capture capacity of grassland ecosystem is an effective way to suppress the spread of the global climate change. However, due to the diversity of the types, the complexity of grassland structure and the temporal and spatial dynamic response of grassland to interference and environmental changes, so far we have limited understanding about scientific evaluation of carbon storage and the rate of change, the key carbon process of soil and its maintaining mechanism in grassland ecosystem. Along with the using of High resolution MODIS and TM data, mathematical model and measured point of the grassland types, through litter carbon pool connecting the plant carbon pool and soil carbon pool, the Soil carbon and potential of carbon sequestration and keeping the carbon makes important progress. The source and consist of soil organic carbon, organic carbon structure and environmental factors are important factors which influence the stability of soil organic carbon. Solid Hertz resonance, carbon isotope tracer provides important means to solve organic carbon stability. In the future, the driving mechanism of grassland ecosystem soil carbon sequestration will be clear and definite. And the Quantitative method system of grassland ecosystem soil carbon sequestration will also be built.

[14]
Li Y F, Luo C Y, Liu Get al., 2013. Effects of land use change on ecosystem services: A case study in Miyun reservoir watershed.Acta Ecologica Sinica, 33(3): 726-736. (in Chinese)Ecosystem services are the goods and services provided by ecosystems to people.Ecosystem services are important basis of human existence and strongly related to human well-being,and the sustainable provision of multiple services is essential for the sustenance of human societies.There are a series of factors driving ecosystem services,one of which is the change of land use pattern,and it is drawing more and more attention of ecologists. Miyun reservoir,which is the only surface water source for domestic water in Beijing,plays the key role for the ecological security of the capital.Miyun reservoir watershed is a vital water source region of Beijing city,and it has many important ecosystem services.The water yield and water quality of reservoir strongly depend on Miyun reservoir watershed condition,therefore,the conservation and improvement of ecosystem services in Miyun reservoir watershed has vital significance for local and Beijing ecological security.However,how the land use change influenced ecosystem services during the past decades is not clear yet,which may block the comprehensive development of watershed. So we take Miyun reservoir watershed as example,analyze the change of land use and ecosystem services between 1990 and 2009.We set up a two-grade classify system of land use and interpreted the remote sensing images of 1990,2000 and 2009 respectively,and then apply Integrated Valuation of Ecosystem Services and Tradeoffs(InVEST model),which is a space explicit model and based on land use,to map the ecosystem services,and analyze the influence of Land Use to ecosystem services during study period.The sub models we apply in this research contain "Water Yield","Sediment Retention" and "Water Purification",and before running these sub models,we verify them with observed data. The results of image interpretation show that farmland,forest and grassland are main type of land use of watershed,and these areas account for more than 95% of the whole watershed.There are sharp changes of land use during study period,and conversion of land use types distributed more widely after 2000.The general trend in study period is farmland and grassland decreased by 30%,48% respectively,when forest increased by 30%,and another change cannot be neglected is residential area expanded by more than 280% during the past 20 years. The changes of land use have affect on the pattern of ecosystem services and there are trade-offs among different ecosystem services in question.During the study period,the decreasing of farmland and increasing of forest and grassland improved the ability of sediment retention,and this service increased by 46% in the past 20 years.But forest expansion caused more evapotranspiration,which reduced water yield of watershed by 3% at the same time.Because the nutrient loading of residential area is much higher than other types of land use,the large-scale expansion of residential area decreased water purification service sharply after 2000 although the expansion of forest and decrease of farmland can improve this service to a certain degree,and this service declined by 55% in the past 20 years.With the expansion of forest,carbon sequestration service increased about 19%.So with the goal to get overall improvement of ecosystem services in watershed,we suggest that manages should strengthen the control of forest and residential areas. Understanding the relationship between land use and ecosystem services,the department of decision-making can control and reduce the trade-off between ecosystem services and achieve the sustainable development through appropriate land use plan.Although the approach and process of evaluation still need more improvement,our research can provide scientific foundation for decision-making in Miyun reservoir watershed.

DOI

[15]
Liu Z J, Liu Y S, Baig M H A, 2018a. Biophysical effect of conversion from croplands to grasslands in water-limited temperate regions of China.Science of the Total Environment, 648: 315-324.

[16]
Liu Z J, Liu Y S, Li Y R, 2018b. Extended warm temperate zone and opportunities for cropping system change in the Loess Plateau of China.International Journal of Climatology, 1-12.

DOI

[17]
Leh M D K, Matlock M D, Cummings E Cet al., 2013. Quantifying and mapping multiple ecosystem services change in West Africa.Agriculture Ecosystems and Environment, 165: 6-18.Although ecosystem services have been identified to be declining over the previous decades, there is no clear methodology of evaluating the impacts of land use change on ecosystem services. This paper presents a methodology for quantifying and assessing changes in multiple ecosystems services as a result of land use change using the Integrated Valuation of Ecosystem Services and Tradeoffs (InVEST) model. The model was used to map and quantify biodiversity and four ecosystem services for Ghana and Cote d’Ivoire for 2000, 2005 and 2009 land use conditions: water yield, carbon storage, nutrient retention, and sediment retention. The study developed a suite of indices to analyze land use change impacts on the status, change and spatial patterns of multiple ecosystem services. On a national scale, the results show a mix of increases in service (water yield, N retention and P retention in Ghana, and, N and P retention in Cote d’Ivoire), little change in services (sediment retention in Ghana and sediment retention and water yield in Cote d’Ivoire) and decreases in services (biodiversity and carbon storage in both countries) from 2000 to 2009. The assessment illustrates a methodology that can be employed by land managers in exploring multiple management scenarios and their implications for multiple ecosystem services change.

DOI

[18]
Millennium Ecosystem Assessment (MA), 2005. Ecosystems and Human Well-being: Current State and Trends. Washington D C: Island Press.

[19]
Ouyang Z Y, Zheng H W, Xiao Yet al., 2016. Improvements in ecosystem services from investments in natural capital.Science, 352(6292): 1455-1459.In response to ecosystem degradation from rapid economic development, China began investing heavily in protecting and restoring natural capital starting in 2000. We report on China’s first national ecosystem assessment (2000–2010), designed to quantify and help manage change in ecosystem services, including food production, carbon sequestration, soil retention, sandstorm prevention, water retention, flood mitigation, and provision of habitat for biodiversity. Overall, ecosystem services improved from 2000 to 2010, apart from habitat provision. China’s national conservation policies contributed significantly to the increases in those ecosystem services.

DOI PMID

[20]
Peng J, Hu X X, Zhao M Yet al., 2017. Research progress on ecosystem service trade-offs: From cognition to decision-making.Acta Geographica Sinica, 72(6): 960-973. (in Chinese)As a hot spot in geography, ecology and related disciplines, ecosystem services have been playing a vital role in bridging the human society with the ecosystem. A deep understanding of the relationship among ecosystem services is a critical enabling factor for sustainable management and decision-making in multiple ecosystem services, in turn realizing the dual goals of economic development and ecological protection and thus contributing to the overall wellbeing of human. Through a systematic review of the concept of ecosystem service trade-offs, this article explores their characteristics in terms of spatial scales, temporal scales and reversibility, considering human's wellbeing at different levels as the ultimate goal of ecosystem service trade-offs and ecological compensation as a baseline method of protection in trade-offs. Such ecosystem services trade-offs are expressed by quantitative indexing and integrated modelling. While such trade-offs and synergies among ecosystem services could present significant variations by spatial and temporal scales, scenario simulation and multiobjective analysis are effective ways to support decision-making in ecosystem service tradeoffs. Based on these findings, the multi-scale correlation of ecosystem service trade-offs, the flow of ecosystem service based on telecoupling, and the consumption and compensation of ecosystem services are identified to be the main directions for future research on ecosystem service trade-offs.

[21]
Pearl River Water Resources Commission (PRWRC), 2007. Soil and water loss in the Pearl River, viewed 09/03/2011. Soil and water loss in the Pearl River, viewed 09/03/2011. .

[22]
Qian C Y, Gong J, Zhang J Xet al., 2018. Change and tradeoffs-synergies analysis on watershed ecosystem services: A case study of Bailongjiang Watershed, Gansu.Acta Geographica Sinica, 73(5): 868-879. (in Chinese)Bailongjiang watershed in Gansu belongs to the upper reaches of Yangtze River water conservation area and the environment fragile area with frequent landslides and debris flow. Recently, the high-intensive human activities have caused the deterioration of natural systems. Therefore, it is of great significance to study the changes of ecosystem services and its trade-offs. In this paper, the spatial and temporal changes, spatial aggregation and the trade-offs/synergies between ecosystem services from 1990 to 2014 were quantitatively analyzed via the ecosystem service change index, spatial autocorrelation and correlation coefficient. The results showed that the ESCI ranges of the four typical ecosystem services types, namely, water yield,carbon storage, soil conservation and crop production were different from 1990 to 2014 with the difference of spatial distribution. There are spatial autocorrelation in four typical ecosystem services with obvious clustering characteristics. The cluster character and agglomeration of positive correlation of the local scale is strong, the agglomeration of the negative correlation type is low and scattered, and the spatial heterogeneity is significant. There is a negative correlation trade-offs between the two provisioning services(water yield and crop production),and positive correlation synergies between the two regulating services(carbon stocks and soil conservation). The relationships between the provisioning and regulating services have both trade-offs and synergies. There were both strong positive correlation synergies between water yield and soil conservation, and between water yield and carbon storage, and there were weak negative correlation trade-offs between soil conservation and crop production. As for the numerical relation, the trade-offs/synergies of ecosystem service changed differently in terms of Moran's I and correlation coefficient. There is significant heterogeneity of trade-offs/synergies between ecosystem services on the spatial pattern.

[23]
Renard K G, Foster G R, Weesies G Aet al., 1997. Predicting soil erosion by water: A guide to conservation planning with the Revised Universal Soil Loss Equation (RUSLE). Agriculture Handbook No.703. USDA, Agricultural Research Service, Washington, DC.The book provides guidelines for the selection of the best control methods for farms, ranches and other erosion-prone areas throughout USA. The prediction of soil loss founded on the Universal Soil Loss Equation (USLE) is revised using information available on monthly precipitation and temperature, front-free period, annual rain erosivity, below ground biomass, canopy cover and height at 15 days intervals, and soil cover disturbances associated with farming operations. The information is available on CITY, CROP and OPERATION...

[24]
Rodríguez J P, Beard Jr T D, Bennett E Met al., 2006. Trade-offs across space, time, and ecosystem services.Ecology and Society, 11(1): 709-723.

[25]
Roose E, 1996. Land husbandry: Components and strategy. FAO Soils Bulletin. 70, Rome: Food and Agriculture Organization of the United Nations.

[26]
Sharpley A N, Williams J R, 1990. EPIC: The erosion-productivity impact calculator: 2. User manual.Technical Bulletin-United States Department of Agriculture, 4(4): 206-207.This publication describes how to use the EPIC model, which predicts the impact of erosion on soil productivity. The model simulates erosion, plant growth, and related processes; it also makes economic assessments, such as cost of erosion.

DOI

[27]
Tallis H T, Ricketts T, Guerry A Det al., 2011. InVEST 2.1 beta User’s Guide. Stanford: The Natural Capital Project.

[28]
Tang Y, Zhu W P, Zhang Het al., 2015. A review on principle and application of the InVEST model.Ecological Science, 34(3): 204-208. (in Chinese)To cope with the increasingly widespread regional and global scale ecological problems, more attention has been paid to study the relationship between the economy(human activities) and ecosystem services. The ecosystem service evaluation has important significance for sustainable development, and is the basis of ecosystem management. The spatially distributed model provides a new evaluation methodology based on 3S technology and overcomes the limitations of the traditional quantitative assessment methods. Spatially distributed model can achieve spatial expression, dynamic analysis and quantitative assessment for ecosystem services. The application and research progress of the InVEST model, its potential application, data requirements, limitations, and the prospects of future development were also discussed in the paper.

[29]
Vidal-Legaz B, Martínez-Fernández J, Picón A Set al., 2013. Trade-offs between maintenance of ecosystem services and socio-economic development in rural mountainous communities in southern Spain: A dynamic simulation approach.Journal of Environmental Management, 131(1): 280-297.Mountainous rural communities have traditionally managed their land extensively, resulting in land uses that provide important ecosystem services for both rural and urban areas. Over recent decades, these communities have undergone drastic changes in economic structure, population size and land use. Our understanding of the exact mechanisms that drive these changes is limited, and there is also a lack of integrative approaches to enable decision makers to steer rural development towards a more sustainable path. In this study, we build a dynamic simulation model to calculate the trade-offs between the provisions of two ecosystem services landscape aesthetic value and water supply for human use and the economic development associated with different land use changes. The study area for the simulation comprises two rural communities located in southern Spain. Our results show trade-offs between economic development and the provision of the selected ecosystem services in the selected study area. Land use intensification results in economic development but is not enough to prevent population loss and has a negative impact on both the water supply and on aesthetic services. We conclude that more proactive management policies are needed to mitigate a loss in ecosystem services. Simulation models like ours may facilitate the choice of these policies, as they could test the result of land use planning policies contributing therefore, to a more integrative and sustainable management of rural communities. (C) 2013 Elsevier Ltd. All rights reserved.

DOI PMID

[30]
Wang W Z, Jiao J Y, He X Pet al., 1995. Study on rainfall erosivity in China.Journal of Soil and Water Conservation, (4): 7-18. (in Chinese)Computation and distribution of raninfall erosivyty (R value) in Chain was studied sys-tematically in this paper,it mainly includes determination of R index;Simple computation method of individual rainfall R value ,yearly R yafue and average annual R value;and also includesmonthly distribution,individual distribution,frequency distribution,yearly change characteris-tic and rainfall,rainfall intensity distribution characteristic of rainfall erosivity in different area in our country;R value of more than l40 main stations has been computed;on the basis of theanalysis of regional distribution feature of rainfall erosivity in our country,contour map and dis-trict map of rainfall erosivity in China has been drawn up.

[31]
Water Resources Department of Guangdong Province, 2016. Guangdong Province Water Resources Bulletin 2015, Nan Fang Daily, 12/08/2016(A05). (in Chinese)

[32]
Wei Z Q, Wu S H, Zhou S Let al., 2014. Soil organic carbon transformation and related properties in urban soil under impervious surfaces.Pedosphere, 24(1): 56-64.

DOI

[33]
Wu P J, Liu X P, Li Xet al., 2016. Impact of urban expansion on carbon storage in terrestrial ecosystems based on InVEST model and CA: A case study of Guangdong Province, China. Geography and Geo-Information Science, 32(5): 22-28, 36, 2. (in Chinese)

[34]
Wu R S, Guan D S, 2006. Spatio-temporal variation of population and its influence on the resources and environment in Pearl River Delta.Chinese Journal of Ecology, 25(12): 1586-1590. (in Chinese)Since the practice of reform and open-door policy,the economy in the Pearl River Delta has been developed rapidly,with the population growing up significantly,which made a greater pressure on the resources and environment,and restricted the regional economic and social sustainable development.In this paper,the recent years' temporal-spatial variation of population and its relationship with the economic development of this area were analyzed,and the results indicated that due to the increase of population,the possess of land and forest resources per person was further decreased,and the air and water pollution became more serious.It was of significance to solve the population problem for the sustainable development in Pearl River Delta.Strictly controlling population growth,rationally utilizing natural resources,optimizing economic structure,increasing investment for environment protection,and strengthening regional cooperation should be the essential countermeasures for realizing the sustainable development in this area.

DOI

[35]
Wu W H, Peng J, Liu Y Xet al., 2017. Tradeoffs and synergies between ecosystem services in Ordos City.Progress in Geography, 36(12): 1571-1581. (in Chinese)鄂尔多斯市是中国北方农牧交错带的中心,经济快速发展的同时带来生态环境巨大的压力,该区域生态系统服务及其相互关联的变化对半干旱地区的可持续发展具有重要意义。本文基于2000、2010年鄂尔多斯市的食物供给、碳储存、产水量以及土壤保持4种关键生态系统服务供给核算,采用相关分析探究栅格尺度上4种服务之间的权衡与协同关系,并引入玫瑰图对比不同土地利用类型的生态系统服务关联特征差异。研究结果表明:(1)2000-2010年鄂尔多斯市生态系统服务整体增强,平均食物供给量由99.5 kg·hm-2增至224.2 kg·hm-2,碳储存量由8.32 t·hm-2增至8.41 t·hm-2,平均产水量由153.64 mm增至291.90 mm,土壤保持量平均值由47.79 kg·hm-2增至59.04 t·hm-2;(2)产水与土壤保持之间存在协同关系(相关系数分别为0.972和0.771),食物供给与土壤保持之间存在协同关系(相关系数分别为0.505、0.736),食物供给和碳储存之间存在权衡关系(相关系数分别为-0.584、-0.512);(3)多重生态系统服务供给的热点区主要分布在鄂尔多斯市东部;(4)产水量和土壤保持、碳储存在耕地和林地中呈现此消彼长的变化方式,而在草地中4种生态系统服务同时增加。

DOI

[36]
Xu Q Y, Huang M, Liu H Set al., 2011. Integrated assessment of eco-environmental vulnerability in Pearl River Delta based on RS and GIS.Chinese Journal of Applied Ecology, 22(11): 2987-2995. (in Chinese)The vulnerability of eco-environments in the Yangtze River Delta was assessed in an integrated manner with remote sensing data and geographic information system software combined with spatial principal component analysis.Evaluation index systems were generated,and an analytic hierarchy process(AHP) was used to determine evaluation factor weightings.The causes of vulnerability were analyzed.The results show that the Taihu Lake drainage basin and the western and the middle parts of Zhejiang Province,which are located in the middle part of the Yangtze River Delta,are the most extremely and seriously vulnerable regions.These regions account for 20.10% of the whole study area.The lightly and moderately vulnerable areas were scattered throughout the entire study area,and accounted for 55.25% of the study area.The slightly vulnerable areas were mainly located in the north of Jiangsu Province and in the east of Zhejiang Province,and accounted for 24.65% of the study area.On the whole,the eco-environment in most areas of the Yangtze River Delta is lightly and moderately vulnerable.The natural factors which influence the eco-environmental vulnerability of the Yangtze River Delta are: days of temperature not less than 35 ,drought and flood frequency,elevation,yearly integrated NDVI,landscape diversity index,and soil erosion intensity.The human factors which influence the eco-environmental vulnerability are: per capita arable land area,per capita water resources,discharge of waste water per capita,per capita exhaust emissions,amount of chemical fertilizer,land use change,waste utilization product value,population density,GDP,etc.The extremely and seriously vulnerable regions show the characteristics of high frequency of natural disasters,lack of resources,high pollution level,serious soil erosion and low biodiversity.

DOI PMID

[37]
Yang D Y, 2011. Pearl River Delta economic zone ecological environment problems and countermeasures.Urban Studies, 18(8): 59-63. (in Chinese)

[38]
Ye C S, Feng Y F, 2013. Ecological risk assessment for Pearl River Delta based on land use change. Transactions of the Chinese Society of Agricultural Engineering, 29(19): 224-232+294. (in Chinese)Land use changes not only affect the land structure and types,but also affect the degree of health of the land ecological system.In order to explore the ecological risks caused by the land use change,and provide scientific support for the formulation of the relevant policies and the measures,this paper described a case study on the Pearl River Delta.The characteristics of land use change were analyzed during 1990 to 2006,and the ecological risk was conducted based on the land use change,the ecological risk plots of 5km 5km were applied.Spatial distribution and gradient differentiation characters of the ecological risk in the study area were analyzed by means of spatial autocorrelation and sub-analysis of variance.The conclusions were as follows: 1) The changed land(12105.05km~2) occupied 29.35% of the total land in the Pearl River Delta during 1990 to 2006.The area of construction land expanded quickly,while dike-pond increased intensively,and farmland and forests evidently decreased.Population growth,economic development,industrialization,urbanization,and the swarm of foreign investment were the main factors which led to the land use changes.2) In 1990,the ecological risk value of the whole region was 0.2713,which increased to 0.3318;the degree of risk has increased by 22.31%.Moran's I was used to estimate the spatial autocorrelation of the ecological risks.From 1990 to 2006,the global Moran's I from 0.6451 increased to 0.7137.The spatial distribution of ecological risk showed a positive autocorrelation and significant local spatial clustering pattern.The spatial variability was primarily the result from structural factors.The high-value regions included Shenzhen,Dongguan,Guangzhou Urban District,Huadu,Nanhai,Shunde,Foshan Urban District,and Zhongshan.The changes of ecological risk in these regions were more significant,and the degree of risk increased intensively.3) The area of high risk region and relatively high risk region expanded quickly,from 4874.52 km~2in 1990 to 12494.93 km~2in 2006,and the proportion of the total land from 11.82% to 30.30%.Meanwhile,the area of low risk region and inferior risk region decreased from 18901.54 km~2in 1990 to 13983.87 km~2in 2006,and the proportion of the total land from 45.84% to 33.91%.4) Ecological degree of risk showed an obvious ring structure,and decreased from the axis of Foshan Urban District-Guangzhou Urban District-Shenzhen to other regions.From 1990 to 2006,the high and relatively high risk region expanded gradually from the two banks of Pearl River Estuary to the middle area of Pearl River Delta,and the degree of risk reduced gradually towards the west and the east of the Pearl River Delta.With the speeding up of the economic development and urbanization course in the Pearl River Delta,land use has intensively changed,which obviously increases land ecological risks.These conclusions can provide new ideas and methods for sustainable land use and ecological risk management,and help promote the coordination of land use and the ecological environment.

DOI

[39]
Zhang X Y, Xu Z C, Zeng F Tet al., 2011. Carbon density distribution and storage dynamics of forest ecosystem in Pearl River Delta of low subtropical.China Environmental Science, 31(Suppl.1): 69-77. (in Chinese)Based on the vegetation carbon content rate and soil organic carbon(SOC) content that determined,we studied the carbon density and storage dynamics of forest ecosystem in the Pearl River Delta of low subtropical China.The results showed that the average vegetation content rate was ranging from 35.81% to 51.60%,and the average carbon content rate weighted by biomass was ranging from 46.57% to 52.45%.SOC content and its significance were all at the highest level in soil surface layer,and they all faded away with the deepening of soil profile.Moreover,vegetation content rate and soil organic carbon(SOC) content were all in order of broad-leaved forest mixed conifer and deciduous forest conifer forest in the same age forest,while mature forestmiddle-age forestyoung forest in the successive forest.The carbon density range of vegetation and soil were 23.58~139.18t/hm2and 55.54~151.16t/hm2respectively,and the allocation ratio of soil was higher than that of vegetation,but the allocation ratio of soil decreased with the rise of forest age class.During the years of 1989~2003,the total carbon storage and carbon density of forest ecosystem in the Pearl River Delta all increased,which indicated that,during the rapid development period of reform and opening-up,because of increase of biomass,forest ecosystem in the Pearl River Delta played an important role on accumulating carbon sink,and the accumulating function of carbon sink is being promoted step by step.

[40]
Zhou C S, Dai D D, 2015. Transition of urbanization in the Pearl River Delta.Tropical Geography, 35(3): 343-353. (in Chinese)

Outlines

/