Simulating land use for protecting food crop areas in northeast Thailand using GIS and Dyna-CLUE

  • SAKAYAROTE Kanda , 1 ,
  • SHRESTHA Rajendra P. , 2, *
Expand
  • 1. Agricultural Land Reform Office, Thailand
  • 2. Asian Institute of Technology, Thailand
*Corresponding author: Rajendra P. Shrestha, E-mail:

Author: K. Sakayarote, E-mail:

Received date: 2018-08-04

  Accepted date: 2018-12-20

  Online published: 2019-04-19

Copyright

Journal of Geographical Sciences, All Rights Reserved

Abstract

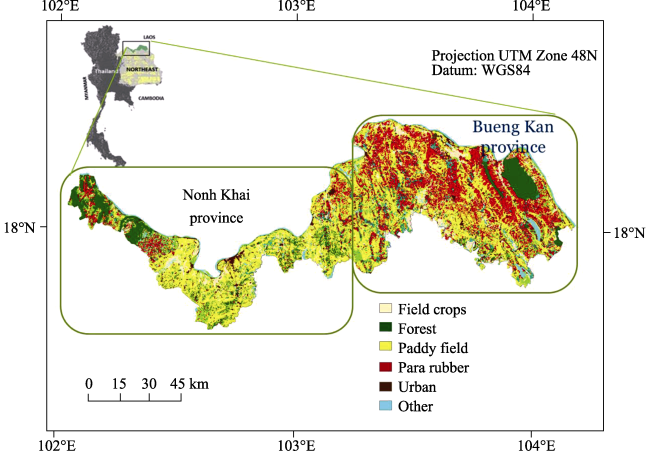
Land use in the northeast region of Thailand has changed dramatically in the past two decades. These changes are mainly due to the government policies, which launched a scheme to promote rubber plantation during 2003-2013 targeting to solve the problem of poverty in the region. At least 50,000 ha of paddy fields were found to be converted to other land use types between 2002 and 2012. This study was conducted in Nong Khai and Bueng Kan province of northeast Thailand, where massive rubber plantation is going on prompting significant amount of land-use change, with the objective of investigating how land-use changes will affect on food availability in future. We analyzed land-use changes of the past and simulated future land uses using GIS and Landsat Thematic Mapper Data. The most obvious change was the decrease in paddy field and an increase in rubber plantation. This eventually leads to decreased paddy production affecting food supply of farm households. The land use projections for 2032 were done for three scenarios using Dyna-CLUE model. Unlike business as usual scenario, which will further decrease the paddy area, other scenarios with different land use policies if implemented will help protect paddy areas and thus achieving higher food production locally. The lack of implementation of proper spatial policies will lead to a further loss of paddy areas at macro level. The smallholder farmers may be highly vulnerable to land use-change and experience significant food crop losses, food insecurity and income loss when they change the land to rubber and there is market failure.

Cite this article

SAKAYAROTE Kanda , SHRESTHA Rajendra P. . Simulating land use for protecting food crop areas in northeast Thailand using GIS and Dyna-CLUE[J]. Journal of Geographical Sciences, 2019 , 29(5) : 803 -817 . DOI: 10.1007/s11442-019-1629-7

1 Introduction

The growing demand for food and raw materials is exerting an increasing pressure on land and the competition for natural resources. Theoretically, the competition for land area can be identified as a factor driving the establishment of new rubber plantation in major crop areas due to limited land resources (Wang et al., 2012). Rubber has been considered a new commercial crop replacing traditionally grown crops in the region and is a main feature of major land-use changes in Thailand (Li and Fox, 2011). The export value of Thai natural rubber between 2010 and 2013 averaged USD 9.3 billion a year, compared with rice at an average export value of USD 5.3 billion a year (OAE, 2013). To meet the rubber demand of world market, Thai government announced a scheme named ‘Rubber Cultivation for Raising the Sustainable Income to Farmers in the New Planting Area Phase 1 (2004- 2006)’ to promote rubber cultivation among the farmers who have never owned any rubber plantation. The target was to have rubber cultivation in 112,000 ha in the northeast region of Thailand (Fox and Castella, 2013) to increase revenue for farmers and for country through international export as the southern region of Thailand which is good area for rubber cultivation had no scope for further expansion. Rubber plantation can be found all over northeast Thailand due to policy influence and lucrative prices of rubber products (Sakayarote and Shrestha, 2017). In addition, biophysical drivers and environmental factors are also the significant direct causes of land-use change (Lambin et al., 2011; Sakayarote and Shrestha, 2017).
Paddy fields occupied about 60% of the total cultivated land in northeast Thailand (OAE, 2013) and in many areas it has been reported that paddy fields are converted into rubber plantation (Wannasai and Shrestha, 2008). Land-use change can stress food crop production and directly influence the local food supply (Isvilanonda and Bunyasiri, 2009; Schneider et al., 2011). Rubber can contribute to increased income in comparison to other agricultural products (Kroeksakul et al., 2011) but it may affect food security due to loss of cultivable area for food crops (Viswanathan, 2008; Thongyou, 2014). In Laos, the expansion of rubber has increased the overall income but it caused loss of agro-biodiversity and food security (Thongmanivong and Fujita, 2006).
In order to identify sustainable land use that matches expected productivity with socioeconomic and environmental concerns, it is important to understand the conditions and driving forces of land-use change. This study attempted to quantify land-use change by assessing the nature and magnitude of change in areas under rubber plantation over the past decades. Estimating land-use change is also crucial in order to predict the future impact on small farmers’ food security, which helps make required suggestions to formulate appropriate land use policy. We modeled land-use change under three policy scenarios including business as usual scenario with the purpose of protecting paddy areas.

2 Study area and methodology

2.1 Profile of the study area

A broad pattern of the rubber plantation areas is concentrated at the borders of Thailand-Lao PDR particularly along the Mekong River that are located in Nong Khai and Bueng Kan provinces of Thailand. Therefore, the study was conducted in Nong Khai and Bueng Kan provinces, which cover 724,590 ha. The annual mean temperature in the region is 11 to 41℃ and the annual rainfall is 1569 mm. The land cover consists of dry evergreen forests on the plateau, field crops on the well-drained soil of the gently undulating areas and paddy rice on the flat and low-lying areas. The soils on the undulating landscapes are mainly derived from alluvium of sandstone origin and are inherently low in fertility. Farmers in this area rely on subsistence agricultural systems and depend on small-scale farming as a primary source of livelihood. Paddy, especially glutinous rice, is the major staple food crop in the study area (OAE, 2013). The population of the study area was 0.93 million in 2013.
Figure 1 Location map of the study area showing major land uses in 2012
Given the aggressive government policy on rubber plantation, the study area has been experiencing extensive land-use change. The expansion of cultivated land is likely to be limited due to the fact that land suitable for agriculture is almost completely utilized. Therefore, several farmers modified the existing agricultural land drainage systems for rubber plantation purpose. As agricultural practices by rubber smallholders in the study area, most fields have perimeter open ditches surrounding the fields, which help to draw water away from the fields, especially in flood plains and poorly drained lands that are unsuitable for rubber plantation. In addition, ORRAF emphasizes only monoculture and has pushed smallholders to use more chemical fertilizers and herbicide for better production. The trend of land change in the study area is similar to the trend at national level, with increasing area under rubber and decreasing area under paddy (Table 1). The higher incentives for the rubber products and government policy pushed forward the expansion of plantation areas by switching the field crops and paddy field to rubber in 2010 (Sakayarote and Shrestha, 2017).
Table 1 Change of rubber area and paddy area in Thailand from 2007 to 2016
Year Para rubber area (ha) Paddy area (ha)
Of the country Of the study area Of the country Of the study area
2007 2,888,800 85,043 9,181,760 143,183
2008 3,009,440 102,052 9,187,520 141,119
2009 3,140,000 96,259 9,199,520 111,788
2010 3,242,240 134,126 10,331,840 199,671
2011 3,386,400 136,310 10,448,640 180,584
2012 3,597,120 136,432 10,392,160 179,838
2013 3,711,040 162,506 9,932,800 156,297
2014 3,738,999 162,666 9,726,560 153,909
2015 3,733,108 162,706 9,290,080 152,849
2016 3,734,400 166,934 9,348,320 156,716

Source: OAE, Agricultural Statistics of Thailand 2007-2016

2.2 Research methodology

2.2.1 Analyzing land-use change for rubber cultivation
Land-use change analysis helps to assess what land use has been changed to what other land use in which period. GIS based land-use change study for four time periods, 1993-2002, 2002-2006, 2006-2009 and 2009-2012, was carried out to locate the areas where land use conversion had occurred to rubber cultivation. Land use maps (scale 1:25,000) from Land Development Department (LDD) were analyzed by PCI EASI/PACE software and ArcGIS. Other datasets needed for modeling were also collected in GIS format from LDD, which included ASTER GDEM generated elevation data (to generate aspect, slope and hill shade), roads, rivers, land tenure/rights, population, and land suitability for rice and rubber. A suitability map for each land use type was developed to illustrate these suitability degrees and display the spatial representation of soils suitable for agriculture.
2.2.2 Land suitability map
The land suitability maps were obtained from LDD. Maps are based on land qualities (scale 1:50,000), with respect to their effects on crop production. They have been aggregated into four major groupings such as climate, soil, topography and hydrology. The procedures of a land evaluation were used by (1) the use of an explicit weight for the effect of each land quality on crop performance, and (2) the way of combining the evaluation of land qualities into a final land suitability class or land suitability index. The produced land suitability maps for field crops, rice and rubber included four land-suitability classes: very suitable (S1), moderately suitable (S2), marginally suitable (S3), and unsuitable (N) (Table 2). Land in Class S1 has few permanent limitations that restrict its use and has very high potential for intensive crop production. Land in Class S2 has some permanent limitations that reduce the degree or intensity of crop production but is nevertheless of high potential. Land in Class S3 has severe permanent limitations that restrict the choice of alternative uses and the intensity of crop production and is of moderate potential. Land in Class N is unsuitable for the cultivation of annual crops, but it can be under established pastures, forestry or special crops that provides adequate cover. The existing land use was overlaid with the suitability map to identify if the current land use cultivation is done in those areas with biophysical suitability for rubber and rice cultivation. This analysis helps investigate mismatch of the land use type in particular to rubber.
Table 2 Land suitability for rice and rubber
Land characteristics Limiting values for rice Limiting values for rubber
S1 S2 S3 N S1 S2 S3 N
Annual mean temperature >24 21-24 18-21 <18 26-28 23-25, 29-34 20-22 >34, <20
(℃)
Elevation (m) 0-600 600-1200 1200-1800 >1800 < 250 250-400 400-500 >500
75% probability rainfall (mm) >1300 900-1300 500-900 <500 1500-2000 2000-3000 1500-2000 2000-3000
Soil drainage class Poorly drained Imperfectly drained Moderately well drained Excessively drained Well to moderately well Moderately well to somewhat poorly Poorly Very poorly
Soil texture C, ZC, ZCL, L SC, SCL, ZL, Z SL S, LS SSiL, SiL SCL, CL LS -
Soil depth (cm) >80 60-80 40-60 <40 >150 100-150 50-100 <50
pH of flooded soil 7-Jun 5 6, 7-8 4.5-5, 8-8.5 <4.5 5.0-7.3 7.3-8.0 3.5-4.0 >8.0, <3.5
ECe (mS cm-1) <3 3-5 5-7 >7 >10 3-10 <3 -
Slope angle (degrees) <1 1-2 2-6 >6 <20 20-40 40-60 >60

Sources: LDD (1996)

2.2.3 Projecting future land uses
Physical factors have been found significant in explaining the land use pattern. Such related factors are used for projecting future land uses under different scenarios of policy intervention to predict the future impacts on food security and farmer’s livelihood. The land-use change in the study area has been modelled by using Dyna-CLUE model (Dynamic Conversion of Land Use and its Effects) by 2032 (for 20 years). Dyna-CLUE can project future land uses under different scenarios by considering the statistical relationship among land use and its causal factors (Verburg et al., 2002).
Four inputs were prepared to run Dyna-CLUE such as land demand, location characteristics, spatial policies and restriction, and land use conversion settings. Land cover map of 2012 was used as baseline for land-use change detection in the study area. Competition between different land use types is taken into account by setting the conversion elasticity, a parameter ranging from 0 to 1, according to their capital investment level. Location suitability for each land use type is based on logit model (Partoyo and Shrestha, 2013). Since no actual land use already exists for the alternative crops investigated in scenario 2 (Retention of natural forest and high potential land for paddy field) and scenario 3 (Retention of natural forest, and high and moderate potential land for paddy field), a suitability map analyzed through a spatial multi-criteria decision analysis was used as a proxy for its land use pattern. The comparison of the land use in 2012 and scenario 1 (business as usual) was evaluated through the application of Kappa statistics. The predictive accuracy of the model for the quantity of change was validated based on a three-map comparison technique (Pontius et al., 2008), that is, the reference map of 2002, the reference map of 2012, and the predicted map of 2012. For a model validation purpose, Dyna-CLUE was run to project a land use map from 2002 to 2012 under the existing trend scenario. The calculation of the accuracy of the model prediction resulted in a 44% (figure of merit), 57% (producer’s accuracy), and 51% (user’s accuracy).
1) Land demand
The area of each land use type was set to be land demand and three scenarios are developed (Table 3). Scenario 1 is defined as a business as usual that is a simple projection of the recent land-use change trend. We calculated the linear trends of each land use type derived from the Markov chain analysis during 2002-2012. Scenario 2 is defined as an area with high potential for growing rice along with retaining the natural forest. This scenario supports to protect high suitable area for growing rice by 15% of the study area. In case of scenario 3, the purpose is to protect the high and moderate potential areas for rice cultivation by 35% of the study area along with retaining natural forest. These scenarios are created based on identified drivers, trends of land demand and related land use policies. ‘High potential land for paddy’ means land best suited for paddy cultivation, taking into consideration land capability, unique agricultural land; irrigated land; and land suitable for irrigation.
Table 3 Land demand characteristics of three scenarios
Land use type Percentage change from the current trend
Scenario 1: Business as usual (A continuation of the land transformation rates for the past ten year is assumed) Scenario 2: Policy to protect high potential land for paddy cultivation (2032) Scenario 3: Policy to protect high and moderate potential land for paddy cultivation (2032)
Field crops
Forest
Paddy
Perennial crops
Water
Rubber
Orchard
Urban
Others
-2.69
-1.31
-24.09
5.71
-2.19
18.72
0.03
0.15
5.68
-4.16
1.59
-17.46
2.84
-2.22
14.23
-0.33
0.60
4.91
-2.80
-2.62
-11.87
3.76
-1.88
9.96
0.08
0.16
5.21
Spatial policy No restriction on any land use class Retention of natural forest and high potential land for paddy field (S1) Restriction on high (S1) and moderate (S2) potential land for paddy field, forest, and unsuitable land for rubber
2) Location characteristics
Based on GIS dataset, logistic regression models were constructed to determine the relations between land use and a set of potential driving factors. Ten driving factors were selected to evaluate the suitability of a certain grid cell to be devoted to a land use type such as aspect, elevation, and distance to main road, distance to water resource, hill shade, and land with utilization right, land with property right, population density, slope, land suitability for rice, and land suitability for rubber. A binary logistic regression analysis was carried out for each land use type. To avoid the effect of spatial autocorrelation, the regressions were calculated based on selected random samples of grids. For each model, we evaluated the goodness-of-fit using the relative operating characteristics (ROC). The ROC compares the observed values which are the binary data over the whole range of predicted probabilities. The ROC value of 1.0 indicates model to a perfectly fit and a value of 0.5 indicates model to a completely random (Pontius and Schneider 2001). This good conformity implies the validity of the Dyna-CLUE model for simulating future land-use change in the study area. The ROC of each land use type ranged between 0.55 and 0.85. Based on the ROC value, the prediction was satisfactory for all land use types.
3) Spatial policies and restrictions
We put the existing forest area to be the restriction area in all scenarios assuming forest land cannot be allowed to convert to other land uses. However, we also included paddy areas as the restriction to change for the purpose of their protection from conversion in scenario 2 and scenario 3 to protect the food crops area.
4) Land use conversion settings
We selected eight factors for land use simulations. Economic and policy factors were not included in the model because these factors are unstable and can change at any time. Of the selected factors, six were continuous variables and two binary variables. The binary logistic regression was used to analyze each land use type. The dependent variable is the land use type. The independent variables are factors influencing land-use change. The factors of land suitability for rice and rubber cultivation were considered into the model as these were the major issues of the study. The results of regression estimates are shown in Table 4.
Table 4 Location factors used for future land use simulation
Factors Variable scale Minimum Maximum
Elevation (m) Continuous 158 245
Distance to main road (km) Continuous 0 6.08
Distance to water resource (km) Continuous 0 6.9
Land with property right Binary 0= non-property right 1= property right
Distance to district (km) Continuous 30.9 41
Slope (%) Continuous 0 21.39
Land suitability for rice Binary 0= not suitable for rice 1= suitable for rice
Land suitability for rubber Binary 0= not suitable for rubber 1= suitable for rubber
2.2.4 Food supply situation of smallholder households
We empirically measured land-use change effects by using survey data on 211 rural households in the study area. The independent variable was assessed within two types of population with distinct and defined characteristics: (1) ‘Conversion’ mean households which have a full or partial conversion of their paddy fields to rubber cultivations, which included 100 households; (2) ‘non-conversion’ means households which have not converted the paddy fields to rubber cultivation, whilst they change the other land use types for rubber cultivation, which included 111 households. T-test using SPSS software was also used to analyze food security of the households from survey data collection as there is little information on the impacts of rubber farming on the households’ food security. The methods involved in survey data collection are used to collect information to determine the effect of land-use change on household living standards and food supply in the study area.

3 Results

3.1 Land-use change detection

Land-use changes have taken place from 2002 to 2012 caused by population pressure and government policy. Rubber areas have been increased from 159,888 ha in 2002, compared to 201,174 ha in 2012 while paddy areas have been decreased from 285,160 ha in 2002 compared to 234,852 ha in 2012. Forest areas also have been slightly decreased from 67,462 ha in 2002 compared to 65,600 ha in 2012 (Table 4). Figure 2 shows a clear expansion of rubber plantations in 1993, 2002, 2006, 2009 and 2012. Rubber plantation areas expanded beyond the forest boundary in the study area. In 2002, it was found that some rubber plantation areas were scattered in the field crops area and around forest boundaries (Figure 2). Meanwhile, the highest rate of increase in rubber plantation areas was during 2006-2009 as the rubber prices also increased from 1.57 USD in 2006 to 2.88 USD/kg in 2009 (Rubber Authority of Thailand, 2010). There are two possible reasons for this land-use change. First, it may be due to the implementation of policies promoting rubber cultivation in 2003. Second, the average prices of rubber markets in 2006 and 2007 are the highest on record that farmers responded to price incentives by increasing rubber plantation areas. As much as 53,919 ha of paddy areas was replaced by rubber plantation during 2002-2012 (Table 5).
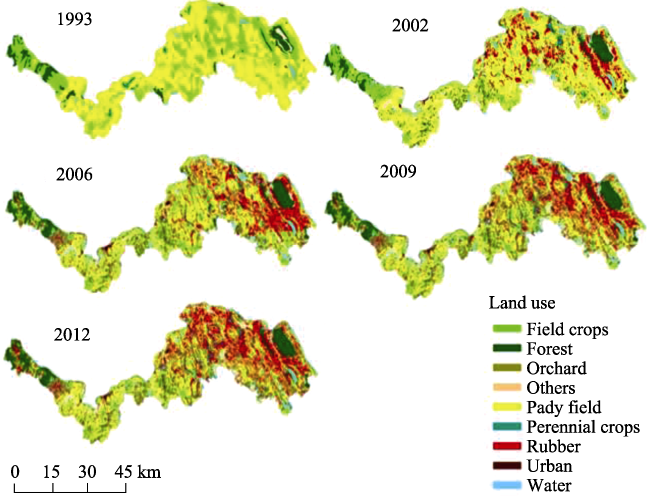
Figure 2 Land uses of the study area in different years (1993 to 2012)
Table 5 Land use transition matrix of the study area from 2002 to 2012 (ha)
Land use type Field crops Forest Paddy field Perennial crops Water Rubber Orchard Urban area Other Total
(2002)
Field crops 6089 4676 4163 1448 1221 8542 1374 1177 2,580 31,269
Forest 1466 38,151 12,988 2069 714 6479 647 1396 3,551 67,462
Paddy field 7533 9605 153,439 16,149 10,191 53,919 919 10,755 22,650 285,160
Perennial crops 1919 2548 6449 8788 839 17,417 120 887 2,908 41,875
Water 851 537 7425 1176 8452 1786 143 1185 5,840 27,395
Rubber 6289 2192 25,915 13,747 2933 91,684 485 4479 12,164 159,888
Orchard 314 251 2301 332 283 641 145 475 604 5,347
Urban area - - - - - - - 11,352 839 12,193
Other 9725 7641 22,172 7089 5414 20,707 303 3639 17,309 93,998
Total (Year 2012) 34,187 65,600 234,852 50,798 30,047 201,174 4136 35,345 68,445 724,590

3.2 Land suitability for rubber versus existing rubber cultivation

Rubber suitability analysis shows that about 4% and 7% of the study area is highly and moderately suitable for rubber cultivation. In other words, these areas pose relatively low limitations thus resulting in higher rubber production. But the dilemma, most probably due to various factors such as land tenure or ownership, is that only 20% (6019 ha of 31,666 ha) of the highly suitable areas and 53% (26,497 ha of 49,068 ha) of moderately suitable areas have actually been cultivated resulting in majority of rubber cultivation in marginally suitable or even not suitable areas (Table 6). This implies of land demand and limitation of agricultural land that some smallholders may convert marginally suitable land for rubber plantation. In addition, rural communities often rely on experience with traditional land management systems instead of desirable land suitability. This leads to the cultivation of rubber in unsuitable locations. Such cultivations in marginally and unsuitable suitable areas which are low land areas and paddy areas certainly do not bring good return from the rubber crop.
Table 6 Rubber cultivation in different land suitability levels for rubber in the study area
Land suitability for rubber Total study area (ha) Rubber cultivation under different land suitability levels (ha)
2002 2006 2009 2012
Highly suitable 31,666 1669 3735 4356 6019
Moderately suitable 49,068 6484 14,825 21,456 26,497
Marginally suitable 353,072 64,623 87,246 106,691 119,868
Unsuitable area and forests 290,785 7075 9476 3720 4778
Total 724,590 79,850 115,282 136,223 157,164

3.3 Future land uses

There are five factors namely elevation, distance to roads, land property rights, slope, and land suitability for rubber that have significant positive relationship with rubber plantation based on the regression analysis (Table 7). Most rubber plantation areas are found in proprietary land which indicates that the rights to land affect rubber plantation. The perennial crops, such as rubber, need to have ownership on land in the long run. However, land rights have a negative effect on rice cultivation. Table 7 shows a negative relationship between ‘rubber plantation area’ and ‘distance to town’, and ‘land suitability for rice’. However, other variables were found to have positive relation with rubber plantation. Distance from water source is a limiting factor for rice cultivation but does not affect rubber plantation.
Table 7 Factors influencing land use type
Variable Field crops Forest Paddy Perennial crops Water Rubber Orchard Urban Other
Constant -0.839 -2.210 0.581 -3.034 -3.710 -1.700 -5.063 -3.027 -3.198
β values
Elevation -0.012 0.008 n.s. 0.008 -0.003 0.004 -5.021 n.s. -0.003
Distance to main road n.s. -0.002 0.001 n.s. -0.001 0.008 n.s. 0.002 -0.001
Distance to water resource 0.001 -0.002 -0.078 -0.004 -0.002 n.s. -0.001 0.043 n.s.
Hill shade -0.006 -0.801 -0.01 0.003 0.003 n.s. 0.005 n.s. 0.004
Land property rights 0.597 -0.266 -0.10 0.357 -0.397 0.415 0.466 0.289 -0.296
Distance to town n.s. -0.002 0.01 -0.001 0.001 -0.003 0.002 0.005 0.013
Slope -0.0014 -0.348 -0.06 n.s. -0.002 0.176 0.002 -0.095 0.098
Land suitability for rice -0.003 0.192 0.01 -0.288 -1.17 -0.232 n.s. -0.004 -0.003
Land suitability for rubber 0.216 0.485 -0.176 -0.154 -1.89 0.171 0.495 -0.218 0.002

Note: n.s. = not significant at 0.01 level

The land-use change analysis has shown that the existing trend from 2002 to 2012. The paddy field loss is expected to continue in the future. Based on the logistic regression estimated in Table 7 and scenarios described in Table 3, the simulation of land-use change from 2002 to 2032 resulted in different patterns of land use.
The results of land use simulation for those three scenarios in the year 2032 are presented in Figure 3. The area under each land use at the end of simulation period under each scenario is presented in Table 8. Both rubber and urban lands expanded to paddy land as observed between 2012 and 2032 (Figures 3a and 3b). In addition, other land use type and perennial crops have been converted into the paddy.
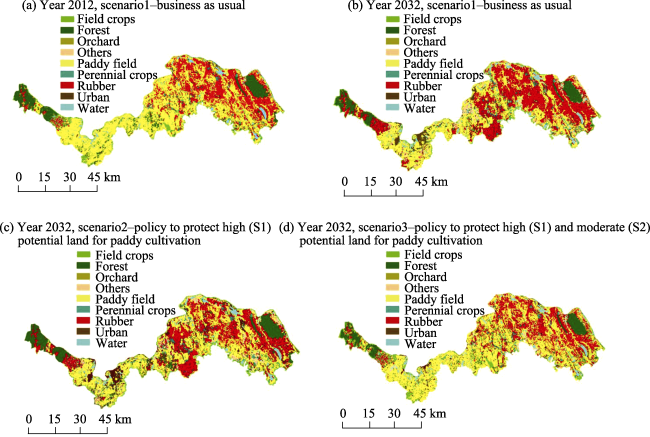
Figure 3 Future land use maps of the study area under three scenarios
Table 8 Area coverage under projected land use types by 2032 in the study area
Land use Scenario 1: Business as usual (2032) Scenario 2: Policy to protect high land potential for paddy cultivation (2032) Scenario 3: Policy to protect high and moderate land potential for paddy cultivation (2032)
ha % ha % ha %
Field crops 22,236 3.07 22,810 3.15 32,642 4.50
Forest 45,531 6.28 83,084 11.47 52,649 7.27
Paddy 225,785 31.16 275,452 38.01 315,979 43.61
Perennial crops 41,532 5.73 31,834 4.39 38,509 5.31
Water 31,502 4.35 31,636 4.37 34,078 4.70
Rubber 255,118 35.21 183,539 25.33 152,577 21.06
Orchard 1,813 0.25 1,779 0.25 4,749 0.66
Urban 41,036. 5.66 35,964 4.96 32,771 4.52
Other 60,038 8.29 58,491 8.07 60,635 8.37
Total 724,590 100 724,590 100 724,590 100
The study assessed the impact of paddy field protection policy on future land uses. Scenario 2 showed that the policy can protect paddy field from converting into rubber plantation. The paddy area under scenarios 2 and 3 is higher than scenario 1. The scenario 1 will have massive rubber area under business as usual scenario. The target is that paddy area will reach to 35% of the total area (OAE, 2013). Given the land area of 38.01% and 43.61% of the total study area can be reserved for paddy cultivation by 2032 under scenario 2 (food crop area protection policy) which will protect high land potential for paddy cultivation and scenario 3 which will protect high and moderate land potential for paddy cultivation respectively. Under scenario 2, only highly suitable areas for paddy are protected but in scenario 3 moderately suitable areas for paddy are also protected in addition to highly suitable areas for paddy thus having more areas for paddy cultivation and eventual increased rice production for food availability.
The possibility of achieving targeted protection of the paddy area can be indicated by scenarios 2 and 3. Scenario 3 may produce a stable food supply locally to ensure the food security in the future with stricter constraints imposed. However, it will provide a slightly lowered forest protection than Scenario 2. In summary, scenarios 2 and 3 may effectively control land-use change in sustaining food security at a macro level. Scenario 3 was set for overall controlled target based on “Agricultural Economics Crop Zoning in Thailand (2013”), with the addition of the area restriction factors, i.e., the protection of the food security zone and forest. The simulation results showed that the paddy area protection in scenario 3 will be superior to those for scenarios 1 and 2, but there is no clear difference between scenarios 2 and 3. This indicated that the total degree of control and regulation rubber cultivation under scenario 2 is adequate.

3.4 Food supply situation after rubber planting scheme

Rice production in the farm of Conversion group (1.83 ton/household/year) yielded less than the Non-conversion group (4.54 ton/household/year) (Table 9). Households of ‘Conversion’ group should purchase more rice than farmers of Non-conversion group. Households of Conversion group also spent more than non-conversion group for food in the lack of their own rice production. Therefore, replacing paddy fields with rubber can bring about negative impacts on smallholders’ food security at household level. Securing production is a priority policy for maintaining self-sufficiency of rice in the household level. Rice is the staple food, with an average per capita consumption of 0.18 ton/year. The average rice yield of the study area in 2013 was about 1.77 ton/ha. A population of 0.94 million of the study area in 2013 is estimated to reach 0.98 million people by 2032 and this population will require at least 0.17 million ton of rice in 2032.
Table 9 Household rice production and income
Variable Average Conversion
(Change of paddy to
rubber) (n=100)
Non-conversion
(No change)
(n=111)
T-value
1. Rice production (ton/household /year) 3.14 1.83 (0.27) 4.54 (0.37) **
2. Rice productivity (ton/ha/year) 1.77 1.74 (0.39) 1.81 (0.25) *
3. Rice purchase for household consumption (ton/household/year) 0.34 1.02 (0.79) 0.02 (0.013) **
4. Rice expenditure
(USD102/household/year)
1.57 2.26 (1.69) 0.03 (0.027) **
5. Household rice consumption (ton/ household/year) 0.81 0.74 (0.25) 0.86 (0.31) *
6. Rice consumption (kg/person) 229 224 (111) 238 (172) *
7. Household member (person) 4.02 3.59 (0.91) 4.45 (1.02) *
8. Net income of the household
(103USD/year)
7.58 8.89 (4.66) 8.91 (4.89) -
9. Average yield of rubber
(ton/ha/year)
1.17 1.14 (0.24) 1.18 (0.33) *
10. Income from rubber production
(USD/ha/year)1
1,495 1477 (341) 1491 (376) *
11. Income from rice production
(USD/ha/year) 1
713 708 (245) 722 (159) *

*Significant at P<0.05; **Significant at P<0.01. Figure in parentheses is standard deviation; 1 USD = approx. 35 Thai baht

1Rubber price (Cup lump) = 1.28 USD/kg; Rice price (Jasmine rice) = 0.40 USD/kg (in 2012)

4 Discussion

4.1 Protecting high potential land for paddy

Smaller farm holders have subsistence farming even under rubber due to smaller land holding size. Given the ongoing land-use change from paddy land to rubber, there can be irreparable damage to the ecosystem resulting in complete loss of paddy lands, besides rubber has highly uncertain market as already experienced in recent years. This will affect farmers’ capability to sustain their livelihood due to expected loss in case of downfall in rubber price. Thailand Ministry of Agriculture and Cooperatives (MOAC) launched an agricultural land zoning plan for several crops, mainly rubber, rice, cassava, oil palm, maize, and sugarcane in 2013, under ‘Agricultural Economics Crop Zoning Project (2012-2016)’, whereas the Commerce Ministry has zoned farmland for alternative crops to solve the problem of excess rice production in some areas where there are reliable irrigation facilities which support two to three crops of rice cultivation per year without affecting rice quality. The focus of the policy should be to protect the areas that have high potential for rice cultivation (S1) and the area of “the rain-fed lowland rice ecosystem”. Promoting other alternative crops should be considered in the areas that are unsuitable for rice cultivation.
In addition, the government policy should clearly clarify zoning of the type of rice in order to reduce the gap between rice supply and demand of each market. Appropriate land use plans and livelihood strategy to achieve farmers’ livelihood sustainability should be promoted. An enforcement of land-use ordinance or the regulation of rubber at local level and macro level with an effective policy should also be considered.

4.2 Balancing food crops and cash crops

In order to have food security and improve financial asset of the farmers, rubber can be a major source of income and rice can be minor source of income to reduce households’ food expenditure as shown in Table 8 above. The smallholder farmers in the study area are subsistence farmers but when they convert their farmland to rubber and given the volatile nature of rubber price in the market which had happened between 2015 and 2017 (0.8-1.07 USD/kg), the smallholder farmers may face numerous risks in the face of losing income due to falling market of rubber and this may significantly affect their subsistence as there are no other source of income while they carry the burden of household loan. We found that the amount of rice purchase and expenditure was significantly different between the conversion households and the non-conversion households. However, the net income per household in both groups was not different. Therefore, they would experience a sharp drop in income when rubber prices fall. As said above, since households in the study area are engaged in subsistence farming, these households may face insufficiency of food supplies when income is constrained.
Therefore, land allocation for food crops and rubber control should be taken into consideration in policy formulation. The study showed that scenario 1 failed to protect the high potential areas for rice cultivation (S1). Paddy field will be lower than 35%. Rice production may be sufficient at the national level but may not be sufficient at the local level, i.e. study area. Future rubber planting should not be allowed in areas which have high potential for food production. Government should determine short- and long-term measures to manage food production and its demand at both micro and macro levels. In addition, it should promote the increase of food production per unit area in the face of limitation of land size and population growth. As well, we should find the ways to optimize land uses and balance between economic crops vs food crops. In addition, transformational changes in agricultural policies, economic development policies, poverty reduction strategies, market reforms and institutional arrangements are urgently needed to address smallholders’ food insecurity and poverty.

4.3 Future land use development

There are different rice varieties grown in the area and are liked by people differently. But land use models cannot be defined in terms of rice varieties consumed by the households or produced for the purpose of selling. Although scenarios 2 and 3 will maintain needed rice areas but could not be certain that whether they actually are consumed by the households. It is because Thai farmers although as subsistence farmers are market oriented in terms of selling their products from market and purchasing them from market later for consumption. In this context, subsistence refers to the small-scale land holders. Thai government plans to reduce rubber plantation area as a continuation of its efforts to raise domestic rubber prices by reducing oversupply and the Ministry of Agriculture and Cooperatives Ministry should try to reduce the rubber plantation area by another 32,200 ha a year over the next five years. They pledge to support 285 USD/ha, capped at 1.6 ha/household for farmers who join the scheme. However, rubber is perennial crop requiring long-term investment and can be harvested over a period of 20 years or more. Farmers have to make difficult decision to cut rubber trees when rubber prices are dropped. The scheme should focus on encouraging farmers to stop rubber farming in non-suitable areas, such as rice farmland, low-lying areas, and flooded area, where the rubber production is not obtained at its best. The state should support farmers to plant mixed crops or to promote the allocation of land use in such areas. In addition, the future study should focus on delineating the suitable areas for different rice varieties for efficiency protection of glutinous rice and other high quality rice verieties to reduce gap between crop productivity and demand in the study area. Moreover, some varieties are native to the area and efforts should be made to protect those genotypes. A limitation of the study is its restriction to analysis based on GIS data and economic data without taking into account the perspective of smallholder farmers who are actually driving these changes. In projecting future land use of this study did not consider inputs to be dynamic and hence applying dynamic inputs, such as increased population density, irrigation support, road construction, and changes in land policy, in simulating future land use will give more refined result.

5 Conclusions

Paddy fields were the largest areas to convert to rubber cultivation in the study area. These areas currently under rubber cultivation are not necessarily suitable for rubber, yet such expansion is triggered by increasing rubber price as there is huge market for international export of rubber. Farmers aspiring for increased farm income are forced to plant rubber everywhere despite the land’s biophysical suitability. The land use simulation shows that it is possible to increase paddy areas to more than 40% of the study area by reclaiming the area under rubber but would need appropriate intervention to enforce or encourage the farmers to cultivate rice by providing appropriate farming environment including incentives. The policy that regulates land use for its appropriate use should be given a high priority, including the policy on food crop protection. In the absence of such policy, rice area is likely to decline to 31% of the study area due to increase in rubber area in business as usual scenario. The reduction of paddy fields may be associated with an increased risk of food insecurity of the farmers who have changed paddy areas to rubber cultivations. Although rubber farming generates high income, rubber growers have to pay more for food because they do not produce their own food. Besides there is also risk to such rubber dependent farmers who have long-term investment as the foreign market has steadily showing the sign of decline in rubber demand, which will set back the farmers if they have to abandon rubber fields midway before they can complete the harvesting cycle. Hence, this is important to have long-term plan to gradually phase out and decrease over expansion of rubber in the area.

The authors have declared that no competing interests exist.

[1]
Ahmed F F, 2012. Income diversification determinants among farming households in Konduga, Borno State, Nigeria.Academic Research International, 2(2): 555-561.

[2]
Fox J, Castella J C, 2013. Expansion of rubber (Hevea brasiliensis) in Mainland Southeast Asia: What are the prospects for smallholders? The Journal of Peasant Studies, 40(1): 155-170.The rubber tree is native to the humid tropics and has traditionally been cropped in the equatorial zone between 10°N and 10°S; in mainland Southeast Asia this includes portions of southern Thailand, southeastern Vietnam, and southern Myanmar. In the early 1950s, the Chinese government began to invest in growing rubber in environments perceived to be ecologically marginal and eventually established state rubber plantations in areas that lie as far north as 22° north latitude. China's success in growing rubber in these ‘non-traditional’ environments expanded the habitat in which rubber could be planted and pushed it further north. Today entrepreneurs from China, Vietnam, Malaysia, and Thailand are investing in rubber plantations in areas of Laos, Cambodia, and Myanmar, northwest Vietnam, northeast Thailand, and Yunnan, China. The impact of rubber on smallholders, however, is not yet clear. Experiences in Xishuangbanna, Yunnan, China and northeast Thailand clearly show that smallholder rubber production is a viable and effective proposition in moving households and communities out of poverty. By contrast in countries such as Laos, Cambodia and Myanmar many farmers are struggling to maintain their lands and forests in the face of growing pressures from investors and government institutions to impose concession arrangements.

DOI

[3]
Isvilanonda S, Bunyasiri I, 2009. Food security in Thailand: Status, rural poor vulnerability, and some policy options. ARE Working Paper No.2552/1. Department of Agricultural and Resource.Poverty in Nigeria is concentrated in rural areas. Low resource or resource-poor farmers characterized by preponderance of small farm units, fragile soils, rain-dependent, minimum inputs and poor yield dominate the agricultural sector. The incidence of poverty is highest among households in which the head is engaged in agriculture as the main source of income. Agricultural growth is therefore... [Show full abstract]

[4]
Ivanic M, Martin W, 2008. Implications of higher global food prices for poverty in low-income countries. Available at SSRN 1149097.

[5]
Kroeksakul P, Naipinit A, Sakolnakorn T P N, 2011. The economic and social effects of farmers growing para rubber in northeast Thailand: A case study of Sapsomboon village, Dun Sad sub-district, Kranoun district, Khon Kaen province.Journal of Business Case Studies (JBCS), 7(1): 113-118.

[6]
Lambin E F, Meyfroidt P, 2011. Global land use change, economic globalization, and the looming land scarcity.Proceedings of the National Academy of Sciences, 108(9): 3465-3472.

DOI

[7]
Li Z, Fox J M, 2011. Rubber tree distribution mapping in Northeast Thailand. International Journal of Geosciences, 2(4): 573-584. .

[8]
Office of Agricultural Economics (OAE), 2013. Agriculture statistics of Thailand 2013. Ministry of Agriculture and Cooperatives. Bangkok, Thailand.

[9]
Partoyo Shrestha R P, 2013. Monitoring farmland loss and projecting the future land use of an urbanized watershed in Yogyakarta, Indonesia.Journal of Land Use Science, 8(1): 59-84.This study analyzes land use changes in Yogyakarta, Indonesia, specifically farmland loss, which has occurred as a result of rapid urbanization by employing remote sensing, GIS, and land use modeling techniques. Landsat images from 1992 and 2004 and ASTER Terralook images from 2009 were classified using a supervised classification to generate land use maps. Land use change was detected using a post-classification method. During 1992 2009, high-density built-up areas increased by a factor of 3.7, and 80.47 km2 of farmland was lost due to land conversion to built-up areas during the same period. Based on these findings, land uses for the year 2029 were spatially simulated using Dyna-CLUE model for three scenarios: business as usual, farmland protection, and minimum required farmland. The results reveal that the ongoing trend of land use conversion combined with the lack of implementation of proper spatial policies will lead to a large loss of farmland and that it is desirable to protect prime farmland from urban sprawl.

DOI

[10]
Pontius R G, Schneider L C, 2001. Land-cover change model validation by an ROC method for the Ipswich watershed, Massachusetts, USA.Agriculture, Ecosystems & Environment, 85(1): 239-248.Scientists need a better and larger set of tools to validate land-use change models, because it is essential to know a model prediction accuracy. This paper describes how to use the relative operating characteristic (ROC) as a quantitative measurement to validate a land-cover change model. Typically, a crucial component of a spatially explicit simulation model of land-cover change is a map of suitability for land-cover change, for example a map of probability of deforestation. The model usually selects locations for new land-cover change at locations that have relatively high suitability. The ROC can compare a map of actual change to maps of modeled suitability for land-cover change. ROC is a summary statistic derived from several two-by-two contingency tables, where each contingency table corresponds to a different simulated scenario of future land-cover change. The categories in each contingency table are actual change and actual non-change versus simulated change and simulated non-change. This paper applies the theoretical concepts to a model of deforestation in the Ipswich watershed, USA.

DOI

[11]
Pontius Jr R G, Boersma W, Castella J Cet al., 2008. Comparing the input, output, and validation maps for several models of land change.The Annals of Regional Science, 42(1): 11-37.This paper applies methods of multiple resolution map comparison to quantify characteristics for 13 applications of 9 different popular peer-reviewed land change models. Each modeling application simulates change of land categories in raster maps from an initial time to a subsequent time. For each modeling application, the statistical methods compare: (1) a reference map of the initial time, (2) a reference map of the subsequent time, and (3) a prediction map of the subsequent time. The three possible two-map comparisons for each application characterize: (1) the dynamics of the landscape, (2) the behavior of the model, and (3) the accuracy of the prediction. The three-map comparison for each application specifies the amount of the prediction accuracy that is attributable to land persistence versus land change. Results show that the amount of error is larger than the amount of correctly predicted change for 12 of the 13 applications at the resolution of the raw data. The applications are summarized and compared using two statistics: the null resolution and the figure of merit. According to the figure of merit, the more accurate applications are the ones where the amount of observed net change in the reference maps is larger. This paper facilitates communication among land change modelers, because it illustrates the range of results for a variety of models using scientifically rigorous, generally applicable, and intellectually accessible statistical techniques.

DOI

[12]
Rubber Authority of Thailand, 2010. Central Market Daily Rubber Price Report by the Rubber Economic Research and Development. .

[13]
Sakayarote K, Shrestha R P, 2017. Policy-driven rubber plantation and its driving factors: A case of smallholders in northeast Thailand.International Journal of Sustainable Development & World Ecology, 24(1): 15-26.Government-promoted rubber plantation has led to widespread land conversion to monoculture rubber cultivation in northeast Thailand. To understand what household characteristics influence the decision for land conversion from traditional rice and upland crops cultivation and its impacts on sustainability, the study was conducted in Nong Khai and Bueng Kan provinces of northeast Thailand by analyzing land-use changes between 2002 and 2013. Majority of conversion to rubber took place in paddy-growing areas and the economic returns from rubber along with institutional support from the government played a key role in encouraging farmers to convert to rubber. Other household characteristics, such as farmers experiences, age of household head, land security, size of paddy area owned, and off-farm income were important factors influencing the conversion. The reduction of paddy fields may be associated with an increased risk of food insecurity of smallholders. Spatial analysis showed that 76% of new rubber plantations currently are in environmentally unsuitable marginal areas, which are otherwise important for biodiversity conservation, watershed function, and environmental protection. The study findings will help to clarify the influencing factors on land conversion to rubber plantation and to highlight some of the environmental issues for developing sustainable extension strategies to ensure food security, reduce poverty and protect the environment from rubber plantation.

DOI

[14]
Schneider U A, Havlík P, Schmid Eet al., 2011. Impacts of population growth, economic development, and technical change on global food production and consumption.Agricultural Systems, 104(2): 204-215.Over the next decades mankind will demand more food from fewer land and water resources. This study quantifies the food production impacts of four alternative development scenarios from the Millennium Ecosystem Assessment and the Special Report on Emission Scenarios. Partially and jointly considered are land and water supply impacts from population growth, and technical change, as well as forest and agricultural commodity demand shifts from population growth and economic development. The income impacts on food demand are computed with dynamic elasticities. Simulations with a global, partial equilibrium model of the agricultural and forest sectors show that per capita food levels increase in all examined development scenarios with minor impacts on food prices. Global agricultural land increases by up to 14% between 2010 and 2030. Deforestation restrictions strongly impact the price of land and water resources but have little consequences for the global level of food production and food prices. While projected income changes have the highest partial impact on per capita food consumption levels, population growth leads to the highest increase in total food production. The impact of technical change is amplified or mitigated by adaptations of land management intensities.

DOI

[15]
Thongmanivong S, Fujita Y, 2006. Recent land use and livelihood transitions in northern Laos.Mountain Research and Development, 26(3): 237-244.Landscapes in the mountainous north of Lao People's Democratic Republic (hereafter Lao PDR or Laos) are undergoing rapid transformation as road access is being improved and the area is integrated into the regional economies of Southeast Asia, particularly China. Rural livelihoods in the upland areas, long based on subsistence agricultural production, are changing as more households engage in the market economy. This study assesses land use changes from 1993 to 2000, as well as agricultural production in 4 northern provinces of Laos: Luang Prabang, Oudomxay, Bokeo, and Luang Namtha. The spatial data available for this region are limited, but several trends are apparent from 1993: the area of traditional upland agriculture and swidden farming (ie shifting agriculture) has decreased, while permanent intensive agriculture has increased. There is some evidence that forest cover has increased since 1997, probably as a result of the succession of abandoned swidden areas to secondary forest, but the quality and extent of this forest cover remains unclear. Agricultural sector analysis in the 4 northern provinces supported the land use data, showing a rise in commercial agricultural production of cash crops (including sugar cane, paddy rice, and maize) at the expense of subsistence agricultural production. All these changes reflect the government's policy of reducing shifting cultivation practices in the upland areas and promoting cash crop production. The new exposure to external market forces has begun to bring about changes in Laotian rural communities, with the development of village collectives to manage resources and negotiate with outside traders. However, it is also envisaged that this commercialization will increase the demand for privatization of agricultural land; this will require a renegotiation of current government land allocation policies.

DOI

[16]
Thongyou M, 2014. Rubber cash crop and changes in livelihoods strategies in a village in Northeastern Thailand.Asian Social Science, 10(13): 239-251.

[17]
Verburg P H, Soepboer W, Veldkamp Aet al., 2002. Modeling the spatial dynamics of regional land use: The CLUE-S model.Environmental Management, 30(3): 391-405Land-use change models are important tools for integrated environmental management. Through scenario analysis they can help to identify near-future critical locations in the face of environmental change. A dynamic, spatially explicit, land-use change model is presented for the regional scale: CLUE-S. The model is specifically developed for the analysis of land use in small regions (e.g., a watershed or province) at a fine spatial resolution. The model structure is based on systems theory to allow the integrated analysis of land-use change in relation to socio-economic and biophysical driving factors. The model explicitly addresses the hierarchical organization of land use systems, spatial connectivity between locations and stability. Stability is incorporated by a set of variables that define the relative elasticity of the actual land-use type to conversion. The user can specify these settings based on expert knowledge or survey data. Two applications of the model in the Philippines and Malaysia are used to illustrate the functioning of the model and its validation.

DOI PMID

[18]
Viswanathan P, 2008. Emerging smallholder rubber farming systems in India and Thailand: A comparative economic analysis.Asian Journal of Agriculture and Development, 5(2): 2.This paper provides a comparative perspective on the performance of smallholder rubber farm livelihood systems based on case studies of two regions in India and Thailand. The analysis of the emerging farming systems in the two countries' rubber farms reveals that the rubber monocrop system is viable, provided prices remain remunerative and primary markets efficient. Findings further indicate the dominant contribution of rubber production to the gross household income of the rubber growers in the integrated farming systems. Nevertheless, from a sustainable livelihoods perspective, the socioeconomic significance of the rubber integrated farming systems assumes greater prominence, given the fact that small producers are highly vulnerable to market uncertainties. It has been found that rubber integrated livelihood systems provide the smallholders with ample capability for resilience during crises and ensure a sustained flow of income. The two case studies demonstrate the need to promote and scale up rubber integrated farm livelihood systems in the smallholder-dominated rubber producing countries in the Asian region. The paper also recommends enhancing the capabilities of the smallholders by strengthening their access to the five forms of capital that sustain their livelihood.

[19]
Wang J, Chen Y, Shao Xet al., 2012. Land-use changes and policy dimension driving forces in China: Present, trend and future. Land Use Policy, 29: 737-749.China has extremely scarce land resources compared to the world average. There is an urgent need for studies of the current situation and the trends in land-use change and assessment of the performance of land policies in China. Assessment of land-use change has long been hindered by a lack of accurate and reliable data. This paper uses the data obtained from the national land surveys of 1996 and land-use change surveys from 1997 to 2008, to analyze changes in land use and the policy dimension driving forces related to the changes, especially cultivated land, forestry land, grassland, as well as developed land. The aim of this analysis will be to derive the physical, social and economical driving forces of those changes to grasp the trends in land-use change and the effects of land policies and to formulate strategies for the protection and sustainable use of agricultural land. The results indicate that, although the overall change in land use was not large, cultivated land was significantly reduced and developed land rapidly increased. A great deal of high quality cultivated land was changed to developed land and low quality cultivated land generated from unused land, which has resulted in a serious threat to food supplies in China. Predictions using the methods of linear extrapolation and a BP neural network indicate that it is impossible to keep to a target of 0.12 billion hectares of cultivated land in the future under the mode of economic development used between 1996 and 2008. The results also indicate that the implementation of the laws and regulations about controlling the developed land and preserving cultivated land had significant effects on changes in land use, especially cultivated land and developed land. The results suggest that the changes in land use are closely related to economic fluctuation and the enaction and implementation of these land policies had a little time lag for cultivated land protection. There is a pressing need for China to use its limited land resources more efficiently and effectively by enacting or re-enforcing the laws and regulations on land resources protection and economic development, not only for its own growing population, but also the world. Therefore, we must formulate strategies for the protection and sustainable use of agricultural land.

DOI

[20]
Wannasai N, Shrestha R P, 2008. Role of land tenure security and farm household characteristics on land use change in the Prasae Watershed, Thailand.Land Use Policy, 25(2): 214-224.

DOI

Outlines

/