Multi-dimensional expansion of urban space through the lens of land use: The case study of Nanjing City, China

  • QIAO Weifeng , 1, 2, 4 ,
  • GAO Junbo 2, 3 ,
  • GUO Yuanzhi , 2, 5, * ,
  • JI Qingqing 1 ,
  • WU Ju 1 ,
  • CAO Min 1, 4
Expand
  • 1. School of Geography, Nanjing Normal University, Nanjing 210023, China
  • 2. Institute of Geographic Sciences and Natural Resources Research, CAS, Beijing 100101, China
  • 3. School of Geographic Sciences, Xinyang Normal University, Xinyang 464000, Henan, China
  • 4. Jiangsu Center for Collaborative Innovation in Geographical Information Resource Development and Application, Nanjing 210023, China
  • 5. University of Chinese Academy of Sciences, Beijing 100049, China
*Corresponding author: Guo Yuanzhi, PhD Candidate, E-mail:

Author: Qiao Weifeng (1975-), PhD and Associate Professor, specialized in land use, urban-rural development and the application of GIS and remote sensing. E-mail:

Received date: 2018-07-11

  Accepted date: 2018-12-19

  Online published: 2019-04-19

Supported by

National Natural Science Foundation of China, No.41871178, No.41671385, No.41371172

Copyright

Journal of Geographical Sciences, All Rights Reserved

Abstract

The study of multi-dimensional expansion of urban space (MEUS) addresses the laws of urban spatial expansion from all directions and angles. Using Nanjing as an example, this paper constructs multi-temporal, urban three-dimensional models based on RS and GIS technology and then conducts qualitative and quantitative analysis of MEUS using plot ratio change maps and MEUS quantitative index for built-up areas. Based especially on the concept of volume growth contribution rate, this paper analyzes the characteristics of MEUS in different stages. The results show that in 2000-2004, planar expansion played the main role, the internal potential development (IPD) intensity of the urban built-up areas was relatively large, and the volume growth contribution rate was low; in 2004-2008, planar expansion accelerated, and IPD slowed down; in 2008-2012, planar expansion slowed while IPD intensity increased; the contribution rates of volume growth of urban IPD for the three periods were 22.21%, 24.51% and 73.38%, respectively. This study expands the research perspective of urban spatial expansion, and the adopted methods are instructive and meaningful for MEUS research. In addition, the results of this study will deepen the understanding of MEUS laws and help improve scientific decision-making for urban planning and urban land use management.

Cite this article

QIAO Weifeng , GAO Junbo , GUO Yuanzhi , JI Qingqing , WU Ju , CAO Min . Multi-dimensional expansion of urban space through the lens of land use: The case study of Nanjing City, China[J]. Journal of Geographical Sciences, 2019 , 29(5) : 749 -761 . DOI: 10.1007/s11442-019-1625-y

1 Introduction

At present, urbanization is accelerating globally (UN, 2007; Liu and Li, 2017). Urban spatial expansion, as an important aspect of the urbanization process, has always been a hot topic globally in the fields of urban geography, urban planning and urban land use research (Anas, 1976; Liu et al., 2016; Wen et al., 2016). China entered a period of rapid urbanization from the 1990s (Chi et al., 2015); a large number of cities have expanded rapidly, with city sizes reaching the largest scale ever in human history (Wang et al., 2012; Zhao et al., 2012), and will continue to expand. Many scholars have analyzed urban land expansion, morphology evolution (Chen et al., 2016a), and the evolution of land use structure by examining expansion strength (Xu and Min, 2013), compactness (Yin et al., 2010), fractal dimension (Liu et al., 2016), shape index (Wang et al., 2015), gravity-center model (Maimaiti et al., 2017; Yang et al., 2018), landscape index (Quan et al., 2015; Triantakonstantis and Stathakis, 2015), equivalent fan analysis (Zhang et al., 2016), transfer matrix (Kumar and Tripathi, 2014) etc. from a two-dimensional perspective. However, urban spatial expansion is reflected not only in the two-dimensional growth of the city but also in the increase of its vertical height. In recent years, in China’s economically developed areas, with the rapid expansion of cities land space has been very limited. This requires that urban spatial expansion be changed from being extensive to being intensive, focusing on improving land use intensity in urban built-up areas (Liu et al., 2014). Therefore, the trend of three-dimensional spatial expansion in large and medium-sized cities has become increasingly discernible (Liu and Chen, 2001; 
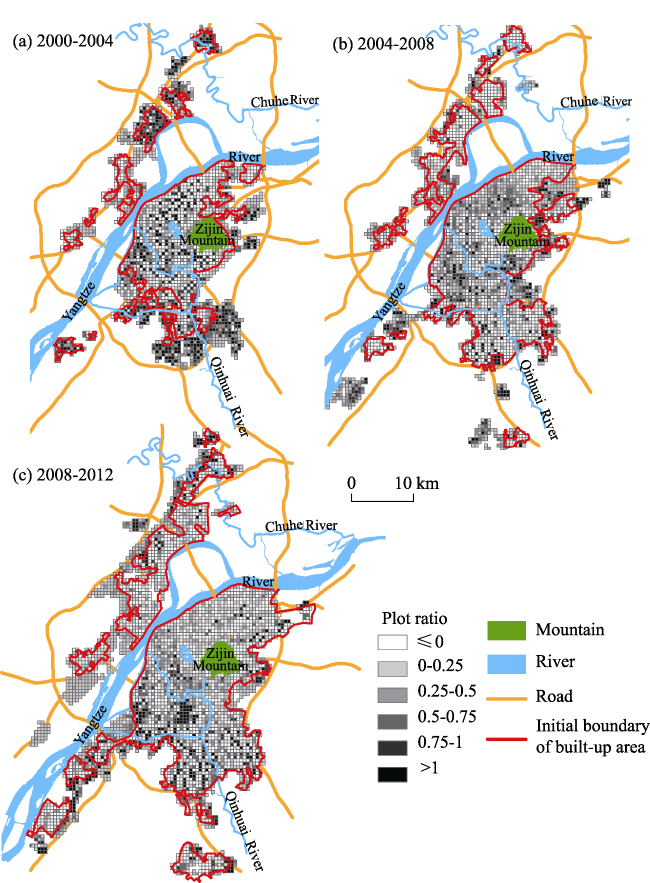
Gruen, 1998). Statistically, by the end of 2012, China included 5 of the top 10 cities in the world with the highest number of high-rise buildings over 24 m (8 floors). From the perspective of the spatial organization of urban land use, urban space is three-dimensional, and three-dimensional spatial expansion is mainly reflected in the increase of building height and land plot ratio (Sun et al., 2002). However, despite the constant increase of urban building heights and the increasing contribution of vertical extension to urban volume growth, most studies have only analyzed urban morphology evolution and spatial expansion from a two-dimensional perspective, ignoring the city’s vertical stretch and land use intensity change. This, to a certain extent, affects the understanding of the evolution of the urban spatial form as well as land use change laws. To comprehensively grasp the laws of urban spatial expansion and to promote scientific decision-making for urban planning and urban land use management, this paper considers the urban land use system as a whole, based on a multi-dimensional perspective (taking both two and three dimensions into account), and comprehensively analyzes urban spatial expansion using RS and GIS technology. To study urban expansion from a multi-dimensional perspective, multi-phase urban three-dimensional models must be constructed first. Most of the construction methods are to extract the roof profiles and building heights in different periods through high-resolution remote sensing images. Some literatures have studied the methods of extracting building height and floor area ratio information using remote sensing images (Weidner and Förstner, 1995; Seresht and Azizi, 2000; 
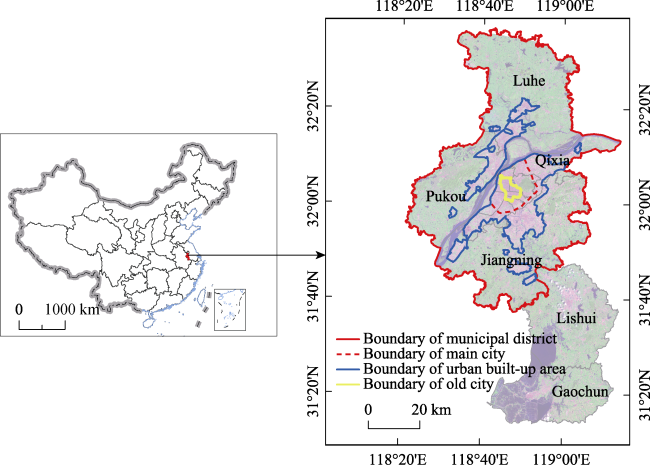
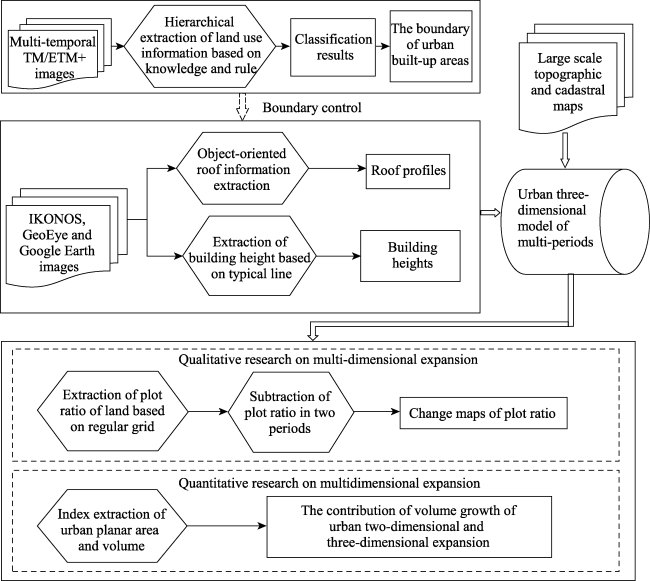
McIntosh and Krupnik, 2002), but the extraction accuracy and efficiency need to be improved. Based on the improvement of the above extraction method, this paper proposes the research method of multi-dimensional expansion of urban space (MEUS), and then conducts multi-angle study on MEUS.
As one of the central cities in the Yangtze River Delta, the urban spatial expansion of Nanjing is typical and representative (Wang et al., 2007; Chen et al., 2016b): In terms of two-dimensional spatial expansion, the proportion of urban land use in Nanjing increased rapidly after the economic reform, while the development and construction of peripheral towns gradually accelerated, and the scale of development groups continued to increase. At present, the main city and the surrounding development groups have been fully connected. Nanjing has formed a development pattern that includes one main city and three minor cities (Dongshan, Xianlin and Jiangbei), and the planar expansion of its urban built-up area is obvious. Regarding three-dimensional spatial expansion, the number of high-rise buildings in Nanjing has increased at a terrific rate since the reform. At present, the number of high-rise buildings in Nanjing ranks 19th in the world and 8th in China. This study on the expansion of urban built-up areas from a multi-dimensional perspective is therefore meaningful and can help in the discussion of MEUS research methods and enable the comprehensive understanding of MEUS laws of Nanjing.

2 Materials and methods

2.1 Study area

The research area for this study is the urban built-up area of Nanjing. Nanjing is located in southwestern Jiangsu Province, between 118°22′-119°14′E and 31°14′-32°37′N, in one of the most important economic centers of the Yangtze River Delta. The whole city of Nanjing is composed of low hills, valley plain, lakeshore plain and riverside terrain. The Yangtze River passes through the central area of Nanjing, and the tributary of the Yangtze River, Qinhuai River and Chuhe River also flow through the city. The location and natural conditions give Nanjing a unique and superior geographical environment. In 2012, there were 11 districts and two counties in Nanjing. The research area includes contiguous built-up areas in the municipal districts, and non-contiguous built-up areas that provide important functions to the city. This includes the main city and the three minor cities, Dongshan, Xianlin, Jiangbei, as well as Banqiao, Binjiang, Lukou, Qiaolin and other new cities, and peripheral development zones, ports and airports that supply important functions to the city (Figure 1). The total study area is approximately 960 km2.
Figure 1 Map of Nanjing, Jiangsu Province, China

2.2 Data sources

To study the MEUS of Nanjing, this study primarily uses four periods of remote sensing data in 2000, 2004, 2008 and 2012. TM/ETM+ images, downloaded from the U.S. Geological Survey website (http://www.usgs.gov), are used to extract urban built-up area boundaries. Land-use maps are used to assist in extracting the boundaries of urban built-up areas. The resolutions of the TM multi-spectral and panchromatic images are 30 m and 15 m, respectively. To study the MEUS of Nanjing, it is necessary to extract the outlines and heights of the buildings in urban built-up areas. To ensure the accuracy of the extraction results, high-resolution images are used in this study (Cheng and Thiel, 1995; Seresht and Azizi, 2000; Gao et al., 2008; Liu et al., 2009; Shi et al., 2009), including IKONOS and GeoEye-1 images in 2000, 2004, 2008 and 2012. The resolutions of IKONOS images are 4 m and 1 m, the resolutions of GeoEye-1 images are 1.65 m and 0.41 m. Due to the large scope of the study, large-scale (1:500) topographic maps, cadastral maps (1:500), and high-resolution historical images of Google Earth are used to assist in the interpretation of regions for which lacking high-resolution images.

2.3 Research methodology

As shown in Figure 2, the study uses four periods of TM/ETM+ images, accurately classifies remote sensing images using the hierarchical information extraction method based on knowledge and rules (Qiao et al., 2015b) and then extracts the urban built-up area boundaries based on the classification results (Song et al., 2006; Wang and Liu, 2011). The built-up area boundaries can then be used as the boundary control of the three-dimensional information extraction and can also be used to extract the urban planar scale. The three-dimensional model is constructed by using high-resolution remote sensing images such as IKONOS, GeoEye-1 and Google Earth to extract height and roof profiles of the buildings in built-up areas for each period within the boundary of each urban built-up area. The extraction of the building roof profiles uses the object-oriented information extraction method in combination with artificial interpretation (Tan, 2010), while the extraction of building heights uses the height extraction method that’s based on the typical line. The relative error of building height extracted in this paper ranges from 0.01% to 7.3% with an average error of 0.77 m (Qiao et al., 2015a). In regions lacking high-resolution images, large-scale topographic maps and cadastral maps are used to supplement the information sources, and finally, urban three-dimensional models for multiple periods are created (Qiao, 2013). The urban three-dimensional model constructed in this way has the characteristics of LOD1 level in detail. Details of the construction methods of the urban multi-period 3D model and the accuracies of the land use classification and building height extraction were published in an earlier series of articles for this study (Qiao et al., 2015a, 2015b).
Figure 2 Technical flowchart of urban spatial multi-dimensional expansion research
This study conducts qualitative and quantitative research on urban multi-dimensional expansion based on urban three-dimensional models of multiple periods. The research divides the urban built-up areas of each stage into regular grids of a particular size and then calculates the plot ratio of each grid using the partitions statistical method in ArcGIS. Subtraction algorithms are used on the plot ratios of two adjacent grids to calculate changes in the plot ratios in each grid, allowing us to qualitatively analyze regional and magnitude changes of plot ratios. Additionally, the planar area and total urban volume during each period are calculated based on the urban three-dimensional model for each stage, and the planar area growth and volume growth for each period are then calculated. Subsequently, the urban volume growth area can be divided into two facets, one being the increasing height of buildings and the internal tapping that leads to volume growth, while the other is the epitaxial expansion and the new buildings that leading to volume growth. The percentage that each aspect contributes to the total volume growth is called the contribution rate of volume growth, and we can judge characteristics on urban multi-dimensional expansion for each period by calculating the contribution rate of volume growth.

3 Analysis of urban spatial multi-dimensional expansion in Nanjing

3.1 Generation of plot ratio change maps in urban built-up areas for each period

According to the technique design in Figure 2, four periods of urban three-dimensional models in 2000, 2004, 2008 and 2012 are established. Based on this, the plot ratio change maps in urban built-up areas for each period are generated. This paper proposed to study changes in plot ratio based on a regular grid pattern. To determine the grid size, we performed prospective tests using ten grid size options ranging from 100 m to 1000 m, with intervals of 100 m. We found that in the context of Nanjing urban built-up areas, computation is moderate with grids of 500 m and that size well reflects the plot ratio change laws in the entire urban built-up area. Some buildings fall in multiple adjacent grids due to a regular grid pattern being used as the computational element. To ensure statistical accuracy of the building volume within the computational element, we performed overlay analysis on the three-dimensional model and the regular grid for each period in the research area before executing the statistics and split any building that fell between adjacent grids into two or more buildings. We calculated the volume of each building and the average plot ratio of each grid, in combination with the height of buildings based on the calculation of the floor space of each building within the grid. We performed subtraction algorithms on the average plot ratio for two adjacent grids of each period (by subtracting the previous period from the latter period) using GIS spatial overlay analysis (Han et al., 2005). Then, we generated a chart of plot ratio changes in urban built-up areas for the three periods (2000-2004, 2004-2008 and 2008-2012) according to the statistics of the regular grid (Li et al., 2007; Zha, 2011). The diagram has boundary lines of the urban built-up areas for each initial period. Therefore, two situations are reflected within the line; one is the internal tapping of construction land, and the other is the reconstruction of the old city leading to the increase of urban spatial expansion. The situation of urban expansion leading to an increase of urban space is reflected beyond the line (Li, 2007). A small amount of grid data may be negative after subtracting, mainly due to the removal of old buildings in the grid during that period, with new buildings having not yet been built by the end of the period. Using the groupings of ≤0, 0-0.25, 0.25-5, 0.25-0.75, 0.75-1 and >1, we divide the plot ratio variations of each grid into six levels and represented them in different colors. The plot ratio change maps are shown in Figure 3.
Figure 3 Staged variation maps of land use expansion and plot ratio change in Nanjing for 2000-2004 (a), 2004-2008 (b) and 2008-2012 (c)

3.2 Analysis of plot ratio changes in Nanjing urban built-up areas

Because the boundary of the urban built-up area in the initial period is marked on the plot ratio change map, we can analyze the two-dimensional and three-dimensional expansions of the urban built-up area at the same time. The planar expansion and the expansion intensity are reflected outside of the boundary, and the plot ratio change in the urban built-up area is reflected within the boundary.
(1) Plot ratio changes from 2000 to 2004. The planar expansion of urban space was concentrated mainly in the south and southeast of the city, including the core area of Xianlin University City, most regions of Qilin town, the western regions of Refinery, south and east of the Jiangning district, the pre-construction of the Olympic New City, northeast of Nanjing Chemical Industrial Park, the Luhe Development Zone, Nanjing University of Information Science and Technology and its surroundings, etc. For plot ratio changes in built-up areas, the grid plot ratio along both sides of the main roads within the city grew rapidly. The plot ratio of the Hexi area in the Gulou District displayed fast growth. The plot ratio of the Dachang area north of the Yangtze River and the old town in Luhe also grew rapidly and were the main areas of urban construction land reconstruction and internal potential development (IPD) in Nanjing for the four years from 2000 to 2004. For plot ratio changes in new expansion areas of the city, the plot ratio of added residential areas in Jiangning and Xianlin were large, and more grids with values over 1 are generated in these areas. However, for the rest of the newly added construction area, the plot ratio is general, with most grids having average values below 0.5 (Figure 3a).
(2) Plot ratio changes from 2004 to 2008. During this period, the planar expansion of urban space was in the east, north and west of the Xianlin core area, the Shangfang Industrial Park, east and south of Jiangning, Lukou New City, the Yuhua Development Zone, the Binjiang Development Zone of Jiangning, etc. The planar expansion speed was fast during this period as a large area of cultivated land around the city occupied. The overall performance showed that radial expansion was evident. From the view of plot ratio changes within the built-up areas, changes were large along both sides of the main roads, as well as the Hexi area and east and north of the main urban area. Overall, the IPD intensity was somewhat low. There was a scattered distribution of grids with great changes in plot ratio, which reflects that the pace of reconstruction and IPD in this city was slowing down from 2004 to 2008, integration of elements was not concentrated, the scale was small, and urban transformation was sporadic. For the newly built-up areas, the plot ratios were not very high compared to the period from 2000 to 2004. Higher plot ratio existed only in some residential areas (Figure 3b).
(3) Plot ratio changes from 2008 to 2012. The planar expansion of urban space was mainly reflected in the construction of the development zones of Luhe, Pukou and other areas, the eastward and southward expansion of Xiongzhou town in Luhe, the construction of the southern area of the Binjiang Development Zone, etc. During this period, only a small amount of planar expansion occurred in Jiangning, Xianlin. Urban expansion and the construction of development zones were the main causes for planar expansion. The construction of development zones was mostly in the form of infrastructure construction, road network had been basically formed and standard workshops were built in some areas. The new urban construction land was used to build regular multi-story residential areas and the land use intensity in these areas was relatively high. The plot ratio change characteristics in urban built-up areas were development and construction near the Nanjing South Railway Station and the Olympic New City from 2008 to 2012, which significantly increased the urban three-dimensional space of these two locations. Most high-rise buildings that were built on commercial finance land along the Zhongshan East Road, the Zhongshan Road, the Zhongshan North Road and other roads within the main urban area, helped to increase the urban three-dimensional space of these areas. In addition, the development and construction of high-rise and multi-story residential areas in Jiangning, Xianlin, Luhe and Pukou also helped to improve the plot ratios in these areas. Urban sprawl slowed, but IPD significantly sped up. The areas in which plot ratio increased were more concentrated and had a clustered distribution with larger areas. This reflected an obvious increase in the contribution rate of three-dimensional spatial expansion for urban spatial expansion (Figure 3c).

3.3 Analysis of the quantitative characteristics of MEUS

In the process of urban spatial growth, planar expansion is always accompanied by growth in three-dimensional space. One aspect of this growth is the expansion of the planar scale, while another is the filling in of the original urban internal space through the increase in building heights and plot ratios. Using four periods of urban three-dimensional models along with the geostatistical method, urban built-up area, urban volume and other data for different periods are calculated. Followed by the calculation of the urban planar expansion area, the amount of volume growth, the amount of IPD volume growth, the amount of planar expansion volume growth and its corresponding contribution rate of volume growth are extracted during each period. In order to better analyze the relationship between urban two-dimensional expansion and three-dimensional expansion, as many indicators as possible are selected to analyze urban multi-dimensional expansion. It is of great significance to grasp the characteristics of urban expansion during each period, and can also provide a basis for urban planning management and urban land use. The statistical data are shown in Table 1.
Table 1 Volume growth contribution of two-dimensional and three-dimensional urban spatial expansion in Nanjing
Serial No. Index 2000-2004 2004-2008 2008-2012
(1) Area of the city at the beginning of the period (km2) 354.10 533.37 754.50
(2) Area of the city at the end of the period (km2) 533.37 754.50 960.08
(3) Urban planar expansion area (km2) 179.27 221.13 205.58
(4) Growth rate of urban planar area (%) 50.63 41.46 27.25
(5) Total urban volume at the beginning of the period (m3) 9.19×10⁸ 1.39×10⁹ 1.70×10⁹
(6) Total urban volume at the end of the period (m3) 1.39×10⁹ 1.70×10⁹ 2.07×10⁹
(7) Total volume at the end of the period within the urban planar scope at the end of the period (m3) 1.02×10⁹ 1.46×10⁹ 1.97×10⁹
(8) Volume growth of urban IPD (m3) 1.04×10⁸ 7.59×10⁷ 2.72×10⁸
(9) Volume growth of urban planar expansion (m3) 3.64×10⁸ 2.34×10⁸ 9.88×10⁷
(10) Volume growth of IPD per unit area (m3/km2) 2.94×10⁵ 1.42×10⁵ 3.61×10⁵
(11) Total amount of urban volume growth (m3) 4.69×10⁸ 3.10×10⁸ 3.71×10⁸
(12) Growth rate of total urban volume (%) 50.97 22.32 21.87
(13) Contribution rate of volume growth of urban expansion (%) 77.79 75.49 26.62
(14) Contribution rate of volume growth of urban IPD (%) 22.21 24.51 73.38

Note: (4)=((2)-(1))/(1); (8)=(7)-(5); (9)=(6)-(7); (10)=(8)/(5); (12)=((6)-(5))/5; (13)=(9)/(11); (14)=(8)/(11)

Table 1 shows that the growth rates of the planar area for the three periods were 50.63%, 41.46% and 27.25%. During 2008-2012, the planar growth rate had a significant reduction. The volume growth rates for the three periods were 50.97%, 22.32% and 21.87%. The volume growth rates for the last two periods were significantly lower than the first period, but the difference between the last two periods was small. The ratios between the planar area growth rate and the urban volume growth rate were 1.01, 0.54 and 0.80 respectively. The intensity degree of urban spatial growth changed from relatively high to low and then gradually rose.
Based on the data in Table 1, the quantitative characteristics of MEUS in each stage can be determined and are as follows:
(1) 2000-2004: Planar expansion plays the main role, IPD intensity was large, but the contribution rate was not high. During this period, urban planar expansion is in the accelerating stage and the annual average expansion is 44.82 km2. IPD intensity is high, and the volume growth of IPD per unit area is 2.94×10⁵ m3/km2. Urban planar expansion was mainly reflected in the construction of residential areas and the core area of University City. In the expansion area, the plot ratio is relatively high. MEUS had two characteristics at this stage. On the one hand, urban sprawl is relatively fast, the built-up area is growing rapidly, and at the same time, the utilization efficiency and expansion intensity are higher. On the other hand, the scale of IPD is larger, and planar expansion and IPD were carried out at the same time. IPD intensity was high but the contribution rate of volume growth was not high due to the volume growth of planar expansion also being large. The contribution rate was only 22.21%.
(2) 2004-2008: Planar expansion accelerated, and IPD intensity slowed down. During this period, urban planar expansion was at the high-speed expansion stage, and the annual average expansion was 55.28 km2. The volume growth of IPD per unit area was just 1.42×10⁵ m3/km2, and the strength was less than half of that in 2000-2004. The main performance of urban space growth was the volume growth resulting from planar expansion. The IPD of urban built-up area was weak. The speed of urban planar expansion was fast during this period, and the expansion mode of urban construction land was relatively rough and simple. The utilization intensity of new construction land decreased significantly compared with that of the previous period, and the reasons were as follows: On the one hand, the area of urban planar expansion increased rapidly in a short time; on the other hand, the construction of the industrial park was the main cause of the expansion in this period and the plot ratio was low. At the same time, MEUS in Nanjing was unbalanced due to the low intensity and scale of IPD, and urban volume growth depended mainly on the volume growth of the new built-up areas.
(3) 2008-2012: Planar expansion slowed down, and IPD intensity increased. The speed of urban planar expansion slowed down during 2008-2012, and the annual average expansion was 51.40 km2. The volume growth of IPD per unit area was 3.61×10⁵ m3/km2; this is the highest level for the three periods, and the intensity increases obviously compared to the intensity in 2004-2008. The volume growth contribution rate of urban planar expansion only accounted for 26.62% of the total volume growth because most of the buildings within the expanded section had not been completed. The effect of IPD was obvious during this period, the volume growth of IPD was up to 2.72×10⁸ m3. The volume growth of IPD and the volume growth of IPD per unit area reached the highest levels in history, which reflected that Nanjing paid greater attention to the adjustment and optimization of the structure of inner urban construction land from 2008 to 2012. Making urban IPD an important means of urban spatial growth (Zhao et al., 2010).

4 Conclusions and discussion

4.1 Conclusions

(1) This paper builds multi-temporal urban three-dimensional models using remote sensing and GIS technology. On the basis of the three-dimensional models, this study extracts urban land plot ratios by means of zonal statistics based on regular grids and then qualitatively analyzes the region and magnitude of urban two-dimensional and three-dimensional expansion through plot ratio change maps, which are generated using the overlay analysis method. In addition, based on the urban three-dimensional model, this study uses the geostatistical method to analyze the numerical characteristics of MEUS and quantitatively analyzes the characteristics of MEUS in Nanjing for different stages based on the concept of the volume growth contribution rate. The method adopted in this paper can effectively analyze the law and characteristics of MEUS, and it has applicability to MEUS research in other regions. At the same time, it has good application potential in urban planning, land management, smart city construction, and disaster prevention and mitigation.
(2) Taking Nanjing as an example, this paper qualitatively and quantitatively analyzes the law of MEUS since the new century in 2000-2004, 2000-2008 and 2008-2012. The results show the following: (i) During 2000-2004, planar expansion played the main role, and IPD intensity was high with lower volume growth contribution rate. The planar space expansion was mainly concentrated in the south and southeast of the city. Aside from the residential plot ratio in the newly constructed areas of Jiangning and Xianlin being large, the plot ratio for the rest of the newly construction area was average. (ii) During 2004-2008, planar expansion accelerated, and IPD intensity slowed down. The volume growth of IPD per unit area was only 1.42×10⁵ m3/km2, less than half of the previous stage. The urban planar expansion occupied a large portion of cultivated land around the city. Generally, the urban expansion occurred through distinct radial expansion. At the same time, the grids whose plot ratio changed greatly were dispersedly distributed, the scale of IPD was small and had sporadic transformation. Compared with the former stage, the plot ratio of the newly expanded area was not very high. (iii) During 2008-2012, planar expansion slowed down, and IPD intensity was greater. The volume growth of IPD per unit area was 3.61×10⁵ m3/km2, which was the highest level of the three periods. Urban expansion and development zone construction held a large proportion in the planar expansion, and the speed of urban planar expansion slowed down. The regions whose plot ratios increased in the built-up area were relatively concentrated, with clustered distribution and large areas, and the contribution rate of the three-dimensional spatial expansion to urban spatial expansion obviously increased.
(3) In the three periods, the average annual urban planar expansion was 44.82 km2, 55.28 km2 and 51.40 km2, and the average annual volume growth was 1.17×10⁸ m3, 7.75×10⁷ m3 and 9.28×10⁷ m3. The ratio between the growth rate of the planar area and the growth rate of urban volume was 1.01, 0.54 and 0.80, which indicated that the intensive degree of urban spatial growth changed from relatively high to low, then rose gradually. The contribution rate of volume growth to urban IPD during the three periods was 22.21%, 24.51% and 73.38%, which reflected that Nanjing began to pay more attention to the adjustment and optimization of the structure of urban inner construction land; urban renewal efforts continued to strengthen in the third stage.

4.2 Discussion

This paper provides a beneficial discussion on the research method of MEUS. However, because the paper mainly adopts the use of remote sensing images for the construction of urban three-dimensional models, we failed to take into account the expansion of underground space. In this paper, the urban three-dimensional model only extracted roof profile and building height, but for a large portion of the urban built-up area, the workload of the construction of a multi-temporal urban three-dimensional model is still huge, so improving the automation level of modeling will be an urgent need to be addressed in future research.

The authors have declared that no competing interests exist.

[1]
Anas A, 1976. Short-run dynamics in the spatial housing market. In: Papageorgiou G J (eds.). Mathematical Land Use Theory. Lexington: Lexington Books, 262-275.

[2]
Chen J L, Gao J L, Yuan F, 2016a. Growth type and functional trajectories: An empirical study of urban expansion in Nanjing, China.PLoS ONE, 11(2): e0148389. doi: 10.1371/journal.pone.0148389.Abstract Drawing upon the Landsat satellite images of Nanjing from 1985, 1995, 2001, 2007, and 2013, this paper integrates the convex hull analysis and common edge analysis at double scales, and develops a comprehensive matrix analysis to distinguish the different types of urban land expansion. The results show that Nanjing experienced rapid urban expansion, dominated by a mix of residential and manufacturing land from 1985 to 2013, which in turn has promoted Nanjing's shift from a compact mononuclear city to a polycentric one. Spatial patterns of three specific types of growth, namely infilling, extension, and enclave were quite different in four consecutive periods. These patterns result primarily from the existing topographic constraints, as well as government-oriented urban planning and policies. By intersecting the function maps, we also reveal the functional evolution of newly-developed urban land. Moreover, both self-enhancing and mutual promotion of the newly developed functions are surveyed over the last decade. Our study confirms that the integration of a multi-scale method and multi-perspective analysis, such as the spatiotemporal patterns and functional evolution, helps us to better understand the rapid urban growth in China.

DOI PMID

[3]
Chen J L, Gao J L, Yuan F et al., 2016b. Spatial determinants of urban land expansion in globalizing Nanjing, China.Sustainability, 8(9): 868. doi: 10.3390/su8090868.

DOI

[4]
Cheng F, Thiel K H, 1995. Delimiting the building heights in a city from the shadow in a panchromatic SPOT-image: Part 1. Test of forty-two buildings.Remote Sensing, 16(3): 409-415. doi: 10.1080/01431 169508954409.

DOI

[5]
Chi W F, Shi W J, Kuang W H, 2015. Spatio-temporal characteristics of intra-urban land cover in the cities of China and USA from 1978 to 2010. Journal of Geographical Sciences, 25(1): 3-18. doi: 10.1007/s11442-015- 1149-z.Urban land cover has major impacts on a city's ecosystem services and the inherent quality of its urban residential environment. The spatio-temporal distribution of impervious surface area and green areas in Chinese cities has exhibited a significantly marked difference in comparison with USA cities. This study focused on monitoring and comparing the spatio-temporal dynamics, land cover patterns and characteristics of functional regions in six Chinese(n=3) and USA(n=3) cities. The study data were collated from Landsat TM/MSS imagery during the period 1978 2010. Results indicate that Chinese cities have developed compactly over the past three decades, while development has been notably dispersed among USA cities. Mean vegetation coverage in USA cities is approximately 2.2 times that found amongst Chinese urban agglomerations. Land use types within Chinese cities are significantly more complex, with a higher density of impervious surface area. Conversely, the central business district(CBD) and residential areas within USA cities were comprised of a lower proportion of impervious surface area and a higher proportion of green land. Results may be used to contribute to future urban planning and administration efforts in both China and the USA.

DOI

[6]
Gao X, Zhao D L, Zhang W, 2008. On the methods of obtaining the building height information from high-resolution remote sensing images.Bulletin of Surveying and Mapping, (3): 41-43. (in Chinese)

[7]
Gruen A, 1998. TOBAGO: A semi-automated approach for the generation of 3D building models. ISPRS Journal of Photogrammetry & Remote Sensing, 53(2): 108-118. doi: 10.1016/S0924-2716(97)00034-8.

[8]
Han X P, Xu J G, Fu X M, 2005. A study on estimating urban FAR based on high-resolution satellite images.Remote Sensing Information, (2): 24-28. (in Chinese)First, some common methods used for estimating urban Floor Area Ratio(FAR) are summarized in this paper. Then a new method based on the data of high resolution satellite images is brought up for estimating urban FAR in large area, which is named shaded area method. The shaded area method has been implemented for estimating urban FAR of Shanghai central district. Finally, the estimating accuracy and the problems generated in estimating urban FAR are analyzed in this paper. This study indicates that the shaded area method is fast and efficacious, and can meet the demand of dynamic monitoring on spatial construction of a metropolis.

[9]
Kumar M, Tripathi D K, 2014. Spatial monitoring of urban growth of Nagpur City (India) using geospatial techniques.Journal of Settlements & Spatial Planning, 5(2): 91-98.

[10]
Li F X, 2007. Research on urban expansion information tupu of Nanjing [D]. Nanjing: Nanjing University. (in Chinese)

[11]
Li J Y, Zhang L, Wu B Fet al., 2007. Study on extracting building density and floor area ratio based on high resolution image. Remote Sensing Technology and Application, 22(3): 309-313. (in Chinese)Based on the analysis of the relationship between building-height and shadow-width in the high resolution satellite image-QuickBird,the paper applies the result of extracting building heights from shadow in image to the field of estimating FAR,and realizes estimating building density and FAR fast and efficaciously. Taking YuZhong District,ChongQing city for instance,by comparative analyzing the building density and FAR of the district,it can be found that the urban layout is profoundly affected by economy.The general laws are with the growing of economy,FAR improves,while the building density falls.The validating result shows that the accuracy of estimating floor-number has reached 88.3%,which has demonstrated prospecting applications of satellite remote sensing for urban purpose.

[12]
Liu F, Zhang Z X, Shi L F et al., 2016. Urban expansion in China and its spatial-temporal differences over the past four decades. Journal of Geographical Sciences, 26(10): 1477-1496. doi: 10.1007/s11442-016-1339-3.The urban expansion process in China from the 1970s to 2013 was retrieved based on remote sensing and GIS technology. With the latest zoning method used as reference, annual expansion area per city, urban expansion type, and fractal dimension index were employed to analyze the Chinese urban expansion characteristics and its spatial difference from the aspects of urban expansion process, influence of urban expansion on land use, and urban spatial morphological evolutions. Results indicate that 1) under the powerful guidance of policies, urban expansion in China went through six different stages, and cities in the eastern region entered the rapid expansion period the earliest, followed by cities in the central, northeastern and western regions; 2) cultivated lands and rural settlements and industrial traffic lands were the important land sources for urban expansion in China; the influence of urban expansion on land use in the eastern region was the strongest, followed by the central, northeastern and western regions; 3) urban spatial morphology tended to be complex and was directly related to the adopted spatial expansion mode. Infilling expansion became the main urban expansion mode in the western region first, then in the central and northeastern regions, and finally in the eastern region. This study establishes the foundation for an in-depth recognition of urban expansion in China and optimization of future urban planning.

DOI

[13]
Liu L F, Wang R J, Dong W P et al., 2009. A fast method extracting building height using high resolution satellite image.Remote Sensing Technology and Application, 24(5): 631-634. (in Chinese)Height of a building is an important element in the city disaster evaluation and prediction.Up to now,several methods have been developed to estimate the height of a building using single satellite image with a high resolution.However,the accuracy and calculation speed are not ideal for application.To solve this problem,this paper developed a new fast method.In this method,the distance between a pair of matched points was used.The result showed that the accuracy of this new method was higher(less than 2.04 meters)and it could be wildly used in prediction and assessment of city disaster.

[14]
Liu M H, Chen Y G, 2001. Experimental methods of geographical researches: From modeling material objects to computer simulation. Journal of Xinyang Teachers College (Natural Science Edition), 24(1): 209-213. (in Chinese)The experimental methods of geographical researches has different stages of development which are:1.Modelling macro material objects in micro scales;2.Mathematical experiments;3.Analyses of geographical information systems (GIS);4.Fractal and cellular automata (CA)simulation.In the end,all the methods mentioned above reach the same goal by different routes:computer based simulation.We presented that it is the main stream in the future for geographic simulation to develop metasynthetic technique by integrating GIS and CA models,and making use of artificial neural nets(ANN),genetic algorithms(GA),etc,especially utilizing the multiagent system (MAS),which maybe intellecutalize our computer based simulation systems.

[15]
Liu Y S, Fang F, Li Y H, 2014. Key issues of land use in China and implications for policy making.Land Use Policy, 40(4): 6-12.The paper aims to comprehensively analyze key issues of current land use in China. It identifies the major land-use problems when China is undergoing rapid urbanization. Then, the paper interprets and assesses the related land-use policies: requisition-compensation balance of arable land, increasing vs. decreasing balance of urban-rural built land, reserved land system within land requisition, rural land consolidation and economical and intensive land use. The paper finds that current policies are targeting specific problems while being implemented in parallel. There is lacking a framework that incorporates all the policies. The paper finally indicates the current land-use challenges and proposes strategic land-use policy system to guide sustainable land use in the future.

DOI

[16]
Liu Y S, Li Y H, 2017. Revitalize the world’s countryside.Nature, 548(7667): 275-277.

DOI

[17]
Maimaiti B, Ding J L, Simayi Z, 2017. Characterizing urban expansion of Korla City and its spatial-temporal patterns using remote sensing and GIS methods.Journal of Arid Land, 9(3): 458-470.

DOI

[18]
McIntosh K, Krupnik A, 2002. Integration of laser-derived DSMs and matched image edges for generating an accurate surface model.ISPRS Journal of Photogrammetry and Remote Sensing, 56(3): 167-176.Airborne laser altimetry is a highly efficient and accurate method of obtaining data for the determination of visible surface topography. With minimal processing, the laser data can provide coordinates of points on the visible surface with high spatial frequency and precision. Although this technology has benefits compared to photogrammetric techniques, there are limiting factors due to the laser data having no structural and textural information. These limitations are significant in low-density laser data and may be overcome by utilizing both laser altimetry and photogrammetrically derived data in the surface determination process. The research described in this paper has been undertaken to accurately determine the visible surface in urban areas using airborne laser scanner data and digital aerial images. Edges detected and matched in aerial images are used to refine the digital surface model (DSM) produced from airborne laser scanner data. The laser data and the edge information are merged to exploit the benefits of each dataset, facilitating the generation of an accurate surface model. This model provides a better representation of surface discontinuities, especially building walls. The paper presents the algorithms developed and shows that the surface accuracy is improved by 49% and 15% for the two tested areas, respectively.

DOI

[19]
Qiao W F, 2013. Study on urban spatial multidimensional expansion of Nanjing based on land use perspective [D]. Nanjing: Nanjing Normal University. (in Chinese)

[20]
Qiao W F, Liu Y S, Xiang L Z et al., 2015a. Research on extracting building height rapidly based on high-resolution remote sensing images without parameters.Journal of Geo-information Science, 17(8): 995-1000. (in Chinese)There is a pressing need to extract building height rapidly based on high-resolution remote sensing images without parameters in the field of urban construction and land management. Current studies are mostly based on remote sensing images with parameters, however the images used for extraction are difficult to get, and current extraction methods have a lot of restrictions. In this paper, a new method is proposed with the use of four types of characteristic lines. The characteristic lines are comprehensively formed by the characteristic points on a single image, which is used to convert the building height based on high-resolution images without parameters.The four types of characteristic lines include: the connection line of the roof displacement point and roof shadow point, the displacement of the roof image point caused by the building height, the full-length shadow, the remaining length of the shadow excluding the part occluded by building. Four types of calculation model for acquiring building height based on the corresponding characteristic lines are deduced. According to the known heights of a small amount of constructions and using the four calculation models, the relevant parameters of remote sensing images can be derived conversely. Then, we can select the characteristic lines that are extracted most accurately on each building, and use the corresponding model to convert the building height. With the application of this method, a large number of building heights can be calculated quickly and accurately. The method is verified based on Google Earth image in Nanjing city and the results show: the images used in this approach are easy to acquire; the method of comprehensive measurement and calculation does not merely rely on the use of shadow lengths to calculate building height, so it significantly increases the practicality of extracting building height on a single image; it solves the issue that there is no related angle parameters of the sun and the satellite position when calculating the building height. Case study indicated that the precision of the proposed method is high, and it can extract the building height quickly in a large area. Generally, the method proposed in this paper has significant practical value in production applications.

DOI

[21]
Qiao W F, Wang Y H, Xiang L Z, 2015b. Hierarchical extraction of land use information based on knowledge and rule. Resources and Environment in the Yangtze Basin, 24(7): 1079-1085. (in Chinese)

[22]
Quan B, Bai Y J, Römkens M J M et al., 2015. Urban land expansion in Quanzhou city, China, 1995-2010.Habitat International, 48: 131-139. doi: 10.1016/j.habitatint.2015.03.021.61Urban land in Quanzhou has increased more than twofold between 1995 and 2010.61Urban land expansion took place in the city districts and around industrial zones in Quanzhou.61Urban land expansion was slower in Quanzhou than Shenzhen and Dongguan.61Quanzhou's reliance on labor-intensive industries has influenced its population growth and urbanization.

DOI

[23]
Seresht M S, Azizi A, 2000. Automatic building recognition from digital aerial images.International Archives of Photogrammetry and Remote Sensing, 33(B3/2; PART 3): 792-798.

[24]
Shi L Y, Shao G F, Cui S Het al., 2009. Urban three-dimensional expansion and its driving forces: A case study of Shanghai, China. Chinese Geographical Science, 19(4): 291-298. doi: 10.1007/s11769-009-0291-x.Urban expansion is a phenomenon of urban space increase,and an important measuring index of the process of urbanization.Taking Shanghai as an example,the changes of urban average height and built-up area were studied to represent city's vertical and horizontal increases respectively,and statistical methods were used to analyze the driving forces of urban expansion.The research drew following conclusions:1) The urban expansion process of Shanghai from 1985 to 2006 had a clear periodic feature,and could be divided into three stages:vertical expansion in dominance,coordinated vertical and horizontal expansion,and horizontal expansion in dominance.2) The average height and quantity of buildings in core city were significantly bigger than those in suburbs,but the changing speed of the latter was faster.And 3) urbanization process was the major driving force for the city's horizontal expansion,while industrial structure improvement was the key driving factor for the vertical expansion.Those two driving forces were simultaneously affected by city's political factors.

DOI

[25]
Song X D, Liu P, Zhou Y X, 2006. Urban and rural area division: Taking Shanghai as an example.Acta Geographica Sinica, 61(8): 787-797. (in Chinese)

[26]
Sun M, Ma A N, Chen J, 2002. Review on three-dimensional city model research. Journal of Remote Sensing, 6(2): 155-160.(in Chinese)The three-dimensional GIS (3DGIS) has been developed for a long time, but with the research work goes further deep, it is found that it's almost impossible to establish a common 3DGIS platform, because objects data modeling and its spatial relationship expression is so difficult. As city is the central place that people living and information spreading, doing research of 3-dimensional urban GIS not only has great significance, but it is also one urgent problem that people want to resolve. Thus three Dimensional City Model (3DCM) research becomes a hot area in GIS field in recent years. The 3DCM research also has great significance in traffic, terra, mine, survey, and other fields, especially in city planning, construction, and environmentology. The 3DCM research has made a great progress in Japan, Germany, Austria, Canada and China. The 3DCM researches have been done abroad, and many works are largely related to specific applications.In addition, people still have no common understanding to 3DCM concept and its research meaning. In this paper, the authors consider that the `3-Dimensional City Model' is a suitable concept, and 3DCM content meaning should include: various 3D entities data modeling, huge data management, 3D spatial relationship expression and operation, 3D spatial data storage, manage and query, and large city area real-time visualization etc. To 3DCM theory research works, methods used in data modeling could be classified into three types: method based on DEM and images, method based on primitives and 2DGIS, and method based on 3D data structure. For data management, the majority of systems are still using 2DGIS, while 3D expression only used in 3D visualization, and few systems manage and express 3D objects using 3D expression in its fundamental. At present 3DCM mainly uses CAD to establish objects model, and 2DGIS has managed a large number of data, so the main research works focus on 3D data and texture capture, as well as 3D objects reconstruction based on images. Although 3DCM research works have got a rapid progress, many problems still exists, e.g., data modeling needs further research works. Present model could only express regular 3D entities, and it's difficult to express complex 3D entities. At the same time, present 3DCM system could only provide animation and fly functions, and many research works still need to be done in side of spatial query and spatial operation.

DOI

[27]
Tan Q L, 2010. Urban building extraction from VHR multi-spectral images using object-based classification.Acta Cartographica Sinica, 39(6): 618-623. (in Chinese)

[28]
Triantakonstantis D, Stathakis D, 2015. Examining urban sprawl in Europe using spatial metrics.Geocarto International, 30(10): 1092-1112. doi: 10.1080/10106049.2015.1027289.

DOI

[29]
United Nations (UN), 2008. World Urbanization Prospects: The 2007 Revision. New York: United Nations, 3-4.

[30]
Wang L, Li C C, Ying Q et al., 2012. China’s urban expansion from 1990 to 2010 determined with satellite remote sensing.Chinese Science Bulletin, 57(22): 2802-2812. doi: 10.1007/s11434-012-5235-7. (in Chinese)Based on the same data source of Landsat TM/ETM+ in 1990s, 2000s and 2010s, all urban built-up areas in China are mapped mainly by human interpretation. Mapping results were checked and refined by the same analyst with the same set of criteria. The results show during the last 20 years urban areas in China have increased exponentially more than 2 times. The greatest area of urbanization changed from Northeastern provinces in 1990s to the Southeast coast of China in Jiangsu, Guangdong, Shandong, and Zhejiang in 2010s. Urban areas are mostly converted from croplands in China. Approximately 17750 km croplands were converted into urban lands. Furthermore, the conversion from 2000 to 2010 doubled that from 1990 to 2000. During the 20 years, the most urbanized provinces are Jiangsu, Guangdong, Shandong and Zhejiang. We also analyzed built-up areas, gross domestic production (GDP) and population of 147 cities with a population of greater than 500000 in 2009. The result shows coastal cities and resource-based cities are with high economic efficiency per unit of built-up areas, resource-based cities have the highest population density, and the economic efficiency of most coastal provinces are lower than central provinces and Guangdong. The newly created urban expansion dataset is useful in many fields including trend analysis of urbanization in China; simulation of urban development dynamics; analysis of the relationship among urbanization, population growth and migration; studies of carbon emissions and climate change; adaptation of climate change; as well as land use and urban planning and management.

DOI

[31]
Wang J, Liu J, 2011. Dynamic of urban expansion in Lianyungang city based on the multi-time-phase remote sensing images: A case study of Xinpu District.Urban Geotechnical Investigation & Surveying, 1: 81-83. (in Chinese)Based on the Multi-time-phase TM/ETM+ remote sensing images,the urban border of Xinpu district of Lianyungang in different periods was extracted by RS method,and the urban expansion dynamic characteristics of Xinpu district was analyzed by the GIS technique.The result revealed the urban build-up area was on the increase.Meanwhile,the expansion rate in Xinpu district was increased during 1989 and 2007,The urban expansion obviously showed the spatial heterogeneity,with the city center moving to the northeast.At the same time,the compact index was decreasing,while the fractal index was increasing.This situation implied the urban spatial configuration has become more and more compliable.

[32]
Wang Q, Zhang Z X, Yi L et al., 2007. Research on urban expansion in Nanjing, China using RS and GIS.Resources and Environment in the Yangtze Basin, 16(5): 554-559. (in Chinese)

[33]
Wang X S, Liu J Y, Zhuang D F et al., 2005. Spatial-temporal changes of urban spatial morphology in China.Acta Geographica Sinica, 60(3): 392-400. (in Chinese)

[34]
Weidner U, Förstner W, 1995. Towards automatic building extraction from high-resolution digital elevation models.ISPRS Journal of Photogrammetry and Remote Sensing, 50(4): 38-49.This paper deals with an approach for extracting the 3D shape of buildings from high-resolution Digital Elevation Models (DEMs), having a grid resolution between 0.5 and 5 m. The steps of the proposed procedure increasingly use explicit domain knowledge, specifically geometric constraints in the form of parametric and prismatic building models. A new MDL-based approach generating a polygonal ground plan from segment boundaries is given. The used knowledge is object-related making adaption to data of different density and resolution simple and transparent.

DOI

[35]
Wen Q K, Zhang Z X, Shi L F et al., 2016. Extraction of basic trends of urban expansion in China over past 40 years from satellite images.Chinese Geographical Science, 26(2): 129-142. doi: 10.1007/s11769-016-0796-z.If urban sprawl is to be avoided in China in the next ten years, it is not only crucial to understand the overall history, current status, and future trends of urban expansion there, but also these differences, and this is presently lacking. In this study, remotely sensed images with approximately 30 m spatial resolution were used to quantitatively assess the spatial and temporal patterns of urban expansion of 60 Chinese cities(1973 2013). Urban-expansion-process curves of the cities studied were drawn using annual expansion area as an indicator. Curve similarity analysis generated four basic process modes of urban expansion in China. These included cities that: 1) peaked around 2004 and then decelerated; 2) peaked around 2010 and then decelerated; 3) showed sustained acceleration, and 4) showed continued deceleration. Four basic process modes represented cities under different levels of development stage. Geographic location was found to be the most related characteristic to urban expansion process. Regional development policies at the national level in each region also showed highly temporal consistency with fluctuation characteristics of urban expansion process. Urban characteristic such as population size and administrative level were not found to be significantly related to urban expansion-process modes. Understanding the basic process-mode categories well is extremely important for future regional-balance planning and development of macroeconomic policies.

DOI

[36]
Xu X L, Min X B, 2013. Quantifying spatiotemporal patterns of urban expansion in China using remote sensing data.Cities, 35: 104-113. doi: 10.1016/j.cities.2013.05.002.China is undergoing a major transformation of its urban structure due to its rapid economic and population growth. It is critically important to properly characterize urban expansion before developing a comprehensive understanding of urbanization processes. Using multi-temporal remote sensing data of land-use change, this paper employs urban expansion rate and intensity as well as several landscape metrics to conduct a quantitative analysis on urban expansion patterns of 18 cities in different regions in China. The results provide clear insight into the spatial heterogeneity of the urban expansion rate and intensity going back to the late 1970s. Overall, before 2000, urban expansion rate and intensity was significantly higher in the eastern region than that in the middle and western regions. After 2000, this trend reversed. The analysis showed that cities in the late 1970s had the highest spatial heterogeneity, which then significantly decreased from that point up to 2008. From the late 1980s to 2008, Chinese urban expansion patterns changed from patch infilling to patch margin expansion. Spider diagrams comprised of six landscape metrics were shown to capture characteristics of urban form and structure changes at four time stages. The 18 cities were divided into four groups based on spider diagram shape. The spider diagrams show that the first group of cities exhibit relatively stable shapes, while the other three groups of cities exhibit relatively irregular shapes. China's eastern and middle cities show a greater degree of active urbanization than China's western cities. (C) 2013 Elsevier Ltd. All rights reserved.

DOI

[37]
Yang Y Y, Liu Y S, Li Y R et al., 2018. Quantifying spatio-temporal patterns of urban expansion in Beijing during 1985-2013 with rural-urban development transformation.Land Use Policy, 74(5): 220-230.

DOI

[38]
Yin F, Feng M, Zhong Fet al., 2010. Research of urban expansion in Siping city based on remote sensing and GIS.Journal of Geo-Information Science, 12(2): 242-247. (in Chinese)

DOI

[39]
Zha Y, 2011. A study on remote sensing methods in estimating urban build-up volume ratio based on aerial photographs.Progress in Geography, 20(4): 378-383. (in Chinese)The determination of the ratio of urban built-up volume requires the height information or the number of floors of a building. The purpose of this paper is to compare the accuracy of the ratio measured with the direct, the displacement, the shadow and the parallax methods. The number of floors/height of 21 buildings is determined from 1∶2500 and 1∶4000 aerial photographs. The comparative analysis of these results shows that the direct method is the least accurate. Although the parallax method is the most accurate in determining height, its accuracy is next to that of the shadow method in estimating the ratio. The impact of the scale of the photographs used on the estimation of accuracy varies with the height determination methods. With the decrease of scale, the accuracy of the direct method improves, but the shadow and the parallax's accuracy worsens. Scale hardly affects the accuracy of the displacement method.

DOI

[40]
Zhao S Q, Zhou D C, Zhu C et al., 2015. Spatial and temporal dimensions of urban expansion in China.Environmental Science & Technology, 49(16): 9600-9609. doi: 10.1021/acs.est.5b00065.Abstract The scale of urbanization in China during the past three decades is unprecedented in human history, and the processes are poorly understood. Here we present an effort to map the urban land expansion processes of 32 major cities in China from 1978 to 2010 using Landsat satellite data to understand the temporal and spatial characteristics. Results showed that the urban extent of the 32 cities expanded exponentially with very high annual rates varying from 3.2% to 12.8%. Temporal fluctuation in urban expansion rates in these 32 cities was obvious, with unexpected and alarming expansion rates from 2005 to 2010 that drastically exceeded their expectation, which was calculated from the long-term trend between 1978 and 2005, by 45%. Overall, we found that the growth rates of cities during the entire study period were inversely related to city size, contradicting the theory or Gibrat's law, which states that the growth rate is independent of city size. More detailed analysis indicated that city growth in China has transitioned from contradicting to conforming to Gibrat's law since 1995. Our study suggests that the urban expansion theory (i.e., Gibrat's law) does not fit Chinese expansion consistently over time, and the exact causes are unknown. Exploring the causes in future research will improve our understanding of the theory and, more importantly, understand the feasibility of the theoretical relationship between city size and expansion rate in guiding contemporary urban expansion planning.

DOI PMID

[41]
Zhao X F, Huang X J, Chen Y et al., 2010. Research progress in urban land intensive use.Journal of Natural Resources, 25(1): 1979-1996. (in Chinese)Urban land intensive use is regarded as an important content for the research of urban land use change.Understanding the mechanism,process,and effects of urban land intensive use is helpful to optimize the urban spatial structure,improve the efficiency of urban land use,ease the pressure of urban development brought by resource and environmental constraints,and promote sustainable urban development.In this paper,scale,contents and methods which were presented in urban land intensive use research are concluded elaborately: 1) There are three kinds of scale in spatiality.Macro scale contains whole country,urban agglomeration and provinces;medium scale includes cities and functional region;while micro scale indicates parcel.Another scale is time which contains section data and panel data,and it maybe more valuable to analyse the variation and developing tendency of urban land intensive use with panel data.2) As for the contents,connotation,theories,evaluation,driving forces,effects and approaches are mainly discussed in the literatures.Urban land intensive use has multifunctional and dynamic characteristics,and pays more attention to land use structure,land use intensity and land use efficiency.The evaluation of urban land intensive use is widely concerned,accordingly achieves considerable achievement,which mainly includes evaluation index system,spatial differentiation,comparisons between different industry trades and potential estimation.The driving forces of urban land intensive use are affected by spatial scales and time scales.The effects and approaches of urban land intensive use are weakly concerned,especially in China.3) Some methods have been applied in researches,such as statistic analysis,econometric analysis,dynamic process model and spatial analysis.In addition,PSR model,DPSIR model and life cycle assessment are also helpful to the research.Although much progress has been made in theory and practice of urban land intensive use research,and some important results have been obtained,there still have certain problems in previous researches.Some suggestions which help to develop the research are as follows: Firstly,multi-level,multi-scale and time series research should be adequately emphasized to realize characteristics of urban land intensive use.Secondly,the theoretical foundation,intrinsic mechanism,dynamic process and comprehensive effects should be studied deeply.Lastly,econometric analysis,dynamic process model and spatial analysis should be applied extensively.

[42]
Zhang Z X, Li N, Wang X A et al., 2016. Comparative study of urban expansion in Beijing, Tianjin and Tangshan from the 1970s to 2013.Remote Sensing, 8(6): 496. doi: 10.3390/rs8060496.

DOI

Outlines

/