
Journal of Geographical Sciences >
Quantifying the vertical distribution pattern of land-use conversion in the loess hilly region of northern Shaanxi Province 1995-2015
Author: Cao Zhi, PhD, specialized in land science and rural development. E-mail: caoz.14b@igsnrr.ac.cn
Received date: 2018-07-20
Accepted date: 2018-12-20
Online published: 2019-04-19
Supported by
National Key Research and Development Program of China, No.2017YFC0504701
National Natural Science Foundation of China, No.41801175
Postdoctoral Science Foundation of China, No.2018M631558
Copyright
The mountainous and hilly region plays an important role in ecological safety and production in China. However, recent studies have poorly characterized the parallel structure of land use in the valleys of the mountainous and hilly region using topographic factors (e.g. elevation, slope, aspect). Here, the loess hilly region of northern Shaanxi Province is used as a representative case area to analyze the vertical distribution pattern of land-use conversion using the relative elevation concept and the HAND index. The differences in the vertical structure of land-use conversion between absolute elevation and relative elevation were compared. We found that the classifications of absolute and relative elevation had similar proportions of each relative elevation grade in each absolute elevation grade. Cropland, woodland, and grassland were distributed evenly in each grade of absolute/relative elevation, while water body, built-up land and unused land were more likely to spread in low grades of relative elevation than those of absolute elevation. The land-use conversion (i.e. loss of cropland and gain in woodland and built-up land) showed an apparently stepped distribution with relative elevation classification, suitable for revealing vertical distributions of land-use conversion in the loess hilly region. Cropland transformed to woodland was mainly distributed in high grade of relative elevation, decreasing with a decrease in grades, while built-up land transformed from cropland and grassland was mainly distributed in low grade of relative elevation, decreasing with increases in grades. The grade of relative elevation where cropland transformed to woodland descended with the implementation of the Grain for Green Project. Our results suggest that it is better to analyze the vertical distribution of land-use conversion with relative elevation classification in hilly regions.
CAO Zhi , LI Yurui , LIU Zhengjia , YANG Lingfan . Quantifying the vertical distribution pattern of land-use conversion in the loess hilly region of northern Shaanxi Province 1995-2015[J]. Journal of Geographical Sciences, 2019 , 29(5) : 730 -748 . DOI: 10.1007/s11442-019-1624-z
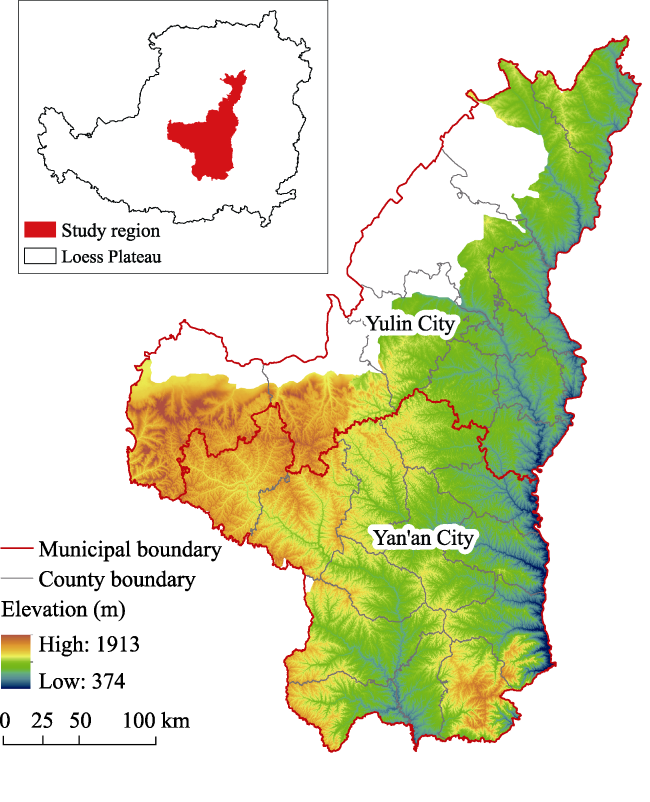
Figure 1 The digital elevation map of the loess hilly region in northern Shaanxi Province |
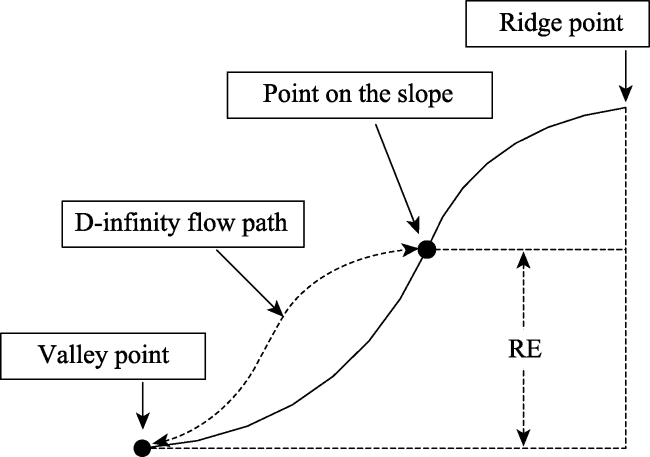
Figure 2 The schematic of relative elevation (RE) calculation method |
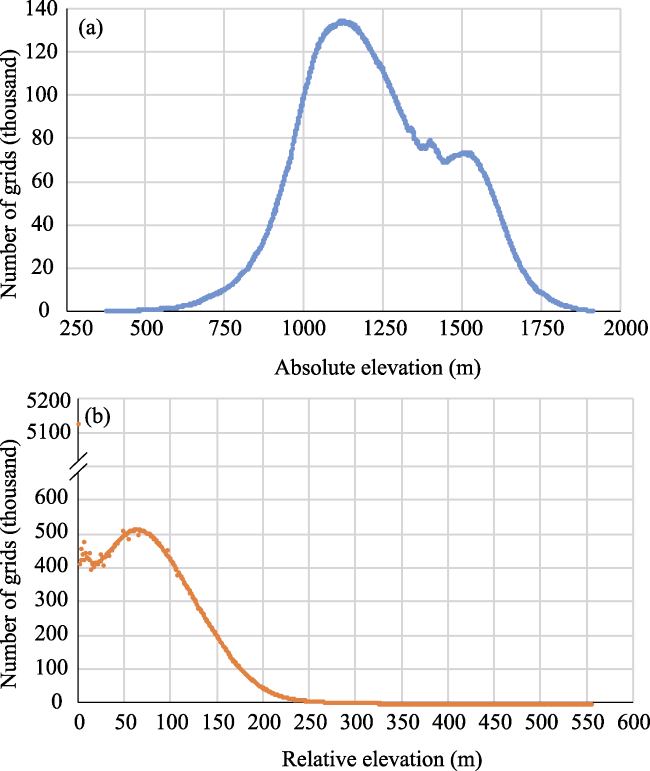
Figure 3 Statistical characteristics of grid-based absolute elevation and relative elevation in the loess hilly region of northern Shaanxi Province |
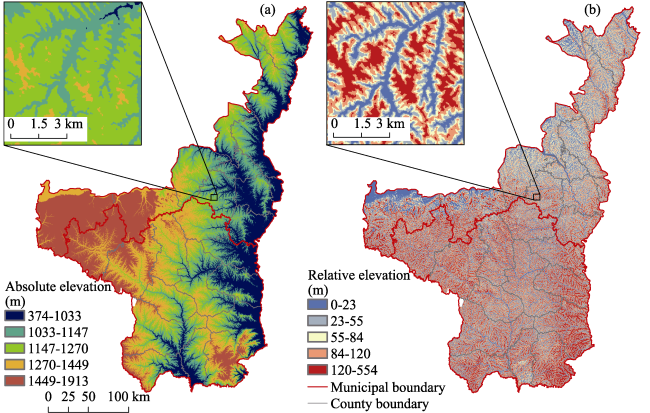
Figure 4 Patterns of grid-based absolute elevation and relative elevation in the loess hilly region of northern Shaanxi Province |
Table 1 Cross matrix between different classifications of absolute elevation (AE) and relative elevation (RE) in the loess hilly region of northern Shaanxi Province |
| Absolute elevation (m) | Relative elevation (m, %) | Total (AE) | ||||
|---|---|---|---|---|---|---|
| 0-23 | 23-55 | 55-84 | 84-120 | 120-554 | ||
| 374-1033 | 6.35 | 4.55 | 3.62 | 3.05 | 2.51 | 20.09 |
| 1033-1147 | 4.00 | 4.85 | 4.61 | 3.86 | 2.73 | 20.04 |
| 1147-1270 | 3.46 | 4.49 | 4.57 | 4.28 | 3.30 | 20.09 |
| 1270-1449 | 3.71 | 3.39 | 3.79 | 4.49 | 4.56 | 19.93 |
| 1449-1913 | 2.78 | 3.10 | 3.28 | 4.23 | 6.46 | 19.86 |
| Total (RE) | 20.30 | 20.37 | 19.87 | 19.90 | 19.56 | 100.00 |
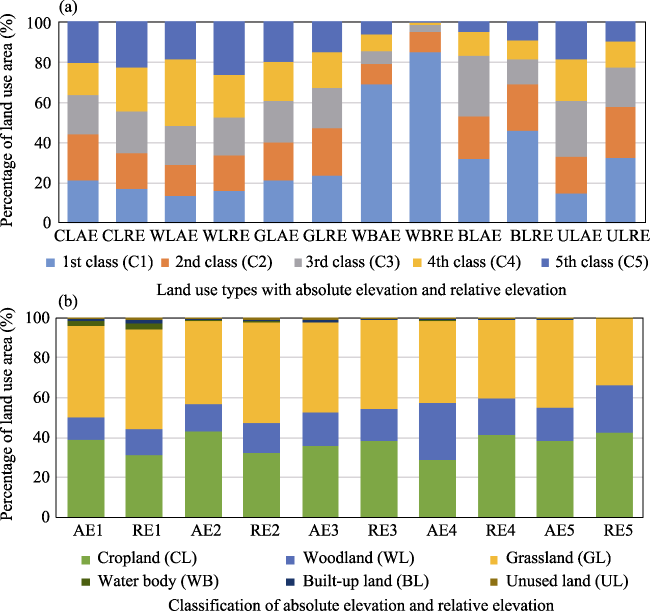
Figure 5 Structure of land use with absolute elevation and relative elevation in the loess hilly region of northern Shaanxi Province in 2015 |
Table 2 Transitions in percentages of total land use observed in the loess hilly region of northern Shaanxi Province during 1995-2000 (%) |
| Year 1995 | 2000 | Total (1995) | Loss | Net gain in 2000 | Changes in 2000 | |||||
|---|---|---|---|---|---|---|---|---|---|---|
| CL | WL | GL | WB | BL | UL | |||||
| CL | 38.98 | 0.02 | 0.03 | 0.00 | 0.01 | 0.05 | 39.09 | 0.11 | 0.01 | 0.04 |
| WL | 0.02 | 15.44 | 0.01 | 0.00 | 0.00 | 0.00 | 15.48 | 0.03 | 0.09 | 0.55 |
| GL | 0.09 | 0.10 | 43.68 | 0.00 | 0.01 | 0.01 | 43.89 | 0.21 | -0.16 | -0.37 |
| WB | 0.01 | 0.00 | 0.00 | 0.66 | 0.00 | 0.00 | 0.68 | 0.02 | -0.01 | -1.80 |
| BL | 0.00 | 0.00 | 0.00 | 0.00 | 0.33 | 0.00 | 0.33 | 0.00 | 0.02 | 5.29 |
| UL | 0.00 | 0.00 | 0.00 | 0.00 | 0.00 | 0.53 | 0.53 | 0.01 | 0.06 | 10.46 |
| Total (2000) | 39.10 | 15.56 | 43.73 | 0.67 | 0.35 | 0.59 | 100.00 | 0.37 | ||
| Gain | 0.12 | 0.12 | 0.05 | 0.01 | 0.02 | 0.06 | 0.37 | |||
Note: The abbreviations “CL”, “WL”, “GL”, “WB”, “BL” and “UL” are defined in the note for Figure 5. |
Table 3 Transitions in percentages of total land use observed in the loess hilly region of northern Shaanxi Province during 2000-2005 (%) |
| Year 2000 | 2005 | Total (2000) | Loss | Net gain in 2005 | Changes in 2005 | |||||
|---|---|---|---|---|---|---|---|---|---|---|
| CL | WL | GL | WB | BL | UL | |||||
| CL | 37.23 | 1.06 | 0.77 | 0.00 | 0.04 | 0.00 | 39.10 | 1.87 | -1.79 | -4.58 |
| WL | 0.00 | 15.55 | 0.01 | 0.00 | 0.00 | 0.00 | 15.56 | 0.01 | 1.54 | 9.87 |
| GL | 0.06 | 0.49 | 43.15 | 0.00 | 0.01 | 0.02 | 43.73 | 0.58 | 0.22 | 0.50 |
| WB | 0.01 | 0.00 | 0.00 | 0.65 | 0.00 | 0.00 | 0.67 | 0.01 | -0.01 | -1.03 |
| BL | 0.00 | 0.00 | 0.00 | 0.00 | 0.35 | 0.00 | 0.35 | 0.00 | 0.05 | 13.49 |
| UL | 0.00 | 0.00 | 0.01 | 0.00 | 0.00 | 0.57 | 0.59 | 0.02 | 0.00 | -0.15 |
| Total (2005) | 37.31 | 17.10 | 43.94 | 0.66 | 0.40 | 0.59 | 100.00 | 2.49 | ||
| Gain | 0.08 | 1.55 | 0.79 | 0.01 | 0.05 | 0.02 | 2.49 | |||
Note: The abbreviations “CL”, “WL”, “GL”, “WB”, “BL” and “UL” are defined in the note for Figure 5. |
Table 4 Transitions in percentages of total land use observed in the loess hilly region of northern Shaanxi Province during 2005-2010 (%) |
| Year 2005 | 2010 | Total (2005) | Loss | Net gain in 2010 | Changes in 2010 | |||||
|---|---|---|---|---|---|---|---|---|---|---|
| CL | WL | GL | WB | BL | UL | |||||
| CL | 37.08 | 0.17 | 0.05 | 0.00 | 0.01 | 0.00 | 37.31 | 0.23 | -0.22 | -0.60 |
| WL | 0.00 | 17.09 | 0.00 | 0.00 | 0.00 | 0.00 | 17.10 | 0.00 | 0.23 | 1.37 |
| GL | 0.00 | 0.07 | 43.87 | 0.00 | 0.00 | 0.00 | 43.94 | 0.07 | -0.02 | -0.04 |
| WB | 0.00 | 0.00 | 0.00 | 0.66 | 0.00 | 0.00 | 0.66 | 0.00 | 0.00 | 0.58 |
| BL | 0.00 | 0.00 | 0.00 | 0.00 | 0.40 | 0.00 | 0.40 | 0.00 | 0.01 | 2.38 |
| UL | 0.00 | 0.00 | 0.01 | 0.00 | 0.00 | 0.58 | 0.59 | 0.01 | 0.00 | -0.75 |
| Total (2010) | 37.09 | 17.33 | 43.92 | 0.66 | 0.41 | 0.58 | 100.00 | 0.31 | ||
| Gain | 0.00 | 0.24 | 0.06 | 0.01 | 0.01 | 0.00 | 0.31 | |||
Note: The abbreviations “CL”, “WL”, “GL”, “WB”, “BL” and “UL” are defined in the note for Figure 5. |
Table 5 Transitions in percentages of total land use observed in the loess hilly region of northern Shaanxi Province during 2010-2015 (%) |
| Year 2010 | 2015 | Total (2010) | Loss | Net gain in 2015 | Changes in 2015 | |||||
|---|---|---|---|---|---|---|---|---|---|---|
| CL | WL | GL | WB | BL | UL | |||||
| CL | 36.93 | 0.00 | 0.00 | 0.01 | 0.11 | 0.03 | 37.09 | 0.15 | -0.11 | -0.29 |
| WL | 0.01 | 17.28 | 0.00 | 0.00 | 0.02 | 0.02 | 17.33 | 0.05 | -0.05 | -0.30 |
| GL | 0.03 | 0.00 | 43.66 | 0.01 | 0.17 | 0.06 | 43.92 | 0.27 | -0.26 | -0.59 |
| WB | 0.00 | 0.00 | 0.00 | 0.65 | 0.00 | 0.00 | 0.66 | 0.01 | 0.01 | 1.61 |
| BL | 0.00 | 0.00 | 0.00 | 0.00 | 0.41 | 0.00 | 0.41 | 0.00 | 0.32 | 77.88 |
| UL | 0.00 | 0.00 | 0.00 | 0.00 | 0.02 | 0.56 | 0.58 | 0.02 | 0.09 | 15.80 |
| Total (2015) | 36.98 | 17.28 | 43.66 | 0.67 | 0.73 | 0.68 | 100.00 | 0.51 | ||
| Gain | 0.04 | 0.00 | 0.01 | 0.02 | 0.32 | 0.11 | 0.51 | |||
Note: The abbreviations “CL”, “WL”, “GL”, “WB”, “BL” and “UL” are defined in the note for Figure 5. |
Table 6 Transitions in percentages of total land use observed in the loess hilly region of northern Shaanxi Province during 1995-2015 (%) |
| Year 1995 | 2015 | Total (1995) | Loss | Net gain in 2015 | Changes in 2015 | |||||
|---|---|---|---|---|---|---|---|---|---|---|
| CL | WL | GL | WB | BL | UL | |||||
| CL | 36.75 | 1.24 | 0.85 | 0.01 | 0.16 | 0.07 | 39.09 | 2.33 | -2.11 | -5.40 |
| WL | 0.03 | 15.39 | 0.02 | 0.00 | 0.02 | 0.02 | 15.48 | 0.09 | 1.80 | 11.65 |
| GL | 0.17 | 0.65 | 42.78 | 0.02 | 0.19 | 0.08 | 43.89 | 1.11 | -0.22 | -0.51 |
| WB | 0.02 | 0.00 | 0.01 | 0.64 | 0.01 | 0.00 | 0.68 | 0.04 | 0.00 | -0.67 |
| BL | 0.00 | 0.00 | 0.00 | 0.00 | 0.33 | 0.00 | 0.33 | 0.00 | 0.39 | 117.62 |
| UL | 0.01 | 0.00 | 0.01 | 0.00 | 0.02 | 0.50 | 0.53 | 0.03 | 0.14 | 26.77 |
| Total (2015) | 36.98 | 17.28 | 43.66 | 0.67 | 0.73 | 0.68 | 100.00 | 3.61 | ||
| Gain | 0.22 | 1.89 | 0.88 | 0.04 | 0.39 | 0.17 | 3.61 | |||
Note: The abbreviations “CL”, “WL”, “GL”, “WB”, “BL” and “UL” are defined in the note for Figure 5. |
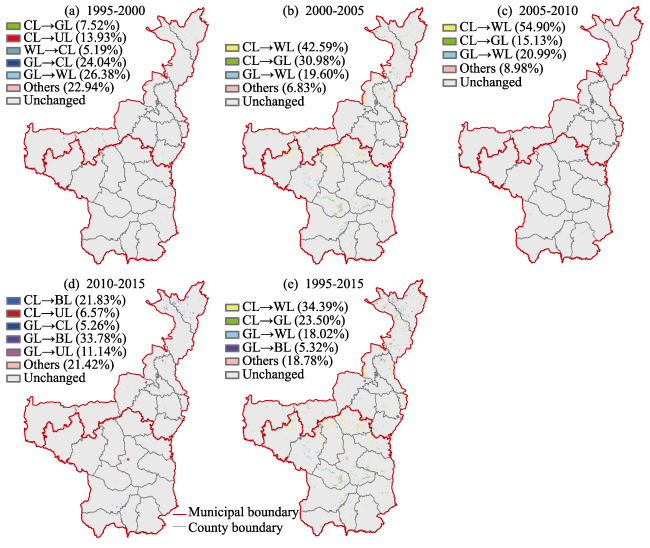
Figure 6 Patterns of land use change in the loess hilly region of northern Shaanxi Province during 1995-2000, 2000-2005, 2005-2010, 2010-2015, and 1995-2015 |
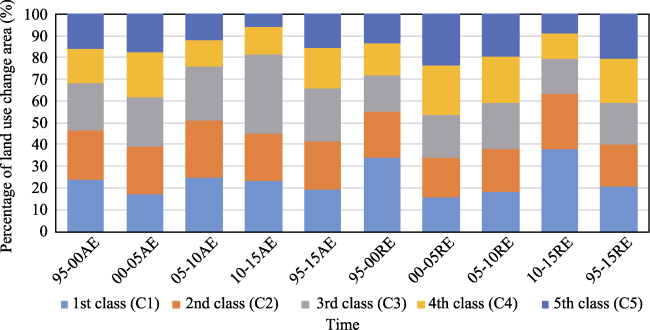
Figure 7 Structure of land use change with absolute elevation and relative elevation in the loess hilly region of northern Shaanxi Province during 1995-2000, 2000-2005, 2005-2010, 2010-2015, and 1995-2015 |
Table 7 The five top ranked land-use conversion types in absolute and relative elevation in the loess hilly region of northern Shaanxi Province |
| Time | Absolute elevation | Relative elevation | ||||
|---|---|---|---|---|---|---|
| Type | Class | % | Type | Class | % | |
| 1995-2000 | GL→WL GL→CL GL→WL GL→CL CL→UL | C5 C1 C1 C2 C3 | 9.02 7.13 6.31 6.06 5.88 | GL→WL GL→WL GL→CL GL→CL GL→WL | C1 C2 C5 C2 C3 | 7.26 6.12 5.37 5.17 4.92 |
| 2000-2005 | CL→GL CL→WL CL→GL CL→WL CL→WL | C3 C4 C2 C5 C1 | 10.56 10.34 10.01 9.37 7.90 | CL→WL CL→WL CL→WL CL→GL CL→GL | C5 C4 C3 C4 C3 | 12.99 10.38 8.15 7.67 6.92 |
| 2005-2010 | CL→WL CL→WL CL→WL CL→WL GL→WL | C2 C1 C5 C3 C3 | 14.79 14.05 11.02 9.94 7.77 | CL→WL CL→WL CL→WL CL→WL CL→WL | C5 C4 C3 C2 C1 | 13.25 13.05 11.63 9.60 7.37 |
| 2010-2015 | GL→BL CL→BL CL→BL GL→BL GL→UL | C3 C3 C1 C2 C1 | 19.07 8.14 6.56 6.13 4.59 | GL→BL GL→BL CL→BL GL→BL CL→BL | C1 C2 C1 C3 C2 | 12.33 11.42 8.90 6.55 5.65 |
| 1995-2015 | CL→GL CL→WL CL→WL CL→GL CL→WL | C3 C4 C5 C2 C1 | 7.97 7.66 7.43 7.28 6.72 | CL→WL CL→WL CL→WL CL→GL CL→WL | C5 C4 C3 C4 C2 | 10.13 8.29 6.64 5.65 5.35 |
Note: The abbreviations “CL”, “WL”, “GL”, “BL” and “UL” are defined in the note for Figure 5. |
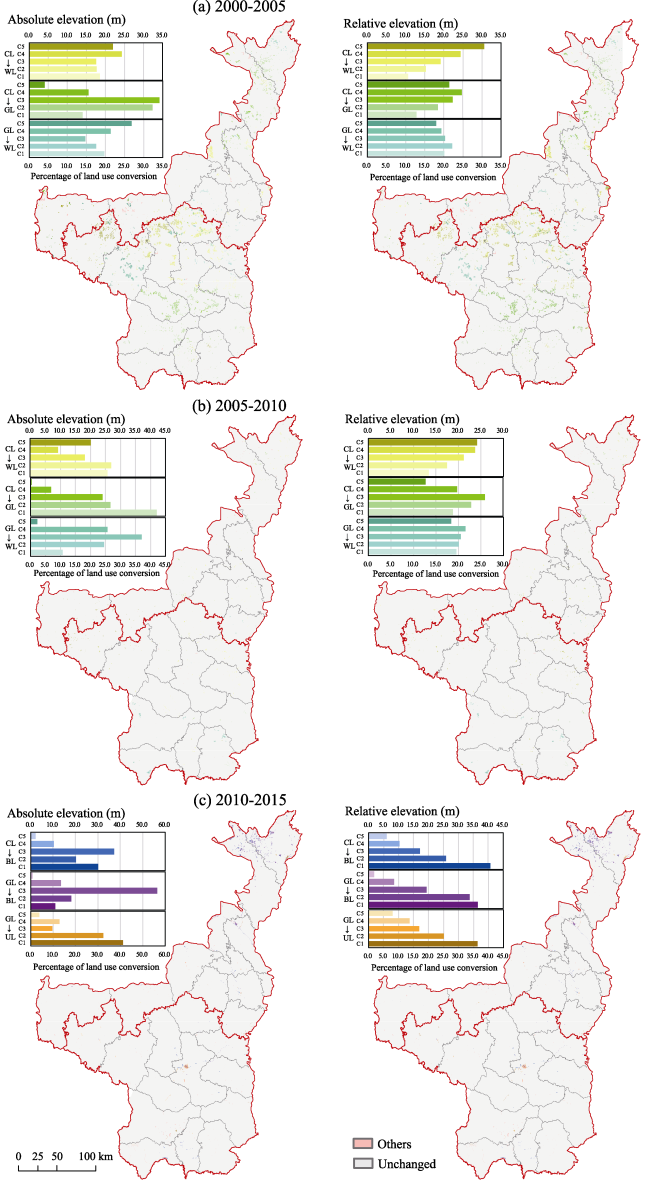
Figure 8 Vertical distribution of main land-use conversion types with two classifications of absolute elevation and relative elevation in the loess hilly region of northern Shaanxi Province during 2000-2005, 2005-2010 and 2010-2015 |
The authors have declared that no competing interests exist.
| [1] |
|
| [2] |
|
| [3] |
|
| [4] |
|
| [5] |
|
| [6] |
|
| [7] |
|
| [8] |
|
| [9] |
|
| [10] |
|
| [11] |
|
| [12] |
|
| [13] |
|
| [14] |
|
| [15] |
|
| [16] |
|
| [17] |
|
| [18] |
|
| [19] |
|
| [20] |
|
| [21] |
|
| [22] |
|
| [23] |
|
| [24] |
|
| [25] |
|
| [26] |
|
| [27] |
|
| [28] |
|
| [29] |
|
| [30] |
|
| [31] |
|
| [32] |
|
| [33] |
|
| [34] |
|
| [35] |
|
| [36] |
|
| [37] |
|
| [38] |
|
| [39] |
|
| [40] |
|
| [41] |
|
| [42] |
|
/
| 〈 |
|
〉 |