Detecting spatio-temporal changes of arable land and construction land in the Beijing-Tianjin corridor during 2000-2015

  • GUO Liying , 1, 2 ,
  • DI Liping , 2, * ,
  • TIAN Qing 3
Expand
  • 1. Institute of Agricultural Resources and Regional Planning, Chinese Academy of Agricultural Sciences, Beijing 100081, China
  • 2. Center for Spatial Information Science and Systems, George Mason University, Fairfax, VA 22030, USA
  • 3. Department of Computational and Data Sciences, George Mason University, Fairfax, VA 22030, USA
*Corresponding author: Di Liping, PhD and Professor, E-mail:

Author: Guo Liying, PhD and Associate Professor, specialized in land use and agricultural development. E-mail:

Received date: 2018-07-20

  Accepted date: 2018-12-19

  Online published: 2019-04-19

Supported by

National Key Research and Development Program of China, No.2017YFC0504701

Copyright

Journal of Geographical Sciences, All Rights Reserved

Abstract

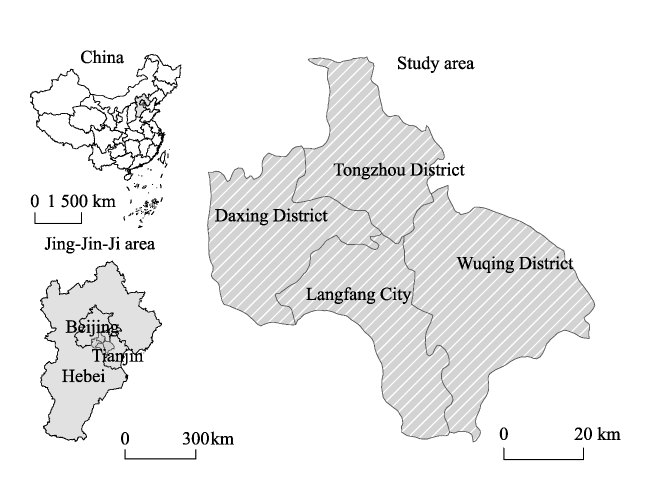
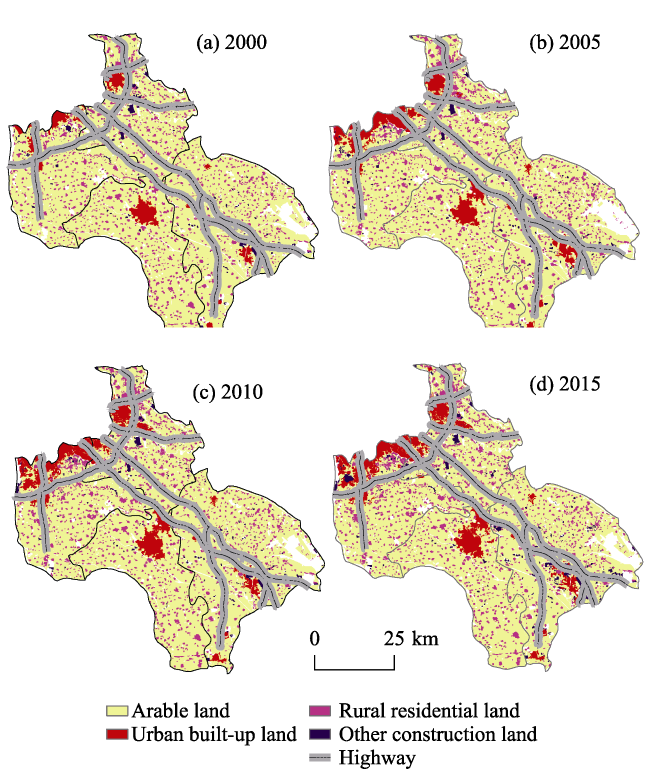
Rapid peri-urbanization has become a new challenge for sustainable urban-rural development worldwide. To clarify how unprecedented urban sprawl at the metropolitan fringe impacts urban-rural landscape, this study took the Beijing-Tianjin corridor of Beijing-Tianjin-Hebei metropolitan area, one of the largest urban clusters in China, as a typical example. By using Landsat-based landscape metrics and a practical methodology, we investigated the landscape changes and discussed the potential reasons in the context of rapid peri-urbanization of China. Specifically, multi-temporal land use maps derived from Landsat images were used to calculate landscape metrics and analyze their characteristics along the urban-rural gradients. The practical methodology was used to monitor spatio-temporal characteristics of landscape change in large metropolitan areas. The results showed that landscape patterns in the area had changed greatly from 2000 to 2015 with characteristics of construction land sprawl and arable land shrinkage. The intensity and scale of landscape changes varied along the urban-rural gradients. Sampled plots in urbanized areas and rural areas demonstrated distinguishable landscape patterns and significant differences. Urban areas had more heterogeneous and fragmented landscapes than rural areas. Peri-urban areas in general experienced higher levels of land diversification than rural areas. Rural residential land appeared to be more aggregated near Beijing and Tianjin cities. Besides, our findings also indicated that urban expansion was largely responsible for landscape patterns. The findings of this study potentially provide strategical insights into landscape planning around mega cities and sustainable coordinated urban-rural development.

Cite this article

GUO Liying , DI Liping , TIAN Qing . Detecting spatio-temporal changes of arable land and construction land in the Beijing-Tianjin corridor during 2000-2015[J]. Journal of Geographical Sciences, 2019 , 29(5) : 702 -718 . DOI: 10.1007/s11442-019-1622-1

1 Introduction

With the rapidly increasing peri-urbanization, landscape changes at the urban fringe for the urban renewal and urban sprawl have become a new challenge for sustainable urban-rural development (Nilsson et al., 2014; Liu et al., 2018a). Uncontrolled and unplanned urban sprawl has created the imbalance between excessive consumption of resources and regional development, especially in megacities of developing countries under the pressure of population increase and clime change (Zhao, 2010; Qian et al., 2016). Urban sprawl of large urban areas into the surrounding rural landscape leads to the rapid expansion of urban land along with the sharp shrink of rural land (Li et al., 2014). China is a typical country undergoing fast urbanization and land-use change. In the past two decades, on average more than 2000 square kilometers of rural land was requisitioned for urban sprawl per year (Forbes, 2016 https://www.forbes.com/sites/wadeshepard/2016/03/14/the-impact-of-chinas-new-urbanization-plan-could-be-huge/#28a6315d6673). Therefore, in the context of rapid urbanization, how to effectively utilize limited land resources to achieve sustainable development at the urban-rural fringe is a key issue for land science community. Also, to clarify this issue will be helpful for attaining a balance among urban development, economic growth and social well-being (Simwanda and Murayama, 2018).
Urbanization plays a crucial role in promoting economic development and solve the dual structure of urban and rural areas for China (Liu et al., 2013; Li et al., 2018). During the period of 1990-2015, the total rural population decreased from 841.38 million to 603.46 million, while the urban population increased from 301.95 million to 771.16 million (NBSC, 2016 http://www.stats.gov.cn/english/Statisticaldata). The share of urban population changed from 17.91% in 1978 to 56.1% in 2015 (NBSC, 2016). Rapid urbanization and growth of urban economy have led to unprecedented activities in urban construction and urban sprawl in space (Gao et al., 2016). A significant loss of cropland in China has been reported as a direct consequence of urban expansion. With continued economic development and urban growth, the demand for construction land will continue to increase.
Landscape changes reflect the changes in landscape structure, function, and spatial pattern over time (Antrop, 2004). Such changes result from the interaction between natural environments and human activities (Liu et al., 2013). As urbanization develops fast across developing countries, understanding how urban economic development affects landscape changes in urban areas has become an important focus of land science community (Long et al., 2009; Li et al., 2014).
Urban expansion has great influences on landscape patterns, especially in urban fringes. Bittner and Sofer (2013) observed three different urban-rural fringe belts along the coastal area in Israel, and further reported that the continued expansion of built-up areas had been occurring in the urban-rural fringe. Roose et al. (2013) found that the patchy and scattered land in the urban fringe was formed by occupying agricultural land, grasslands and forests. In China, urban expansion has triggered a series of problems in the surrounding areas around metropolises, such as arable land reduction and resources shortage, creating complex relationships between urban and rural areas (Li et al., 2015; Liu et al., 2017). From the late 1980s to 2010 in China, approximately 3.18×10⁶ ha of arable land were converted into construction land with about 50.68% of decreased arable land used for urban construction (Liu et al., 2014). Loss of millions of hectares of arable land to sprawl for urban construction needs has highlighted the conflict between urbanization and arable land conservation. Problems such as rural hollowing and idle rural homesteads have emerged in the countryside due to migration of population from rural to urban areas (Song et al., 2013; Long, 2014; Liu and Li, 2017). To protect arable land for feeding huge population, a series of strict land-use management policies were introduced, including “arable land requisition-compensation balance policy”, and “land consolidation and rehabilitation” (Long et al., 2010; Liu et al., 2014). The competition for different uses of land is particularly acute amid limited supply of land.
The metropolitan area is an area of rapid expansion of construction land and prominent human-land conflict. Existing research on land use in metropolitan areas has mainly focused on changes in urban areas (Seto and Fragkias, 2005). Some studies examine landscape patterns in metropolitan areas in terms of spatial heterogeneity and temporal heterogeneity (Lechner et al., 2013; Lv et al., 2012; Nagendra et al., 2004; Poelmans and Van Rompaey, 2009). Giving a brief summary of their findings, Kowea et al. (2015) argued that landscape metrics were useful tools to describe the composition and configuration of landscape change in the Sancaktepe District of Istanbul Metropolis, attributable to agglomerated and fragmented land-use patches caused by urban expansion. Dewan et al. (2012) determined the impact of land-use change on landscape fragmentation with landscape metrics in Dhaka Metropolis of Bangladesh, finding that the landscape became highly fragmented due to rapid increased built-up areas. Aguilera et al. (2011) simulated the scenarios in a Spanish metropolitan area and evaluated quantitatively their changes in the spatial characteristics of urban growth with landscape metrics. They found more dispersed growth patterns in metropolitan areas. Li et al. (2012) measured spatial pattern of greenspace in Beijing metropolitan area with seven landscape metrics, suggesting that land surface temperatures were positively correlated with patch density.
More detailed studies of landscape changes are needed to understand the spatial and functional changes along the urban-rural gradients around metropolises. These understandings are of great importance for landscape planning and resolving the multiple issues associated with urban expansion (Liu et al., 2016; Tian et al., 2016). Urban expansion is inevitable in the process of socio-economic development, and how to manage land at the urban-rural interface will remain a challenge for China in the present and future. As China has just launched an ambitious plan for developing city clusters at unprecedented scales (Lu, 2015), it becomes even more important to understand what is happening and will likely happen around these urban clusters.
This study, taking the Beijing-Tianjin corridor (BTC) in Beijing-Tianjin-Hebei metropolitan region as the study area, aims to examine the impacts of urbanization on landscape patterns. Particular attention is paid to the spatio-temporal and functional changes along the urban-rural gradients. The findings of this study will potentially provide policymakers with a sound scientific basis for urban planning and land use management. Besides, the study area is one of the typical core city clusters in the newly announced Chinese urban development plan. The understandings gained from this study will have implications for regional planning and for other metropolitan areas.

2 Materials and methods

2.1 Study area

This study focuses on the Beijing-Tianjin corridor (BTC) within the Beijing-Tianjin-Hebei (also termed as Jing-Jin-Ji) metropolitan region (Figure 1), which includes two municipal cities, Beijing and Tianjin, and their neighboring areas in Hebei province. BTC covers an area of 4509 km2, including Daxing and Tongzhou districts of Beijing, Wuqing district of Tianjin, and Langfang municipal district under the jurisdiction of Hebei province. Beijing and Tianjin, as the first-tier Chinese cities, suffer many common big city problems, such as employment pressure, traffic congestion, air pollution, and soaring housing and living cost (Gu et al., 2015). To address those problems, new urban centers have been increasingly developed, which often take over arable land at the peri-urban areas and inevitably lead to the spread of built-up area from the original urban centers to the surrounding areas (Wang & Wang, 2015). All these raise important questions related to urbanization in BTC, such as what are the patterns and trends of urban development in BTC? And what changes have occurred on the landscape as a consequence of urban expansion?
Figure 1 The location of the Beijing-Tianjin corridor within the Beijing-Tianjin-Hebei metropolitan area

2.2 Data and statistical analyses

2.2.1 Data
Our study relies on a gridded land-use dataset in years of 2000, 2005, 2010 and 2015 at a scale of 1:100,000 with a spatial resolution of 30 m, provided by the Data Center for Resources and Environmental Sciences, Chinese Academy of Sciences (RESDC). The land-use dataset was generated originally by visual interpretation of Landsat TM/ETM+, OLI and HJ-1 sensors (Liu et al., 2014; Liu et al., 2018b). Other spatial data, including digital elevation model (DEM), county boundary and road networks, were also used to support image interpretation. The overall accuracy of land use data computed by the confusion matrix was over 90% with kappa coefficients being greater than 0.8 (Liu et al., 2014).
In this study, the original land-use types were reclassified into four main types: urban built-up land (UBL, the built-up area of large, medium and small cities and towns), rural residential land (RRL, rural residential areas outside cities and towns), arable land (ARL, land for growing crops), and other construction land (OCL, factories and mines, large industrial parks, transportation, airports, etc). The first three types all belong to the general construction land types. To analyze the spreading effects of urban centers across BTC, the built-up areas of Beijing and Tianjin in 2000, 2005, 2010, and 2015 were also extracted. All the spatial processing was conducted with the help of ArcGIS software.
2.2.2 Landscape metrics
Landscape indices are often used to quantitatively characterize landscape patterns (Fernandes et al., 2011). Specifically, class-level indices calculated for each land-use type can reveal landscape patterns of individual land-use types. Analyzing class-level indices can help us understand the change in land-use type individually and reveal the mechanism of farmland conversion. Following the existing researches, three common indices, i.e., percentage of landscape (PLAND), edge density(ED) and aggregation index (AI) are used in this study (Shoyama and Braimoh, 2011). PLAND characterizes landscape composition. AI reflects the aggregation/dispersion of the same-type patches. ED indicates the degree of fragmentation of patches. In addition, two landscape-level indices, Shannon’s diversity index (SHDI), and Contagion index (CONTAG), were also used to evaluate temporal changes of landscape due to urbanization in BTC. Contagion index is inversely related to edge density affected by both the dispersion and interspersion of patch types (McGarigal et al., 2009). These landscape-level indices analyze the changes in all land-use types within a specific region (Fan and Myint, 2014).
(1) Rate of land change
The rate of land-use change reflects the speed of change for a certain land-use category at a time period (Guo et al., 2015). The formula is as follows:
${{P}_{ij}}=\frac{{{L}_{j}}-{{L}_{i}}}{{{L}_{i}}}\times 100%$ (1)
where ${{P}_{ij}}$ is the rate of land-use change for a specific landscape category at a specific time period, and ${{L}_{i}}$ and $\text{ }\!\!~\!\!\text{ }{{L}_{j}}~$are the area of a certain land-use category at the beginning and end of a specific time period T.
${{A}_{ij}}=\frac{{{\text{L}}_{j}}-{{\text{L}}_{i}}}{{{\text{L}}_{i}}}\times \frac{1}{T}\times 100%$ (2)
Equation (2) is the rate of landscape changes at the unit time of T for a specific land-use category. If the unit of T is year, ${{A}_{ij}}$ is the annual rate of change.
(2) Land-use transition matrix
Transition matrix is a traditional method to quantitatively estimate landscape changes during a time period (Han and Liu, 2013). Transition matrix was calculated by using overlay function in ArcGIS 10.2 and analyzed for land-use transition among land-use categories in Excel. The rate of loss and gain are two indices used to quantitatively estimate the situation of landscape changes from the beginning to the end of a period. The loss rate is defined as:
${{L}_{ij}}=\frac{{{T}_{ij}}}{\mathop{\sum }_{i=1}^{n}{{L}_{i}}}\times 100%$ (3)
where $\sum\nolimits_{i=1}^{n}{{{L}_{i}}}$ is the total area of land-use categories at the beginning time i, and ${{T}_{ij}}$ is the transition area of a certain land-use category from time i to time j.
The gain rate is defined as:
${{G}_{ij}}=\frac{{{T}_{ij}}}{\mathop{\sum }_{j=1}^{n}{{L}_{j}}}\times 100%$ (4)
where $\sum\nolimits_{j=1}^{n}{{{L}_{j}}}$ is the total area of land categories at the end time j.
Other indices such as rates of total loss and total gain, and net change rate are used to analyze the characteristics of landscape changes. The formulas are as follows:
$T{{L}_{ij}}=\frac{\mathop{\sum }_{i}^{n-1}{{T}_{ij}}}{\mathop{\sum }_{i=1}^{n}{{L}_{i}}}\times 100%$ (5)
$T{{G}_{ij}}=\frac{\mathop{\sum }_{j}^{n-1}{{T}_{ij}}}{\mathop{\sum }_{j=1}^{n}{{L}_{j}}}\times 100%$ (6)
${{C}_{ij}}=\frac{\mathop{\sum }_{j=1}^{n}{{L}_{j}}-\mathop{\sum }_{i=1}^{n}{{L}_{i}}}{\mathop{\sum }^{}L}\times 100%$ (7)
Equation (5) is the total loss rate of a specific land-use category from the beginning time i to the end time j, and $\sum\nolimits_{i}^{n-1}{{{T}_{ij}}}$ is the total area of rollout from a specific land-use category to other land-use categories from time i to time j. Equation (6) is the total gain rate of a specific land-use category from the beginning time i to the end time j.${{C}_{ij}}$ is the net change rate of a specific land-use category from the beginning time i to the end time j, and $\mathop{\sum }^{}L$ is the total area of all land-use categories.
The landscape indicators discussed above were calculated by using Fragstats 4.2 that is an open-source software program designed to compute various landscape metrics.

3 Results

3.1 Land-use changes

During the period of 2000-2015, construction land categories overall experienced a rapid expansion in BTC (Table 1). Of which, the category of urban construction land showed the most significant expansion with an increase of 100.43% and the category of other construction land also experienced a rapid expansion with a total increase of 90.51%. While the fastest growth period of urban built-up land was 2000-2005 with a total increase of 72.12%, the fastest growth period of other construction land occurred later in the study period from 2010 to 2015 with an increase of 46.19%. These results indicated that urban construction and infrastructure development made a remarkable change on the land use in BTC over the past 15 years. Rural residential land also experienced sizable expansion (12.54%) but was much less significance than the land-use categories of urban built-up land and other construction land. On the contrary, arable land experienced continuous loss from 76.23% in 2000 to 69.76% in 2015 (Table 1).
Table 1 Land-use changes in the Beijing-Tianjin corridor during 2000-2015 (%)
Landscape 2000-2005 2005-2010 2010-2015 2000-2015
Periodic Annual Periodic Annual Periodic Annual Periodic Annual
Arable land -6.86 -1.37 0.50 0.10 -2.24 -0.45 -8.49 -0.57
Urban built-up land 72.12 14.42 10.41 2.08 5.46 1.09 100.43 6.70
Rural residential land 14.06 2.81 -4.09 -0.82 2.88 0.58 12.54 0.84
Other construction land 6.54 1.31 22.32 4.46 46.19 9.24 90.51 6.03
The expansion of construction land was mostly due to conversion of arable land. The total area of land converted from arable land to construction land was 28,688 ha, accounting for 9.14% of arable land area in 2000. The largest conversion from arable land to construction land (28,091 ha) occurred in the period of 2000-2005, which was about 8.95% of the area of arable land in 2000. The total decrease in arable land (29,168 ha) from 2000 to 2015 was approximately equal to the increase in construction land (30,869 ha).
Land-use changes in BTC also showed interesting spatial patterns (Figure 2). There is a common pattern in urban expansion for the study area: expansion firstly focuses in city center and then agglomerates along city fringe. Arable land is still the dominant type in BTC. The landscape of BTC represents a typical area of urban-suburban-rural gradients.
Figure 2 Land-use changes in the Beijing-Tianjin corridor during 2000-2015
The built-up land in Beijing is expanding southeastward and mainly concentrated in three directions: along BTC and in the boundary areas of Tongzhou district and Daxing district. In the document of Outline of the 12th Five-year Plan for Economic and Social Development in Tongzhou District issued by the Beijing Tongzhou District People’s Government in 2011, Tongzhou was planned to be Beijing’s new secondary Central Business District. Tianjin’s built-up area expanded both northwestward and southeastward. This may due to the fact that Tianjin, located north-west to the Bohai Bay, is the largest costal city in northern China and its expansion of urban built-up land to the southeast may be related to port construction and development of near-port industrial parks. Meanwhile, as the two core cities of Jing-Jin-Ji metropolitan area, the connections in the transportation and other systems between Tianjin and Beijing seemed to push Tianjin’s expansion also toward northwest. However, only one new urban center appeared in Wuqing District close to the boundary of Tianjin built-up area. The main growth of Tianjin city occurred southeastward the bay area. Compared to Beijing, the intensity and scope of Tianjin’s urban expansion along BTC seemed significantly weaker. Beijing seemed to have more influences on its surrounding areas than Tianjin, especially in BTC, and contributed more to the growth of construction land in BTC.
Langfang city, located in the middle of BTC, has become an important junction of Beijing, Tianjin and Hebei’s urban agglomeration along with the development of Jing-Jin-Ji metropolitan areas. The urban expansion in Langfang city was different from that of Beijing and Tianjin. Leaping expansion can be characterized with far away from old city center and close to the Jing-Jin express highway. The new city center is 10 km apart from the fringe of the old city (Figure 2).

3.2 Landscape characteristics along urban-rural gradients

To further understand urban-rural linkages and assess the spreading effects of urban centers on landscape changes, the Beijing-Tianjin corridor was divided into five zones labeled as N1, N2, C, S2, and S1 (Figure 3). The five zones are approximately 15 km wide each and span the area of urban-rural continuum in BTC from urban area to rural area, urban area again, and then rural area again. N1’s south boundary was set first by 5 km southeastward from Beijing’s Sixth Ring Road. N2, C, and S2 were then identified by using a 15-km buffer along the Beijing-Tianjin corridor. The class-level and landscape-level landscape indices were calculated for each zone separately (Figures 4 and 5).
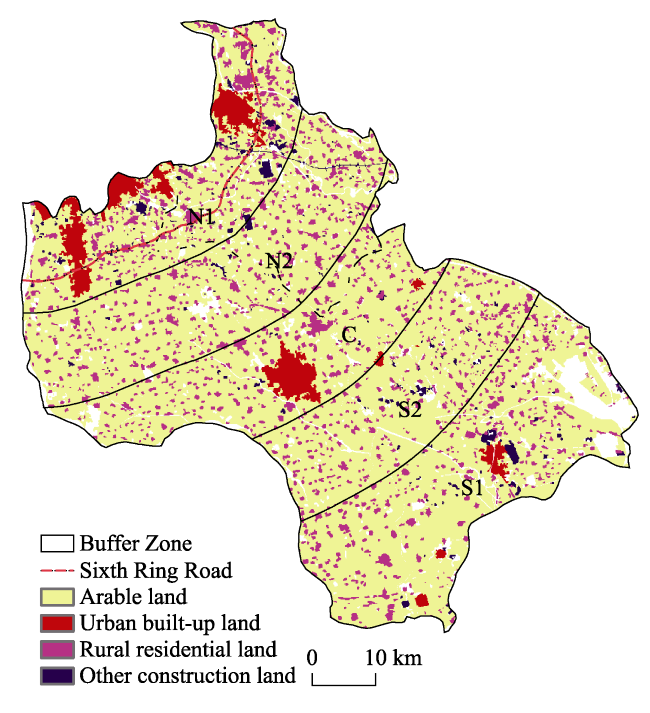
Figure 3 Urban-rural gradient zoning based on the land use map of the Beijing-Tianjin corridor in 2000
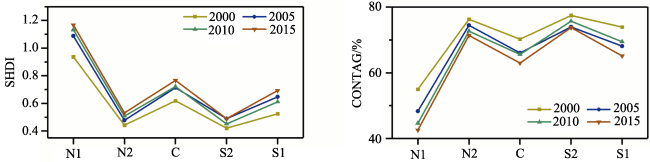
Figure 4 Landscape-level indices along the Beijing-Tianjin corridor during 2000-2015. SHDI and CONTAG represent Shannon’s diversity index and Contagion index, respectively.
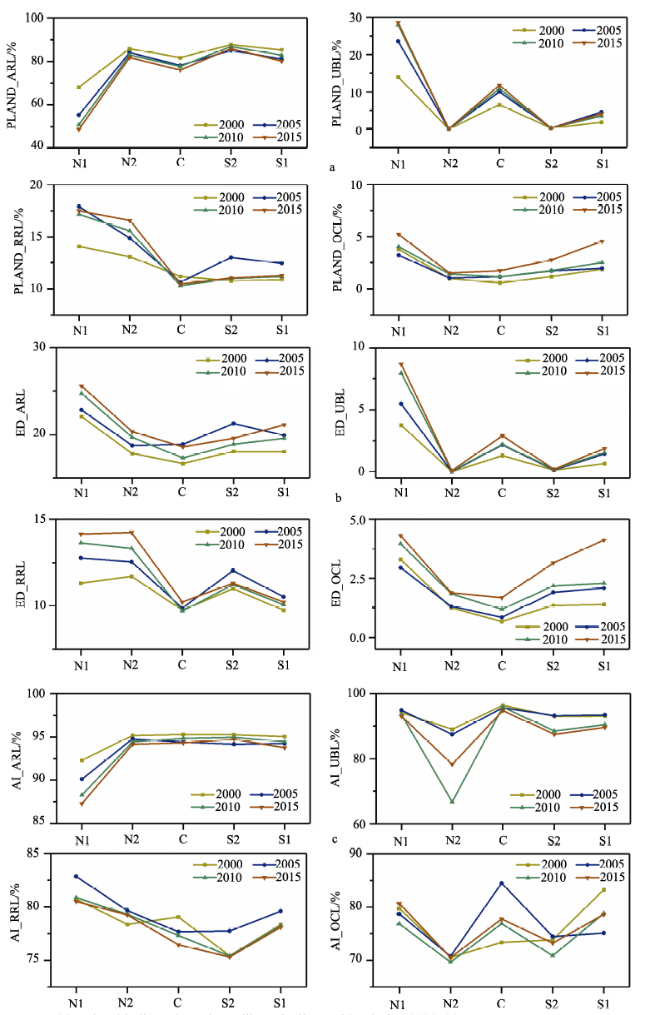
Figure 5 Class-level indices along the Beijing-Tianjin corridor during 2000-2015
The landscape-level indices showed several patterns along BTC (Figure 4). There was an increase in diversity and a decrease in contagion over time, particularly in N1 (near Beijing), C (near Langfang), and S1 (near Tianjin), suggesting the influence from urban development over peri-urban areas. However, N1 showed significant differences from other zones, with the greatest increase in patches, the greatest SHDI, lowest CONTAG, indicating Beijing’s influence for its immediate surrounding areas.
The class-level indices provide further insights about landscape patterns and their changes in the study area (Figure 5). The PLAND index for arable land decreased most significantly in N1, again indicating Beijing’s influence (Figure 5a). Percentage of arable land also decreased in C and S1 but to a limited extent. In N2 and S2 (areas between but not near cities), there was little change in percentage of arable land, which remained the dominant land use type. The PLAND index for urban built-up land showed opposite patterns from those for arable land, with a relatively large increase in C, which was consistent with the process of formation and growth of new urban areas in Langfang.
Interestingly, N1 also witnessed the largest increase in rural residential land (Figure 5a). While each zone experienced increases in other construction land, the largest increase was in S1, indicating Tianjin’s influence was associated with its important industrial position and port trades. Metropolises seemed to have a certain impact on their immediate surrounding areas: Beijing’s influence on rural residential land might have reached N2, and Tianjin’s influence over other construction land might have reached S2 and C.
The edge density index increased for all land-use types over time in BTC (Figure 5b). The most striking change in the number of patches was found to be arable land in N1. Considering that N1 also experienced the greatest decline in percentage of arable land, this suggests Beijing’s influence over farmland conversion and fragmentation as well in its immediate surrounding areas. ED increased for urban built-up land in N1, C and S1, again indicating the influence from urban development over peri-urban areas. But the most worth noting is S1: if we consider that the percentage of urban built-up land in S1 changed very little, this suggests further dividing of urban built-up land in S1. Other ED, particularly for other construction land, are in general compatible with PLAND patterns, suggesting their changes in amount are consistent with changes in the value of ED.
By checking the aggregation index, AI, for N1 again, it showed significant differences from other zones with the lowest AI for arable land, suggesting dispersion of farmland (Figure 5c). N1 and S1 showed relatively high AI for rural residential land compared to other zones, suggesting rural housing was more aggregated near Beijing and Tianjin. In zone C, AI for other construction land first decreased and then increased, and this, again, probably reflects the process of new development and gradual growth in the peri-urban areas of Langfang (Figure 5c). Notice that urban built-up land also increased in zone C but AI for urban built-up land remained the same. This suggests that unlike the category of other construction land that probably started in different areas and increased the agglomeration over time, urban built-up land probably grew through fringe expansion. In N2, AI increased for urban built-up land from 2010 to 2015 following decreases in earlier periods, and this may suggest growth of towns in rural areas resulting from the development policy (Long and Liu, 2016).
Overall, the five zones along BTC appeared to have distinct characteristics. Zone N1 can be characterized as dramatic changes in multiple aspects: reduction, fragmentation and dispersion of arable land, increase in all types of construction land, including rural residential land, as well as increase in land-use diversity. All these likely reflect Beijing’s strong influence and are associated with development advantages near Beijing. The defining characteristics for S1 are expansion of other construction land and further division of urban built-up land, indicating Tianjin’s influence and possibly related to Tianjin’s important industrial position and port trades. Urban expansion was the key feature of Zone C, likely reflecting the process of new development and growth in the Langfang District and spurred by the Beijing-Tianjin urban cluster. N2 and S2, located between but not near cities, remained rural with relatively little changes, except for some increase in rural residential areas over time.
Additionally, peri-urban areas in general experienced higher levels of land-use diversification than rural areas. Rural residential land appeared to be more aggregated near Beijing and Tianjin. Beijing’s influence over rural residential land and Tianjin’s influence over other construction land might have reached beyond their immediate surrounding areas.

4 Discussion

4.1 Landscape changes under administrative hierarchy

In this study, we found that spatial agglomeration, particularly in peri-urban areas, was a major characteristic for all types of construction land, including rural residential land, but the agglomeration intensity and pattern varied across the five zones. All these likely reflected Beijing’s influence on BTC was stronger than Tianjing’s and Langfang’s. Spatial agglomeration was generally shaped or affected by various factors, including socio-economic contexts (Liu et al., 2015b), geographical location (Wei, 2015), as well as the central and local governmental policies (Yu and Wei, 2008), which could eventually lead to regionally divergent growth. Regional divergence is also sensitive to administrative ranks, such as Beijing as the capital of China, which is more likely to obtain resources and stronger supports from the central government for urban expansion and economic development due to its political advantages (Yu and Wei, 2008). This could also explain why spatial agglomeration for built-up land in urban fringe of Beijing was stranger than those of Tianjin and Langfang. However, as shown in Table 2, cities with higher administrative rank might not have a higher rate of urban expansion. The administrative rank of cities in BTC was Beijing>Tianjin>Langfang, but the urban expansion rates did not follow this rank. In fact, urban expansion rate of Langfang was the highest among the cities in the study area. This finding seemed in agreement with the finding of some studies that the urban expansion rate was negatively related to city size (Sun and Zhao, 2018), but not in agreement with finding of other studies that cites with higher administrative ranks had higher rate of urban expansion (Li et al., 2015; Zhao et al., 2015). The document, entitled Planning Outlines for Integrated and Coordinated Development of Beijing, Tianjin, and Hebei released by the central government of China in 2015, promoted the coordinated development and urbanization of Jing-Jin-Ji metropolitan area, as evidenced by the fastest urbanization in Langfang among the cities in BTC. Thus, urban expansion in BTC was associated with administrative hierarchy by building favorable socio-economic and policy contexts. It was also limited by current national development strategy: “strictly control the growth of large cities, rationally develop medium sized cities, and vigorously promote the development of small cities and town” (Li, 2012). How to deal with the relationship between urban expansion and national or regional development strategies and how to optimize urban-rural spatial structure in the context of administrative hierarchy had been the challenges for development planners in China. The above analysis provided a clue for meeting the challenges.
Table 2 Land urbanization rates along the Beijing-Tianjin corridor (%)
N1 N2 C S2 S1
2000 43.90 0.045 35.87 1.88 12.70
2005 52.83 0.047 45.94 1.82 23.96
2010 56.87 0.237 48.58 2.12 20.29
2015 55.73 0.484 49.13 1.97 20.16

4.2 Landscape changes under policy context

At the past 15 years, as shown in Figure 6, BTC’s urban expansion experienced a process from diffusion to aggregation, similar to the process described in the study of Dietzel et al.(2005). As a matured metropolis, Beijing’s urban expansion might adopt a new diffusion process. The analysis showed that rapid zones of urban growth in Beijing were mainly around multiple sub-centers in N1. These new concentrations of urban development formed sub-centers of Beijing, with aggregation of high-tech industrial parks and special economic zones promoted by the General Development Plan of Beijing during the period of 2004-2020. According to the general plan, Tongzhou was designated as the administrative sub-center Beijing, whereas Daxing would be the center of modern manufacturing. These policies greatly affected the characteristics of urban expansion in those sub-administrative regions of Beijing. The general land use plan during the period of 2006-2020 for Wuqing District of Tianjin proposed the built-up land with the spatial patterns along “one new city,seven industrial parks, and three central towns.” The spatial characteristics and patterns of the land use, as the outcome of such planning and policy guidelines, were diffusion and coalescence in landscape structure. The sub-center of Langfang was built close to Jing-Jin-Tang express highway in isolation far away from the old city. The coordinated development between the main city and its sub-centers was suggested in the General Land Use Plan of Langfang during the period of 2006-2020. Therefore, there was a clear variation among N1, S1 and C in the patterns of urban expansion due to the differences in urbanization stage, policy, and available land. Under the stimulation of collaborative development policies, the most portion of increased construction land was used for building inner-city and inter-city highways and residential housing. Therefore, urban expansion is a complex system interwoven with socio-economic, political, and physical context, and thus any change in landscape patterns should be accompanied by a collaborative planning to ensure that the system’s complexity is well-understood and well-controlled.
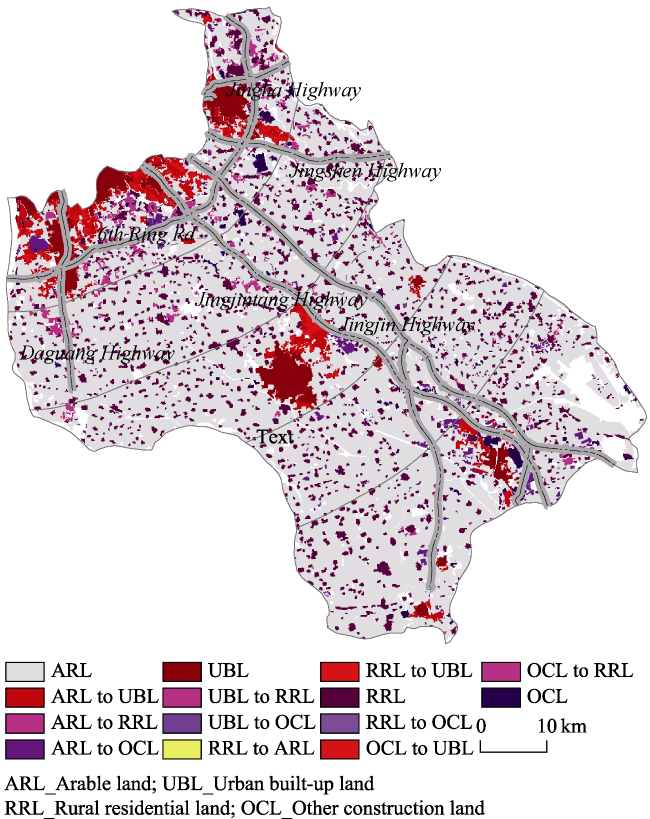
Figure 6 Landscape changes in the Beijing-Tianjin corridor during 2000-2015

4.3 Policy implications on urban-rural development

The area concerned in this study is on urban-rural gradients. The rapid urbanization in the 15-year study period has significantly changed the landscape of the study area. Since landscape is a mirror reflecting the reality of urbanization and socio-economic development, the temporal changes of landscape can describe and reveal the progress and health of urbanization and socio-economic development, especially in its structure, function, effectiveness, and sustainability (Yang et al., 2017)
Clarifying issues associated with rapid urbanization and socio-economic development is of great theoretical and practical value (Li et al., 2018). Urbanization is not to simply expand its scale, but to highlight its corresponding issues, such as environment, infrastructure, traffic, culture, and migrant workers. This study reveals that urbanization should not only expand the size of the urban area, like BTC in the early 2000s, but also pay more attention to strengthening ecological construction, optimizing land-use structure, increasing the proportion of ecological land use, and promoting the level of urban livability, like BTC in the 2010s. Landscape changes in rapid urbanization areas also reveal evolution of internal functions of urban systems, such as industrial structure and economic, societal, and ecological functions of land use. Moreover, study on land-use process and structure can help model future land-use scenarios, which is beneficial to make the optimal urbanization strategy. Focusing on further optimizing the urban and industrial systems, the construction of central cities, key towns, and new communities will be on the priority, as well as low-carbon, environmentally-friendly strategic new-type industrial lands, and the important role of land allocation in regional transformation and industrial upgrading will be brought into play.
An urbanizing region may be across multiple municipalities, like the BTC case in this study. The planning and their related polices of individual municipalities may be biased toward their priorities and favorites without considering the overall regional balance and benefit. Such urbanization will cause imbalance in regional economic, social and ecological development and remains a big problem in China’s urbanization process. Therefore, coordinated and collaborative development, which balances the individual municipalities’ priorities and overall regional interests, should be implemented in the urbanization process through coordinating and integrating all related stakeholders in the region. Implementing the policy of intensive use of land resource on co-operation among various departments of local government is necessary for land use efficiency in the context of urbanization. Thus, balanced regional development is largely based on how these polices and strategies are organized and implemented.
According to the above analyses and discussions of landscape changes in BTC of the Beijing-Tianjin metropolitan area, landscape patterns were affected by urbanization. With the economic development into the new normal and the implementation of new urbanization strategies, the urban expansion in the Beijing-Tianjin metropolitan area should turn from occupying arable land on a large scale to utilize intensively land resources, effectively improve the economic growth, and enhance human welfare. Paying more attention to the different effects of urbanization in urban and rural areas is necessary to make plans in coordinated way following the national guidelines.

5 Conclusions

This study examined rapid-urbanization-induced landscape changes in Beijing-Tianjin corridor (BTC) in the context of the collaborative development in multiple municipalities. Multi-temporal land use maps derived from Landsat images were used to calculate landscape metrics and analyze their characteristics along the urban-rural gradients in BTC. The results demonstrated that: (1) landscape patterns in the area changed greatly from 2000 to 2015. (2) The overall changes could be characterized with a sprawl in construction land and a shrinkage in arable land. However, the intensity and scale of landscape changes varied along the urban-rural gradients. (3) Sampled plots in urbanized areas and rural areas showed evidently distinguishable landscape patterns. (4) The urban areas have more heterogeneous and fragmented landscapes than rural areas.
Peri-urban areas in general experienced a higher level of land diversification than rural areas. Rural residential land appeared to be more aggregated near Beijing and Tianjin. Beijing’s influence on rural residential land and Tianjin’s influence on other construction land might have reached beyond their immediate surrounding areas. Inspection of multi-temporal metrics indicated that landscape patterns have changed in response to urban expansion. This study not only presents a practical methodology for monitoring spatio-temporal changes of landscape patterns in large metropolitan areas, but also provides strategical insights into urban planning and rural revitalization in the new era around mega cities.

The authors have declared that no competing interests exist.

[1]
Aguilera F, Valenzuela L M, Botequilha-Leitão A, 2011. Landscape metrics in the analysis of urban land use patterns: A case study in a Spanish metropolitan area.Landscape and Urban Planning, 99(3/4): 226-238.Urban growth patterns are characteristic of spatial changes that take place in metropolitan areas (MA). They are particularly prominent in more recently formed MAs, such as those in certain locations in Spain, where the structure of the traditional city has undergone sweeping changes. Given the capacity of spatial metrics to characterize landscape structure, these metrics can be a valuable instrument to identify growth patterns in MAs and to evaluate possible urban growth options, based on spatial characteristics. This article focuses on a medium-sized MA (Granada, Spain), and explores the use of spatial metrics to quantify changes in the urban growth patterns reflected in three future scenarios (2020). The scenarios were simulated with a model based on cellular automata, which reproduced three urban growth processes (aggregation, compaction, and dispersion) and four urban growth patterns (aggregated, linear, leapfrogging, and nodal). The scenarios were evaluated with metrics that quantified changes in the spatial characteristics of urban processes. Thus, for example, the NP and AREA_MN allowed us to characterize the decreased aggregation of high-density residential land uses in one scenario (S1) and the linear growth patterns in industrial land uses in another scenario (S2). In this way, spatial metrics were found to be useful for the evaluation of urban planning.

DOI

[2]
Antrop M, 2004. Landscape change and the urbanization process in Europe.Landscape and Urban Planning, 67(1): 9-26.Urbanization is one of the fundamental characteristics of the European civilization. It gradually spread from Southeast Europe around 700 b. c., across the whole continent. Cities and the urban networks they formed were always an important factor in the development and shaping of their surrounding regions. Polarization of territory between urban and rural and accessibility are still important aspects in landscape dynamics. Urbanization and its associated transportation infrastructure define the relationship between city and countryside. Urbanization, expressed as the proportion of people living in urban places shows a recent but explosive growth reaching values around 80% in most European countries. Simultaneously the countryside becomes abandoned. Thinking, valuing and planning the countryside is done mainly by urbanites and future rural development is mainly focused upon the urban needs. Thinking of urban places with their associated rural hinterland and spheres of influence has become complex. Clusters of urban places, their situation in a globalizing world and changing accessibility for fast transportation modes are some new factors that affect the change of traditional European cultural landscapes. Urbanization processes show cycles of evolution that spread in different ways through space. Urbanization phases developed at different speeds and time between Northern and Southern Europe. Main cities are affected first, but gradually urbanization processes affect smaller settlements and even remote rural villages. Functional urban regions (FURs) are a new concept, which is also significant for landscape ecologists. Local landscape change can only be comprehended when situated in its general geographical context and with all its related dynamics. Patterns of change are different for the countryside near major cities, for metropolitan villages and for remote rural villages. Planning and designing landscapes for the future requires that this is understood. Urbanized landscapes are highly dynamic, complex and multifunctional. Therefore, detailed inventories of landscape conditions and monitoring of change are urgently needed in order to obtain reliable data for good decision-making.

DOI

[3]
Bittner C, Sofer M, 2013. Land use changes in the rural-urban fringe: An Israeli case study.Land Use Policy, 33(1): 11-19.The paper analyses the changing pattern of land uses in rural settlements located in the rural-urban fringe and makes a link between the results to socio-economic developments and to changes in the rural policy at the national level. Using historical sequences of land use maps and using geostatistical analysis, we observe changing land use patterns in three Moshav type settlements - the most common type of rural settlement in Israel - in three different rural-urban fringes belts along the coastal area. We identify basic trends of specialisation and intensification of agricultural land use as well as expansion of built up structures for residential and commercial purposes. These trends which are rather similar for all three cases, we argue, reflect economic and social changes in rural settlements in general and in the rural-urban fringe in particular. The evolving patterns in the three Moshavim in the Israeli rural-urban fringe (RUF) can be understood as adjustment measures at the household level to development and changing policies at the macro level, particularly towards the rural sector. There are two major domains of change. First, a transition from dependence on farming to a more diversified economic base suggesting newly shaped interrelationships with the urban space. Second, a new residential development program which has rejuvenated failing and ageing rural settlements. The outcome is a major process of restructuring which affects the economic, social and environmental spheres, and necessitates sensitivity on the part of institutional decision makers towards the complex and diverse realities of relevant actors on the ground, through which all current and future land use policies are mediated. Moreover, being exposed to uncontrolled and often chaotic adjustment measures over the last three decades, it might be necessary to regulate and preserve some of the Moshav's distinct features so it does not to fade into an 'ordinary suburb'. (C) 2012 Elsevier Ltd. All rights reserved.

DOI

[4]
Dewan A M, Yamaguchi Y, Ziaur Rahman M, 2012. Dynamics of land use/cover changes and the analysis of landscape fragmentation in Dhaka Metropolitan, Bangladesh.GeoJournal, 77(3): 315-330.

DOI

[5]
Dietzel C, Herold M, Jeffrey J H et al., 2005. Spatio-temporal dynamics in California’s Central Valley: Empirical links to urban theory.International Journal of Geographical Information, 19(2): 175-195.This paper explores an addition to theory in urban geography pertaining to spatio‐temporal dynamics. Remotely sensed data on the historical extent of urban areas were used in a spatial metrics analysis of geographical form of towns and cities in the Central Valley of California (USA). Regularities in the spatio‐temporal pattern of urban growth were detected and characterized over a hundred year period. To test hypotheses about variation over geographical scale, multiple spatial extents were used in examining a set of spatial metric values including an index of contagion, the mean nearest neighbor distance, urban patch density and edge density. Through changes in these values a general temporal oscillation between phases of diffusion and coalescence in urban growth was revealed. Analysis of historical datasets revealed preliminary evidence supporting an addition to the theory of urban growth dynamics, one alluded to in some previous research, but not well developed. The empirical results and findings provide a lead for future research into the dynamics of urban growth and further development of existing urban theory.

DOI

[6]
Fan C, Myint S, 2014. A comparison of spatial autocorrelation indices and landscape metrics in measuring urban landscape fragmentation.Landscape and Urban Planning, 121(1): 117-128.The combined use of remote sensing based land cover classification and landscape metrics has provided a positive step toward gaining a comprehensive understanding of the features of landscape structure. However, numerous limitations of land cover classification indicate that the utilization of classified thematic maps in landscape pattern analysis is questionable and may even lead to large errors in subsequent analyses. Instead of generating and employing detailed land cover classification maps, the utility of local spatial autocorrelation indices derived directly from satellite imagery to measure landscape fragmentation was examined. Since local spatial autocorrelation can capture spatial pattern at a local scale, it can be expected to detail the spatial heterogeneity for various parts of a landscape instead of providing a single value as in the case with the global measures. This study compares the traditional landscape metrics to the use of satellite imagery based local spatial autocorrelation measures in quantifying landscape structure over Phoenix urban area. Two local spatial autocorrelation indices, the Getis statistic and the local Moran's I were employed in evaluating landscape pattern, using normalized indices as the inputs. Results show that there is a clear relationship between local spatial autocorrelation indices and FRAGSTATS metrics. Both the Getis statistic and the local Moran's I can serve as useful indicators of landscape heterogeneity, for the entire landscape, and for different land use and land cover types. The paper provides a feasible methodology for urban planners and resource managers for effectively characterizing landscape fragmentation using continuous dataset.

DOI

[7]
Fernandes M R, Aguiar F C, Ferreira M T, 2011. Assessing riparian vegetation structure and the influence of land use using landscape metrics and geostatistical tools.Landscape and Urban Planning, 99(2): 166-177.Riparian areas are among the most threatened habitats in the world, due to human activities and land use in adjacent areas. In this study we sought to identify landscape metrics for describing the spatial patterns of riparian vegetation affected by land use. We also hypothesize that land use in the immediate vicinity of the riparian area (considered as a 30-m buffer) can have a greater effect on the structure of riparian vegetation than that in an enlarged buffer (i.e. 200 m). The study was conducted in the highly humanized River Tagus watershed (Central Portugal; Western Iberia), along over 80 km of river stretches. Riparian vegetation and land use data were obtained from high-resolution digital images (RGB-NIR 0.5 m 0.5 m, spring 2005). Patch analyst was used to calculate landscape metrics related to the spatial configuration, isolation, inter-connectivity, and distribution of patches of three riparian cover classes (tree, shrub, and herbaceous). We quantified and accounted for the global and local spatial autocorrelation of data. Data treatment included redundancy analysis and geostatistic methods. Results showed that only a combined interpretation of various landscape metrics can consistently describe the spatial patterns of riparian vegetation. Riparian vegetation near agricultural areas (irrigation crops, rice fields, orchards, and vineyards), presented a low number of much smaller riparian tree patches with less complex shapes, and a low interspersion of the patch distribution. We found that proximal land use affects the structure of riparian vegetation more than distal land use an important consideration for the establishment of streamside protection buffers.

DOI

[8]
Gu C, Wei Y D, Cook I G, 2015. Planning Beijing: Socialist city, transitional city, and global city.Urban Geography, 36(6): 905-926.http://www.tandfonline.com/doi/full/10.1080/02723638.2015.1067409

DOI

[9]
Guo L, Di L, Li G et al., 2015. GIS-based detection of land use transformation in the Loess Plateau: A case study in Baota District, Shaanxi Province, China.Journal of Geographical Sciences, 25(12): 1467-1478.

DOI

[10]
Han F, Liu H, 2013. Transition matrix estimation in high dimensional time series.PMLR, 28(2): 172-180.

[11]
Kowea P, Pedzisaib E, Gumindogac W et al., 2015. An analysis of changes in the urban landscape composition and configuration in the Sancaktepe District of Istanbul Metropolitan City, Turkey using landscape metrics and satellite data.Geocarto International, 30(5): 506-519.Changes in landscape composition and configuration patterns of Sancaktepe Municipal District in the Asian side of Istanbul Metropolitan City of Turkey were analysed using landscape metrics. Class-level and landscape-level metrics were calculated from the land cover/land use data using Patch Analyst, an extension in the Arc View GIS. The land cover/land use data were derived from classified satellite images of Landsat Thematic Mapper of 2002 and 2009 for Sancaktepe District. There was evidence of increase in agglomeration process of built-up patches as indicated by the increases in mean patch size, decrease in total edge and number of patches between 2002 and 2009. The urban expansion pattern experienced overall was not fragmented but concentrated due to infilling around existing patches. Changes in Area-Weighted Mean Shape Index and Area-Weighted Patch Fractal Dimension Index indicated that the physical shapes within built-up, forest and bareland areas were relatively complex and irregular. A conclusion is made in this study that spatial metrics are useful tools to describe the urban landscape composition and configuration in its various aspects and certain decisions whether to approve a specific development in urban planning could, for example, be based on some measures of urban growth form or pattern in terms of uniformity and irregularity, attributable to the dynamic processes of agglomeration and fragmentation of land cover/land use patches caused by urban expansion.

DOI

[12]
Lechner A M, Reinke K J, Wang Y et al., 2013. Interactions between land cover pattern and geospatial processing methods: Effects on landscape metrics and classification accuracy.Ecological Complex, 15(5): 71-82.Remote sensing data is routinely used in ecology to investigate the relationship between landscape pattern as characterised by land use and land cover maps, and ecological processes. Multiple factors related to the representation of geographic phenomenon have been shown to affect characterisation of landscape pattern resulting in spatial uncertainty. This study investigated the effect of the interaction between landscape spatial pattern and geospatial processing methods statistically; unlike most papers which consider the effect of each factor in isolation only. This is important since data used to calculate landscape metrics typically undergo a series of data abstraction processing tasks and are rarely performed in isolation. The geospatial processing methods tested were the aggregation method and the choice of pixel size used to aggregate data. These were compared to two components of landscape pattern, spatial heterogeneity and the proportion of landcover class area. The interactions and their effect on the final landcover map were described using landscape metrics to measure landscape pattern and classification accuracy (response variables). All landscape metrics and classification accuracy were shown to be affected by both landscape pattern and by processing methods. Large variability in the response of those variables and interactions between the explanatory variables were observed. However, even though interactions occurred, this only affected the magnitude of the difference in landscape metric values. Thus, provided that the same processing methods are used, landscapes should retain their ranking when their landscape metrics are compared. For example, highly fragmented landscapes will always have larger values for the landscape metric "number of patches" than less fragmented landscapes. But the magnitude of difference between the landscapes may change and therefore absolute values of landscape metrics may need to be interpreted with caution. The explanatory variables which had the largest effects were spatial heterogeneity and pixel size. These explanatory variables tended to result in large main effects and large interactions. The high variability in the response variables and the interaction of the explanatory variables indicate it would be difficult to make generalisations about the impact of processing on landscape pattern as only two processing methods were tested and it is likely that untested processing methods will potentially result in even greater spatial uncertainty. (C) 2013 Elsevier B.V. All rights reserved.

DOI

[13]
Li J, Deng J, Wang K et al., 2014. Spatiotemporal patterns of urbanization in a developed region of eastern coastal China.Sustainability, 6(7): 4042-4058.This study presents a practical methodology to monitor the spatiotemporal characteristics of urban expansion in response to rapid urbanization at the provincial scale by integrating remote sensing, urban built-up area boundaries, spatial metrics and spatial regression. Sixty-seven cities were investigated to examine the differences of urbanization intensity, urbanization patterns and urban land use efficiency in conjunction with the identification of socio-economic indicators and planning strategies. Planning proposals to allocate the urbanization intensity among different-sized cities by considering sustainable urban development were also explored. The results showed that the urban area of Zhejiang Province expanded from 31,380 ha in 1980 to 415,184 ha in 2010, indicating that the area of the urban region expanded to more than 13-times the initial urban area. The urban built-up area boundaries became more complex and irregular in shape as the urban area expanded throughout the entire study period. Rapid urban population growth and economic development were identified as significant in stimulating the urban expansion process. However, different-sized cities exhibited marked differences in urban development. Small cities experienced the rapidest urbanization before 2000. Large cities, which are estimated to have the highest urban land use efficiency, had the most dramatic sprawl in urban area at the beginning of the 21st century. Promoting the development of large cities to mega-cities is recommended in Zhejiang Province to ensure sustainable urban development with consideration of land resource preservation.

DOI

[14]
Li J, Jia L, Liu Y et al., 2018. Measuring model of rural transformation development path in Fuping County of Beijing-Tianjin-Hebei region.Habitat International, 74(1): 48-56.With the rapid urbanization and industrialization, urban and rural transformation development is inevitable, although rural transformation may suffer from a continuously widening gap. Thus, this paper describes a model to measure the rural transformation development path used to analyze the process more clearly, through measuring rural transformation, detecting influencing factors, and calculating the acting forces of factors. (1) The degree of rural transformation development in Fuping County, which has always been lower than in adjacent counties, gradually improved from 1990 to 2015. This study presents the temporal and spatial influencing factors, including the per capita industrial output value of enterprises above a designated size (x 5 ), the population density (x 8 ), and the per capita water resource (x 12 ) of six counties near to Fuping County. (2) The pull forces in these six counties were larger than the push forces, including society, economy, and resources, which indicates that rural development in Fuping County was mainly dominated by external factors. (3) This paper suggests to increase small scales and to extend large scales to improve the path measurement model by analyzing the test results for Fuping County; furthermore, proposals are presented for realizing rural sustainable development of Fuping County in terms of policy, industry, and resources.

DOI

[15]
Li T, Long H, Liu Y et al., 2015. Multi-scale analysis of rural housing land transition under China’s rapid urbanization: The case of Bohai Rim.Habitat International, 48(1): 227-238.61Distribution of rural housing land was characterized by vertical zonality.61Distribution of rural housing land was more sensitive to slope than to elevation.61Spatial mismatch of rural housing land change and rural population migration.61Get the farmers to migrate to towns instead of big cities in the process of urbanization.61Improving related system and institution to remove the relationship between out-migrated farmers and rural housing land.

DOI

[16]
Li X, Zhou W, Ouyang Z et al., 2012. Spatial pattern of greenspace affects land surface temperature: Evidence from the heavily urbanized Beijing metropolitan area, China.Landscape Ecology, 27(6): 887-898.AbstractThe urban heat island describes the phenomenon that air/surface temperatures are higher in urban areas compared to their surrounding rural areas. Numerous studies have shown that increased percent cover of greenspace (PLAND) can significantly decrease land surface temperatures (LST). Fewer studies, however, have investigated the effects of configuration of greenspace on LST. This paper aims to fill this gap using Beijing, China as a case study. PLAND along with six configuration metrics were used to measure the composition and configuration of greenspace. The metrics were calculated based on a greenspace map derived from SPOT imagery, and LST data were retrieved from Landsat TM thermal band. Ordinary least squares regression and spatial autoregression were employed to investigate the relationship between LST and spatial pattern of greenspace using the census tract as the analytical unit. The results showed that PLAND was the most important predictor of LST. A 10 % increase in PLAND resulted in approximately a 0.86 C decrease in LST. Configuration of greenspace also significantly affected LST. Given a fixed amount of greenspace, LST increased significantly with increased patch density. In addition, the variance of LST was largely explained by both composition and configuration of greenspace. The unique variation explained by the composition was relatively small, and was close to that of the configuration. Results from this study can expand our understanding of the relationship between LST and vegetation, and provide insights for improving urban greenspace planning and management.

DOI

[17]
Liu J, Kuang W, Zhang Z et al., 2014. Spatiotemporal characteristics, patterns, and causes of land-use changes in China since the late 1980s.Journal of Geographical Sciences, 24(2): 195-210.

DOI

[18]
Liu Y, Hu Z, Li Y, 2014. Process and cause of urban-rural development transformation in the Bohai Rim Region, China.Journal of Geographical Sciences, 24(6): 1147-1160.China’s reform and opening-up policy has brought the country a great development opportunity. The high-speed growth of the economy not only led China to a period of industrialization, urbanization, informatization and agricultural modernization, but also exacerbated the situation of the urban-rural dual structure. Based on the review of current studies, we first used the analytic hierarchy process (AHP) method to evaluate the urban-rural development and transformation level by population transformation index, land transformation index, industrial transformation index and social transformation index between 1996 and 2012 around the Bohai Rim Region. Then, based on the results of each index, we used the exploratory spatial data analysis (ESDA) method to investigate the spatial autocorrelation of the change in the urban-rural development transformation index during the 16-year period using Global Moran’s I index and Local Moran’s I index. Finally, we investigated the mechanism of change of the urban-rural development transformation index at county level, summarizing five main factors: (1) the radiation from the surrounding big cities, (2) the acceleration of the urbanization process, (3) the upgrading of the industrial structure, (4) the publishing and implementation of a macro development strategy and regional policy, and (5) natural factors such as topology.

DOI

[19]
Liu Y, Li Y, 2017. Revitalize the world’s countryside.Nature, 548(7667): 275-277.

DOI

[20]
Liu Y, Lu S, Chen Y, 2013. Spatio-temporal change of urban-rural equalized development patterns in China and its driving factors.Journal of Rural Studies, 32(1): 320-330.The urban–rural equalized development is not only significant theoretically, but also a strategic challenge facing the coordinated development of urban and rural China. In this paper we put forward an innovative theory of URED against the background of China's urban–rural transformation. The spatio-temporal pattern, its change and driving factors of urban–rural equalized development during 1996–2009 were analyzed using principal component analysis, the Markov chain model and exploratory spatial data analysis model based on the data for 31 Chinese provinces (autonomous regions and municipalities). It is found that during the study period URED exhibited an obvious tendency of “club homogenization” in China. However, since 2003 the homogenization of the URED for entire China has weakened. Moreover, URED showed a significant geographic characteristic of “polarization” during 1996–2003. Namely, the spatial units of a high URED level were concentrated in eastern China near the coast, and the spatial units of a low URED level were located mainly in central and western China. However, this spatial polarized structure of URED was destroyed since 2003, and the spatial disparity at the provincial level has decreased. Finally, it is concluded that policies and institutional structure, economic growth and urbanization were the main driving factors of the identified URED spatio-temporal pattern and its change in China. This study may serve as a scientific reference regarding decision-making in coordinating urban and rural development and in constructing the new countryside of China.

DOI

[21]
Liu Y, Luo T, Liu Z et al., 2015. A comparative analysis of urban and rural construction land use change and driving forces: Implications for urban-rural coordination development in Wuhan, Central China.Habitat International, 47(1): 113-125.Highlights 61 The expansion of urban/rural construction land leads to the drastic change of urban/rural landscape pattern respectively. 61 The disparity of urban-rural construction land use changes coexists with regional differences. 61 Anthropogenic factors are closely related to the pattern of urban-rural construction land use. 61 Implementations for urban-rural coordination development can be obtained from the analyses of land use change in Wuhan. Abstract This paper explores the spatial–temporal changes of urban–rural construction land use and its anthropogenic driving forces in Wuhan from 1996 to 2009. The vector maps and data from two National Land Investigations in China, socio-economic information from government departments are used, and land use dynamic models and landscape metrics with mathematical statistical method are applied. The outcomes show the expansion of urban–rural construction land, which is extremely rapid that the amount of cultivated land drastically dwindled, the aggregation of urban construction land strengthened, and the fragmentation of rural construction land aggravated. The urban–rural difference of construction land use changes exists in the regional disparity between the inner city and the outer city of Wuhan. During the study period in Wuhan, the quantity and structure changes of urban–rural construction land in the outer city play a decisive role for the change trends of the total city. Societal and economic factors, which include demographic change, economic growth, living standards, and policies, are closely related to the pattern of urban–rural construction land use. Significant regional and urban–rural differences exist on the driving mechanism between the inner city and the outer city of Wuhan. The smooth implementation of urban–rural coordination development can be achieved by allocating the rational scale of urban–rural construction land, optimizing city–town–village spatial system, improving the efficiency of urban–rural land utilization and restructuring urban–rural production, living and ecological spaces.

DOI

[22]
Liu Y, Yan B, Zhou Y, 2016. Urbanization, economic growth, and carbon dioxide emissions in China: A panel cointegration and causality analysis.Journal of Geographical Sciences, 26(2): 131-152.

DOI

[23]
Liu Y, Yang Y, Li Y et al., 2017. Conversion from rural settlements and arable land under rapid urbanization in Beijing during 1985-2010.Journal of Rural Studies, 51(1): 141-150.61Spatiotemporal characteristics of rural settlements loss and arable land depletion during urbanization was explored.61Different degrees of rural non-agriculturalization were zoned.61Spatial modes of rural non-agriculturalization along the urban-rural gradient and the motorways were proposed.

DOI

[24]
Liu Y, Zhang Z, Zhou Y, 2018a. Efficiency of construction land allocation in China: An econometric analysis of panel data.Land Use Policy, 74(1): 261-272.The optimal allocation of land resources is an important prerequisite for sustainable land use and for synergic development of regional resources-environment-economy. The question on how to optimize and allocate the regional land resources has become a hotspot in land use and land cover change studies. However, the allocative efficiency of China’s construction land is currently a rather rudimentary and subjective issue. This study used an extended Cobb-Douglas production function to measure the allocative efficiency of construction land at the national and regional levels using balanced provincial panel data from the 1985–2014 period. The results showed that China’s construction land has exhibited a significant increasing trend over the past three decades, and its growth rate in the central region was relatively higher than that in the eastern and western regions. There is little or no available arable land that can be occupied by construction uses in China’s economically developed provinces. Further investigations demonstrated that capital, labor and land investment all contributed to the non-agricultural GDP growth in China. The allocative efficiency of construction land in the eastern region was greater than that in the central and western regions. The efficiency of construction land allocation in China needs to be further improved, and the intensive utilization of land resource is necessary, particularly in the context of China’s “new normal” economy. Because of the regional disparities in the efficiency of construction land allocation, formulating specific region-oriented land use planning may be more urgent. These findings can provide policymakers with a sound basis for land use and urban planning.

DOI

[25]
Liu Z, Liu Y, Li Y, 2018b. Anthropogenic contributions dominate trends of vegetation cover change over the farming-pastoral ecotone of northern China.Ecological Indicators, 95(1): 370-378.

DOI

[26]
Long H, 2014. Land consolidation: An indispensable way of spatial restructuring in rural China.Journal of Geographical Sciences, 24(2): 211-225.

DOI

[27]
Long H, Liu Y, 2016. Rural restructuring in China.Journal of Rural Studies, 47(1): 387-391.

DOI

[28]
Long H, Liu Y, Li X, 2010. Building new countryside in China: A geographical perspective.Land Use Policy, 27(2): 457-470.The central government of China recently mapped out an important strategy on “building a new countryside” to overall coordinate urban and rural development and gear up national economic growth. This paper analyzes the potential factors influencing the building of a new countryside in China, and provides a critical discussion of the problems and implications concerning carrying out this campaign, from a geographical perspective. To some extent, regional discrepancies, rural poverty, rural land-use issues and the present international environment are four major potential factors. Our analyses indicated that land consolidation, praised highly by the governments, is not a panacea for China's rural land-use issues concerning building a new countryside, and the key problem is how to reemploy the surplus rural labors and resettle the land-loss farmers. More attentions should be paid to caring for farmers’ future livelihoods in the process of implementing the strategy. The regional measures and policies concerning building a new countryside need to take the obvious regional discrepancies both in physical and socio-economic conditions into account. In a World Trade Organization (WTO) membership environment, efficient land use for non-agricultural economic development, to some extent, needs to be a priority in the eastern region instead of blindly conserving land to maintain food security, part task of which can be shifted to the central region and the northeastern region. More preferential policies should be formulated to reverse the rural brain–drain phenomenon. Based on the analyses and the complexity of China's rural problems, the authors argue that building new countryside in China will be an arduous task and a long road, the target of which is hard to achieve successfully in this century.

DOI

[29]
Long H, Zou J, Liu Y, 2009. Differentiation of rural development driven by industrialization and urbanization in eastern coastal China.Habitat International, 33(4): 454-462.With the socio-economic transformation, regional development factors recombination and followed industrial restructuring have changed the rural areas in eastern coastal China deeply. The interaction between the material and non-material elements affecting rural production and lifestyles shaped different rural development types depending on a carrier, which is composed of different industries. Accordingly, this paper makes the definitions of four rural development types, i.e., farming industry dominated rural development type (FIT), industry dominated rural development type (IDT), rural development type focusing on business, tourism and services industries (BTT), and balanced rural development type (BDT), and classifies the rural development types in eastern coastal China. Then, taking the social representation approach and basing on the major factors affecting the long-term rural development and the exertion of the functions of the countryside with regard to society, the assessment indicator system of rurality degree index (RDI) was established to distinguish the rurality degree of different types. The results indicated that, to some extent, the RDI may accurately reflect the status quo of rural development and the exertion of the functions of the countryside with regard to society, and can also reflect the different stage in what the same rural development type in different region stays. The authors argue that the study on the interaction of rural development factors in the process of economic and social transformation and the subsequent rural development model is very important to deeply understand the rural development and to smoothly achieve coordinated and balanced rural rban development in developing countries, which are experiencing rapid industrialization and urbanization.

DOI

[30]
Lu D, 2015. Function orientation and coordinating development of subregions within the Jing-Jin-Ji urban agglomeration.Progress in Geography, 34(2): 265-270. (in Chinese)In this article, we examine the economic linkage and competition among cities in the great metropolitan region of Jing- Jin- Ji. Specifically we demonstrate that Beijing, Tianjin and Hebei Province have developed their unique industry structures and gained corresponding comparative advantages since the beginning of the reform and opening up. Accordingly, we propose the function orientation of Beijing, Tianjin and Hebei Province based on their industrial characteristics and the principle of strategic interest of the country.

DOI

[31]
Lv Z, Dai F, Sun C, 2012. Evaluation of urban sprawl and urban landscape pattern in a rapidly developing region.Environmental Monitoring & Assessment, 184(10): 6437-6448.Urban sprawl is a worldwide phenomenon happening particularly in rapidly developing regions. A study on the spatiotemporal characteristics of urban sprawl and urban pattern is useful for the sustainable management of land management and urban land planning. The present research explores the spatiotemporal dynamics of urban sprawl in the context of a rapid urbanization process in a booming economic region of southern China from 1979 to 2005. Three urban sprawl types are distinguished by analyzing overlaid urban area maps of two adjacent study years which originated from the interpretation of remote sensed images and vector land use maps. Landscape metrics are used to analyze the spatiotemporal pattern of urban sprawl for each study period. Study results show that urban areas have expanded dramatically, and the spatiotemporal landscape pattern configured by the three sprawl types changed obviously. The different sprawl type patterns in five study periods have transformed significantly, with their proportions altered both in terms of quantity and of location. The present research proves that urban sprawl quantification and pattern analysis can provide a clear perspective of the urbanization process during a long time period. Particularly, the present study on urban sprawl and sprawl patterns can be used by land use and urban planners.

DOI PMID

[32]
Martinuzzi S, Gould W A, Ramos González O M, 2007. Land development, land use, and urban sprawl in Puerto Rico integrating remote sensing and population census data.Landscape & Urban Planning, 79(3): 288-297.The island of Puerto Rico has both a high population density and a long history of ineffective land use planning. This study integrates geospatial technology and population census data to understand how people use and develop the lands. We define three new regions for Puerto Rico: Urban (16%), Densely Populated Rural (36%), and Sparsely Populated Rural (48%). Eleven percent of the island is composed of urban/built-up surfaces. A large part of these developments occur in both low-density patterns of construction and sparsely populated neighborhoods. Half of the urban development occurs outside of urban centers. This analysis helps differentiate zones in the landscape with different uses and conditions, identifying not only urban and rural settings, but also the interface where development occurs in a territory dominated by forests and pastures, analogous to a wildland urban interface. The ineffective plan of land development has left a high degree of urban sprawl in 40% of island, where cities and towns appear typically surrounded by sprawl. The San Juan Metropolitan Area is one of the most expanded urbanized areas with a population of 2 2.5 million, comparable with the most sprawled cities of the U.S. mainland. This study reinforces the need for an efficient land use planning, and provides information to support research and planning efforts related to land development and conservation. It represents the first approach integrating satellite imagery with population census data for studying the human environment in the Caribbean.

DOI

[33]
McGarigal K, Tagil S, Cushman S A, 2009. Surface metrics: An alternative to patch metrics for the quantification of landscape structure.Landscape Ecology, 24(3): 433-450.Modern landscape ecology is based on the patch mosaic paradigm, in which landscapes are conceptualized and analyzed as mosaics of discrete patches. While this model has been widely successful, there are many situations where it is more meaningful to model landscape structure based on continuous rather than discrete spatial heterogeneity. The growing field of surface metrology offers a variety of surface metrics for quantifying landscape gradients, yet these metrics are largely unknown and/or unused by landscape ecologists. In this paper, we describe a suite of surface metrics with potential for landscape ecological application. We assessed the redundancy among metrics and sought to find groups of similarly behaved metrics by examining metric performance across 264 sample landscapes in western Turkey. For comparative purposes and to evaluate the robustness of the observed patterns, we examined 16 different patch mosaic models and 18 different landscape gradient models of landscape structure. Surface metrics were highly redundant, but less so than patch metrics, and consistently aggregated into four cohesive clusters of similarly behaved metrics representing surface roughness, shape of the surface height distribution, and angular and radial surface texture. While the surface roughness metrics have strong analogs among the patch metrics, the other surface components are largely unique to landscape gradients. We contend that the surface properties we identified are nearly universal and have potential to offer new insights into landscape pattern rocess relationships.

DOI

[34]
Nagendra H, Munroe D K, Southworth J, 2004. From pattern to process: landscape fragmentation and the analysis of land use/land cover change.Agriculture, Ecosystems & Environment, 101(2/3): 111-115.The incorporation of landscape ecological and fragmentation analyses within remote sensing science has expanded the inferential capabilities of such research. This issue presents a series of papers on the use of landscape ecological techniques to explore the relationship between land cover and land use spatial pattern and process in an international, comparative context. Methodologically, researchers seek to link spatial pattern to land use process by integrating geographic information systems (GIS), socio-economic, and remote sensing techniques with landscape ecological approaches. This issue brings together papers at the forefront of this research effort, and illustrates the diversity of methods necessary to evaluate the complex linkages between pattern and process in landscapes across the world. The analyses focus on major forces interacting at the earth surface, such as the interface of agricultural and urban land, agriculture and forestry, and other pertinent topics dealing with environmental policy and management. Empirical analyses stem from many different ecological, social and institutional contexts within the Americas, Africa, and Asia.

DOI

[35]
Nilsson K, Sick Nielsen T, Aalbers C B E M et al., 2014. Strategies for sustainable urban development and urban-rural linkages.European Journal of Spatial Development, 27(3): 1-26.

[36]
Poelmans L, Van Rompaey A, 2009. Detecting and modelling spatial patterns of urban sprawl in highly fragmented areas: A case study in the Flanders-Brussels region.Landscape and Urban Planning, 93(1): 10-19.The Flanders–Brussels region (Belgium) is one of the most urbanised regions in Europe. Since the 1960s the region is subject to urban sprawl, which resulted in highly fragmented landscapes. In this study, urban expansion in the period 1976–2000 is detected using LANDSAT satellite imagery in two contrasting study areas (highly urbanised vs. semi-urbanised) in the Flanders–Brussels area. The highly urbanised study area is characterised by a concentric growth pattern, while the urban expansion in the semi-urban area is much more fragmented. Next, the observed urban sprawl pattern of 2000 was reproduced by means of a spatial model, based on suitability maps. Employment potential, distance to roads and to motorway entry points and flood risk were used to assess the suitability for new built-up land. The observed expansion of the built-up area between 1976 and 1988 was used to calibrate the model parameters. The land cover map of 2000 was used to validate the model output. The analysis shows that the model output should not be interpreted at the level of individual grid cells. At aggregation levels of 24002m02×0224002m and above the model produces significant results. The model performance is better in areas with concentric urban sprawl patterns than in highly fragmented areas. Because of its simplicity, the proposed methodology is a useful tool for land managers and policy makers that want to evaluate the impact of their decisions and develop future scenarios.

DOI

[37]
Qian J, Peng Y, Luo C et al., 2016. Urban land expansion and sustainable land use policy in Shenzhen: A case study of China’s rapid urbanization.Sustainability, 8(1): 1-16.

[38]
Roose A, Kull A, Gauk M et al., 2013. Land use policy shocks in the post-Communist urban fringe: A case study of Estonia.Land Use Policy, 30(1): 76-83.

DOI

[39]
Seto K C, Fragkias M, 2005. Quantifying spatiotemporal patterns of urban land-use change in four cities of China with time series landscape metrics.Landscape Ecology, 20(7): 871-888.This paper provides a dynamic inter- and intra-city analysis of spatial and temporal patterns of urban land-use change. It is the first comparative analysis of a system of rapidly developing cities with landscape pattern metrics. Using ten classified Landsat Thematic Mapper images acquired from 1988 to 1999, we quantify the annual rate of urban land-use change for four cities in southern China. The classified images were used to generate annual maps of urban extent, and landscape metrics were calculated and analyzed spatiotemporally across three buffer zones for each city for each year. The study shows that for comprehensive understanding of the shapes and trajectories of urban expansion, a spatiotemporal landscape metrics analysis across buffer zones is an improvement over using only urban growth rates. This type of analysis can also be used to infer underlying social, economic, and political processes that drive the observed urban forms. The results indicate that urban form can be quite malleable over relatively short periods of time. Despite different economic development and policy histories, the four cities exhibit common patterns in their shape, size, and growth rates, suggesting a convergence toward a standard urban form.

DOI

[40]
Shahtahmassebi A, Pan Y, Lin L et al., 2014. Implications of land use policy on impervious surface cover change in Cixi County, Zhejiang Province, China.Cities, 39(1): 21-36.There is a growing need to understand interactions between land use policies and the development of impervious surfaces. This paper (1) develops an approach to quantify impervious surface change in urban areas using multi-temporal remotely-sensed data sets; and (2) links observed change to change in land use policies. Cixi County in Zhejiang Province, China was used as a representative case study. Landsat imagery from 1987, 1995, 2002, and 2009 was used to detect impervious surface change. First, impervious surfaces for each image were estimated at the sub-pixel level via multiple endmember spectral mixture analysis (MESMA). Second, a high pass change filter (HPCF) was proposed to identify impervious surface change over time. Third, the Getis rd (Gi ) metric was applied to the HPCF results to determine areas of substantial change (hot spots). In terms of the first objective, results suggested that the HPCF-Gi metric could successfully reveal the location, intensity, and geographic extent of significant change in impervious surface coverage. With respect to the second objective, two major mechanisms of impervious surface change were identified: new land development and redevelopment of existing impervious surfaces. The nature and spatial pattern of these mechanisms can be explained through two classical urban growth models. We found that since 1994 the annual rate of impervious surface growth decreased considerably, suggesting that national land protection policies implemented in that year may have had some effect. However, the total area of impervious surface cover continued to increase, particularly in and around urban areas due to the above mechanisms. Both new land development and redevelopment could be linked to land use regulations and their implementation at the local level through local economic development pressure, the construction of transportation corridors, and the incentive structure for local government.

DOI

[41]
Shoyama K, Braimoh A K, 2011. Analyzing about sixty years of land-cover change and associated landscape fragmentation in Shiretoko Peninsula, Northern Japan.Landscape and Urban Planning, 101(1): 22-29.The aim of this study is to detect and quantify the dominant land cover changes in a human dominated forest site in Northern Japan. Vegetation maps prepared from aerial photos and socioeconomic information were used to define three land cover change trajectories: the rapid cultivation stage (1947–1968), the abandonment stage (1968–1978) and the plantation/reforestation stage (1978–2004). The analysis revealed that in the rapid cultivation stage, the degradation from broadleaved forest to dwarf bamboo brush occurring in more than 3% of the landscape was the only dominant signal of change. In the abandonment stage, the pasture land-dwarf bamboo brush, dwarf bamboo brush-broadleaved forest, and broadleaved forest-conifer-broadleaved forest transitions covering about 18% of the landscape were the dominant change processes. In the plantation stage where the dominant signals of change affected about 27% of the landscape, these three transitions were also observed in addition to pasture and dwarf bamboo brush-conifer plantation transitions. Patch density (PD) increased in the rapid cultivation stage. In spite of natural revegetation and the large-scale reforestation project between 1978 and 2004, the mean patch size of the landscape in 2004 was only 24% of the pre-cultivation era. Mean proximity index (MPI) and interspersion juxtapostition index (IJI) showed contrasting trends, but the latter exhibited high values at extreme values of mean patch size (MPS). The relative ability of other pattern metrics to measure fragmentation of the landscape is highlighted. Prompt mitigation of adverse land change requires close monitoring by land use planners.

DOI

[42]
Simwanda M, Murayama Y, 2018. Spatiotemporal patterns of urban land use change in the rapidly growing city of Lusaka, Zambia: Implications for sustainable urban development. Sustainable Cities & Society, 39(1): 262-274.This study examines the spatiotemporal patterns of urban land use (urban-LU) change in the rapidly urbanising city of Lusaka, Zambia, during the 1990-2000 and 2000-2010 periods, using geospatial tool and techniques. The results show that the city experienced rapid urban growth, with about a 233% increase in the total urban-LU area from 1990 2010. The results also show that urban-LU expansion was more intense during the 2000 than during the 1990s. Spatially, the city displays a disordered pattern of urban-LU associated with the pattern of major roads and the city centre, which draws its legacies from the colonial era. Lusaka has emerged as a highly unplanned city with approximately 40% of the city representing unplanned residential land use dominated by informal settlements (30%). The growth of commercial and industrial land use has also been consistent with high-density residential land uses. The growth of planned residential, and public institutions and service land uses has been slow. The results further reveal spatial dependency of informal settlements on commercial and industrials, and planned high density residential land uses. The study discusses and offers vital insights for strategic urban planning that can control the observed unplanned urban growth and stimulate sustainable urban development.

DOI

[43]
Song W, Chen B, Zhang Y, 2013. Land use regionalization of rural settlements in China.Chinese Geographical Sciences, 23(4): 421-434.中国科学院机构知识库(CAS IR GRID)以发展机构知识能力和知识管理能力为目标,快速实现对本机构知识资产的收集、长期保存、合理传播利用,积极建设对知识内容进行捕获、转化、传播、利用和审计的能力,逐步建设包括知识内容分析、关系分析和能力审计在内的知识服务能力,开展综合知识管理。

DOI

[44]
Su C, Fu B, Lu Y et al., 2011. Land use change and anthropogenic driving forces: A case study in Yanhe River Basin.Chinese Geographical Sciences, 21(5): 587-599.relationship between land use change and human activities. This study focuses on the detection of changing land use patterns in theYanhe River Basin in northern Loess Plateau of China between 1995 and 2008. Landscape metrics were used to analyze the changing landuse patterns and to explore the related anthropogenic driving forces. Results show that: 1) Totally, 186 590 ha of croplands wereconverted into alternate land-use types (equivalent to 61.7% of the original cropland area). The majority of cropland areas were found tobe converted into grassland and woodland areas (accounting for 55.9% and 4.9% respectively of the original cropland areas). 2) Bothcropland and woodland demonstrated an increasing fragmentation tendency while grasslands showed a decreasing fragmentationtendency. 3) Multiple driving forces of land use change were thought to act together to changes in landscape metrics in the Yanhe RiverBasin. The anthropogenic driving forces were analyzed from four perspectives: ecological conservation policy, labor force transfer,industrial development, and rural settlement. The policy of the GfG (Grain for Green) project was the main driving factor which expeditedthe conversion from cropland to woodland and grassland. Industrial development was also found to affect land use change through thedirect impact of economic activities such as oil exploration and agricultural production, or through indirect impacts such as the industrialstructures readjustment. Labor force transfer from rural to urban areas was found to follow the industrial structure readjustment andfurther drove land use change from cropland to off-farm land use. Establishment of new tile-roofed houses instead of cave-type dwellingsin rural settlements has helped to aggregate the original scattered land-use type of construction.

DOI

[45]
Sun Y, Zhao S, 2018. Spatiotemporal dynamics of urban expansion in 13 cities across the Jing-Jin-Ji Urban Agglomeration from 1978 to 2015.Ecological Indicators, 87(1): 302-313.The newly implemented national policy “To build a world-class agglomeration of cities with the capital as the core” made the Jing-Jin-Ji Urban Agglomeration attract attention from both the scientific community and society. Here we quantified and compared the magnitude, rates, forms, and dynamics of urban expansion for 13 cities across the Jing-Jin-Ji Urban Agglomeration, and examined the relationship of urban patch structure and hierarchical structure of urban growth over the past four decades. We found that the rates and composition of urban expansion forms (i.e., infilling, edge-expansion and leapfrogging) varied considerably across cities and over time, due to national and regional policies, physical features and the urban administrative hierarchy. The overall annual urban expansion rate for the 13 cities was 5.562±622.0% (mean62±62standard deviation) between 1978 and 2015. Leapfrogging was the dominant urban expansion form in early period, edge-expansion took the leading role since 1990, and the contribution of infilling was generally less than 40%. Our results revealed that although three major cities (i.e., Tianjin, Beijing and Shijiazhuang) of the Jing-Jin-Ji Urban Agglomeration contributed 36.6% of the urban land area increase of this region, larger cities might not be better positioned for urban expansion. The urban expansion rates of cities were inversely related to city size in general from 1978 to 2015 with exception only from 2005 to 2010. Patch analysis showed that relationship between patch number and patch size derived previously at the national level can be applied to the Jing-Jin-Ji Urban Agglomeration despite the discrepancies in temporal scale and urban administrative hierarchy. This invariant self-organization of urban land patches during the urbanization process might provide insightful information guiding the design, planning, and management of sustainable cities in the capital urban agglomeration of China.

DOI

[46]
Taubenböck H, Wegmann M, Roth A et al., 2009. Urbanization in India: Spatiotemporal analysis using remote sensing data.Computers, Environment and Urban Systems, 33(3): 179-188.Urbanization is arguably the most dramatic form of irreversible land transformation. Though urbanization is a worldwide phenomenon, it is especially prevalent in India, where urban areas have experienced an unprecedented rate of growth over the last 30 years. In this uncontrolled situation, city planners lack tools to measure, monitor, and understand urban sprawl processes. Multitemporal remote sensing has become an important data-gathering tool for analysing these changes. By using time-series of Landsat data, we classify urban footprints since the 1970s. This lets us detect temporal and spatial urban sprawl, redensification and urban development in the tremendously growing 12 largest Indian urban agglomerations. A multi-scale analysis aims to identify spatiotemporal urban types. At city level, the combination of absolute parameters (e.g. areal growth or built-up density) and landscape metrics (e.g. SHAPE index) quantitatively characterise the spatial pattern of the cities. Spider charts can display the spatial urban types at three time stages, showing temporal development and helping the reader compare all cities based on normalized scales. In addition, gradient analysis provides insight into location-based spatiotemporal patterns of urbanization. Therefore, we analyse zones defining the urban core versus the urban edges. The study aims to detect similarities and differences in spatial growth in the large Indian urban agglomerations. These cities in the same cultural area range from 2.5 million inhabitants to 20 million (in the metropolitan region of Mumbai). The results paint a characteristic picture of spatial pattern, gradients and landscape metrics, and thus illustrate spatial growth and future modelling of urban development in India.

DOI

[47]
Tian Q, Guo L, Zheng L, 2016. Urbanization and rural livelihoods: A case study from Jiangxi Province, China. Journal of Rural Studies, 47(Part B): 577-587.61Follow Arthur Lewis to further elaborate rural-urban development dynamics amid urbanization.61Use a systems approach to understand the complex processes underlying rural livelihoods.61Identify the multifaceted constraints on rural livelihoods, with an emphasis on institutions.61Qualitative approach offers a deeper understanding of households' decision-making.61Reflect on how policy may guide urbanization to benefit rural households.

DOI

[48]
Wang J, Wang X, 2015. New urbanization: A new vision of China׳s urban-rural development and planning.Frontiers of Architectural Research, 4(2): 166-168.

DOI

[49]
Wang Y, Liu Y, Li Y et al., 2016. The spatio-temporal patterns of urban-rural development transformation in China since 1990.Habitat International, 53(1): 178-187.61The research comprehensively assesses urban–rural development transformation in China.61The western and northeastern regions of China experienced slower transformation than other regions between 1990 and 2010.61The initial development level and moderate socioeconomic changes lead to coordinated urban–rural development.61Related urban–rural policies aimed at different regional patterns help to reach balanced urban–rural development in transitional China.

DOI

[50]
Wei Y D, 2015. Spatiality of regional inequality.Applied Geography, 61(1): 1-10.Spatial inequality has drawn renewed scholarly interests and societal concerns. This paper reviews the literature on regional inequality, with a focus on spatiality of regional economic/income inequality, to make a timely contribution for a better understanding of the complexity and dynamics of spatial inequality. We find that existing theories disagree over temporal trends and underlying forces of regional inequality, and spatio-temporal models have been favored by economic geographers. It also shows that the research on regional inequality covers all continents of the world, including both developed and developing countries. The scope of research has also been broadened, expanding to household and environmental inequalities. The paper proposes components of spatiality of regional inequality, including scale, location, physical geography, place, space, spatial network, and spatial-temporal models. The paper also proposes areas for future research.

DOI

[51]
Yu D, Wei Y D, 2008. Spatial data analysis of regional development in Greater Beijing, China, in a GIS environment.Papers in Regional Science, 87(1): 97-117.Abstract. This study investigates spatial dependence and mechanisms of regional development in Greater Beijing, China by employing spatial statistical techniques. We have detected positive, strengthening global spatial autocorrelation from 1978 to 2001, and found such strengthening is the result of newly formed/extended clusters in the area. The local analysis recognizes local regimes of two-tier urban-rural spatial structure at the beginning of the reform period. While the urban-rural divide was lessening due to the reform, a north-south divide has emerged because of local natural conditions and development trajectories. Regarding mechanisms of regional development, ordinary least squares analysis is constrained by the existence of significant spatial autocorrelation among spatial units. Analytical results reveal that an error spatial regression model is a more appropriate alternative due to possible mismatch between boundaries of the underlying spatial process and the spatial units where data are organised. In 1995 and 2001, the signs of all the regression coefficients remained the same for both OLS and spatial models. However, their magnitude and significance change. Specifically, foreign direct investment and fixed-asset investment became less influential in the spatial model, while local government spending emerged as more influential. Abstract. Este estudio investiga la dependencia especial y los mecanismos de desarrollo regional en el Gran Beijing, China, empleando técnicas estadísticas espaciales. Hemos detectado una autocorrelación espacial global en aumento y positiva desde 1978 al 2001, y hallado que dicho aumento es el resultado de clusters formados/ampliados recientemente en el área. El análisis local reconoce regimenes locales de estructura espacial urbana-rural de dos niveles al inicio del periodo de reforma. Mientras que la separación urbana-rural fue disminuyendo con la reforma, ha aparecido una separación norte-sur por condiciones naturales locales y trayectorias de desarrollo. Respecto de los mecanismos de desarrollo regional, el análisis de mínimos cuadrados ordinario (OLS) se ve restringido por la existencia de una autocorrelación espacial significativa entre unidades espaciales. Los resultados de análisis revelan que un modelo de regresión del error espacial es una alternativa más apropiada debido a una posible disparidad entre los límites del proceso espacial subyacente y las unidades espaciales donde están organizados los datos. En 1995 y en 2001, los signos de todos los coeficientes de regresión permanecieron iguales para OLS y modelos espaciales. Sin embargo, su magnitud y significancia cambian. En particular, la inversión extranjera directa y la inversión en activos fijos pasaron a ser menos influyentes en el modelo espacial, mientras que el gasto del gobierno local apareció más influyente.

DOI

[52]
Zhao P, 2010. Sustainable urban expansion and transportation in a growing megacity: Consequences of urban sprawl for mobility on the urban fringe of Beijing.Habitat International, 34(2): 236-243.The effect of urban expansion on transportation in growing megacities has become a key issue in the context of global climate change as motorized mobility is a major source of domestic greenhouse gas emissions. The management of forms of urban development on the city fringe in order to encourage a sustainable transport system is usually overlooked in China, although it is increasingly attracting attention in developed countries. Examining the case of Beijing, this paper aims to reveal the policy implications of urban growth management for sustainable transportation in China's megacities. The analysis shows that in the rapid urban expansion process there has been obvious urban sprawl on the fringe of Beijing, characterized by low density and dispersed development in its physical aspect and a low degree of local mixed land use in its functional aspect. Trip distance and car use for travel on the city fringe have increased greatly due to urban sprawl. The results of the analysis suggest that urban growth management designed to curb urban sprawl would contribute to containing the growth in vehicle miles travelled in the suburbs. In addition, since urban sprawl has been greatly fuelled by increasing local government autonomy and fiscal responsibility, the negative effects of sprawling development on transportation certainly reflect the government's failure to manage growth in the current transformation process. To achieve sustainable urban expansion, stronger metropolitan development management measures should be enforced to control local development on the city fringe and promote sustainable transportation.

DOI

[53]
Zhao S, Zhou D, Zhu C et al., 2015. Spatial and temporal dimensions of urban expansion in China.Environmental Science & Technology, 49(16): 9600-9609.Abstract The scale of urbanization in China during the past three decades is unprecedented in human history, and the processes are poorly understood. Here we present an effort to map the urban land expansion processes of 32 major cities in China from 1978 to 2010 using Landsat satellite data to understand the temporal and spatial characteristics. Results showed that the urban extent of the 32 cities expanded exponentially with very high annual rates varying from 3.2% to 12.8%. Temporal fluctuation in urban expansion rates in these 32 cities was obvious, with unexpected and alarming expansion rates from 2005 to 2010 that drastically exceeded their expectation, which was calculated from the long-term trend between 1978 and 2005, by 45%. Overall, we found that the growth rates of cities during the entire study period were inversely related to city size, contradicting the theory or Gibrat's law, which states that the growth rate is independent of city size. More detailed analysis indicated that city growth in China has transitioned from contradicting to conforming to Gibrat's law since 1995. Our study suggests that the urban expansion theory (i.e., Gibrat's law) does not fit Chinese expansion consistently over time, and the exact causes are unknown. Exploring the causes in future research will improve our understanding of the theory and, more importantly, understand the feasibility of the theoretical relationship between city size and expansion rate in guiding contemporary urban expansion planning.

DOI PMID

Outlines

/