Characterizing the changing environment of cropland in the Songnen Plain, Northeast China, from 1990 to 2015

  • ZHANG Yuan , 1, 2 ,
  • ZANG Shuying , 3, * ,
  • SUN Li 3 ,
  • YAN Binghe 3 ,
  • YANG Tianpeng 1 ,
  • YAN Wenjia 1 ,
  • MEADOWS E Michael 1, 4 ,
  • WANG Cuizhen 5 ,
  • QI Jiaguo 6
Expand
  • 1. Key Laboratory of Geographic Information Science (Ministry of Education), School of Geographic Sciences, East China Normal University, Shanghai 200241, China
  • 2. Institute of Eco-Chongming, East China Normal University, Shanghai 200062, China
  • 3. Key Laboratory of Remote Sensing Monitoring of Geographic Environment, College of Heilongjiang Province, Harbin Normal University, Harbin 150025, China
  • 4. Department of Environmental & Geographical Science, University of Cape Town, Rondebosch 7701, South Africa
  • 5. Department of Geography, University of South Carolina, Columbia, SC 29208, USA
  • 6. Center for Global Change and Earth Observations and Department of Geography, Michigan State University, East Lansing, MI 48824, USA
*Corresponding author: Zang Shuying (1963-), Professor, specialized in remote sensing of land. E-mail:

Author: Zhang Yuan (1975-), PhD and Associate Professor, specialized in remote sensing of agroecology. E-mail:

Received date: 2018-01-10

  Accepted date: 2018-04-10

  Online published: 2019-04-19

Supported by

National Natural Science Foundation of China, No.41571410, No.41571199, No.41401589

Copyright

Journal of Geographical Sciences, All Rights Reserved

Abstract

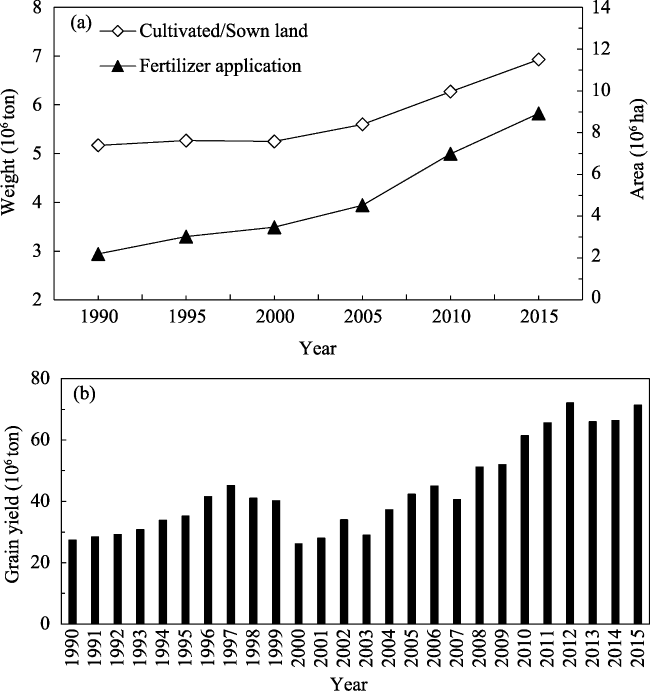
Quantitative characterization of environmental characteristics of cropland (ECC) plays an important role in maintaining sustainable development of agricultural systems and ensuring regional food security. In this study, the changes in ECC over the Songnen Plain, a major grain crops production region in Northeast China, were investigated for the period 1990-2015. The results revealed significant changes in climate conditions, soil physical properties and cropland use patterns with socioeconomic activities. Trends in climate parameters showed increasing temperature (+0.49°C/decade, p < 0.05) and decreasing wind speed (-0.3 m/s/decade, p < 0.01) for the growing season, while sunshine hours and precipitation exhibited non-significant trends. Four topsoil parameters including soil organic carbon (SOC), clay, bulk density and pH, indicated deteriorating soil conditions across most of the croplands, although some do exhibited slight improvement. The changing amplitude for each of the four above parameters ranged within -0.052 to 0.029 kg C/kg, -0.38 to 0.30, -0.60 to 0.39 g/cm3, -3.29 to 2.34, respectively. Crop production significantly increased (44.0 million tons) with increasing sown area of croplands (~2.5 million ha) and fertilizer application (~2.5 million tons). The study reveals the dynamics of ECC in the Songnen Plain with intensive cultivation from 1990 to 2015. Population growth, economic development, and policy reform are shown to strongly influence the spatiotemporal changes in cropland characteristics. The study potentially provides valuable scientific information to support sustainable agroecosystem management in the context of global climate change and national socioeconomic development.

Cite this article

ZHANG Yuan , ZANG Shuying , SUN Li , YAN Binghe , YANG Tianpeng , YAN Wenjia , MEADOWS E Michael , WANG Cuizhen , QI Jiaguo . Characterizing the changing environment of cropland in the Songnen Plain, Northeast China, from 1990 to 2015[J]. Journal of Geographical Sciences, 2019 , 29(5) : 658 -674 . DOI: 10.1007/s11442-019-1620-3

1 Introduction

Cropland is a complex agroecosystem in which climate, soil and human activities are principal functional determinants (Bohlen and House, 2009). Reciprocal interactions between these elements combine to determine yields in response to environmental and management factors (Figure 1). Climate and soil provide the required energy and nutrients for crop growth, while human activity can adjust both cropping practices and soil management such as tillage and application of fertilizers. Variations in climate and soil conditions directly affect both cropping regimes and management practices for croplands. In turn, intensive cultivation, especially over extended periods, may alter soil properties which then influence crop production. Changes in soil characteristics result in a range of environmental impacts, including the moisture regime, the carbon budget at the climate-soil interface and even local or regional climate (Hillel and Rosenzweig, 2011, 2013). To understand such a complex system, there is a need to analyze the longer-term dynamics of environmental characteristics of cropland (ECC) (Bakker et al., 2011). At present, it has become more feasible due to the increasing availability of big data analysed using robust methods and yielding predictive insights. Quantification of spatiotemporal changes in environmental factors in croplands is critical for understanding their interactions and for promoting their sustainable management in the future.
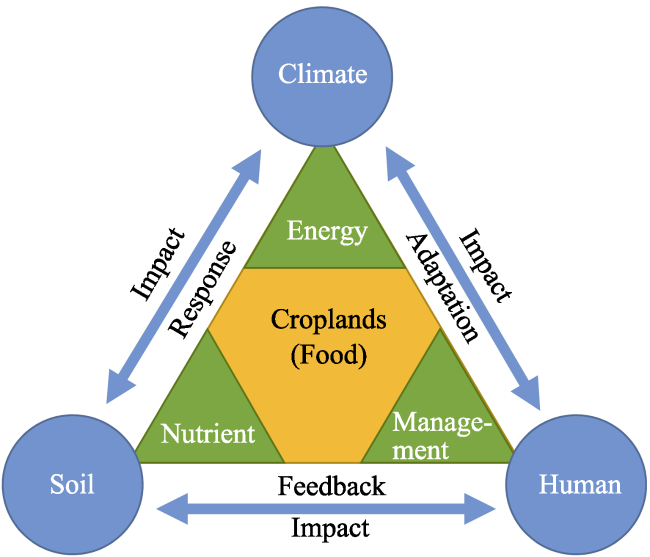
Figure 1 Conceptual diagram of a cropland ecosystem
As a typical cropland ecosystem, The Songnen Plain in Northeast China has experienced evident changes in the agricultural environment since the early 1990s. Climate changes could exert various (positive or negative) impacts on cropland cultivation and agroecosystem structure and function (IPCC, 2007; Li et al., 2012). In the Songnen Plain, increasing growing season temperature may further result in the northern land becoming more suitable for cultivation. This potentially stimulates farmers to reclaim grassland, wetlands and woodlands for agriculture (Wang et al., 2011; Huang et al., 2012; Qiu et al., 2016). On the other hand, climate warming may have negative effects on crop production because of increased evapotranspiration (Schauberger et al., 2017). Any resulting soil moisture deficiency may induce water stress for rain-fed crops. In the Songnen Plain, seasonal drought is most frequent during spring and autumn (Wang et al., 2004; Huang and Wang, 2010). Extended periods of drought over large areas are frequently associated with severe losses of agricultural production (Song et al., 2014a).
Cropland soils are highly susceptible to changes in climate. Mean temperature and precipitation are important in influencing SOC formation and decomposition (Quideau et al., 2001; Wagai et al., 2008; Podwojewski et al., 2011). Many previous studies have found that SOC content decreases with rising temperature (Burke et al., 1989; Jobbágy and Jackson, 2000; Dai and Huang, 2006; Homann et al., 2007; Fantappiè et al., 2011), while there is less consensus regarding the relationship between SOC and changing precipitation (Alvarez and Lavado, 1998; Wang et al., 2010a; Xia et al., 2010; Zhou et al., 2016). Land use/cover change is an important determinant of soil carbon changes (Richter and Houghton, 2011) but different conclusions have been drawn in this regard. Carbon loss in agricultural soils in the semi-arid and semi-humid regions of Northeast China has certainly been widely reported (Piao et al., 2009; Wu et al., 2003; Zhuang et al., 2007; Xie et al., 2007). In the Songnen Plain, SOC has declined significantly due to reclamation and tillage over an extended period (Wang et al., 2010b; Jiang et al., 2016).
Since the 1990s, cropland area in the Songnen Plain increased significantly (JSB, 2016; HSB, 2016). Many grasslands, sandy lands and abandoned farmlands have been reclaimed or reused by farmers in pursuing greater economic returns. Conversion of grassland to land for agricultural purpose has in fact been a convention for many decades in order to meet the socioeconomic demand (Wang et al., 2011). Tan et al. (2014) recorded that both cropped area and yield of maize have risen by more than 50% in southern part of the Songnen Plain since 2000. The increased grain yield accompanied the growth in sown area of arable lands, the input of, for example, fertilizer was also favoured by greater efficiency of management practices (Meng et al., 2016).
However, there are significant challenges to the ongoing sustainability of agriculture in the Songnen Plain. It is anticipated that the rate of growth in cropland area will decline gradually in China as economic development and urbanization progress (Zhang and Wang, 2014). The agro-pastoral ecotone in the west of Songnen Plain is highly vulnerable to climate dynamics (frequent floods and drought) and land degradation (in particular salinization and alkalinization) (Wen et al., 2012). Moreover, ongoing population growth in China will result in increasing demand for food resources from croplands suitable for cultivation (National Bureau of Statistics of China, 2016). In addition, regionally unbalanced economic development has exerted comprehensive pressures on the cropland productivity (Chen et al., 2011). Therefore, understanding the dynamics of ECC in the Songnen Plain is essential for facilitating sustainable development of agriculture and ensuring national food security in the future, more especially against the backdrop of ongoing population growth and climate change (Tilman et al., 2002).
This study aims to develop a synthesis of trends in environmental and cropland dynamics, to explain the processes underlying the spatiotemporal trends in terms of changes in climate, soil and land use policy and management factors for the period from 1990 to 2015. The paper establishes, in relation to the 25-year period, the following objectives: 1) To describe changing climate, as exhibited by measures of mean annual temperature, precipitation and wind conditions, and to compare these parameters with those for the May to October growing season in particular; 2) to identify changing soil properties as indicated by measurements of soil organic carbon, clay content, bulk density and pH; and 3) to characterize the changes in cropland and to compare the satellite-derived land use dynamics with crop production figures based on available agronomic data. This study ultimately targets the goal of improving the management of cropland resources in the Songnen Plain against a background of future climate change.

2 Data and methods

2.1 Study area

As one of three major plains in Northeast China, the Songnen Plain occupies approximately 2.375 × 10⁵ km2 and lies between 121°40′E-128°30′E and 42°30′N-51°20′N (Figure 2). Elevation ranges from 80 m to 1670 m above sea level, the lower elevation central plain being surrounded by Changbai Mountains to the east, Da Hinggan Mountains to the west and Xiao Hinggan Mountains to the north. The region experiences a typical temperate, semi-arid continental monsoon climate with annual mean temperature of 2-6°C and annual precipitation of 400-600 mm, ~80% of which concentrates in summer (June through September). Two major rivers, the Songhuajiang and Nenjiang, traverse the plain through the north and east, and central parts, respectively. These rivers and their associated tributaries (the second Songhuajiang River, Taoer River, Huolin River, Wuyuer River, Lalin River, Hulan River and Raohe River, etc.) together yield abundant water resources that supply the entire plain. The plain occupies one of the major black soil zones in the world (Zhang et al., 2003). The main soil types include black soil (Luvic Phaeozem, FAO), chernozem (Haplic Chernozem, FAO), meadow soil (Eutric Vertisol, FAO), Solonetz (Solonetz, FAO), Solonchak (Solonchak, FAO) and aeolian soil (Arenosol, FAO) (Liu et al., 2009). It is considered to be one of the largest state commercial grain bases in China (Leipnik et al., 2014). Total area of croplands in 2015 approximated 11.5 million ha, accounting for some 7% of the country’s total crop cropping area (~166.37 million ha). The annual grain yield of 71.4 million tons (2015) accounts for about 11.5% of national total (621.44 million tons) (NBS, 2016). The main crops are maize (Zea mays L.), rice (Oryza sativa L.), and soya (Glycine max L.), and a single-season cropping system was the dominant crop management practice in this region (Wang et al., 2003). The total population of the Songnen Plain is more than 37.97 million in 2015 (JSB, 2016; HSB, 2016).
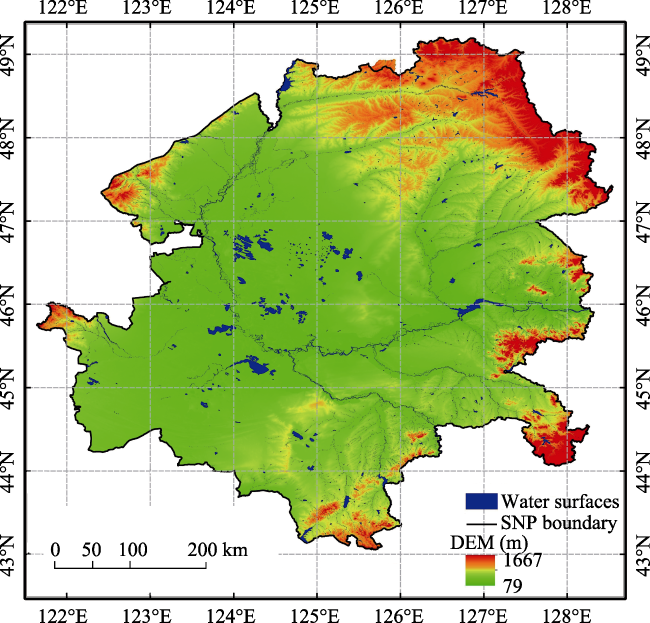
Figure 2 The Songnen Plain, Northeast China and its digital elevation model (DEM)

2.2 Climate data

The climate dataset (1990-2015) comprises four parameters, namely, mean annual temperature, sunshine hours, precipitation, and mean wind speed. The data were acquired from 29 basic weather stations of the Meteorological Information Center affiliated to China Meteorological Administration (Access to China Meteorological Data Sharing Service System, http://data.cma.gov.cn/). For each of the stations covering the Songnen Plain, annual mean temperature (T), total sunshine hours (S), annual total precipitation (P) and annual average wind speed (W) were initially computed.
In the Songnen Plain, growing season of crops is generally within the frost-free period from early May to late September (Wang et al., 2003) which may be extended under the condition of recent climate warming (Chen et al., 2005). Therefore, this study also focuses on characterizing climate conditions in the growing season (May to early October). A separate sub-set of climate data, using only meteorological parameters in May to October, was established to represent conditions during the crop growing season. An analysis of the means of each of the climate parameters for 29 stations was conducted in order to characterize climate dynamics over the past 25 years.
A trend analysis algorithm, the Mann-Kendall (MK) trend test (Mann, 1945; Kendall, 1975; Hirsch et al., 1982), was then implemented to explore spatiotemporal dynamics of the various climate parameters. The statistical analysis within the MK test was performed using RStudio (Version 0.99.903) yielding Z values at various levels of statistical significance (0.2, 0.1, 0.05, 0.02, 0.01 and 0.001).

2.3 Soil data

Two soil datasets were used in this study in order to characterize the soil conditions in both the recent past and present day respectively. Historical soil data were derived from the dataset obtained by the Institute of Soil Science, Chinese Academy of Sciences, and which was compiled based on the second National Soil Survey conducted between 1979-1985. This dataset contains multi-layer soil properties (e.g. organic matter, pH and bulk density), soil texture (sand, silt and clay) at various profile levels at a spatial resolution of 10 km × 10 km (Shi et al., 2004; Yu et al., 2007). Soil organic carbon values (SOC) were calculated by multiplying the organic matter content by a conversion coefficient of 0.58 (Périé and Ouimet, 2008). Historical soil data are used as a benchmark to indicate conditions of Songnen soils in the nominal year 1990, and as representative of soil responses to the relatively consistent agricultural regimes during the period of 1980-1990.
The second soil dataset was acquired in a regional survey conducted by a research group at Harbin Normal University, China. In order to avoid the influences of ploughing and fertilization on the soil characteristics, soil samples of 0-10 cm were collected from the end of April to early May 2015. In all, 993 soil samples from 331 sites (three samples per site) were obtained across the croplands of the Songnen Plain (Figure 3). Sample sites, GPS-located, were located a minimum of 10 m away from roads. Samples were air dried, ground and sieved for subsequent determination of four key soil properties (SOC, pH, bulk density and mechanical composition). SOC was analyzed using a Multi N/C 2100 TOC analyzer (Analytik Jena AG, Germany). A pH meter (REX PHSJ-3F, INESA Instrument Ltd., China) was used to measure the soil acidity. Soil bulk density was determined by measuring the original volume of each soil sample and the dry mass of it after oven-drying at 105°C. Soil mechanical composition (clay, silt, sand) was measured using a Mastersizer 2000 particle size analyzer (Marvern Instruments Ltd., United Kingdom). The soil clay fraction was determined by the percentage of particles with size <0.002 mm in accordance with the USDA classification system (Lu, 2000).
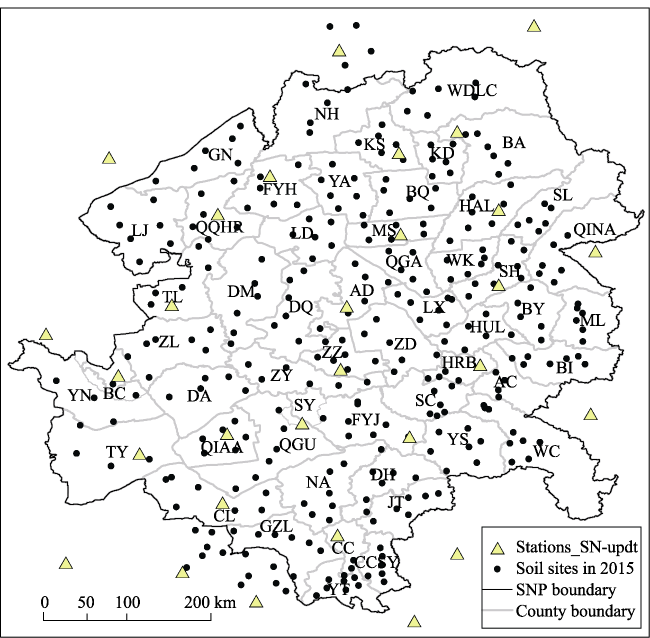
Figure 3 Spatial distribution of climate stations and soil sampling sites observed in 2015
The inverse distance weight (IDW) method (Shepard, 1968) was utilized to interpolate soil parameters using all 331 sampling sites for constructing the spatial distribution maps. The soil parameter maps were resampled into grid size of 10 km in consistency with that of the nominal 1990 soil maps. In this study, four major parameters of the topsoil (0-10 cm), SOC (kg C/kg), pH, bulk density (g/cm3) and clay fractional content (%) were mapped for both historical and contemporary soils, facilitating the consideration of spatiotemporal changes in topsoil physical properties of croplands over a 25-year period of intensive cultivation.

2.4 Land use types and cropping information

In order to characterize the changing agricultural land use situation, remote sensing images from Landsat-5 (1990) and Landsat-8 (2015/2016), accessed via http://glovis.usgs.gov/, were classified by visual interpretation in ArcGIS software (ESRI Co., Ltd) three main categories, paddy fields, other cultivated lands and urban and rural built-up areas (Table 1). The resultant classified maps (see below section 3.3) characterize the spatiotemporal dynamics of three major land use types from 1990 to 2015. Additionally, statistical data derived from Jilin Statistical Yearbook (1991-2016) and Heilongjiang Statistical Yearbook (1991-2016) were employed to investigate cropland dynamics, as well as grain production and fertilizer application in the Songnen Plain. Total cropped area of croplands, fertilizer consumption and grain yield were calculated for each of the 53 administrative counties or cities, of which 18 counties are located in Jilin Province and other 35 counties in Heilongjiang Province.
Table 1 Landsat-5 TM images acquired in 1990 and Landsat-8 OLI in 2015/2016 for cropland mapping
RS imagery Path No. Acquisition date for each row No.
R26 R27 R28 R29 R30
Landsat-5
TM
P117 - 1990/6/20, 1990/8/07 1990/6/20, 1990/8/07 1990/8/07 -
P118 1990/6/27 1990/6/27 1990/6/27, 1990/9/15 1990/6/27, 1990/9/15 1990/6/27, 1990/9/15
P119 1990/7/04, 1990/9/06 1990/7/20, 1990/9/06 1990/7/20,
1990/9/06
1990/7/04 -
P120 1990/6/25 1990/6/25 1990/6/25 1990/7/11 -
P121 - - 1990/8/03 - -
Landsat-8
OLI
P117 - 2015/9/29 2015/5/24 2015/5/24 -
P118 2016/5/17 2016/5/17 2016/5/17 2016/5/17 2016/5/17
P119 2015/9/24 2015/5/22 2015/5/22 2015/5/22 2015/6/23
P120 2016/5/31 2016/5/31 2016/5/31 2016/5/31 -
P121 - - 2015/6/21 - -

3 Results

3.1 Changes in climatic conditions of croplands

On first inspection of the climate parameters, there appears no marked trends in mean annual temperature, sunshine hours and precipitation from 1990 to 2015, although average wind speed does show a strong decreasing trend over the period (Figure 4). On closer scrutiny, however, some interesting temporal trends in key climate variables are evident that are likely to have an influence on crop productivity. For example, prior to 2001, annual precipitation exhibits a general decreasing trend, with the exception of 1998 which experienced extreme flooding due to the El Niño of 1997-1998 (McPhaden, 1999). From 2001 onwards, the mean annual precipitation appears to be on the increase. Sunshine hours gradually increase between 1990 and 2001, but decrease markedly to 2015. Sunshine hours in 1998, 2003 and 2013 are somewhat lower, associating with more cloudy and/or rainy days (Figures 4a and 4b). For the growing season, the same four climate parameters in the dataset are characterized just for the May to October period (Figures 4c and 4d). Among them, three variables (precipitation, sunshine hours and wind speed) exhibit similar trends for the growing season (May to October) as the annual dynamics in general. However, a growing season warming trend is evident from 1990 to 2002, followed by a period (2003 to 2015) of relatively stable temperatures. In general, the mean temperature increase 0.49°C/decade (p < 0.05) and wind speed decrease 0.3 m/s/decade (p < 0.01) for the growing season are found from 1990 to 2015 (Figures 4c and 4d).
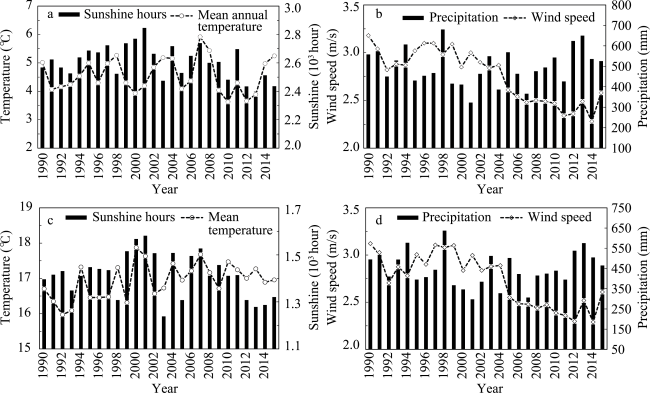
Figure 4 Climate parameters in the Songnen Plain from 1990 to 2015. (a) annual sunshine hours and annual mean temperature, (b) annual precipitation and annual mean wind speed, (c) sunshine hours and mean temperature in the growing season (May-October), and (d) precipitation and mean wind speed in the growing season
The results of the Mann-Kendal trend analysis for the growing season are presented in Figure 5, which illustrates the spatial distribution of Z-values across the region during the time period of 1990-2015. More positive Z-values are interpreted as indicating parameter values increasing over time, as opposed to lower (or more negative) values (Hirsch et al., 1982). There is a clear increasing trend in mean temperature during the growing season (Figure 5a), while wind speed declines (Figure 5d). The increase in temperature is especially marked in counties of the northeastern, eastern, southwestern and western parts of the region. Growing season rainfall appears to vary little. It exhibits a slight decreasing trend over the whole plain, with the exception of some areas in the west and the south (Figure 5c). Sunshine hours also vary little, with some areas in the eastern and the northern-central parts experiencing a slight decrease (Figure 5d).
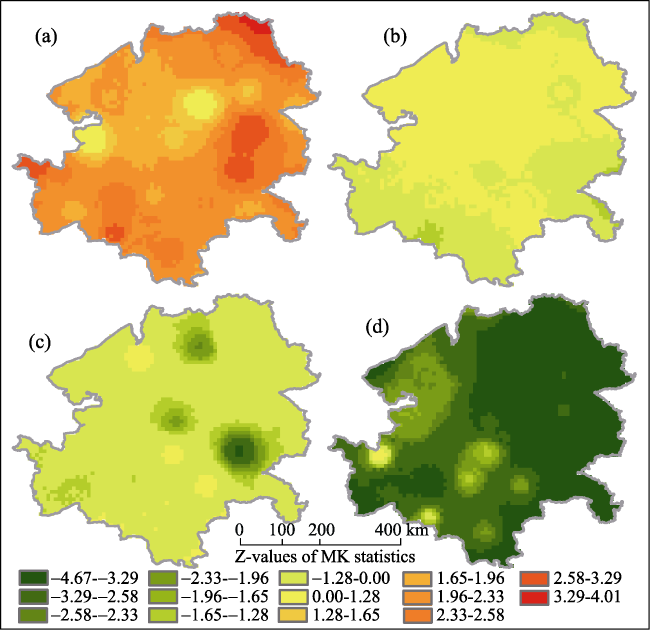
Figure 5 Trends of 4 main climate factors for growing season (May to October) by using Mann-Kendall (MK) trend test tool, where the Z value is denoted by the changing significance of climate factors. (a) mean temperature, (b) sunshine hours, (c) precipitation and (d) mean wind speed; positive values denote increase and negative values denote decrease over the period 1990-2015

3.2 Changes in cropland soil conditions

Soil conditions are indicated in the interpolated distribution maps for both 1990 and 2015 (Figure 6). They show that SOC and clay content are generally higher in the north and east, mainly the forestlands (Figures 6a1, 6b1, 6a2 and 6b2). Whereas soil bulk density and pH values are higher in the central and southwestern regions (Figures 6a3, 6b3, 6a4 and 6b4). Marked gradients are evident in the patterns exhibited by some of the parameters. Especially prominent are the lower SOC values in the southwestern part of the plain, evident in both the 1990 and 2015 situations (Figures 6a1 and 6b1), a converse pattern repeated in the case of pH where soils in the southwest are considerably more alkaline with pH of 10 (Figures 6a4 and 6b4) than those to the north and east. Clay content also exhibits quite strong NE-SW contrasts, with much higher values (~50%) in the northern and eastern sectors (Figures 6a2 and 6b2), while bulk density values are higher (1.5 g/cm3) in the west and southwest of the plain (Figure 6a3).
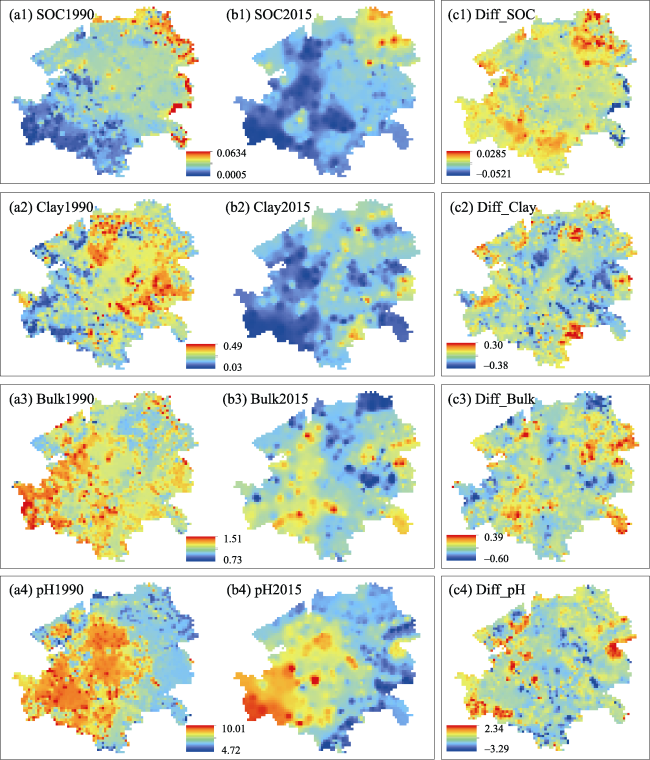
Figure 6 Spatial distribution of soil properties in 1990 and 2015, and their corresponding differences representing the increased (positive values) or decreased (negative values) trend in SOC, clay, bulk density and pH
As for differences between 1990 and 2015, a decreasing trend in SOC (negative values) is observed across much of the Songnen Plain except for minor increases (positive values) in parts of the the south central, west and northwest areas. The most notable increase is in the northeast where a maximum of 0.0285 kg C/kg (Figure 6c1) was added over time. Large areas of the central plain exhibit a decreasing trend with respect to clay content, apart from several small areas of the southeast and north-central (Figure 6c2). Decreasing bulk density is apparent in the west (Figure 6c3). Soil pH substantially decreases for most areas although increases slightly in parts of the southwest, northwest and east-central regions (Figure 6c4).

3.3 Changes in cropland use

Over the past three decades, the Songnen Plain has experinced an observable change, one of most prominent manifestations is the conversion of land use types (Cui et al., 2015). The Songnen Plain, as a major agricultural production area, can be expected to reflect the impacts of environmental changes interacting national economic policy in China.
The distribution map of cropland shows the Songnen Plain has experienced a considerable cropland expansion since 1990 (Figure 7). The increased croplands are mainly derived from grassland and wetlands (Wang et al., 2011; Huang et al., 2012). Forested lands in the eastern parts of the region and grasslands in the southwestern have also decreased significantly during the period from 1990 to 2015. They are converted to dryland crop cultivation, an observed pattern that concurs with that reported by Liu et al. (2009). The major cropland types are paddy fields for rice and dryland for maize. Lowland rice has been increasing since the early 1990s, partly at the expense of decreasing dryland crops in the northwestern, west central and southeastern parts of the Songnen Plain (Figure 7). This is mainly attributed to the greater economic income from rice production compared to maize or soya (Liu et al., 2009; Gao and Liu, 2011).
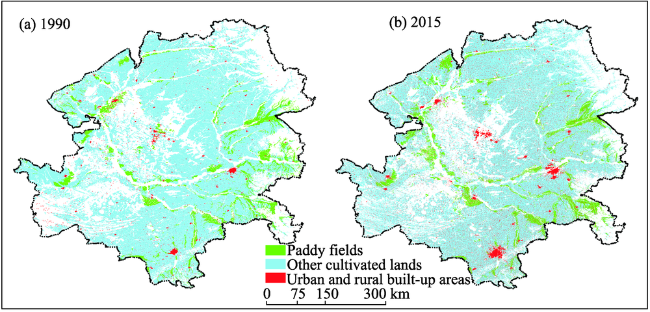
Figure 7 Spatial distribution of croplands (drylands and rice paddies) and built-up areas in 1990 and 2015
Agronomic statistics reveal these trends clearly, both sown areas of cropland and fertilizer applications in the Songnen Plain increased by ~4 million ha and ~2.5 million tons, respectively over the period 1990-2015 (Figure 8). From around the year 2000 onwards, the increase in sown area is especially marked (Figure 8a). Accordingly, the grain production increases over 44.0 million tons from 27.76 million tons in 1990 to 71.37 million tons in 2015 (Figure 8b). This substantial upturn in both sown area and grain production of croplands resulted from the widespread reclamation of grassland, woodland and wetlands, which was closely related to the rapid population growth and pursuit of economic benefits (Gao et al., 2006; Liu et al., 2009). In order to promote grain productivity, huge quantities of chemical fertilizer (now >5 million tons annually) are applied to the croplands of the region to provide the burgeoning population with grain in order to safeguard food security (Figure 8a). In fact, over the ten year period from 2005 to 2015, the rate of fertilizer consumption increase has exceeded the growth rate in cropped area (Figure 8a). Although this may have positive effects on annual grain yields (Figure 8b), such long-term excessive inputs of chemical fertilizer may have deleterious impacts on the soil biological, physical and chemical properties as have been reported elsewhere (Dong et al., 2014; Qu et al., 2014).
Figure 8 Agronomic statistics (total sown area, fertilizer inputs and grain output) in the Songnen Plain, from 1990 to 2015

4 Discussion

4.1 Effects of changing climate on croplands

Some elements of the changing climate appear to have positive influences on agriculture, such as increased mean temperature and total precipitation which may have led to some of the more northerly or higher elevation areas becoming more favorable for cultivation. However, it is not only mean or total climate characteristics that determine the relative success or failure of croplands. For example, the more frequent occurrence of extreme events, such as heat waves, heavy rain/storms and floods, droughts are also important. Such hazards pose sig nificant challenges to agricultural production and in severe cases are associated with loss of livelihoods and possibly irreversible economic damage.
Since 1990, several extreme weather events have been recorded, such as the most severe flood event in the past 100 years that occurred in the summer of 1998 in the Songhuajiang and Nenjiang River catchments. In that year, the total precipitation in the Songnen Plain was 680 mm, of which 637 mm were recorded between May and October (by far the highest recorded over the studied period). Drought is also a significant stressor; for example, northern China as a whole experienced extremely high temperatures and negative monthly precipitation anomalies in the summers of 2000 and 2001, resulting in reduced grain yields (Guo et al., 2017). In recent years, floods and droughts in the region have occurred with increasing frequency (Liu et al., 2014; Wang et al., 2015). There was another widespread drought in 2007 and severe flooding again in 2013.
It can be anticipated that greater frequency and magnitude of future extreme hydrometeorogical events as predicted by IPCC 2013 will exacerbate the vulnerability of the cropland ecosystem. This pose a serious challenge to grain production in the Songnen Plain, considering the likely future trajectory of climate conditions. Therefore, systematic strategy is needed to construct a cropland system that can be adapted to the changing climate conditions, and to ensure the system continues to operate effectively in the future.

4.2 Variability in soil properties

The top layer (A horizon) of a soil profile is most vulnerable and sensitive to environmental changes. Changes in such properties are a consequence of both natural and anthropogenic factors, e.g. climatic change, population increase, overgrazing, and intensive cultivation etc.
Soil organic carbon plays important roles both in mitigating climate change (Lal, 2004) and in sustaining soil fertility. As noted in section 3.2, the declined SOC is evident for the entire Songnen Plain, while there are some small areas where SOC has actually increased, especially in the northeast (Figure 6c1). Indeed, this change has been reported previously for this part of the region, as Mao et al. (2014) noted the increased average SOC levels (+0.56 kg C/m2) between 1980 to 2010 attributed to the extensively adopted management practice of leaving crop residue in the field after harvest. Clearly, this demonstrates that introduction of appropriate soil and crop management practices, such as returning crop residue, manure application and less (or no-) tillage, can reduce SOC loss in croplands.
The decreasing trend in pH of soils across some areas of the plain suggests that there have been important developments in addressing soil salinization and alkalinization problems, these have been especially apparent in parts of Jilin Province (Wang et al., 2003; Jiang et al., 2010; Chi et al., 2012). However, for large area of saline-alkali lands remain in the western parts of the plain, there is a further risk that temperature and moisture changes may lead to more severe soil salinization (Yang et al., 2010; Wang and Li, 2013). These lands might be the potentially important agricultural resource for cropping. As such, this situation demands further study and implementation of appropriate management interventions.

4.3 Cropland use changes with socioeconomic development and policy reform

4.3.1 Impacts and effects of policy reform on croplands
Government policy reform has been a key factor driving land use changes in China as a whole (Ding, 2003). China’s “economic reform and opening up” policy was initiated in the late 1980s. Since the “market economy” was implemented in 1992, some grasslands, sandy lands and abandoned farmlands have been reclaimed or reused by farmers for pursuing more economic benefits. The grain yield is closely related to the area of arable lands, the amount of agricultural inputs (e.g. water, fertilizer, etc.) and the efficiency of management practices. Along with the extension and intensification of agriculture, soil degradation, including accelerated loss of the topsoil and associated reduction in organic matter, has aroused concern for the protection of cropland resources (Chaplin-Kramer et al., 2015). In response to what was being touted as an environmental crisis, China launched the “Grain for Green” project, in 1999, a policy which appears to have had very positive results on soil carbon in many localities (Deng et al., 2014; Song et al., 2014b). Economic compensation provided by the government has stimulated farmers to return degraded cropland in particular to forestland or grassland. In addition, the increasing urban sprawl of recent years has seen many of the original croplands being expropriated for infrastructure construction in major cities of the region such as Changchun, Harbin, Daqing and Qiqihar (Figure 7). Cropland has been consumed in the process of constructing, for example, transport routes, including highways and the high-speed railway, industrial, commercial and residential areas but has also been consolidated through concentration of the dispersed rural population in a number of smaller urban centres (Liu et al., 2014). As a major national provider of commercial grain, the Songnen Plain is of considerable strategic importance to China. In the long run, effective sustainable management and scientific planning of the existing and future cropland resources will be essential to the productivity of agriculture in the region (Lu et al., 2015).
4.3.2 Outlook of cropland uses under future socioeconomic development
Early in 2017, the central government enacted a new regulation to promote structural reforms in agriculture supply side (accessible at: http://politics.people.com.cn/n1/2017/0206/ c1001-29059337.html, in Chinese). The goal of this reform is to enhance the productivity of cropland and improve overall efficiency of the agricultural resource base. As part of the new strategy, agricultural regionalization is aimed at identifying several key production regions for major crops (e.g. rice, wheat, soya and maize) and to introduce evidence-based, informed cropland management systems. The new regulations may influence spatial distribution of major crops, including paddy rice, maize and soya in the Songnen Plain. A second element of the new regulations deals with the reclamation of degraded land in the agro-pastoral ecotone of northern China and includes projects to protect and restore natural wetlands and to return farmland to forest. In addition, efforts to protect the black soil regions of Northeast China are to be intensified with the aim of increasing SOC in the associated croplands. All of this implies that the cropland areas of the Songnen Plain will be under stricter control and that further expansion of cultivated areas will not be possible to meet the greater demands.
The national crop production base has to provide food consistently for a population of more than a billion people, and the plain will have to continue to play their part in meeting this demand. Alternatives such as increasing crop yield per unit area, improvements in soil fertility, selection of high-quality crop cultivars and the adoption of more scientific agronomic practices will need to be considered. The promotion of ‘Smart Agriculture’ (Xiong et al., 2014) is also a promising option for the future sustainability of cropland in the Songnen Plain.

5 Conclusions

A synthesis of multiple data sources for climate factors, soil physical properties and cropland use patterns, in combination with statistics on grain production and fertilizer application, were used in our study to characterize changes in ECC across the Songnen Plain, Northeast China, for the period 1990 to 2015. Major findings are listed below:
(1) Spatiotemporal analyses in climate conditions over the Songnen Plain during the period 1990-2015 indicated a clear increasing trend in mean temperature, especially in the growing season, while wind speed declined significantly. The changing rate of mean temperature and wind speed was 0.49°C/decade (p<0.05) and 0.3 m/s/decade (p<0.01), respectively. The sunshing hours experienced an increase and then decrease process. In contrast, the precipitation represented a converse trend with first decrease and then increase trajectory. The increased temperature and precipitation have had positive influences on crop cultivation. This has been manifested in the increased area (7.39 million ha in 1990 to 11.50 million ha in 2015) of croplands in the northern part of the Songnen Plain. However, the increased frequency of floods and droughts proved to be major stress factors limiting crop production and grain yield.
(2) Change analysis in topsoil properties indicated that four major physical parameters showed generally decreasing trends for most croplands of the Songnen Plain, notwithstanding observable increases in a few of sparsely distributed areas. The changing amplitude ranges from -0.052 to 0.029 kg C/kg, -0.38 to 0.30, -0.60 to 0.39 g/cm3, -3.29 to 2.34 for SOC, clay content, bulk density and pH, respectively. The decline in SOC over large areas of croplands in the central plain to some extent could reduce soil fertility and further productivity of croplands. Otherwise, the increasing trends of pH in the western part of the Songnen Plain demands introduction of ameliorative measures to mitigate future aggravation and expansion of salinization in the region.
(3) Grain production significantly increased from 27.76 million tons in 1990 to 71.37 million tons in 2015 with increasing sown areas of croplands (~4 million ha) and fertilizer applications (~2.5 million tons). However, the continued expansion of cities and associated transportation infrastructure over the Songnen Plain is expected with the fast urbanization process in China. Present challenges is to protect the existing croplands and to maintain their capacity to provide sufficient grain for ensuring ongoing food security. Scientifically-based planning decisions for the croplands and the introduction and promotion of effective management practices are therefore of considerable importance.
In conclusion, the observed changes in environmental characteristics of cropland in the Songnen Plain may be attributed to a combination of natural and anthropogenic driving forces. The interplay of all environmental factors associated with the climate, soil and human intervention determines the dynamics over the period of 1990-2015 in the region.

The authors have declared that no competing interests exist.

[1]
Alvarez R, Lavado R S, 1998. Climate, organic matter and clay content relationships in the Pampa and Chaco soils, Argentina.Geoderma, 83: 127-141.Temperature and precipitation have strong effects on soil processes. The Pampa and the Chaco are vast plains with soils mainly derived from loess. Our objective was to study the effects of temperature and precipitation of both regions on selected soil properties. Using data from soil surveys for ca. 65 Mha, we defined 40 geographic units of ca. 1.6 Mha each. Organic carbon content (g cm-3), solum thickness and clay content were averaged for each unit. Temperature. precipitation and potential evapotranspiration were obtained from climatic records. Carbon inputs to the different soil layers were estimated by calculating net primary productivity of ecosystems and partitioning coefficients of above and belowground biomass. Inputs were affected by a retention factor taking into account temperature effects on organic matter decomposition. Soil organic carbon increases with higher precipitation and decreases with higher temperature. Consequently, the organic carbon content in the top 0-50 cm soil layer is positively correlated with the precipitation/temperature ratio (potential model r2 = 0.693, P < 0.001). Carbon inputs to the soil explained 72% of organic carbon variations. Mean turnover time of soil carbon was estimated to be 14 yr. Solum thickness and clay amount (g cm-2) are not associated with temperature but the ratio precipitation/potential evapotranspiration explained 85% (P < 0.001) of the variation in the former and 79% (P < 0.001) in the later. Soils are deeper and with higher clay contents where this ratio increases, a consequence of available water for pedogenic processes. Climate is a main soil forming factor in the Pampa and Chaco regions. Clay neoformation and possible future trends of organic carbon under different climatic global change scenarios were estimated.

DOI

[2]
Bakker M M, Hatna E, Kuhlman T et al., 2011. Changing environmental characteristics of European cropland.Agricultural Systems, 104(7): 522-532.The spatial configuration of agricultural systems is continuously changing in response to changes in demand for agricultural goods, changes in the level of competition between different land use activities, and progress in agricultural technology. This may lead to a change in the location of agricultural systems and consequently to a change in their average environmental characteristics. This paper explores the change in environmental characteristics of cropland (horticulture and field crops) over the years 1950, 1990 and 2000, for Western and Eastern Europe, using basic descriptive statistics. Underlying mechanisms are explored with logistic (interaction) regression analysis. We find that in both Eastern and Western Europe, crop cultivation shifted away from cities. In Western Europe cropland became situated on shallower soils, steeper slopes, and drier and less accessible areas. Probable reasons are that technical progress reduced the importance of traditional constraints such as drought, poor soils, and distance from markets, so that crop farmers were allowed to move to warm and sunny areas where potential productivity is highest. In addition, cropland probably lost some of its competitive power to grassland and nature. In Eastern Europe cropland concentrated on deeper soils and flatter terrain from 1990 onward. Here, the abandonment of the central planning system and a more flexible land market must have allowed a shift of cropland towards more suitable locations.

DOI

[3]
Bohlen P J, House G, 2009. Sustainable Agroecosystem Management: Integrating Ecology, Economics, and Society. Boca Raton: CRC Press.

[4]
Burke I C, Yonker C M, Parton W J et al., 1989. Texture, climate, and cultivation effects on soil organic matter content in U.S. grassland soils.Soil Science Society of America Journal, 53(3): 800-805.

DOI

[5]
Chaplin-Kramer R, Sharp R P, Mandle, Let al., 2015. Spatial patterns of agricultural expansion determine impacts on biodiversity and carbon storage.PNAS, 112(24): 7402-7407.The agricultural expansion and intensification required to meet growing food and agri-based product demand present important challenges to future levels and management of biodiversity and ecosystem services. Influential actors such as corporations, governments, and multilateral organizations have made commitments to meeting future agricultural demand sustainably and preserving critical ecosystems. Current...

DOI PMID

[6]
Chen C Q, Lei C X, Deng A X et al., 2011. Will higher minimum temperatures increase corn production in Northeast China? An analysis of historical data over 1965-2008.Agricultural and Forest Meteorology, 151(12): 1580-1588.Recent crop model projections have shown that crop production may benefit from warming, especially in the high latitudes, but hard evidence is limited. In this study we conducted correlation and regression analyses of climate records of seventy-two meteorological stations and records of corn yield over the period 1965–2008 in Northeast China. It was found that over these forty-four years, the diurnal mean, minimum and maximum temperatures during corn growing season increased on average by 0.31°C, 0.42°C and 0.23°C every ten years, respectively. No significant change in precipitation was found, although differences between years were large. The daily minimum temperature was the dominant factor to corn production. Corn yield was significantly correlated with the daily minimum temperature in May and September. According to a regression analysis of the anomalies of corn yield and air temperature, a 1.0°C increase in daily minimum temperature in May or September will lead to an increment of 303kgha611 or 284kgha611 in corn yield, respectively. Corn varieties with longer growth duration will profit most from the climatic changes but agronomic practices may have to be modified to address expected weather extremes such as droughts and periods with heavy rainfall.

DOI

[7]
Chen X Q, Hu B, Yu R, 2005. Spatial and temporal variation of phenological growing season and climate change impacts in temperate eastern China.Global Change Biology, 11: 1118-1130.Using phenological and normalized difference vegetation index (NDVI) data from 1982 to 1993 at seven sample stations in temperate eastern China, we calculated the cumulative frequency of leaf unfolding and leaf coloration dates for deciduous species every 5 days throughout the study period. Then, we determined the growing season beginning and end dates by computing times when 50% of the species had undergone leaf unfolding and leaf coloration for each station year. Next, we used these beginning and end dates of the growing season as time markers to determine corresponding threshold NDVI values on NDVI curves for the pixels overlaying phenological stations. Based on a cluster analysis, we determined extrapolation areas for each phenological station in every year, and then implemented the spatial extrapolation of growing season parameters from the seven sample stations to all possible meteorological stations in the study area.

DOI

[8]
Chi C M, Zhao C W, Sun X J et al., 2012. Reclamation of saline-sodic soil properties and improvement of rice (Oriza sativa L.) growth and yield using desulfurized gypsum in the west of Songnen Plain, northeast China.Geoderma, 187/188: 24-30.

DOI

[9]
Cui X, Zhu W, Xu X et al., 2015. Land-use Changes in China: Historical Reconstruction Over the Past 300 Years and Future Projection. Danvers: World Scientific.

[10]
Dai W, Huang Y, 2006. Relation of soil organic matter concentration to climate and altitude in zonal soils of China.Catena, 65(1): 87-94.With a total of 886 data sets distributed in different regions of China, the relation of soil organic matter (SOM) concentration to climate and altitude was investigated. These data sets were obtained from the 2nd National Soil Survey of China that was completed in early 1980s. According to climate gradient and vegetation community succession, six geographical regions, including eastern, southern, northern, northeastern, northwestern and southwestern China, were divided to identify the key factors regulating surface SOM concentration in different geographical regions. Correlation analysis indicates that surface SOM concentration is in general negatively correlated with annual mean temperature ( T) and positively correlated with annual mean precipitation ( P) and altitude ( H). A further investigation suggested that multiple regression models with different combination of T, P and H could explain 41.5% 56.2% of the variability in surface SOM concentration for different geographical regions, while the driving variables are different. Variables of T and P determined surface SOM concentration in northern, northeastern and northwestern China. In eastern and southern China, variables of P and H are key factors regulating surface SOM concentration. Surface SOM concentration in southwestern China is determined by a linear combination of T, P and H.

DOI

[11]
Deng L, Liu G B, Shangguan Z P et al., 2014. Land use conversion and changing soil carbon stocks in China’s ‘Grain-for-Green’ Program: A synthesis.Global Change Biology, 20: 3544-3556.Abstract <p>The establishment of either forest or grassland on degraded cropland has been proposed as an effective method for climate change mitigation because these land use types can increase soil carbon (C) stocks. This paper synthesized 135 recent publications (844 observations at 181 sites) focused on the conversion from cropland to grassland, shrubland or forest in China, better known as the ‘Grain-for-Green’ Program to determine which factors were driving changes to soil organic carbon (SOC). The results strongly indicate a positive impact of cropland conversion on soil C stocks. The temporal pattern for soil C stock changes in the 0–10002cm soil layer showed an initial decrease in soil C during the early stage (502years) coincident with vegetation restoration. The rates of soil C change were higher in the surface profile (0–2002cm) than in deeper soil (20–10002cm). Cropland converted to forest (arbor) had the additional benefit of a slower but more persistent C sequestration capacity than shrubland or grassland. Tree species played a significant role in determining the rate of change in soil C stocks (conifer

DOI PMID

[12]
Ding C R, 2003. Land policy reform in China: Assessment and prospects.Land Use Policy, 20(2): 109-120.

DOI

[13]
Dong W Y, Zhang X Y, Dai X Qet al., 2014. Changes in soil microbial community composition in response to fertilization of paddy soils in subtropical China.Applied Soil Ecology, 84: 140-147.Repeated fertilizer applications to cultivated soils may alter the composition and activities of microbial communities in terrestrial agro-ecosystems. In this study, we investigated the effects of different long term fertilization practices (control (CK), three levels of mineral fertilizer (N1P1K1, N2P2K2, and N3P3K3), and organic manure (OM)) on soil environmental variables and microbial communities by using phospholipid fatty acid (PLFA) biomarkers analysis in subtropical China. Study showed that OM treatment led to increases in soil organic carbon (SOC), total nitrogen (TN) and total phosphorus (TP) contents, while the mineral fertilizer treatment led to increases in dissolved organic carbon (DOC) content. Changes in soil microbial communities (eg. bacteria, actinomycetes) were more noticeable in soils subjected to organic manure applications than in the control soils or those treated with mineral fertilizer applications. Fungal PLFA biomarkers responded differently from the other PLFA groups, the numerical values of fungal PLFA biomarkers were similar for all the OM and mineral fertilizer treatments. PCA analysis showed that the relative abundance of most PLFA biomarkers increased in response to OM treatment, and that increased application rates of the mineral fertilizer changed the composition of one small fungal PLFA biomarker group (namely 18:3 6c and 16:1 5c). Further, from the range of soil environmental factors that we examined, SOC, TN and TP were the key determinants affecting soil microbial community. Our results suggest that organic manure should be recommended to improve soil microbial activity in subtropical agricultural ecosystems, while increasing mineral fertilizer applications alone will not increase microbial growth in paddy soils.

DOI

[14]
Fantappiè M, L'Abate G, Costantini E A C, 2011. The influence of climate change on the soil organic carbon content in Italy from 1961 to 2008.Geomorphology, 135(3/4): 343-352.Soils are the biggest carbon store in the world (1500 Gt, e.g. 1.5 × 10 21 g). The European Commission indicates the accounting of soil organic carbon (SOC) variations in space and time as the first step in the strategy for soil protection. It is indeed necessary in evaluating the risk of soil organic matter decline and soil biodiversity decline, and when evaluating the role played by soils in global CO 2 accounting. Previous maps of SOC variations in Italy did not consider the direct effect of climate. There is a marked inter-dependence between SOC and climate. SOC increases with the increase in precipitations and decreases with a rise in temperatures. It is also known that land use and management have a bigger impact on SOC than climate. The aim of this work is to understand to what extent the SOC variations occurring in Italy from 1961 to 2008 could be explained by climate change. The soil database of Italy was the source of information for SOC content: 17,817 observations (3082 before and 14,735 after 31 Dec 1990). SOC content was referred to the first 50 cm of soil depth, one single data obtained by weighted horizon thickness. SOC content was expressed as percentage by weight (dag kg 61 1) analyzed by the Walkley–Black procedure and converted to ISO standard. The CRA–CMA (Research Unit for Climatology and Meteorology Applied to Agriculture) database was the source of information for climatic data. We considered the mean annual temperature (MAT) and mean value of total annual precipitation (MAP) of the two periods 1961–1990 and 1991–2006, and we mapped them by regression kriging with elevation and latitude as predictors. The climate change between the two periods was characterized by a general MAT increase, which was greater at lower altitudes and higher latitudes. The precipitation generally decreased, with some local exceptions. Some linear regression analyses were used to investigate the relationship between SOC content and climate/land use. Temperatures had most relevant impact on SOC with an inverse correlation. SOC content was directly correlated with precipitations on arable lands and inversely in forests and meadows. Two general multiple linear regression analyses considered all the pedogenesis factors and: either by time periods (1979–1990; 1991–2009), model 1; or by MAT and MAP, model 2. The two models both had low precision (multiple R-squared = 0.26–0.27; RMSE = 1.42; IoA = 0.61), but very different accuracies. Model 1 correctly predicted the mean SOC values for the 3 land uses in the 2 periods, detecting a significative decrease in all three land uses. Model 2 was not accurate every time. SOC decreases estimated with model 2 were always significatively lower than the observed ones. Model 2 did not estimate a significative SOC decrease in forests. Climate change had a general low influence on SOC variations. The relatively higher climatic influence occurred in meadows and in agricultural areas with a moderate or high MAP decrease (<61100 mm/y) and a moderate to high MAT increase (> 0.62 °C). Other changes, probably linked to land management, need to be investigated to explain SOC variations.

DOI

[15]
Gao J, Liu Y S, Chen Y F, 2006. Land cover changes during agrarian restructuring in Northeast China.Applied Geography, 26: 312-322.During the last quarter of the 20th century the agrarian sector in China went through a series of reforms. Changes in government policy on land use led to extensive changes in land cover, culminating in the 1990s. These changes were detected from multi-temporal Landsat TM images of 1990, 1995 and 2000 for Northeast China. Overlay of the mapped land cover in ArcInfo showed that farmland and grassland decreased while water, built-up areas, and woodland increased. More than three-quarters of the detected changes occurred during 1990 1995. Farmland changed mainly to woodland, water, and built-up areas while woodland and grassland were converted chiefly to farmland. Spatially, the change from woodland to farmland adjoined the margin of natural forests while change in the opposite direction was restricted to the agropastoral west. Paradoxically, reclamation of grassland to farmland also took place in the agropastoral west. These conflicting changes were caused primarily by lack of stability and consistency in the government's land use policies.

DOI

[16]
Gao J, Liu Y S, 2011. Climate warming and land use change in Heilongjiang Province, Northeast China.Applied Geography, 31: 476-482.This study explores the relationship between climate warming and rice paddy expansion in Heilongjiang Province of China. It is found that paddy fields more than quadrupled from 3479 km in 1958 to 14 564 km in 1980, and increased further to 21,940 km in 2000. The newly gained paddy fields originated chiefly from dry fields (46.35%), swamps (30.22%), and primary forest (nearly 10%) during 1958–1980. During 1980–2000 paddy fields expanded at the expense of dry fields (70.50%), swamp (16.59%), and grassland (10.13%). Analysis of climate data shows a warming of over 2 °C from the 1960s to the 2000s in most places. All 28 meteorological stations except one experienced a warming trend. Spatially, the expansion of paddy fields coincided closely with the spatial distribution of annual temperature. These fields were located mostly between the isolines of 2–3 °C. Sowing area of grain increased at a modest rate during the 1970s and the 1980s when >0 °C area expanded rapidly. However, sowing area of rice rose in the 1990s and 2000s at a rate twice higher than that for sowing area of grain in the preceding decades. Thus, the expansion of paddy fields at the expense of other land covers was made possible owing to climate warming in the preceding decade. On average, it takes about 20 years for agricultural practices to adapt to the warmer climate.Research highlights? The 0°C isoline shifted northwards by thousands of km during 1990s-2000s. ? The over six-fold increase in paddy fields coincided closely with climate warming. ? This expansion was made possible owing to a 2.11° C rise in annual temperature. ? Agricultural practices adapted to the warmer climate about 20 years later.

DOI

[17]
Guo E, Liu X, Zhang J et al., 2017. Assessing spatiotemporal variation of drought and its impact on maize yield in Northeast China.Journal of Hydrology, 553(Suppl. C): 231-247.

DOI

[18]
Heilongjiang Statistical Bureau (HSB), 2016. Heilongjiang Statistical Yearbook 2016. Beijing: China Statistics Press. (in Chinese)

[19]
Hillel D, Rosenzweig C, 2011. Handbook of Climate Change and Agroecosystems: Impacts, Adaptation, and Mitigation. London: Imperial College Press.

[20]
Hillel D, Rosenzweig C, 2013. Handbook of Climate Change and Agroecosystems: Global and Regional Aspects and Implications. London: Imperial College Press.

[21]
Hirsch R M, Slack J R, Smith R A et al., 1982. Techniques for trend analysis for monthly water quality data.Water Resources Research, 18(1): 107-121.

DOI

[22]
Homann P S, Kapchinske J S, Boyce A, 2007. Relations of mineral-soil C and N to climate and texture: Regional differences within the conterminous USA.Biogeochemistry, 85(3): 303-316.Soil is a prominent component of terrestrial C and N budgets. Soil C and N pools are influenced by, and may reciprocally influence, many environmental factors. Our objective was to determine the quantitative relations of surface mineral-soil organic C, N, and C/N ratios to climate and soil texture across seven ecological regions that make up the conterminous USA. Up to 608 soil profiles per region and their corresponding climates were evaluated with regression analysis. The organic C pool (kg C m ) in the upper 20 cm of mineral soil was positively related to mean annual precipitation, evapo-transpiration and clay content in all regions. It was negatively related to a temperature/precipitation index in all regions and negatively related to mean annual temperature, except in the northwest temperate forest region. Soil C/N ratios were negatively related to clay or silt content in all regions. These relations are consistent with concepts of moisture and temperature controls on detrital production, differential effects of temperature on detrital production and decomposition, and stabilization of organic matter by clay and silt. Differences in quantitative relations among regions may be related to vegetation-composition effects on soil organic matter processes, clay mineralogy, and faunal mixing of surface organic horizons with mineral soil. Regional differences also occurred in the importance of climate vs. soil texture in explaining the variability in soil C. The regional differences indicate the importance of using region-specific, rather than generalized, equations for projecting long-term soil responses to climate change and for conducting ecosystem-model calibration or validation.

DOI

[23]
Huang F, Wang P, 2010. Vegetation change of ecotone west of Northeast China Plain using time-series remote sensing data.Chinese Geographical Science, 20(2): 167-175.

DOI

[24]
Huang F, Wang P, Zhang J, 2012. Grasslands changes in the northern Songnen Plain, China during 1954-2000.Environmental Monitoring and Assessment, 184(4): 2161-2175.Songnen Plain in Northeast China is one of the most significantly altered biological hotspots on Earth. Based on the information from integrated topographic maps, Landsat MSS, TM/ETM images and geographic information systems, grassland cover change, grassland fragmentation, agricultural reclamation, and saline-alkaline wasteland expansion in the region were investigated for the period of 1954 to 2000. The results showed that the native grassland decreased by 44.6 × 10(4)02ha and moderate density grassland decreased from 78.3 × 10(4) to 20.3 × 10(4)02ha. Calculated from change dynamic model, the annual decrease rate of grassland was 1.1%.The distribution center of the grasslands illustrated a trend of shifting southeastward. The distance between centroids of grassland was 10.102km. The numbers of grassland patch increased by 1,378, while the patch size of grasslands declined. Grassland experienced substantial clearing and fragmentation. The decreased grassland was converted into cropland, wetland, and saline-alkaline wasteland. The loss and degradation of grasslands was closely related to regional climate during the past 4702years. Population and livestock number increased significantly as grassland quality decreased. Intensive human activities including irrational reclamation and overgrazing may have accelerated the degradation of grasslands.

DOI PMID

[25]
IPCC (Intergovernmental Panel on Climate Change), 2007. Climate Change 2007: The Physical Science Basis. Contribution of Working Group I to the Fourth Assessment Report of the Intergovernmental Panel on Climate Change. London: Cambridge University Press.

[26]
IPCC (Intergovernmental Panel on Climate Change), 2013. Climate Change 2013: The Physical Science Basis. Contribution of Working Group I to the Fifth Assessment Report of the Intergovernmental Panel on Climate Change. London: Cambridge University Press.

[27]
Jiang L, Zhang L, Zang S et al., 2016. Accuracy assessment of approaches to spatially explicit reconstruction of historical cropland in Songnen Plain, Northeast China.Journal of Geographical Sciences, 26(2): 219-229.

DOI

[28]
Jiang S C, He N P, Wu L et al., 2010. Vegetation restoration of secondary bare saline-alkali patches in the Songnen Plain, China.Applied Vegetation Science, 13(1): 47-55.Questions: What factors limit vegetation restoration of secondary bare saline-alkaline patches (BSAP) in the Songnen grassland of northeast China? Is there any adaptive approach to promote revegetation in the shortest time possible and at a low cost? Location: Northeast China. Methods: Considering the climate, soil saline-alkalization and available seed sources, a new approach was adopted to restore vegetation in BSAP, which were formed by the degradation of typical Leymus chinensis grasslands owing to long-term overgrazing.The experimental treatments included no treatment (CK), fencing (F), fencing+inserting cornstalks (FS), fencing+inserting cornstalks+ sowing L. chinensis (FSL) and fencing+inserting cornstalks+sowing Puccinellia chinampoensis (FSP). The assumptions behind inserting cornstalks were not only that they would create safe sites for initial revegetation but also that they would enhance seed input by trapping and containing the seeds from seed movement on the BSAP surface. Results: Seed bank shortage was an important factor limiting initial revegetation in BSAP; seed movement on the BSAP surface could provide the necessary seed source if it were contained by effective measures. Vegetation at the sites FS, FSL and FSP was restored well in terms of the above-ground biomass and coverage. Inserted cornstalks acted as safe sites that enhanced the plant survival rate in BSAP; they also enhanced the ability to contain seed movement, thus providing a seed source for initial revegetation. Along with initial revegetation, tussocks around cornstalks can provide better safe sites, which in turn can accelerate subsequent vegetation restoration in BSAP. Conclusions: The approach entails the strategic use of diverse seed sources and the construction of safe sites with agricultural byproducts (cornstalks); therefore, it is a low-cost method and can be used on a widespread scale. The results provide vigorous support in favor of vegetation restoration in BSAP and severely degraded grasslands in the region. In practice, this approach can be used in degraded ecosystems with compacted soil surfaces (including arid and salt-affected soils) to promote revegetation in various regions.

DOI

[29]
Jilin Statistical Bureau (JSB), 2016. Jilin Statistical Yearbook 2016. Beijing: China Statistics Press. (in Chinese)

[30]
Jobággy E G, Jackson R B, 2000. The vertical distribution of soil organic carbon and its relation to climate and vegetation.Ecological Applications, 10(2): 423-436.As the largest pool of terrestrial organic carbon, soils interact strongly with atmospheric composition, climate, and land cover change. Our capacity to predict and ameliorate the consequences of global change depends in part on a better understanding of the distributions and controls of soil organic carbon (SOC) and how vegetation change may affect SOC distributions with depth. The goals of this paper are (1) to examine the association of SOC content with climate and soil texture at different soil depths; (2) to test the hypothesis that vegetation type, through patterns of allocation, is a dominant control on the vertical distribution of SOC; and (3) to estimate global SOC storage to 3 m, including an analysis of the potential effects of vegetation change on soil carbon storage. We based our analysis on >2700 soil profiles in three global databases supplemented with data for climate, vegetation, and land use. The analysis focused on mineral soil layers. Plant functional types significantly affected the vertical distribution of SOC. The percentage of SOC in the top 20 cm (relative to the first meter) averaged 33%, 42%, and 50% for shrublands, grasslands, and forests, respectively. In shrublands, the amount of SOC in the second and third meters was 77% of that in the first meter; in forests and grasslands, the totals were 56% and 43%, respectively. Globally, the relative distribution of SOC with depth had a slightly stronger association with vegetation than with climate, but the opposite was true for the absolute amount of SOC. Total SOC content increased with precipitation and clay content and decreased with temperature. The importance of these controls switched with depth, climate dominating in shallow layers and clay content dominating in deeper layers, possibly due to increasing percentages of slowly cycling SOC fractions at depth. To control for the effects of climate on vegetation, we grouped soils within climatic ranges and compared distributions for vegetation types within each range. The percentage of SOC in the top 20 cm relative to the first meter varied from 29% in cold arid shrublands to 57% in cold humid forests and, for a given climate, was always deepest in shrublands, intermediate in grasslands, and shallowest in forests (P < 0.05 in all cases). The effect of vegetation type was more important than the direct effect of precipitation in this analysis. These data suggest that shoot/root allocations combined with vertical root distributions, affect the distribution of SOC with depth. Global SOC storage in the top 3 m of soil was 2344 Pg C, or 56% more than the 1502 Pg estimated for the first meter (which is similar to the total SOC estimates of 1500-1600 Pg made by other researchers). Global totals for the second and third meters were 491 and 351 Pg C, and the biomes with the most SOC at 1-3 m depth were tropical evergreen forests (158 Pg C) and tropical grasslands/savannas (146 Pg C). Our work suggests that plant functional types, through differences in allocation, help to control SOC distributions with depth in the soil. Our analysis also highlights the potential importance of vegetation change and SOC pools for carbon sequestration strategies.

DOI

[31]
Kendall M G, 1975. Rank Correlation Methods. London: Charles Griffin.

[32]
Lal R, 2004. Soil carbon sequestration to mitigate climate change.Geoderma, 123(1): 1-22.

DOI

[33]
Leipnik M, Su Y, Ye X, 2014. The main agricultural regions of China and the U.S. A Comparative Geography of China and the U.S. Hartmann R and Wang J (eds.). New York: Springer.Most cereal and meat production in both China and America is concentrated in a few regions. The three regions in China discussed are the North-Eastern Plain, the Northern China Plain and the Middle and Lower Yangtze plain. These are centers of corn, wheat and Rice, respectively. The two main cereal production regions of the U.S are the Corn Belt in the North-Central Midwest and the larger Great Plains region farther to the west. The Corn Belt is dominated by corn production but pigs are important and extensively exported including to China. Wheat is dominant in the Great Plains and cattle are an important associated livestock resource. Each of these five regions is vital to world food security and commodity price stability and thus deserve the special attention this chapter devotes to them.

DOI

[34]
Li Z, Tang H, Yang P et al., 2012. Spatio-temporal responses of cropland phenophases to climate change in Northeast China.Journal of Geographical Sciences, 22(1): 29-45.AbstractWe investigated the responses of cropland phenophases to changes of agricultural thermal conditions in Northeast China using the SPOT-VGT Normalized Difference Vegetation Index (NDVI) ten-day-composed time-series data, observed crop phenophases and the climate data collected from 1990 to 2010. First, the phenological parameters, such as the dates of onset-of-growth, peak-of-growth and end-of-growth as well as the length of the growing season, were extracted from the smoothed NVDI time-series dataset and showed an obvious correlation with the observed crop phenophases, including the stages of seedling, heading, maturity and the length of the growth period. Secondly, the spatio-temporal trends of the major thermal conditions (the first date of 82 10°C, the first frost date, the length of the temperature-allowing growth period and the accumulated temperature (AT) of 82 10°C) in Northeast China were illustrated and analyzed over the past 20 years. Thirdly, we focused on the responses of cropland phenophases to the thermal conditions changes. The results showed that the onset-of-growth date had an obvious positive correlation with the first date of 82 10°C (P

DOI

[35]
Liu D, Wang Z, Song K et al., 2009. Land use/cover changes and environmental consequences in Songnen Plain, Northeast China.Chinese Geographical Science, 19(4): 299-305.The Songnen Plain in Northeast China,one of the key national bases of agricultural production,went through remarkable land use/cover changes in recent years.This study aimed to explore the long-term land use/cover changes and the effects of these changes on the environment.The Landsat-based analysis showed that,during 1986-2000,cropland,built-up land and barren land had increased,among which cropland had the largest increase of 9,198km2 with an increase rate of 7.5%.Woodland,grassland,water body and swampland had decreased correspondingly,among which grassland had the most dramatic decrease of 6,127km2 with a decrease rate of 25.6%.The transition matrix results revealed that grassland,woodland and swampland were the three main land use types converted to cropland.Climate warming created the potential environment for the conversion of grassland and swampland into cropland.Land resources policy made by central and provincial governments of China affected the pattern and intensity of land use.Land use/cover changes accompanied by climatic variation brought out a series of environmental consequences,such as sand desertification of land,land salinization and alkalinization,grassland degradation,and more frequent floods.Under this circumstance,optimized land use structure and restoration measures are needed.

DOI

[36]
Liu S, Zhang P, Lo K, 2014. Urbanization in remote areas: A case study of the Heilongjiang reclamation area, Northeast China.Habitat International, 42: 103-110.

DOI

[37]
Liu Z, Dong X, Liu Z, 2014. Spatiotemporal evolution of the drought and flood in Northeast China. Advanced Materials Research, 1010-1012: 1075-1083.

[38]
Lu R K, 2000. Analytical Method of Soil Agricultural Chemistry. Beijing: China Agricultural Science and Technology Press. (in Chinese).

[39]
Lu Y, Jenkins A, Ferrier R C et al., 2015. Addressing China's grand challenge of achieving food security while ensuring environmental sustainability.Science Advances, 1(1): e1400039.China increasingly urbanized and wealthy population is driving a growing and changing demand for food, which might not be met without significant increase in agricultural productivity and sustainable use of natural resources. Given the past relationship between lack of access to affordable food and political instability, food security has to be given a high priority on national political agendas in the context of globalization. The drive for increased food production has had a significant impact on the environment, and the deterioration in ecosystem quality due to historic and current levels of pollution will potentially compromise the food production system in China. We discuss the grand challenges of not only producing more food but also producing it sustainably and without environmental degradation. In addressing these challenges, food production should be considered as part of an environmental system (soil, air, water, and biodiversity) and not independent from it. It is imperative that new ways of meeting the demand for food are developed while safeguarding the natural resources upon which food production is based. We present a holistic approach to both science and policy to ensure future food security while embracing the ambition of achieving environmental sustainability in China. It is a unique opportunity for China to be a role model as a new global player, especially for other emerging economies.

DOI PMID

[40]
Mann H B, 1945. Nonparametric tests against trend.Econometrica, 13(3): 245-259.

DOI

[41]
McPhaden M J, 1999. Genesis and evolution of the 1997-98 El Niño.Science, 283(5404): 950-954.

DOI

[42]
Mao D, Wang Z, Wu C et al., 2014. Topsoil carbon stock dynamics in the Songnen Plain of Northeast China from 1980 to 2010.Fresenius Environmental Bulletin, 23(2A): 531-539.

[43]
Meng Q, Li D, Zhang J et al., 2016. Soil properties and corn (Zea mays L.) production under manure application combined with deep tillage management in solonetzic soils of Songnen Plain, Northeast China.Journal of Integrative Agriculture, 15(4): 879-890.Poor soil structure and nutrients, excessive exchangeable Na+, high pH as well as low enzyme activities are common in the solonetz, and significantly restrict corn (Zea maysL.) production. Cattle manure application combined with deep tillage is an important management practice that can affect soil physico-chemical properties and enzyme activities as well as corn yield in the solonetz. Field experiments were carried out in a randomized complete block design comprising four treatments: Corn with conventional tillage was used as a control, and corn with manure application combined with deep tillage as well as film mulching and aluminium sulfate were used as the experimental treatments, respectively. The relationship between corn yield and measured soil properties was determined using stepwise regression analysis. Manure application combined with deep tillage management was more effective than conventional tillage for increasing corn yield and for improving soil properties in the solonetz. The highest corn yield was obtained in the treatments with manure application+deep tillage+plastic film mulching (11 472 and 12 228 kg ha 1), and increased by 38 and 43% comparing with the control treatment (8 343 and 8 552 kg ha 1) both in the 2013 and 2014 experiments, respectively. Using factor analysis, three factors were obtained, which represented soil fertility status, soil saline-alkaline properties and soil structural properties both in the 2013 and 2014 experiments, respectively. Manure and deep tillage management resulted in two distinct groups of soil properties: (1) soils with manure application combined with deep tillage and (2) soils with conventional tillage. Stepwise regression analysis showed that corn yield was significantly and positively correlated to urease and available P, as well as negatively correlated to pH, electrical conductivity (EC), exchange sodium percentage (ESP), and bulk density ( b). We concluded that bwas dominant factor for corn yield on the basis of discriminant coefficient. Manure application combined with deep tillage management resulted in an increase in corn yield mainly owing to improved soil structural properties, followed by decreased soil saline-alkaline obstacle as well as increased urease activity and available P. This result is likely that the improvement in soil organic matter (SOM) from manure application greatly and positively contributed to better soil physico-chemical properties and enzyme activities, especially decrease in b. Suggestion for corn production should be improvement in soil structural properties firstly. This could cause decrease in bthat key factor which limited the corn production in the solonetz.

DOI

[44]
National Bureau of Statistics of China (NBSC), 2016. China Statistical Yearbook 2016. Beijing: China Statistics Press.

[45]
Périé C, Ouimet R, 2008. Organic carbon, organic matter and bulk density relationships in boreal forest soils.Canadian Journal of Soil Science, 88(3): 315-325.Relationships between soil organic carbon (SOC), organic matter (SOM), and bulk density (BD) were established in acidic loamy to sandy loam fine fractions of forest soils in Quebec (Canada). The interest of such relationships rests with the possibility of using simple and rapid techniques to estimate SOC and BD. It is also a crucial step in establishing the correspondence among several databases when SOC data are obtained using different measurement techniques. In this study, SOC was measuredby dry combustion (SOCNDC) and wet digestion (SOCWD) methods, and organic matter by loss-on-ignition (LOI). Our results suggest that, in these soils: (1) LOI can be used for estimating SOC (r2 = 0.95, RMSEP = 16%) and SOCDC/SOM significantly decreased with increasing depth from 0.49 to 0.27; (2) SOCDC and SOCWD were highly correlated. Even if SOCWD provided near complete recovery of SOCDC, dry combustion remains the preferred method for SOC analysis since recovery decreased with increasing depth from 100 to 83%. (3) BD was also strongly related to SOM(r2 = 0.81). We recommend using the organic density approach to estimate BD from SOM because it allows BD to be predicted without significant bias and with a degree of accuracy of 14%.

DOI

[46]
Piao S L, Fang, J Y, Ciais P et al., 2009. The carbon balance of terrestrial ecosystems in China.Nature, 458: 1009-1014.The carbon balance of China is of a large scientific and political concern because China is one of the largest fossil fuel CO2 emitter.Here,we use three independent approaches,biomass and soil carbon inventories,biogeochemical models,and atmospheric inversions,to quantify the terrestrial carbon balance of China and its mechanisms.The three approaches produce robustly similar estimates of a net carbon sink in a range of 0.19-0.24 petagrams C per year,indicating that China's terrestrial biosphere has absorbed 28%-37% of its cumulated fossil carbon emission during 1980s and 1990s.The sink is mostly located in southern China,which is related to regional climate change,plantation programs,and shrub recovery.

DOI PMID

[47]
Podwojewski P, Poulenard J, Nguyet M Let al., 2011. Climate and vegetation determine soil organic matter status in an alpine inner-tropical soil catena in the Fan Si Pan Mountain, Vietnam.Catena, 87(2): 226-239.High mountain ecosystems are generally considered to be particularly sensitive to global climate change. Studies of pedogenesis associated with altitudinal variation, vegetation type and soil carbon content on the same type of parent rock are very limited in inter-tropical mountain areas. Therefore the altitudinal variation of soil pedogenesis through 9 selected profiles from the altitude of 1340 m to 3143 m asl, the summit of the Fan Si Pan Mountain, in the north of Vietnam was examined. Fan Si Pan Mountain is composed of a homogenous alkaline granite rock and is the highest point of the Inter-tropical Continental Asia. The Soil Organic Matter properties (C, N, C and N contents) of the different grain-size fractions of the topsoil of 4 selected profiles corresponding to different ecosystems were also examined.Three zones of different soil forming processes were present: Acrisols and Alisols at lower altitudes in sub montane forest, Podzols formed in montane and upper montane forest while Umbrisols formed at high altitude where the forest vegetation had given way to a shrubby vegetation or a steppe composed of dwarfed bamboo. With altitude, soils become sandier, have higher concentration of SiO and are lower in AlO. The selective Fe and Al oxalate (Fe and Al) and pyrophosphate (Fe and Al) extracts show a clear discrepancy between Acrisols or Umbrisols with no clear variation with soil depth and Podzols with high enrichment in their Bs horizon.The SOM status is highly dependent of the organic matter input by the vegetation. In Acrisols, the SOC is linked to the fine fraction within the soil profile with rapid turnover and low C/N values. Podzols are formed by the accumulation on soil surface of OM enriched in the coarse fraction with depleted N and high C/N values. The organic matter input is exogenic and probably seasonal from leaves forming the surface litter while in Acrisols or Umbrisols the SOC is mainly linked to the fine fraction, and with constant N values at depth. In Umbrisols, the SOC origin seems to be linked with endogenic inputs deep in the soil profile mostly produced by the decay of bamboo roots.In this tropical mountainous soil catena, the soil carbon mineralization depends not only on temperature and organo-metallic complexes that stabilize the non labile carbon pool but also is controlled by the pedogenetic process, which is linked with the vegetal ecosystem change with altitude.Research highlights? We examined the variation of soil properties with altitude in a soil catena of an inter-tropical mountain range. ? The Soil Organic Matter (SOM) dynamic depends on the input of the OM in the soil in different ecosystems. ? Organo-metallic complexes stabilize the non-labile carbon pool. ? The understanding of pedogenic processes is necessary to correctly predict the change with altitude of the SOM stocks.

DOI

[48]
Qiu X, Zhang L, Li W et al., 2016. Studies on changes and cause of the minimum air temperature in Songnen Plain of China during 1961-2010.Acta Ecologica Sinica, 36(5): 311-320.

DOI

[49]
Quideau S, Chadwick O A, Benesi A et al., 2001. A direct link between forest vegetation type and soil organic matter composition.Geoderma, 104(1/2): 41-60.Total carbon storage and turnover in soils can be simulated as a series of pools with different turnover rates, ranging from seasonal to millennial. This approach has emphasized the importance of climatic controls on soil organic matter (SOM) dynamics, but implicitly assumes that SOM is minimally influenced by the nature of the plant material from which it is derived. Here we test this assumption by contrasting the influence of climate and vegetation (oak, manzanita, and conifers) on SOM composition in granitic-derived soils from California. Soils developed under the same climate in the San Gabriel Mountains were compared to soils with varying climate along an elevational transect in the Sierra Nevada range. Solid state TOSS CPMAS 13C NMR was used to semiquantitatively characterize the chemical structure of organic matter in litter layers, and low-density and fine silt fractions isolated from sampled A horizons. For all soils, there was a progressive decrease in O-alkyl C, and an increase in alkyl and carbonyl C from the litter to the low-density and fine silt fractions. The NMR spectra of the low-density fractions, and even more so of the fine silt fractions exhibited clear differences in SOM composition associated with different plant genera, regardless of climate. The carbonyl C dominated under oak, O-alkyl C prevailed under manzanita, and alkyl C was prominent under coniferous vegetation. These results indicate that vegetation, not climate, was the factor controlling SOM composition in these soils, and should be taken as a caution against a simplistic climatic interpretation of storage and turnover rate of carbon in soils.

DOI

[50]
Richter D D, Houghton R A, 2011. Gross CO2 fluxes from land-use change: Implications for reducing global emissions and increasing sinks.Carbon Management, 2(1): 41-47.

DOI

[51]
Schauberger B, Archontoulis S, Arneth A et al., 2017. Consistent negative response of US crops to high temperatures in observations and crop models.Nature Communications, 8: 13931.High temperatures are detrimental to crop yields and could lead to global warming-driven reductions in agricultural productivity. To assess future threats, the majority of studies used process-based crop models, but their ability to represent effects of high temperature has been questioned. Here we show that an ensemble of nine crop models reproduces the observed average temperature responses of US maize, soybean and wheat yields. Each day >3065°C diminishes maize and soybean yields by up to 6% under rainfed conditions. Declines observed in irrigated areas, or simulated assuming full irrigation, are weak. This supports the hypothesis that water stress induced by high temperatures causes the decline. For wheat a negative response to high temperature is neither observed nor simulated under historical conditions, since critical temperatures are rarely exceeded during the growing season. In the future, yields are modelled to decline for all three crops at temperatures >3065°C. Elevated CO2can only weakly reduce these yield losses, in contrast to irrigation. Future agricultural productivity is threatened by high temperatures. Here, using 9 crop models, Schaubergeret al. find that yield losses due to temperatures >3065°C are captured by current models where yield losses by mild heat stress occur mainly due to water stress and can be buffered by irrigation.

DOI PMID

[52]
Shepard D, 1968. A two-dimensional interpolation function for irregularly-spaced data. Proceedings of the 23rd Association for Computing Machinery (ACM) National Conference. New York: ACM, 517-524.

[53]
Shi X Z, Yu D S, Warner E D et al., 2004. Soil database of 1:1,000,000 digital soil survey and reference system of the Chinese genetic soil classification system.Soil Survey Horizons, 45(4): 129-136.Shi, X. Z.; Yu, D. S.; Warner, E. D.; Pan, X. Z.; Petersen, G. W.; Gong, Z. G.; Weindorf, D. C., 2004: Soil database of 1:1,000,000 digital soil survey and reference system of the Chinese genetic soil classification system

DOI

[54]
Song X, Li L, Fu G et al., 2014a. Spatial-temporal variations of spring drought based on spring-composite index values for the Songnen Plain, Northeast China.Theoretical and Applied Climatology, 116(3/4): 371-384.A spring-composite index (s-CI) is proposed in this study that involves slightly altering the use of the accumulated precipitation from the composite index (CI) comparing the value with other three commonly used indices (standardized precipitation index, SPI; self-calibrated Palmer drought severity index, sc-PDSI; and CI). In addition, the spatial–temporal variation of the s-CI in the Songnen Plain (SNP) was investigated using the Mann–Kendall test and empirical orthogonal function (EOF) methods. The results indicated that the proposed s-CI could identify most drought events in 1990s and 2000s and performed relatively better than SPI, sc-PDSI, and CI in this region. Compared with the other three indices, the s-CI had a higher correlation with relative soil moisture in April and May. The recent spring droughts (2000s) were the most severe in April or May. The weather was drier in May compared with April in the 1980s, whereas the weather was wetter in May than in April in the 1960s and 1970s. Moreover, the spatial patterns of the first EOFs for both April and May indicated an obviously east–west gradient in the SNP, whereas the second EOFs displayed north–south drought patterns. The proposed index is particularly suitable for detecting, monitoring, and exploring spring droughts in the Songnen Plain under global warming.

DOI

[55]
Song X, Peng C, Ghou G et al., 2014b. Chinese Grain for Green Program led to highly increased soil organic carbon levels: A meta-analysis.Scientific Reports, 4: 4460.The Grain for Green Program (GGP), initiated in 1999, is the largest ecological restoration project in central and western China. Here, for the first time, we performed a meta-analysis and found that the GGP largely increased the soil organic carbon (SOC). The SOC was increased by 48.1%, 25.4%, and 25.5% at soil depths of 0-20 cm, 20-40 cm, and 40-60 cm, respectively. Moreover, this carbon accumulation has significantly increased over time since GGP implementation. The carbon accumulation showed a significantly more active response to the GGP in the top 20 cm of soil than in the deeper soil layers. Conversion of cropland to forest could lead to significantly greater SOC accumulation than would the conversion of cropland to grassland. Conversion from cropland to woodland could lead to greater SOC accumulation than would the conversion to either shrubland or orchard. Our results suggest that the GGP implementation caused SOC to accumulate and that there remains a large potential for further accumulation of carbon in the soil, which will help to mitigate climate change in the near future.

DOI PMID

[56]
Tan J, Yang P, Liu Z et al., 2014. Spatio-temporal dynamics of maize cropping system in Northeast China between 1980 and 2010 by using spatial production allocation model.Journal of Geographical Sciences, 24(3): 397-410.Understanding crop patterns and their changes on regional scale is a critical requirement for projecting agro-ecosystem dynamics. However, tools and methods for mapping the distribution of crop area and yield are still lacking. Based on the cross-entropy theory, a spatial production allocation model (SPAM) has been developed for presenting spatio-temporal dynamics of maize cropping system in Northeast China during 1980-2010. The simulated results indicated that (1) maize sown area expanded northwards to 48 N before 2000, after that the increased sown area mainly occurred in the central and southern parts of Northeast China. Meanwhile, maize also expanded eastwards to 127 E and lower elevation (less than 100 m) as well as higher elevation (mainly distributed between 200 m and 350 m); (2) maize yield has been greatly promoted for most planted area of Northeast China, especially in the planted zone between 42 N and 48 N, while the yield increase was relatively homogeneous without obvious longitudinal variations for whole region; (3) maize planting density increased gradually to a moderately high level over the investigated period, which reflected the trend of aggregation of maize cultivation driven by market demand.

DOI

[57]
Tilman D, Cassman K G, Matson P A et al., 2002. Agricultural sustainability and intensive production practices.Nature, 418: 671-677.

DOI

[58]
Wagai R, Mayer L M, Kitayama K et al., 2008. Climate and parent material controls on organic matter storage in surface soils: A three-pool, density-separation approach.Geoderma, 147(1/2): 23-33.Physically- and biochemically-distinct fractions of soil organic matter (SOM) can be separated by density to yield: (i) low-density plant detritus fraction easily separable from soil minerals (f-LF), (ii) low-density materials strongly associated with minerals (m-LF), and (iii) high-density fraction (HF) rich in microbially-processed organic matter strongly associated with minerals. The factors controlling the pool size and chemistry in these fractions, especially those in m-LF, are unclear. We examined the influence of climate and parent material on SOM in these fractions using two sets of forest soils (0–1002cm mineral horizon) developed from contrasting parent materials (metasedimentary vs. ultrabasic igneous rock) along an altitudinal gradient in Mt. Kinabalu, Borneo. From 70002m to upper altitudes (1700, 270002m), where mean annual temperature decreases from 24 to 1202°C with roughly constant rainfall, surface soil C stocks on both parent materials increased from 2.6–2.8 to 5.4–7.502kg m 61 2 with progressively greater proportions in m-LF and, to less extent, fresher plant detritus fractions. In HF, C and N concentrations increased with altitude though their stocks were roughly constant due to progressively lower bulk density. Labile C assessed by laboratory incubation of bulk soils correlated better with C concentrations in the two LF pools than in HF, especially at the lowest altitude where most SOM is strongly associated with minerals as HF. These results suggest that LF pools are more labile and more sensitive to altitude-induced, climate differences as compared to the HF pool that is protected by the mineral matrix. The C:N ratios of HF on metasedimentary rock increased with altitude (11 to 17) while those on ultrabasic rock remained essentially constant (14–15), implying interactive influence of altitude and parent material on stoichiometry. Unusually high C:N and alkyl-C in m-LF were found in mid-altitude soils, suggesting selective preservation of inherently recalcitrant materials in addition to, or instead of, mineral coating or aggregate occlusion of partially-degraded LF by microbial metabolites.

DOI

[59]
Wang D D, Shi X Z, Wang H J et al., 2010a. Scale effect of climate and soil texture on soil organic carbon in the uplands of Northeast China.Pedosphere, 20(4): 525-535.Understanding how spatial scale influences commonly-observed effects of climate and soil texture on soil organic carbon (SOC) storage is important for accurately estimating the SOC pool at different scales. The relationships among climate factors, soil texture and SOC density at the regional, provincial, city, and county scales were evaluated at both the soil surface (0 20 cm) and throughout the soil profile (0 100 cm) in the Northeast China uplands. We examined 1 022 profiles obtained from the Second National Soil Survey of China. The results indicated that the relationships between climate factors and SOC density generally weakened with decreasing spatial scale. The provincial scale was optimal to assess the relationship between climate factors and SOC density because regional differences among provinces were covered up at the regional scale. However, the relationship between soil texture and SOC density had no obvious trend with increasing scale and changed with temperature. There were great differences in the impacts of climate factors and soil texture on SOC density at different scales. Climate factors had a larger effect on SOC density than soil texture at the regional scale. Similar trends were seen in Heilongjiang and eastern Inner Mongolia at the provincial scale. But, soil texture had a greater effect on SOC density compared with climate factors in Jilin and Liaoning. At the city and county scales, the influence of soil texture on SOC density was more important than climate factors.

DOI

[60]
Wang H, Wan Z, Yu S et al., 2004. Catastrophic eco-environmental change in the Songnen Plain, northeastern China since 1900s.Chinese Geographical Science, 14(2): 179-185.Although the Songnen Plain in the northeastern China was developed relatively late in the temperate zone of the world, its eco-environment has changed greatly. This paper analyzes the changes of land cover and the rates and trends of desertification during the past 100 years in the Songnen Plain. According to the macroscopic analysis, we find that the eco-environment in the plain has reached to the threshold of catastrophic change since the 1950s. The Thom Needle Catastrophic Model was used to determine and validate this conclusion. Human activities, including large-scale construction projects, such as huge dams and dikes, and excessive grazing were the primary factors contributing to regional eco-environmental catastrophe. And irrational reclamation of the wilderness also affected the eco-environmental change. The results reveal the complex human-land interactions.

DOI

[61]
Wang X, Shen H, Zhang W et al., 2015. Spatial and temporal characteristics of droughts in the Northeast China Transect.Natural Hazards, 6(1): 601-614.In this study, drought trends and change magnitudes of the Northeast China Transect (NECT) were analyzed using the Mann-Kendall test and Theil-Sen's slope estimator. Meteorological data from 20 meteorological stations of NECT region from 1957 to 2012 were used. Results demonstrated that five stations had significant negative trends in precipitation. The magnitudes of the significant negative trends at the 95 % confidence level varied from -2.41 +/- 1.05 mm year(-1) at Tonghe station to -1.11 +/- 0.51 mm year(-1) at Qianguoerluosi station. Analysis of the seasonal precipitation series showed a mix of negative and positive trends. Many stations also exhibited strong contrasting seasonal trends that counterbalanced one other at the yearly level. In addition, cluster analysis based on discrete wavelet transform (DWT) was applied to the standard precipitation index (SPI) series. Results revealed three different and spatially well-defined subregions (east, center and west regions of NECT). Due to the decrease in precipitation from the east to the west, land use varies from forest regions in the east, to agriculture in the center, to pastoral areas in the west. Characteristics of drought events for each representative station of different subregions are explored using temporal evolution of the SPI values. Results showed that severe or extreme droughts occurred in 2001, 2003 and 2008 in Tonghe, 1980 and 2007 in Tongliao and 2005-2007 in East Ujimqin Banner. Results indicate that clustering analysis based on DWT has great potential for examining spatial coherence of regional drought, which was consistent with not only the precipitation spatial distribution but also the characteristics of land use in the study area. This study not only provides important information on drought variability in the NECT, but also provides useful information for improving water management strategies and planning agricultural practices.

DOI

[62]
Wang Y, Li Y, 2013. Land exploitation resulting in soil salinization in a desert-oasis ecotone.Catena, 100: 50-56.

DOI

[63]
Wang Z, Huang N, Luo L et al., 2011. Shrinkage and fragmentation of marshes in the West Songnen Plain, China, from 1954 to 2008 and its possible causes.International Journal of Applied Earth Observation and Geoinformation, 13(3): 477-486.Agricultural development under climatic variations has resulted in substantial loss of marshes in the West Songnen Plain in the past decades. In this paper, the shrinkage and fragmentation process of marshes and its possible causes in the West Songnen Plain from 1954 to 2008 were explored using historical topographic maps and remote sensing data. Results indicated that the West Songnen Plain underwent considerable shrinkage and fragmentation of marshes in that same period. Marshes occupied 6404 km in 1954, but this area has decreased by 74% in the past 54 years. The average annual decrease rate of marshes was 88 km per year. Meanwhile, the number of marsh patches decreased from 1411 to 514, and the mean patch size decreased from 454 to 320 ha. Cropland and salinized wasteland were the two main land use types into which marshes were converted. During the same period, grassland decreased by 54%, cropland increased by 22%, and salinized wasteland expanded by 612%. A significant increase in air temperature and index of dryness was found in the study region, along with decreased precipitation, thereby affecting the marsh systems through the changing hydrological regimes. On the other hand, population, gross domestic product, and livestock number increased considerably as marshes shrank and became fragmented. Governmental policy changes played a key role in land use transformations in the study region.

DOI

[64]
Wang Z, Li Q, Li X et al., 2003. Sustainable agriculture development in saline-alkali soil area of Songnen Plain, Northeast China.Chinese Geographical Science, 13(2): 171-174.

DOI

[65]
Wang Z, Zhang B, Song Ket al., 2010b. Spatial variability of soil organic carbon under maize monoculture in the Song-Nen Plain, Northeast China.Pedosphere, 20(1): 80-89.

DOI

[66]
Wen B, Liu X, Li X et al., 2012. Restoration and rational use of degraded saline reed wetlands: A case study in western Songnen Plain, China.Chinese Geographical Science, 22(2): 167-177.AbstractThe protection, restoration and sustainable use are key issues of all the wetlands worldwide. Ecological, agronomic, and engineering techniques have been integrated in the development of a structurally sound, ecologically beneficial engineering restoration method for restoring and utilizing a degraded saline wetland in the western Songnen Plain of China. Hydrological restoration was performed by developing a system of biannual irrigation and drainage using civil engineering measures to bring wetlands into contact with river water and improve the irrigation and drainage system in the wetlands. Agronomic measures such as plowing the reed fields, reed rhizome transplantation, and fertilization were used to restore the reed vegetation. Biological measures, including the release of crab and fish fry and natural proliferation, were used to restore the aquatic communities. The results of the restoration were clear and positive. By the year 2009, the reed yield had increased by 20.9 times. Remarkable ecological benefits occurred simultaneously. Vegetation primary-production capacity increased, local climate regulation and water purification enhanced, and biodiversity increased. This demonstration of engineering techniques illustrates the basic route for the restoration of degraded wetlands, that the biodiversity should be reconstructed by the comprehensive application of engineering, biological, and agronomic measures based on habitat restoration under the guidance of process-oriented strategies. The complex ecological system including reeds, fish and crabs is based on the biological principles of coexistence and material recycling and provides a reasonable ecological engineering model suitable for the sustainable utilization of degraded saline reed wetlands.

DOI

[67]
Wu H B, Guo Z T, Peng C H, 2003. Distribution and storage of soil organic carbon in China.Global Biogeochemical Cycles, 17(2): 1048-1058.[1] Surface soils hold the largest terrestrial organic carbon pool, although estimates of the world's soil organic carbon storage remain controversial, largely due to spatial data gaps or insufficient data density. In this study, spatial distribution and storage of soil organic carbon in China are estimated using the published data from 34,411 soil profiles investigated during China's second national soil survey. Results show that organic carbon density in soils varies from 0.73 to 70.79 kg C/m2 with the majority ranging between 4.00 and 11.00 kg C/m2. Carbon density decreases from east to west. A general southward increase is obvious for western China, while carbon density decreases from north to south in eastern China. Highest values are observed in forest soils in northeast China and in subalpine soils in the southeastern part of the Tibetan Plateau. The average density of 0908048.01 kg C/m2 in China is lower than the world's mean organic carbon density in soil (09080410.60 kg C/m2), mainly due to the extended arid and semi-arid regions. Total organic carbon storage in soils in China is estimated to be 09080470.31 Pg C, representing 0908044.7% of the world storage. Carbon storage in the surface organic horizons which is most sensitive to interactions with the atmosphere and environmental change is 09080432.54 Pg C.

DOI

[68]
Xia X, Yang Z, Liao Y et al., 2010. Temporal variation of soil carbon stock and its controlling factors over the last two decades on the southern Song-nen Plain, Heilongjiang Province.Geoscience Frontiers, 1(1): 125-132.Against the current background of global climate change, the study of variations in the soil carbon pool and its controlling factors may aid in the evaluation of soil’s role in the mitigation or enhancement of greenhouse gas. This paper studies spatial and temporal variation in the soil carbon pool and their controlling factors in the southern Song-nen Plain in Heilongjiang Province, using soil data collected over two distinct periods by the Multi-purpose Regional Geochemical Survey in 2005–2007, and another soil survey conducted in 1982–1990. The study area is a carbon source of 147902t/km 2 and in the past 20 years, from the 1980s until 2005, the practical carbon emission from the soil was 0.1202Gt. Temperature, which has been found to be linearly correlated to soil organic carbon, is the dominant climatologic factor controlling soil organic carbon contents. Our study shows that in the relevant area and time period the potential loss of soil organic carbon caused by rising temperatures was 0.1002Gt, the potential soil carbon emission resulting from land-use change was 0.0902Gt, and the combined potential loss of soil carbon (0.1902Gt) caused by warming and land-use change is comparable to that of fossil fuel combustion (0.2102Gt). Due to the time delay in soil carbon pool variation, there is still 0.0702Gt in the potential emission caused by warming and land-use change that will be gradually released in the future.

DOI

[69]
Xie Z, Zhu J, Liu G et al., 2007. Soil organic carbon stocks in China and changes from 1980s to 2000s.Global Change Biology, 13(9): 1989-2007.The estimation of the size and changes of soil organic carbon (SOC) stocks is of great importance for decision makers to adopt proper measures to protect soils and to develop strategies for mitigation of greenhouse gases. In this paper, soil data from the Second State Soil Survey of China (SSSSC) conducted in the early 1980s and data published in the last 5 years were used to estimate the size of SOC stocks over the whole profile and their changes in China in last 20 years. Soils were identified as paddy, upland, forest, grassland or waste-land soils and an improved soil bulk density estimation method was used to estimate missing bulk density data. In the early 1980s, total SOC stocks were estimated at 89.61 Pg (1 Pg=10 3 Tg=10 15 g) in China's 870.94 Mha terrestrial areas covered by 2473 soil series. In the paddy, upland, forest and grassland soils the respective total SOC stocks were 2.91 Pg on 29.87 Mha, 10.07 Pg on 125.89 Mha, 34.23 Pg on 249.32 Mha and 37.71 Pg on 278.51 Mha, respectively. The SOC density of the surface layer ranged from 3.5 Mg ha 611 in Gray Desery grassland soils to 252.6 Mg ha 611 in Mountain Meadow forest soils. The average area-weighted total SOC density in paddy soils (97.6 Mg ha 611 ) was higher than that in upland soils (80 Mg ha 611 ). Soils under forest (137.3 Mg ha 611 ) had a similar average area-weighted total SOC density as those under grassland (135.4 Mg ha 611 ). The annual estimated SOC accumulation rates in farmland and forest soils in the last 20 years were 23.61 and 11.72 Tg, respectively, leading to increases of 0.472 and 0.234 Pg SOC in farmland and forest areas, respectively. In contrast, SOC under grassland declined by 3.56 Pg due to the grassland degradation over this period. The resulting estimated net SOC loss in China's soils over the last 20 years was 2.86 Pg. The documented SOC accumulation in farmland and forest soils could thus not compensate for the loss of SOC in grassland soils in the last 20 years. There were, however, large regional differences: Soils in China's South and Eastern parts acted mainly as C sinks, increasing their average topsoil SOC by 132 and 145 Tg, respectively. In contrast, in the Northwest, Northeast, Inner Mongolia and Tibet significant losses of 1.38, 0.21, 0.49 and 1.01 Pg of SOC, respectively, were estimated over the last 20 years. These results highlight the importance to take measures to protect grassland and to improve management practices to increase C sequestration in farmland and forest soils.

DOI

[70]
Xiong W, van der Velde M, Holman P et al., 2014. Can climate-smart agriculture reverse the recent slowing of rice yield growth in China?Agriculture, Ecosystems and Environment, 196: 125-136.Worldwide evidence indicates a reduction in the rate of yield growth for many key food crops, but reasons for this remain unclear. Here, we quantitatively demonstrate the role and significance of different drivers (climate change, fertilizer use, change in rice cultivation area, and changes in crop varieties and management) in explaining rice yield development in China, through the use of two temporally and regionally calibrated crop models – EPIC and DSSAT. China’s rice yield has increased from 4324kgha611 in 1981 to 6553kgha611 in 2010, with an evidently slowing growth rate over this time period. The observed flattening growth trend is well captured by both crop models. EPIC simulated a yield increase of 2024kgha611 up to 2010, with agricultural intensification together with increased application of chemical fertilizer and improved crop varieties and management dominating the growth, contributing 64% and 37% respectively, while changes in climate (2%) and cultivation area (613%) contributed only minimally. The recent slowing rate of rice yield growth is largely interpreted as a decreasing relative contribution of fertilizer, that is not being compensated by relative benefits from improved varieties and management. We also find that adaptation to climate change may have contributed to the observed increase of rice yield by facilitating the relocation of rice growing areas and the adoption of improved rice cultivars. Crop model simulations demonstrate that additional yield increases could be achieved through the introduction of rice cultivars and management optimized for climate, suggesting viable options for reversing the slowing of rice yield growth. Moving towards an agriculture that utilizes climate benefits more smartly is one of the solutions to enhance future food supply in China.

DOI

[71]
Yang J, Zhang S, Li Y et al., 2010. Dynamics of saline-alkali land and its ecological regionalization in western Songnen Plain, China.Chinese Geographical Science, 20(2): 159-166.ha in 1954 to 1 097.45 10 ha in 2005. While the ratio of light,moderate and serious salinized land areas changed from 6.72:2.92:1.00 to 1.25:1.06:1.00 in the study period. Grassland,cropland,swampland and water body were the major land use and land cover types from which saline-alkali land transformed. And the secondary salinization occured mainly in Da'an City,Tongyu County,Changling County,Daqing City,Dorbod Mongolian Autonomous County and Zhaoyuan County. Finally,seven large ecoregions and 14 corresponding sub-ecoregions were delineated out based on spatio-temopral dynamic characteristics of saline-alkali land and geo-relational environmental attributes. According to the results,measures of amelioration and ways of development of saline-alkali land in the western Songnen Plain were put forward.

DOI

[72]
Yu D S, Shi X Z, Wang H J et al., 2007. Regional patterns of soil organic carbon stocks in China.Journal of Environmental Management, 85(3): 680-689.Soil organic carbon (SOC) is of great importance in the global carbon cycle. Distribution patterns of SOC in various regions of China constitute a nation-wide baseline for studies on soil carbon changes. This paper presents an integrated and multi-level study on SOC stock patterns of China, and presents baseline SOC stock estimates by great administrative regions, river watersheds, soil type regions and ecosystem. The assignment is done by means of a recently completed 1: 1,000,000 scale soil database of China, which is the most detailed and reliable one in China at the present time. SOC densities of 7292 soil profiles collected across China in the middle of the 1980s were calculated and then linked to corresponding polygons in a digital soil map, resulting in a SOC Density Map of China on a 1: 1,000,000 scale, and a 1 km 1 km grid map. Corresponding maps of administrative regions, river watersheds, soil types (ST), and ecosystems in China were also prepared with an identical resolution and coordinate control points, allowing GIS analyses. Results show that soils in China cover an area of 9.281 10 6 km 2 in total, with a total SOC stock of 89.14 Pg (1 Pg=10 15 g) and a mean SOC density of 96.0 t C/ha. Confidence limits of the SOC stock and density in China are estimated as [89.23 Pg, 89.08 Pg] and [96.143 t C/ha, 95.981 t C/ha] at 95% probability, respectively. The largest total SOC stock (23.60 Pg) is found in South-west China while the highest mean SOC density (181.9 t C/ha) is found in north-east China. The total SOC stock and the mean SOC density in the Yangtze river watershed are 21.05 Pg and 120.0 t C/ha, respectively, while the corresponding figures in theYellow river watershed are 8.46 Pg and 104.3 t C/ha, respectively. The highest total SOC stocks are found in Inceptisols (34.39 Pg) with SOC density of 102.8 t C/ha. The lowest and highest mean SOC densities are found on Entisols (28.1 t C/ha), and on Histosols (994.728.1 t C/ha), repectively. Finally, the total SOC stock in shrub and forest ecosystem classes are 25.55 and 21.50 Pg, respectively; the highest mean SOC density (209.9 t C/ha) was recorded in the wetland ecosystem class and the lowest (29.0 t C/ha) in the desert ecosystem class. Among five forest ecosystem types, Evergreen conifer forest stores the highest SOC stock (6.81 Pg), and Deciduous conifer forest shows the highest SOC density (225.9 t C/ha). Figures of SOC stocks stratified by Administrative regions, river watersheds, soil types and ecosystem types presented in the study may constitute national-wide baseline for studies of SOC stock changes in various regions in the future.

DOI PMID

[73]
Zhang B, Cui H S, Yu L et al., 2003. Land reclamation process in northeast China since 1900.Chinese Geographical Science, 13(2): 119-123.

DOI

[74]
Zhang L, Wang Y H, 2014. Study on the effects of economic growth to farmland conversion in China.Open Journal of Social Sciences, 2: 25-29.

[75]
Zhuang Q L, Li Q, Jiang Y et al., 2007. Vertical distribution of soil organic carbon in agro-ecosystems of Songliao plain along a latitudinal gradient.American-Eurasian Journal of Agricultural and Environmental Science, 2(2): 127-132.

[76]
Zhou X, Zhou L, Nie Y et al., 2016. Similar responses of soil carbon storage to drought and irrigation in terrestrial ecosystems but with contrasting mechanisms: A meta-analysis.Agriculture, Ecosystems and Environment, 228: 70-81.

DOI

Outlines

/