Research Articles

Assessing the oscillation of channel geometry and meander migration cardinality of Bhagirathi River, West Bengal, India

  • Rakhohori Bag 1 ,
  • Ismail Mondal , 2, * ,
  • Jatisankar Bandyopadhyay 1
Expand
  • 1. Department of Remote Sensing & GIS, Vidyasagar University, Midnapore-721102, India
  • 2. Department of Marine Science, University of Calcutta, Kolkata-700019, India
*Corresponding author: Dr. Ismail Mondal, Post-Doctoral Fellow, E-mail:

Received date: 2017-10-27

  Accepted date: 2018-03-23

  Online published: 2019-04-12

Copyright

Journal of Geographical Sciences, All Rights Reserved

Abstract

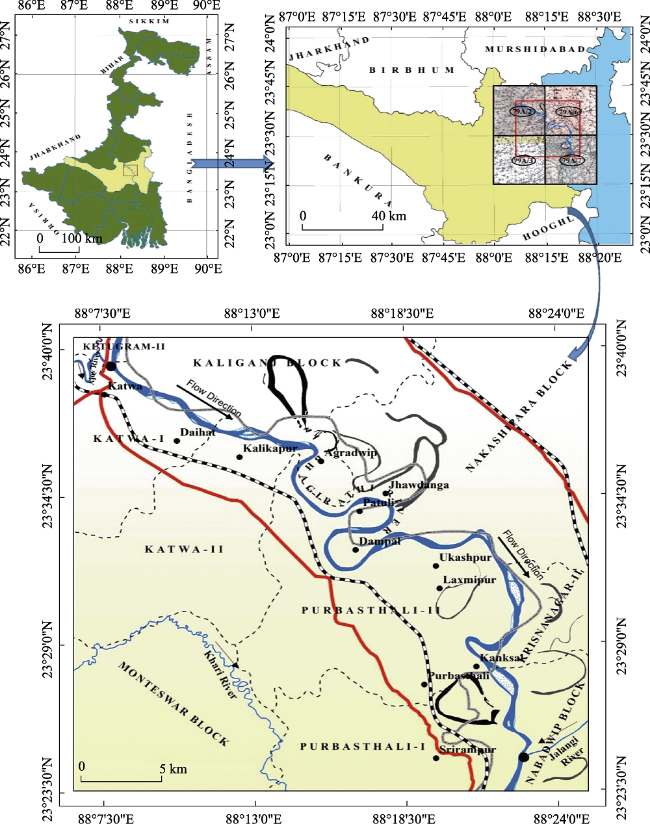
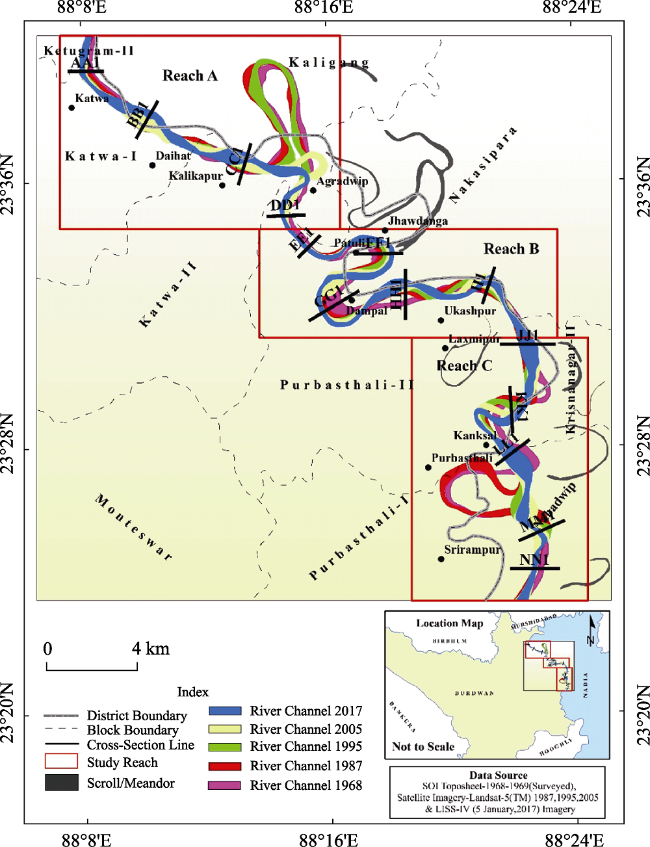
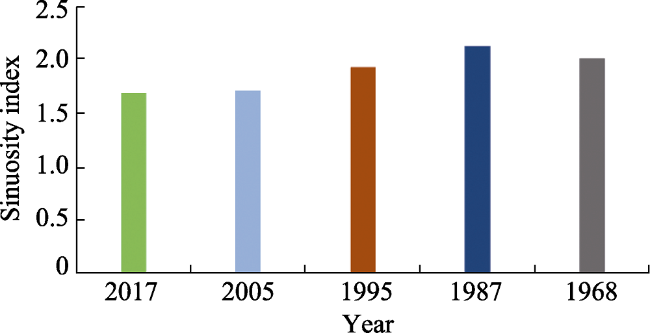
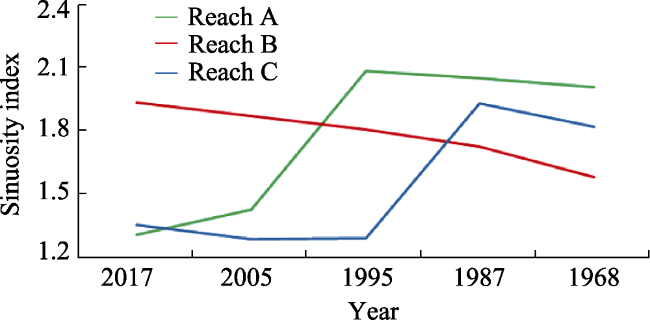
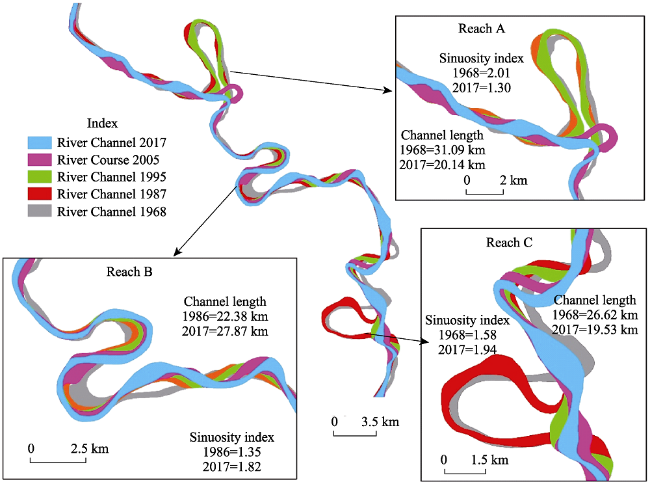
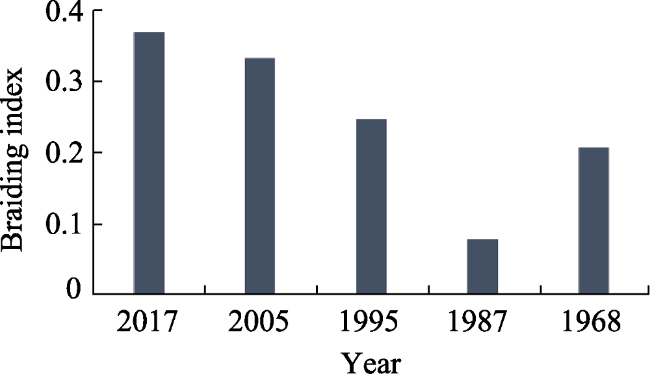
Lateral migration of the Bhagirathi River temporally creates unavoidable geomorphic hazards in West Bengal, India. The Bhagirathi River flows SW for ~67.30 km between the confluence point of Ajay and Jalangi rivers in East Burdwan and Nadia districts of West Bengal. The course of Bhagirathi is notably migration prone and cultivates problematic changes along its course over time. In the study, we have looked into its migration tendency and unpredictability for past 238 years and then predicted the lateral shifting of river centerline using temporal satellite imageries - Landsat-5 (TM) of 1987 (8, December), 1995 (28, January), 2005 (7, January) and LISS-IV satellite imagery (2017, 5 January);SOI Toposheet - 1968-1969 (79A/2, 79A/3, 79A/6 and 79A/7) and Rennell’s map of 1779. Other highlights are the quest of fluvial features, oxbow lakes, mid-channel bars, channel migration rate, meander geometry, channel sinuosity in different parts of river course and the parts that experience intensive bank erosion. The entire river course has been subdivided into three segments; viz. reaches A, B and C. Investigation displays that degree of sinuosity decreases from its anterior course (1968) to the existing course (2017). Reach-specific outputs display that reach B is highly sinuous (SI value 1.94 in 2017) and SI increases temporarily, whereas for reaches A and C it decreases with time. The rate of migration is higher in reach B than that in reaches C and A. The study displays a notably decreasing trend of migration in comparison with its previous lateral migration and shows that the migration nature over time is intensively inconsistent and unpredictable except very few portions of the river course. The nature of deposition within the river channel shows an unstable behavior during the entire period of the study. Meander geometry depicts a rapid change of river course innate to meander bends and shows a higher rate of migration by meander loop cut-off rather than lateral migration that reflects the inconsistency, erosion vulnerability and unpredictable nature of migration. The present work offers a valuable source to comprehend channel changes in Bhagirathi River and serve as an efficacious base for river-bank migration and erosion hazard planning and management.

Cite this article

Rakhohori Bag , Ismail Mondal , Jatisankar Bandyopadhyay . Assessing the oscillation of channel geometry and meander migration cardinality of Bhagirathi River, West Bengal, India[J]. Journal of Geographical Sciences, 2019 , 29(4) : 613 -634 . DOI: 10.1007/s11442-019-1618-z

1 Introduction

The Bhagirathi-Hooghly River is the western most major distributary in the Ganga delta. In the east, other distributaries are Bhairab, Sialmari, Jalangi, Mathabhanga-Churni-Ichamati rivers (commonly known as ‘‘Nadia Group of Rivers’’) up to the Bangladesh border. In general, the Bhagirathi-Hooghly River is considered as the western limit of the Ganga delta (Mondal et al., 2016). “River and river processes are considered as the most significant geomorphic systems which are active on the earth’s surface. They have shaped much of the royal scenery. The earth’s surface is a dynamic surface and the forces of gravity, heat, orogeny, and isostasy is continuously modifying earth materials and forms. These changes impact the action of water flowing over the surface” (Morisawa et al., 1985). Meandering is a natural process in a floodplain and alluvial river system which causes gradual shifting of the river’s course by depositing sediment in a convex bank and at the same time eroding the concave bank of a meander. Most of the rivers on the Earth are subject to meandering due to naturals and human activities and shift their course across the valley bottom (Ayman et al. 2009). Floodplain and braided river system are frequently affected by bank erosion and channel migration hazards and these are caused by numerous agents, visa-a-viz., flow characteristics, bank material composition, climate, vegetation, geology and anthropogenic agencies (Knighton, 1998; Panda and Bandyopadyay, 2011). In agreement with this traditional view, some river scientists have paid more importance to some factors than the others. Among them, Lacey et al. (1939, 1958), and Luna and Thomas (1953) discovered that the bank-full discharge was more vulnerable to calculate the stable channel geometry and river width, depth and flow velocity vary with mean annual discharge. Recently, Rudra et al. (1981, 2008, 2011, 2014), Bandyopadhyay et al. (1996) and Basu et al. (2005) have depicted channel dynamics and meander geometry.
The present study investigates the relationship between channel geometry, lateral migration of the river course and bank erosion hazards for Bhagirathi River up to the non-tidal part from the confluence of Ajay River. Human activities along the river course including urbanization, settlement, agriculture, industries exert excessive stress on river stability and its dynamic processes. Continuous and haphazardly meandering lead to channel migration and bank erosion problem and causes significant loss of crops, land property, livestock and human lives. This work has been carried out methodically by RS and GIS techniques and will provide a blue print in the sustainable management of bank erosion and river migration hazards. The major objectives of this study are to investigate the trend of river course migration and its unpredictability over time and find out major changes of Bhagirathi River in terms of bank line positions, channel geometry and its pattern since historical past to present.

2 Study area

The Bhagirathi River take-off on the right bank of the Ganga in the district of Murshidabad and after traversing a distance of 564 km falls into the Bay of Bengal. The non-tidal part of the Bhagirathi up to Nabadwip is known as Bhagirathi, whereas the tidal part from Nabadwip to the Bay is called the Hooghly (Garrett, 1910; Willcocks, 1930; Chatterjee, 2014). The channel of Bhagirathi River within the study region is excessively dynamic and characterized by irregular meandering and lateral migration. Consequently, the adjacent area is susceptible to continuous erosion and channel migration hazards, which may cause substantial losses of crops, land property, livestock and human lives. The right bank tributary of Bhagirathi is Ajay; which falls into the Bhagirathi near the Katwa town. This tributary causes huge sedimentation in the Bhagirathi-Hooghly River and creates the biggest navigation problem in the Kolkata port (Bose, 1972). The left bank tributary Jalangi joins the Bhagirathi opposite of Nabadwip town.
The study area lies in east-central West Bengal in East Burdwan and Nadia districts between 23°23'22.55"N to 23°40'30.92"N latitude and 88°6'34.03"E to 88°25'20.33"E longitude and comprises an area of ~1000.44 km2 (Figure 1). It is a part of Bengal basin (Mukherjee,1938; Mukherjee, 2012), deliberated under the fluvial landscape dominated by the active and older floodplain prepared by Bhagirathi and Jalangi rivers (Bagchi et al., 1944, 1972). Gentle slope, very low elevation (<5 m to 35 m), migrating river channel, oxbow lakes, natural leaves, meander scrolls, floodplain formation etc. are common features. The area is characterized by the tropical monsoon climate (Am type). Average annual rainfall is approximately 120 mm and 80% of this concentrated during the summer monsoon (June to August month). Arsenic pollution has been reported at a few places in this region (Mukherjee, 2005). The soil of this area is of new alluvial origin, brought down by the Ganga and its distributaries like Bhagirathi, Jalangi and western tributaries of Bhagirathi like Khari, Ajay. The soil type of the Bhagirathi river embankment is sandy-clay where cohesive clay layer overlies non-cohesive sandy layer, which enhances the bank erosion hazards.
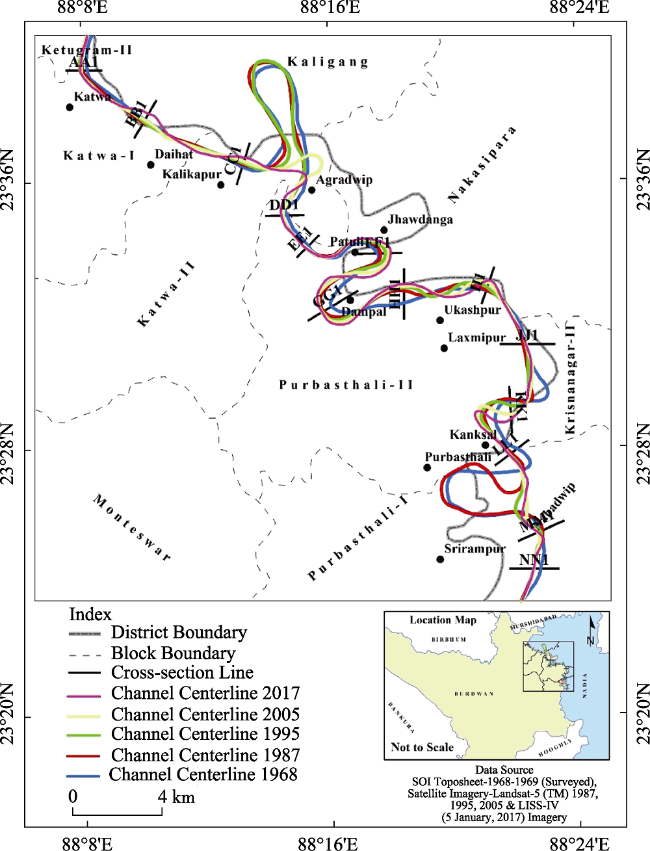
Figure 1 Location map of the study area

3 Materials and methods

The time period for this study is 238 years, which has been separated into two, qualitative (1779 to 1968) and quantitative (1968 to 2017). All quantitative measurements have been done from 1968 to 2017. The topographical map from the Survey of India (SOI) has been considered as the base map. The river course has been identified from the orthorectified satellite imagery of Landsat-5 (TM) of 1987 (8, December), 1995 (28, January), 2005 (7, January) and LISS-IV satellite imagery (2017, 5 January) along with SOI Toposheet of 1968-1969 (79A/2, 79A/3, 79A/6 and 79A/7) and Rennell’s map (1779) and digitized using ArcGIS 10.3 software and subsequently saved as a Geodatabase files (Table 1).
Table 1 Data used for the study and analysis
Data types Description of data Date of data (dd/mm/yy) Spatial resolution/scale Source
Remote sensing images Landsat-5 (TM) imagery 08.12.1987 30 m USGS global visualization viewer
Landsat-5 (TM) imagery 28.01.1995 30 m USGS global visualization viewer
Ladsat-5 (TM) imagery 07.01.2005 30 m USGS global visualization viewer
LISS-IV imagery 05.01.2017 5.8 m www.nrsc.gov.in
Collateral data Topographical maps (79A/2, 6, 3, 7) 1968-1969
(Surveyed)
1:50,000 Survey of India (SOI)
Rennells map 1779 1:250,000 Rennell (1788),
collected from National Library, Kolkata
The UTM projection with zone 45 North and WGS-84 datum is used for all the spatial datasets. Resampling and geometric correction has been done for all spatial datasets using ERDAS IMAGINE 2014 software to bring them to the same scale. Channel centerlines were obtained from the temporal vector layer of river courses. Fourteen cross-sections have been created across different sections of the river course for measuring river width, lateral movement of bank line and channel centerline. The length of lateral migration of river course at each cross-section has been measured and migration rates for different points were calculated. For the prediction of channel centerline, the linear regression method was used. Deb and Ferrieria (2014), and Das (2016) had extremely used this method for the prediction of bank line position. The LR model shows that among the 14 cross-sections, only five cross-sections strongly trail a linear migrating trend, which has been selected by the test of significance of r-values. Then the cross-sections wise river centerline position was measured for 2030. Lastly, for validating of predicted values of 2030, the known values of 2017 and predicted values of 2017 have been compared and standardized.

4 Results and discussion

4.1 Channel geometry

4.1.1 Channel width
The width of a channel at any point represents the cross-sectional distance of a channel and is the key indicator for showing the stage and evolution characteristics of channel. The absolute channel width of Bhagirathi River has been measured based on fourteen fixed cross-sections at different locations of the channel (Figure 2). The study period since 1968 to 2017 shows that the width of the channel gradually decreases. During the assessment period of 1968-1987, maximum channel widening was recorded at cross-sections AA1, BB1, HH1, JJ1 and MM1 (333.39-825.79 m) and maximum channel narrowing was recorded at cross-sections FF1, GG1 (1155.38-507.3 m) and KK1. The period 1987-1995 was documented for overall channel narrowing trend except BB1, DD1, JJ1 (589.10-742.84 m), MM1 and LL1 cross-sections. The assessment period during 1995-2005 noted channel widening trends and at cross-sections NN1, FF1, KK1 showed significant channel narrowing. Subsequently, the final assessment period (2005-2017) listed channel narrowing trend. Extreme channel narrowing trend was recorded at cross-sections BB1, CC1, DD1, MM1 and channel widening was recorded at cross-sections JJ1 and LL1. On the whole, the entire period of study (1968-2017) actually shows channel narrowing trend. Maximum channel narrowing is noted at cross-sections GG1 (1155.38-272.07 m), FF1 (1063.62- 278.34 m) while widening was observed at cross-sections JJ1 (336.53-995.52 m), II1, HH1 and BB1. Figure 3 shows that channel width is changing at a higher rate; which may result in maximum sedimentation, higher discharge and intensive bank erosion.
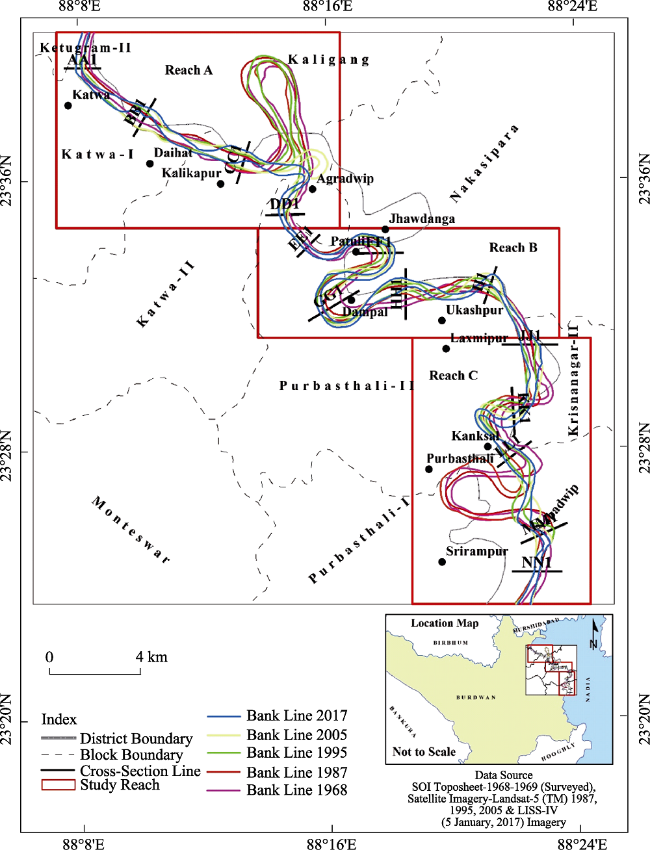
Figure 2 Showing the temporal river course with location of cross-sections and study reaches
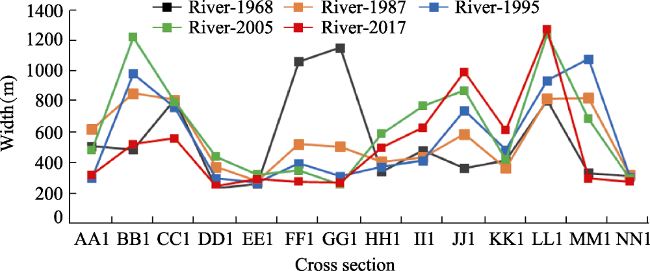
Figure 3 Temporal changes of river width at various cross-sections
4.1.2 Channel length
Temporal channel length of Bhagirathi River between the meeting point of Ajay and Jalangi Rivers has been measured along the midway between the left and right bank of the channel polygon. During the entire period of the study, the maximum channel length was recorded in 1987 (84.58 km) and minimum recorded in 2017 (67.30 km). From 1987 to 1995 channel length was reduced by 8.06 km due to neck cutoff which occurred in Reach C. Figure 4 points out that the overall length of the river course reduced by 17.18 km from 1987 to 2005 and by 12.28 km from 1987 to 2017. Also, the channel length decreased by 9.12 km during 1995-2005 due to the initiation of neck cutoff along Reach A, near Agradwip. Throughout 1968 to 1987, channel length increased by 4.85 km, which highlights that the length of Bhagirathi is changing at a higher rate by the meander loop cutoff rather than lateral migration of the river course.
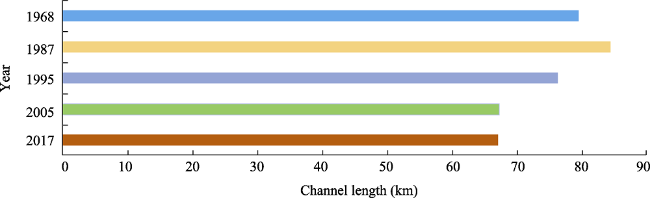
Figure 4 Temporal change of the river length from 1968 to 2017
4.1.3 Meander geometry
Within the study area, Bhagirathi River strongly preserves a meandering course. Historical analysis of meander geometry has shown that meandering tendency of the Bhagirathi River is very complex as it varies spatially. A two-folded curve near Patuli and Dampal (Figure 5) and a three-folded curve near Purbasthali have been selected for assessment of the meander geometry. Cautious measurement of older datasets near Purbasthali reveals an older meandering course of Bhagirathi than the present-day. This bend listed decreasing trend in its radius of curvature, meander amplitude and meander belt width from 1987 to 2017, due to neck cutoff around the Purbasthali bend (Figure 6) although the entire study period shows an increasing trend of meandering near the Patuli and Dampa bends (Figure 7).
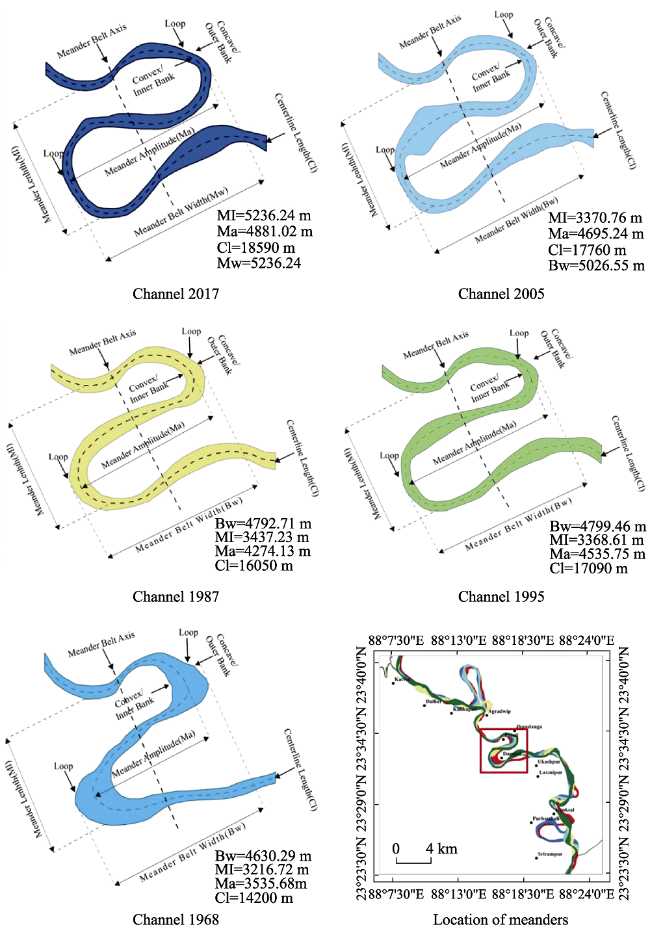
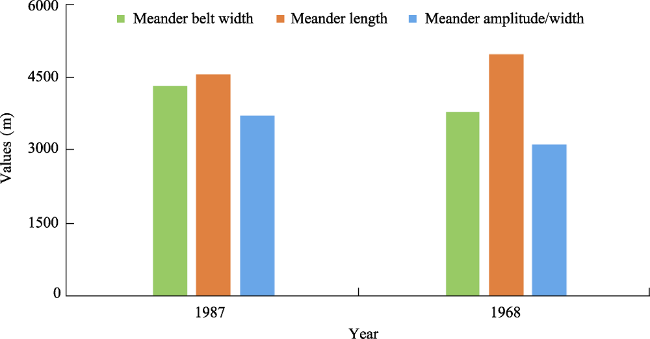
Figure 5 Temporal measurement of meander geometry near the Patuli and Dampal bends
Figure 6 The temporal changes of meander geometry near the Purbasthali bend
Figure 7 The temporal changes of meander geometry near the Patuli and Dampal bends
(1) Radius of curvature (Rc)
Radius of curvature (Rc) is a measure of the ‘tightness’ of a single meander bend and is inversely correlated with sinuosity. The Rc is measured by the radius of a circle that fits the meander arc from the outside of the bank-full channel to the crossing point of two lines that perpendicularly bisect the tangent lines of each meander departure point (Figures 8 and 9). The Rc near Patuli bend was 915 m in 2017 and was 597 m in 1968 (Figure 10 and Table 2) increasing by 318 m from 1968 to 2017, while near Dampal bend maximum Rc listed in 2017 was 1270 m and it increased by 650 m (Figure 11 and Table 3) from 1968 (620 m) to 2017 (1270 m). Near Purbasthali bend, the Rc increased from 1035 m to 1295 m during the period of 1968-1987 (Figure 12).
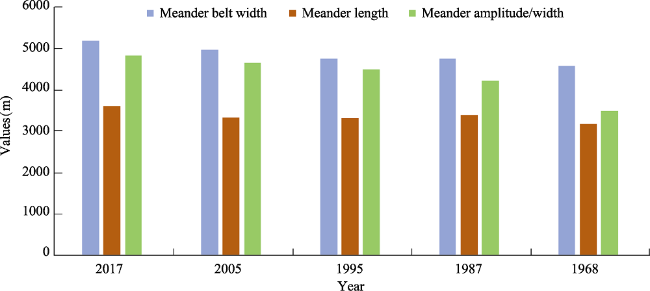
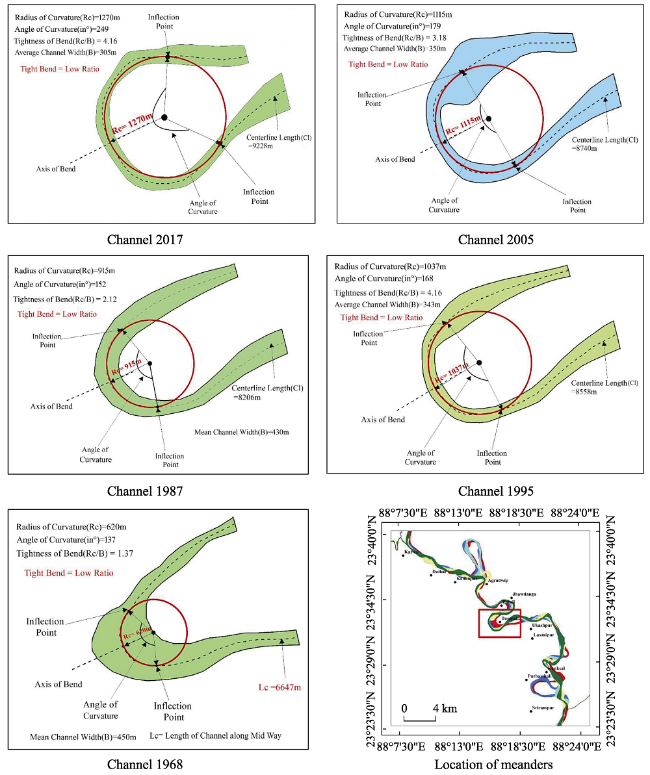
Figure 8 Temporal measurement of radius of curvature near the Patuli bend
Figure 9 Temporal measurement of radius of curvature near the Dampal bends
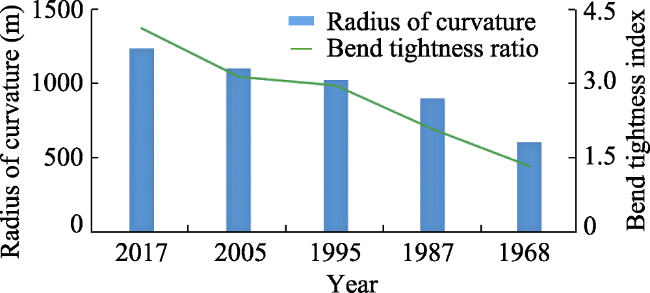
Figure 10 The temporal changes of radius of curvature and bend tightness ratio near the Patuli bend
Table 2 Radius of curvature near the Patuli bend
Year Radius of
curvature (m)
Angle of
curvature (°)
Mean channel width (m) Tightness
index
2017 1250 249 305 4.16
2005 1115 179 350 3.18
1995 1037 168 343 3
1987 915 152 430 2.12
1968 620 137 450 1.37
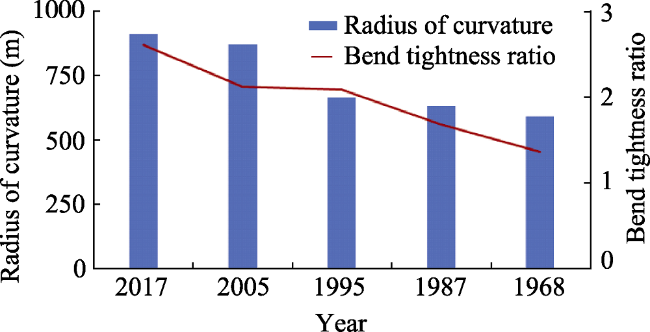
Table 3 Radius of curvature near the Dampal bend
Year Radius of
curvature (m)
Angle of
curvature (°)
Mean channel
width (m)
Tightness
index
2017 915 163° 346.7 2.62
2005 875 147 304 2.14
1995 669 173 312 2.1
1987 637 158 372 1.7
1968 597 137 432 1.38
Figure 11 The temporal changes of radius of curvature and bend tightness ratio near the Dampal bend
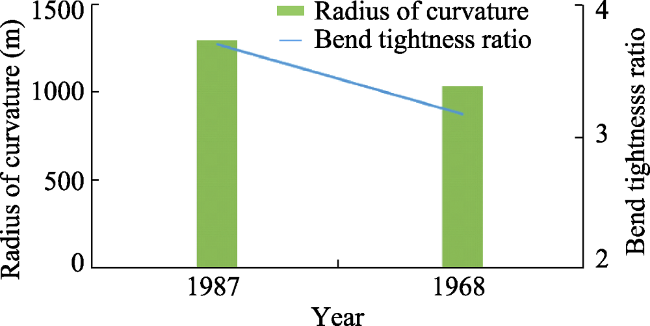
Figure 12 The temporal changes of radius of curvature and bend tightness ratio near the Purbasthali bend
(2) Bend Tightness Index (BTI)
The Bend Tightness Index (BTI) is a ratio between the radius of curvature and mean channel width near a bend. BTI value indicates the tightness and looseness of the bend. Higher BTI values indicate the loose bends and lower values specify the tight bends. BTI values near the Patuli bend was 1.38 in 1968 and 2.64 in 2017 (Figure 10 and Table 2), whereas, near the Dampal bend, it was 1.37 in 1968 and 4.16 in 2017 (Figure 11 and Table 3). During the period of 1968-1987, BTI values near the Purbasthali bend increased from 3.17 to 3.7 (Figure 12). Study shows that the migration rate and tightness index are positively correlated. Higher tightness values associated with higher rates of bend migration.

4.2 Channel pattern

4.2.1 Sinuosity index (SI)
There are several methods to compute SI of a river channel (Schumm, 1963; Leopold et al., 1964; Brice 1964; Leopold and Langbein, 1966; Mueller, 1968). For the present analysis, the method of Muller’s (1968) has been adopted as it can compute SI of the individual meander loops easily. Computation of SI by this method is done by the following formula
SI = Channel Length/Air Length
The meandering nature of Bhagirathi can be quantified by the temporal variation of its SI magnitude. SI ranges from 1.70 to 2.14 during the period of 1968-2017. The sinuosity value was notably higher in 1987 (2.14) and 1968 (2.02), while the lowest sinuosity value was recorded in 2017 (1.7). The general trend of sinuosity values shows that sinuosity of Bhagirathi River decreases through the entire assessment period of the study (Figure 13). These give a picture that the straight pattern of Bhagirathi River has increased gradually. In the study area, there are abundant oxbow lakes and paleo-channels that unfold migration nature of Bhagirathi River, which was previously part of the present river course. The overall sinuosity values of Bhagirathi River since past to present shows a decreasing trend, but reach wise sinuosity values expressed a complex trend. Reaches A and C follow a reducing trend of SI, however for the reach B it follows an increasing trend from 1968 to 2017. In 2017, the SI value for reach B was 1.94 while it was 1.58 in 1968. Whereas the SI value for reach A was 2.01 in 1968 and 1.30 in 2017. For reach C, it was 1.82 in 1968 and 1.35. Figures 14 and 15 display reach wise increasing and decreasing trend of sinuosity values during the whole period of the study.
Figure 13 Temporal change of sinuosity index values of Bhagirathi River
Figure 14 Reach wise temporal change of sinuosity index values from 1968 to 2017
Figure 15 The reach wise change of channel length and sinuosity index values from 1968 to 2017
4.2.2 Braiding index (BI)
BI of Bhagirathi River within the study section has been estimated using the Brice (1964) formula to recognize the nature of sediment deposition and its consistency in the riverbed. According to Brice (1964),
BI = 2 (Sum of the length of islands or bars) /Length of the river
Figure 16 displays the sediment deposition pattern of the Bhagirathi through BI values from 1968 to 2017. BI ranges from 0.08 to 0.37. The maximum BI value has been registered in 2017(0.37) while the minimum BI value computed in 1987 (0.08). The general trend of BI values shows that the sediment load and deposition nature of Bhagirathi River have increased gradually from 1987 to 2017. Remarkably, the BI values vary reach to reach (Figure 17). Reach C recorded highest BI value (0.53) in 2017 and recorded the lowest 0.06 in 1987. Reach C follows an increasing trend of BI values from 1987 to 2017, while reach A shows a complex trend of braiding in the different years, which indicate that sediment deposition and bar formation tendencies of Bhagirathi River are highly unstable in reach A. Reach B demonstrated a more stable nature of braiding.
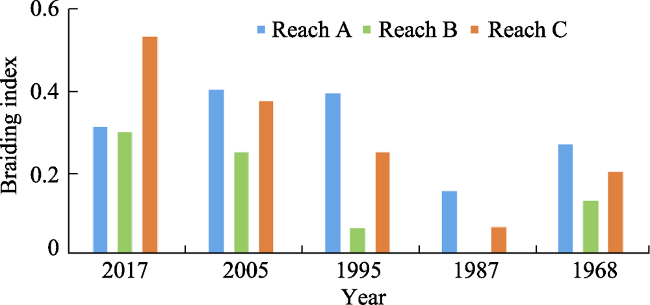
Figure 16 Temporal change of braiding index of Bhagirathi River
Figure 17 Reach wise temporal change of braiding index

4.3 History of temporal change of river morphometry

4.3.1 River course (18th century, 1779) in the time of Rennell’s survey
The river course has been identified and analysed from Rennell’s map (Figure 18). Rennell’s map (Rennell J J, 1781; Rudra K, 2010) shows that Bhagirathi River used to flow towards SE with a highly sinuous course (SI value 1.75). The length of the river channel along the midway between the left and right bank was 69.57 km and SI value was 1.75. Rennell’s map presented that near Agradwip, Patuli, Dampal and Purbasthali, the river course has been highly sinuous from historical time to present. These parts are very complex and dynamic in terms of meander geometry and lateral migration of bend. From Katwa to the Bagnalpur and Baladanga, river course was comparatively less sinuous (SI value 1.17) than another parts (SI value 2.14 between Bagnalpur and Patuli). This part of the river has pursued a straight to low sinuous incline still now.
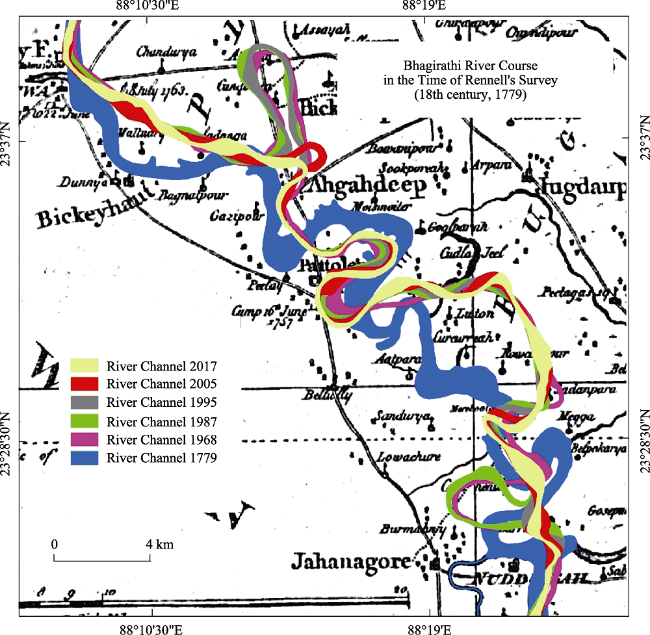
Figure 18 Historical river course of Bhagirathi River since 1779 to 2017
Data source: Rennell’s map obtained from the book ‘Rivers of Bengal’ collected from the National Library, Kolkata. River course 1968, 1987, 1995, 2005 and 2017, identified from SOI Toposheet (1968-1969), Landsat-5 (TM) satellite imagery of 1987,1995, 2005 and LISS-IV satellite imagery of 2017.
4.3.2 Present situation (1968-2017)
1968 river course
The river course has been digitized from the SOI Toposheet of 1968-1969. During this period, the river course has been highly meandering (SI value 2.02). The length of the river was 79.72 km. The SI and BI values for the entire river course was 2.02 and 0.21, respectively indicating a meandering river course with less sedimentation. The average width of the river was 542.37 m.
1987 river course
The river course has been obtained from Landsat-5 (TM) satellite image of 8 December 1987. In this year, the bends of river course have increased and the bent zone persisted for more distance (84.58 km) and the length has increased by 4.79 km from 1968 to 1987. The SI became maximum at 2.14. The BI value was 0.08 indicating that BI value has decreased from 1968 to 1987. It also indicates that the sediment load was low and lateral erosion might be high. The average width of the river was 553.45 m.
1995 river course
The river course has been digitized from orthorectified Lansat-5 (TM) satellite image of 28 January 1995. In this year, the length of rivers was noted to be 76.51 km and during 1987 to 1995, the length has decreased by 8.07 km. The SI value for this year was 1.94. The BI value was 0.25. During the period of 1987 to 1995, a cut-off meander occurred near the Purbasthali river course, which reduced the length of the river during this period. The average width of the river was 548.71 m.
2005 river course
The river channel was identified and analyzed from Landsat-5 (TM) satellite imagery of 7 January 2005. The length of the river was 67.40 km and the length has reduced by 9.11 km during the period of 1995 to 2005, due to neck cutoff that occured near the Agradwip bend. Similarly, SI value (1.72) has decreased in this year compared to 1995 whereas; the BI value (0.34) has increased during 1995 to 2005. The average width of river course was 627.19 m.
2017 river course
The present river channel has been obtained from the LISS-IV satellite imagery of 5 January 2017. The length of river is 67.30 km and SI value listed 1.69. Both length and SI values have decreased from 2005 to 2017. The BI in this year recorded 0.37, indicating an increasing trend from 2005 to 2017 (5 January). Only due to a small neck cutoff in the upper segment of river course near the Agradwip, the river length has decreased by 95.42 m during 2005-2017. At present, Bhagirathi River represents a less sinuous course with maximum sediment load. The average width of river course is 501.99 m.

4.4 Quantitative measurement of lateral dynamics

4.4.1 Bank line migration from 1968 to 2017
The present study exposed the actual shifting of left and right bank during the 49-year time span (Figure 19). During all the assessment periods, the maximum shifting was recorded by the left bank (Figure 20). It was 1112.78 m at cross-section KK1 towards the SW and the right bank shifted 82.14 m towards SW at cross-section MM1. Higher left bank shifting was registered at cross-sections HH1 (1048.4 m, NE), GG1 (1093.59 m, SW), LL1 (560.42 m, W) and right bank shifting found at cross-sections LL1 (1021.84 m, W), KK1 (910.54 m, SW), HH1 (988.23 m, NE), FF1 (1031.93 m, E) and CC1 (595.6 m, NE). The mean shifting rate of the left bank towards the left side and right side are 10.63 m/year and 10.71 m/year, respectively and for the right bank these are 14.28 m/year and 8.18 m/year.
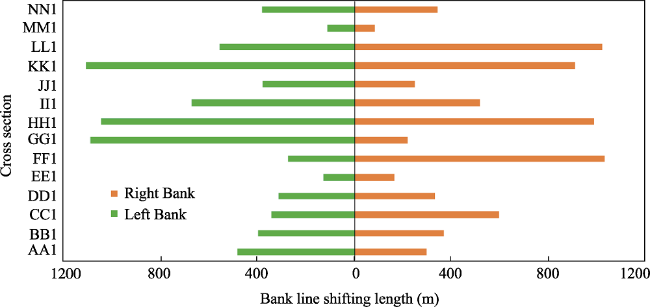
Figure 19 Measurement of bank line shifting at different section lines from 1968 to 2017
Figure 20 Actual shifting of left and right bank during 1968-2017
4.4.2 Channel centerline migration from 1968 to 2017
Centerline is the mid-line between the left and right bank, obtained from the temporal river courses. Overall centerline migration length during 1968 to 2017 and cross-sections wise migration rate have been assessed. Chronologically superimposing of channel centerline depicts an uncertain picture of the migration pattern of Bhagirathi River (Figure 21). During the period of 1968 to 2017, the centerline shifted ~4.49 km towards E in the lower river course due to neck cutoff occurring near the Purbasthali. Whereas the period of 1995-2005, channel centerline shifted ~5.8 km towards S in the upper river course due to another cutoff occurring near the Agradwip. While centerline followed a moderate shifting rate in the middle river reach.
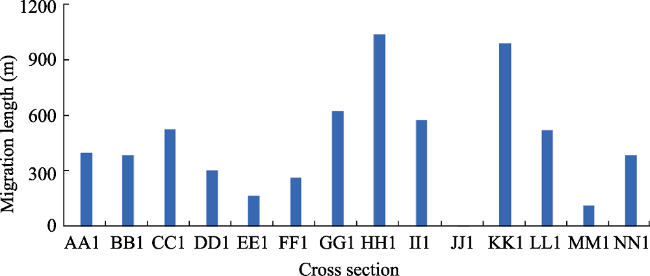
Figure 21 Measurement of channel center line shifting at different section lines from 1968 to 2017
Figure 22 shows the cross-section wise migration of centerline during the period of 1968 to 2017. The maximum shifting of centerline was 1047.77 m towards NW and the minimum was 9.69 m towards W at cross-sections HH1 and JJ1, respectively. Whereas,cross-sections KK1 (1001.46 m, SW), LL1 (859.05 m, W), II1 (583.59 m, NE), GG1 (631.19 m, SW) and CC1 (533.5 m, NE) listed comparatively higher amount of centerline migration length during the entire time span of the study.
Figure 22 Actual shifting of river centerline during 1968 to 2017
Figure 23 represents cross-sections wise centerline migration rate for the entire evaluation period of the study. At the cross-section HH1 near Uday Chandrapur the maximum (21.38 m/year) centerline migration rate was observed and near Rukunpur at cross-section JJ1 the minimum (0.20 m/year) shifting rate was seen. Relatively higher rate of centerline migration was recorded at cross-sections KK1 (20.44 m/year, near Gopipur), LL1 (17.53 m/year, near Kashthali Char), GG1 (12.88 m/year, near Dam Pal), II1 (11.91 m/year, near Chandanpur), CC1 (10.89 m/year, near Balidanga Char) and lower rate of migration was observed at cross-sections MM1 (2.51 m/year, near Mayapur), EE1 (3.53 m/year, near Simuldanda), FF1 (5.56 m/year, near Patuli) and DD1 (6.35 m/year, near Gazipur).
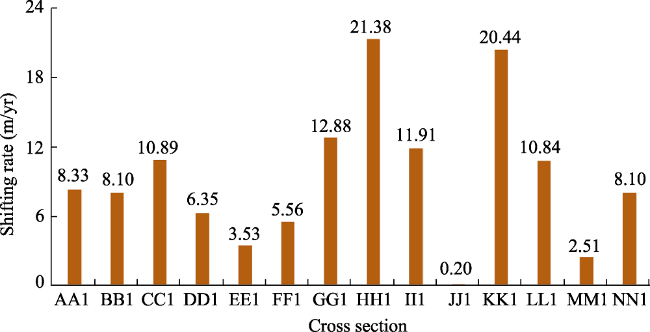
Figure 23 The cross-section wise centerline shifting rate (m/year) during the entire time period of study (1968-2017)

4.5 Channel centerline prediction using linear regression (LR) model

Migration pattern of the Bhagirathi River constantly did not retain a linear tendency. All through the assessment period of 49 years, it was observed that, cross-sections DD1, EE1, FF1 are very uneven as they change abruptly to the left and right direction and does not follow a linear migration trend. Centerline of the river is migrating linearly at the cross-sections BB1, CC1, HH1, II1, and KK1. At cross-sections AA1, GG1, JJ1, LL1, MM1, and NN1, river centerline has maintained a linear trend with moderate regression values. First cross-sections wise shifting length and direction were extracted from the base year 1968 to 1987, 1995, 2005 and 2017. Then, using the LR method, cross-sections wise regression values (r2) were calculated for assessing the accuracy of the trend line and finally predicted values for 2017 and 2030 were generated (Figure 24 and Table 4). All through the evaluation, it could be observed that the actual values and the projected values of 2017 are exactly similar, which point out that the LR model is highly acceptable for projecting the centerline of the Bhagirathi River. Figure 25 shows a predicted centerline and it demonstrates the future Potentiality of Cutoff along the Bhagirathi River course near the Patuli, Dampal, and Kanksal bends.
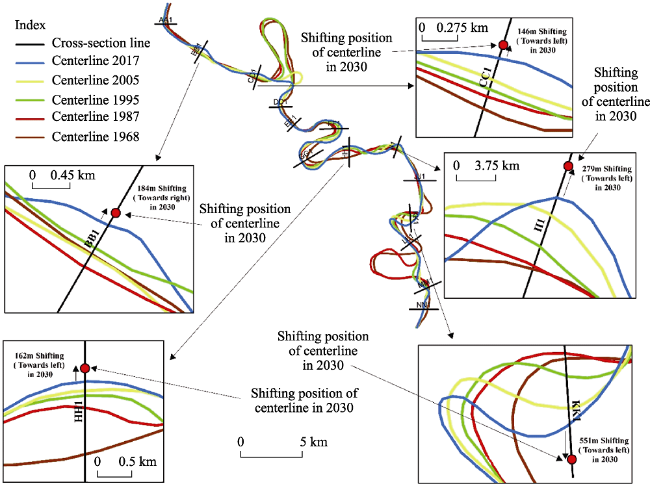
Figure 24 The future position of channel centerline of Bhagirathi in 2030 at selected cross-sections. The maximum shifting of centerline was recorded in 2030, at cross-section KK1 near the Gopipur (551 m, towards left side), while the minimum at cross-section CC1 near the Balidanga Char (146 m, towards left side). Whereas at cross-sections HH1 near the Uday Chandrapur (146 m, towards left side), BB1 near the Rajnagar (184 m, towards right side), II1 near the Jaganathpur and Chandanpur (279 m, towards left side) a moderate shifting trend of channel centerline was recorded.
Table 4 Cross-sections wise channel centerline shifting prediction using linear regression method, (-) value indicates the shifting to the left side and (+) value indicates the shifting to the right side. Table values represents in m.
Cross-section 1968-1987 1968-1995 1968-2005 1968-2017 Predicted values (1968-2017) 1968-2030
Shift (m) R2
BB1 172.55 112.56 15.43 -396.82 -360.8 -563.7 0.88
CC1 -126.4 -199.19 -299.57 -533.5 -522.58 -679.19 0.96
HH1 -666.78 -833.46 -901.79 -1047.77 -1054.07 -1209.75 0.96
II1 -25.48 -166.68 -435.08 -583.59 -601.38 -862.15 0.97
KK1 87.67 -270.6 -744.28 -1001.46 -1020.77 -1552.64 0.97
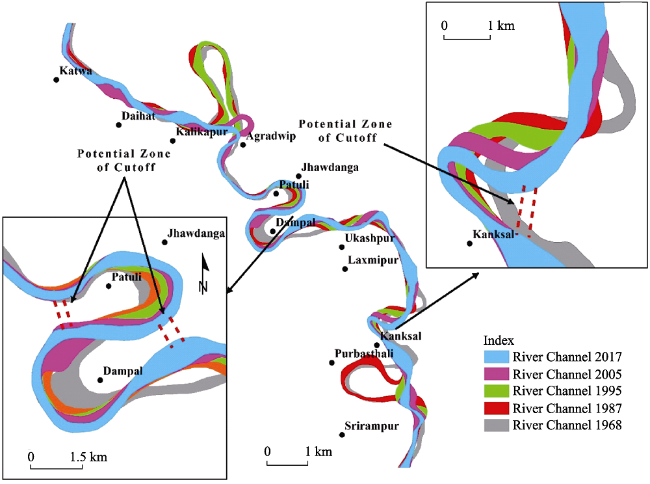
Figure 25 The meander loops of Bhagirathi River near Patuli, Dampal and Kanksal showing the potentiality of cutoff by broken red line

5 Discussion and conclusions

This study has been attempted to analyze the lateral migration and changes of the Bhagirathi river course in details for the last 238 years using the remote sensing and GIS techniques. The previous work in this area (Pal, et al. 2016; Islam and Guchhait 2015) had underlined the problem of riverbank migration and its socioeconomic effects on the neighboring community. However, in this study the focus has been devoted to investigating major morphometric changes of river course during the period of study. Similarly, we focused on retaining the accuracy of the study. This work is based on dry seasons images (December to January), which eliminate the river regime effects on quantitative measurement. However, due to lack of high-resolution satellite imagery up to the assessment period 2005, there may be small error in quantitative outputs and riverbank position. Yet, we used high-resolution LISS-IV satellite imagery for precise measurement of bank line position and channel geometry in case of final evaluation (2017). Apart from this limitation, the study follows a precise and accepted methodology, specifically for the measurement of major changes of river geometry.
In the study area, the Bhagirathi River is too dynamic and causes severe bank erosion. The river course near Patuli, Purbasthali, and Agradwip is notorious for severe bank erosion and avulsion hazards. A number of the previous studies in this area, particularly by Mukherjee (2010); Islam and Guchhait (2017) show that the fluctuation of the river discharge (through the feeder canal) due to the construction of Farakka Barrage and composition of bank materials (cohesive clay layer overlies non-cohesive sandy layer) may cause bank erosion mostly during the monsoon period. Frequently wetting and drying can contribute to cracking which reduces the shear stress of bank materials and increases its vulnerability. During the time of bank-full discharge, a huge amount of water enters into the side of bank and the return water creates pressure on the bank in post-monsoon period causing bank erosion (Mukherjee 2010). One cause that is more contemporary for bank erosion is the collection of alluvial soil from and near the river bank to provide for brick kilns.
The study shows that the Bhagirathi River shifted to both bank side and follows a linear trend of migration and also displays an irregular migration pattern. The braiding nature of the Bhagirathi is highly unstable and inconsistent. Meander geometry represents a rapid change of river course close to the meander bends and shows a higher rate of migration by meander loop cutoff rather than lateral migration. The degree of sinuosity follows a declining trend over time, whereas BI has gradually increased with time. Finally, remote sensing and GIS technology shows huge potentiality and capabilities for measurement of channel migration, erosion zone mapping and related various valuations.

Acknowledgements

The authors would like to thank Dr. Parthasarathi Chakrabarti (Former Chief Scientist of Department of Science and Technology), Mr. Sikhhendra Kisor De (Visiting Faculty, Vidyasagar University, Midnapore, and Retired Director of Geophysics - Geological Survey of India) and Dr. Soumyajit Mukherjee (Associate Professor, Department of Earth Science, IIT Bombay) for their co-operation, constructive comments, useful correction and inspection.

The authors have declared that no competing interests exist.

[1]
Ayman A Ahmed, Ahmed Fawzi, 2009. Meandering and bank erosion of the River Nile and its environmental impact on the area between Sohag and El-Minia, Egypt.Arab. J. Geosci., 4: 1-11. doi: 10.1007/s12517-009- 0048-y.The present work deals with meandering and bank erosion of the River Nile of Egypt and its environmental impact between Sohag and El-Minia, Egypt. The study depends on using Landsat imagery acquired on 1987 2000 and field observations. Field observations, remote sensing, and GIS analysis and sinuosity index were used in this study to investigate river meandering and the associated processes of erosion of river bank and islands, deposition of sediments and formation of new islands. The analysis of Landsat imagery revealed the migration of river course with time and space. Some islands disappear completely in the study area whereas new islands appear in other places. The lateral erosion on the river banks led to a decrease in agricultural lands bordering the river banks and decrease in the areas of the river islands which in turn reduces the agricultural production. Depositional processes create new floodplains on the convex sides of the river course and new islands and sand bars. Protection methods are recommended to protect the river bank from further movement and erosion. The present conditions of river meandering and the associated processes of erosion and deposition accelerated with human activities have its impact on the environment. The most prominent hazard problem is reduction of agricultural lands and loss of property as well as navigation problems. River control is recommended to weaken the secondary currents created by the river bends. It is recommended to regularly monitor the river banks and islands and measure the rates of erosion and deposition. Sand bars and subsurface islands should be monitored and identified with flash lights to mitigate navigation problems.

DOI

[2]
Bagchi K G, 1944. The Ganges Delta. Calcutta: Calcutta University.

[3]
Bagchi K G, Munsi S K, Bhattacharyya R, 1972. The Bhagirathi-Hooghly Basin. In: Proceedings of the Interdisciplinary Symposium. Calcutta: Sri Sibendranath Kanjilal.

[4]
Bandyopadhyay S, 1996. Location of Adi Ganga Paleo Channel, S.24 Parganas.West Bengal. Geogr. Rev. India, 58(2): 93-109.

[5]
Basu S R,et al., 2005. Meandering and cut-off of the Bhagirathi river. In: Kalwar S C (ed.). Geomorphology and Environmental Sustainability. Concept Publishing Company, New Delhi, 20-37.

[6]
Bose N K, 1972. The Bhagirathi Hooghly Basin: A few remarks. In: Bagchi K G. The Bhagirathi-Hooghly Basin. In: Bagchi K G (ed.). Proceedings of the Interdisciplinary Symposium, p-xii.

[7]
Brice J C, 1964. Channel patterns and terraces of the Loup Rivers in Nebraska. US Geol. Surv. Prof. Pap., 422-D: 1-41.

[8]
Chatterjee M, 2014. Riverine morphology and socio-economic environment in the southern part of Nadia District, West Bengal: An impact assessment [D]. University of Burdwan.

[9]
Das S, 2016. Identification of erosion susceptible river bank sites of Kalindri River, Malda District, West Bengal.International Journal of Geology, Earth, and Environmental Sciences, 6: 78-89.

[10]
Deb M, Ferreira C, 2014. Planform Channel Dynamics and Bank Migration Hazard Assessment of a High Sinuous River in the North-eastern Zone of Bangladesh. Springer, 6613-6623.Rivers or watercourses in Sylhet plain of Bangladesh are very dynamic over time. The aim of the present study is to investigate the channel planform dynamics, the prediction of future lateral migration of the bankline and assessment of the hazards associated with Manu River, Bangladesh. The name Manu River represents the river study reach from Tripura, India to Moulvibazar, Bangladesh of 41.6 km. Channel contraction and expansion are very frequent in this river. Studies had shown that the sinuosity of the river varies from 1.36 to 2.48. Also the meandering ratio of the river ranges from 0.32 to 1.67. Satellite data were collected and analyzed to determine the planform characteristics, meandering parameters and bankline migration rates between 1975 and 2013. The study is based on the Landsat satellite imagery of 1975, 1988, 1999, 2003 and 2005 and aerial photograph of 2009 and 2013 which were accumulated from United States Geological Survey. Specific critical bends have been elected where bank erosion and accretion rates were severe. The purpose of this paper is to show the erosion rate, behavior and pattern of upstream side of Manu River, Bangladesh through the study period of 38 years from 1975 to 2013 by comparing its different geomorphological parameters. This study has contributed to develop a model for bankline migration prediction of the forthcoming years and address the physical hazard to provide a risk surface. Present assessment has revealed that, there are some critical regions where erosion would be up to 29.18 hectares in 2025.

DOI

[11]
Garrett J E, 1910. Bengal District Gazetteers, Nadia. Calcutta: Bengal Secretariat Book Depot.

[12]
Islam A, Guchhait S K, 2017. Analysing the influence of Farakka Barrage Project on channel dynamics and meander geometry of Bhagirathi river of West Bengal, India.Arab. J. Geosci., 10: 245. doi: 10.1007/s12517- 017-3004-2, 2-18.Farakka Barrage Project (FBP) constructed in 1975 on the river Ganga in West Bengal, India has largely altered hydro-geomorphic processes inducing a different kind of impetus in channel dynamics espec

DOI

[13]
Islam A, Guchhait S K, 2015. Is Severity of River Bank Erosion Proportional to Social Vulnerability? A Perspective from West Bengal, India. ISBN 978-81-7445-690-8.

[14]
Knighton D, 1998. Fluvial Forms and Processes: A New Perspective. London: Arnold.This is a completely revised and updated edition of the author's book on fluvial forms and processes of rivers are presented in 6 chapters with subdivisions as follows: introduction; drainage works (network analysis, hillslope processes, channel initiation, network evolution, and hillslopes, networks and channels); catchment processes (catchment hydrology and catchment denudation); fluvial proc...

DOI

[15]
Lacey G, 1939. Regime flow in incoherent alluvium. Publication Central Board of Irrigation,India, 20.

[16]
Lacey G, 1958. Flow in alluvial channels with sandy mobile beds.Proceeding of the Institute of Civil Engineers, 9: 145-164.

DOI

[17]
Leopold L B,et al., 1964. Fluvial Processes in Geomorphology. New York: Dover Publications Inc.

[18]
Leopold LB, Langbein W B, 1966. River meanders.Sci. Am., 214(6): 60-70.

[19]
Luna B Leopold, Thomas Maddock Jr., 1953. The Hydraulic Geometry of Stream Channels and Some Physiographic Implications, Geological Survey Professional Paper 252, United States Government Printing Office,Washington, 1953.

[20]
Mondal I, Bandyopadhyay J, Paul A K, 2016. Estimation of hydrodynamic pattern change of Ichamati River using HEC RAS model. West Bengal, India, Model.Earth Syst. Environ., 2: 125. doi: 10.1007/s40808-016-0138-2.The physically-based hydrodynamic model can simulate the water flow dynamics of a stream network against time varying boundary conditions that can be implemented for the case of Ichamati River. Such river models are often an important component of flood forecasting, tidal fluctuation system that forecasts river levels in flood prone regions of the middle stream of Ichamati river. The measurements of river bed depth/slope, water quality (river cross section), floodplain mapping and boundary condition flow are essential for the set up of a river model. But one can use proxy approaches relying mostly on remote sensing data from space platforms for the purpose. In this study, we set up the one dimensional river analysis system (RAS) model of the hydrologic engineering center (HEC) over the stream network of the Ichamati river basins. Good quality in situ measurements of river hydraulics (cross section, slope, flow) were available only for the upstream and middle stream flood prone region of the basin. The de-siltation of the stretch of Ichamati river under survey i.e. middle part showed impacts which were positive in ways more than one. The river velocity in the top strata is 0.3 m/s from model and the river regained its ecological flow. Also, the increased salinity of the river helped in cultivation of different species of fishes, which are socio economically relevant in the adjoining areas. Due to the increased capacity of the channel in the middle part possibility of flood has also decreased. The total volume of silt accumulated has been estimated 277,589.92 m

DOI

[21]
Morisawa M, 1985. Rivers: Form and Process. In: Clayton K M (ed.). London and New York: Longman, Longman Group Limited., 222 p.

[22]
Mueller J E, 1968. An introduction to the hydraulic and topographic sinuosity indexes.Ann. Assoc. Am. Geogr., 58(2): 371-385.http://www.jstor.org/stable/2561621

DOI

[23]
Mukherjee B B, 1972. Quaternary pollen analysis as a possible indicator of prehistoric agriculture in the deltic part of West Bengal.J. Palynol., 8: 144-151.

[24]
Mukherjee I, 2012. Impact of hydrological characteristics and fluvial morphology on land utilization in the Bhagirathi and Jalangi Floodplains of Eastcentral West Bengal [D]. University of Burdwan.

[25]
Mukherjee R K, 1938. The Changing Face of Bengal, A Study in Riverine Economy, C.U, reprinted in 2009, p-6.

[26]
Mukherjee S, 2005. Prerequisite studies for numerical flow modeling to locate safe drinking water wells in the zone of arsenic-polluted groundwater in the Yamuna sub-basin, West Bengal, India. Balkema Publication. In: Bundschuh J, Bhattacharya P, Chandrasekharam D (eds). Natural Arsenic in Groundwater Occurrence Remediation and Management. Pre-Congress Workshop. 19-20 Aug 2004. 32nd International Geological Congress Florence, Italy. The Netherlands: A.A. Balkema Publishers, 331-338.

[27]
Pal S, 2016. Impact of Tilpara barrage on backwater reach of Kushkarni River: A tributary of Mayurakshi River.Environ. Dev. Sustain., doi: 10.1007/s10668-016-9833-4.Abstract Tilpara barrage over Mayurakshi River has exerted crucial impact on backwater reach of river Kushkarni (4.5 km upstream reach) which debouches to Mayurakshi River at immediate upstream head of this barrage. Study area is located at the Chota Nagpur plateau fringe highly erodible Rarh tract of Birbhum district of West Bengal. From this study, it is found that due to storage of water in the reservoir, backwater created and confluence part of the Kushkarni River is submerged. Stagnation of reservoir water reduced carrying capacity of channel by 26 %, and it is facilitated by declining trend of channel bed slope and velocity of flow. Depth of channel is attenuated by 17 71 cm depositing 919,342.6 m3 of coarser sediment load. In this circumstance, high flood level frequency in same inflow state has increased by 26.5 % and channel braiding has started to nucleate. Alternate textural sequence of materials from river bed reveals some irregular episodic inflow events within reservoir. Episodic discharge and consequent large flood have created thick sand splay cover in the left side of the channel and damaged agricultural land. Potential bank erosion hazard index or BEHI is considerably high (27.35 31.73) in this backwater reach, and the process is mainly triggered by liquefaction. Considering existing forms and functions of the study segment, it is evaluated with existing reservoir upstream channel morphology model of Skalak et al. (2013) and found to be proximate. Such alteration of channel morphology in this segment is linked with socio-ecological fabric of the surrounding area. Along with channel morphological readjustment, socio-ecological setup is also moving toward new adjustment.

DOI

[28]
Panda S, Bandyopadhyay J, 2011. Morphodynamic changes of Bhagirathi River at Murshidabad District using geoinformatics.J. of Geog. Inf. Sys., 3: 85-97.

[29]
Rennell J J, 1781. The Ganges and Brahmaputra Rivers: Royal Society. London Philosophical Transactions, Vol. LXXI.

[30]
Rudra K, 1981. Identification of the ancient mouths of the Ganga as described by Ptolemy.Geogr. Rev. India, 43: 97-104.

[31]
Rudra K, 2008. Banglar Nadikatha. Sahitya Samsad, Kolkata Rudra K (2010) Dynamics of the Ganga in West Bengal, India (1764-2007): Implications for science-policy interaction.Quat. Int., 227: 161-169.

[32]
Rudra K, 2010. Banglar Nadikatha. 2nd ed. Kolkata: Sishu Sahitya Sangsad, 45-51.

[33]
Rudra K, 2011. The encroaching Ganga and social conflict: The case of West Bengal, India. Kolkata: .

[34]
Rudra K, 2014. Changing river courses in the western part of the Ganga-Brahmaputra delta.Geomorphology, 227: 87-100.The Ganga–Brahmaputra delta is the largest on Earth, the product of two of the world's largest and siltiest rivers. It is formed in a basin located over the zone where the Indian plate subducts beneath the Himalaya to the north and the Indo-Burman ranges to the east. The distributaries in the south-western part of the delta remain disconnected from the Ganga–Padma during the lean season, although they are still active in bank erosion and sediment transport during the monsoon. Four distributaries of the Bhagirathi–Hugli (the westernmost branch of the Ganga) have gone dry during known historical period. In many cases, the natural decay of rivers has been exacerbated by the human intervention, especially where rivers are embanked and no allowance made for their migration through meandering and avulsion. In the coastal zone where mangroves were cleared and creeks were embanked since the late 18th century, decay of channels, and advancement of the sea towards inland have been aggravated. The subsequent attempt of flushing the sediment load to the sea from the estuary to improve the status of navigation in the Bhagirathi–Hugli River was not successful to the level of expectation. This paper deals with the decay and changing courses of rivers in the western part of the Ganga–Brahmaputra delta.

DOI

[35]
Schumm S A, 1963. Sinuosity of alluvial rivers in the Great Plains.Geol. Soc. Am. Bull., 74: 1089-1100.

[36]
Willcocks W, 1930. The ancient system of irrigation in Bengal, Vol.1. Department in Rivers of Bengal. Reprinted by West Bengal State Gazetteers.jj.

Outlines

/