
Journal of Geographical Sciences >
Topographical relief characteristics and its impact on population and economy: A case study of the mountainous area in western Henan, China
Author: Zhang Jingjing (1991-), PhD Candidate, specialized in development and utilization of natural resources in mountain areas. E-mail: zhang112x@163.com
Received date: 2018-09-16
Accepted date: 2018-11-07
Online published: 2019-04-12
Supported by
National Natural Science Foundation of China, No.41671090
National Basic Research Program (973 Program), No.2015CB452702
Copyright
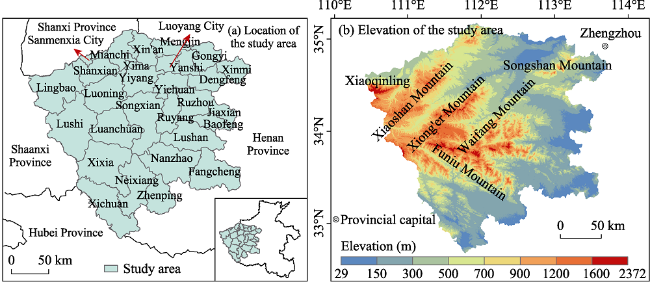
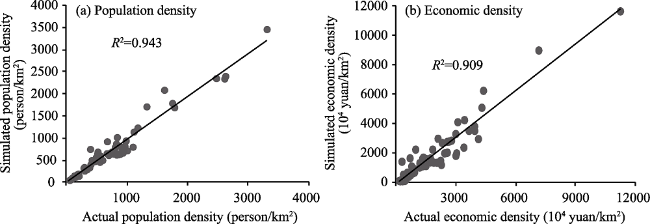
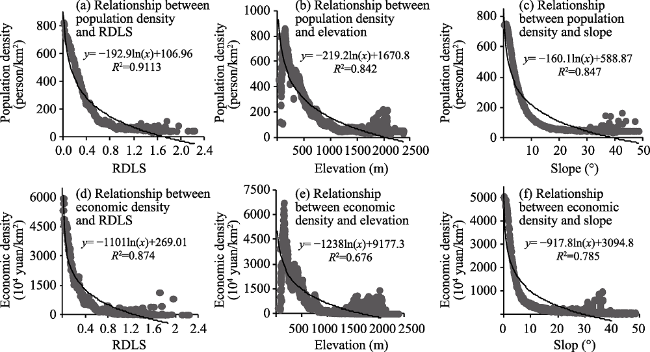
Topographical relief is a key factor that limits population distribution and economic development in mountainous areas. The limitation is especially apparent in the mountain-plain transition zone. Taking the transition zone between the Qinling Mountains and the North China Plain (i.e. the mountainous area in western Henan Province) as an example and based on the 200-m resolution DEM data, we used the mean change-point analysis to determine the optimal statistical unit for topographical relief, and thereafter extracted the relief degree. Taking the 1:100,000 land use data, township population and county-level industrial data, population and economic spatial models were constructed, and 200-m resolution grid population and economic density maps were generated. Afterwards, statistical analysis was carried out to quantitatively reveal the impact of topographical relief on population and economy. In addition, the impacts of other topographical factors were discussed. The results showed the following. (1) The relief degree in western Henan is generally low, where 58.6% of the regional topography does not exceed half the height of a reference mountain (relative elevation ≤250 m). Spatially, the relief degree is high in the west while low in the east, and high in the middle while low in the north and south. There is a positive correlation between relief degree and elevation, and a much stronger correlation between relief degree and slope. (2) The linear fitting degree between the population and economic validation data and the corresponding simulation data are 0.943 and 0.909, respectively, indicating that the spatialized results can reflect the actual population and economic distribution. (3) The impact of topographical relief on population and economy was stronger than that of other topographical factors. The relief degree showed a good logarithmic fit relationship with population density (0.911) and economic density (0.874). Specifically, 88.65% of the population lives in areas where the topographical relief is ≤0.5 and 88.03% of the gross regional product was from areas where the relief is ≤0.3. Compared with the population distribution, the economic development showed an obvious agglomeration trend towards low relief areas.
ZHANG Jingjing , ZHU Wenbo , ZHU Lianqi , CUI Yaoping , HE Shasha , REN Han . Topographical relief characteristics and its impact on population and economy: A case study of the mountainous area in western Henan, China[J]. Journal of Geographical Sciences, 2019 , 29(4) : 598 -612 . DOI: 10.1007/s11442-019-1617-y
Figure 1 Location and elevation map of the western Henan mountainous area, China |
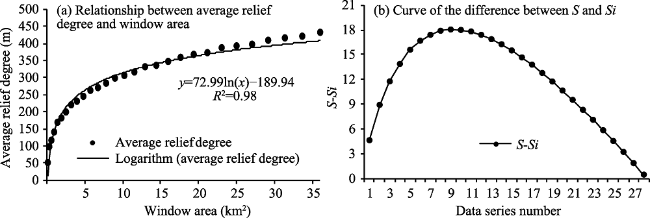
Figure 2 Relationship between the average relief degree and the window area (a), and the curve of the difference between S and Si (b) |
Table 1 Relationship between population density, economic density and the corresponding land use type indices |
| Type | Regression equation | Relative coefficient |
|---|---|---|
| Population density | $\begin{align} & Y=455.22X1+49.341X21+12.222X22-181.338X23+338.556X24-192.647X31 \\ & -64.721X32+351.082X33+2982.149X51+2453.164X52+779.709X53 \\ \end{align}$ | 0.937 |
| Economic density of the primary industry | $\begin{align} & Y=1171.513X11+383.519X12+36.694X21+432.508X22+ \\ & \ \ \ \ \ \ 719.687X23-3094.677X24-345.41X31+179.08X32- \\ & \ \ \ \ \ \ 7331.019X33-1755.961X41+380.34X43 \\ \end{align}$ | 0.990 |
| Economic density of the secondary and tertiary industries | $Y=54053.11X51+14161.954X52+31699.782X53$ | 0.975 |
Figure 3 RDLS of western Henan mountainous area (a), and RDLS distribution ratios and area cumulative frequencies (b) |
Table 2 Main RDLS parameters of western Henan mountainous area |
| RDLS | [Max (H) - Min (H)] | P (A) /A | |
|---|---|---|---|
| Range | Proportion (%) | Average (m) | Average (%) |
| 0-0.1 | 24.21 | 48.98 | 70.41 |
| 0.1-0.3 | 19.86 | 122.56 | 44.78 |
| 0.3-0.5 | 14.53 | 217.88 | 7.25 |
| 0.5-0.7 | 15.05 | 307.59 | 2.80 |
| 0.7-1 | 16.11 | 424.10 | 1.31 |
| 1-1.3 | 7.57 | 568.53 | 0.62 |
| 1.3-1.6 | 2.18 | 707.43 | 0.35 |
| 1.6-2.23 | 0.49 | 864.74 | 0.20 |
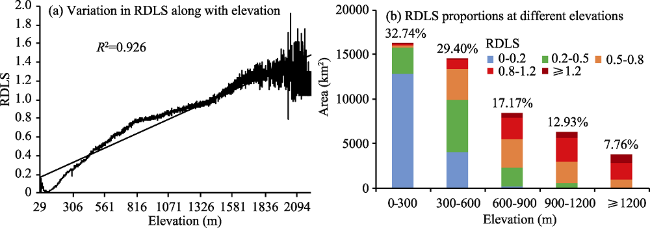
Figure 4 Variations in RDLS along with elevation (a), and RDLS proportions at different elevations (b) |
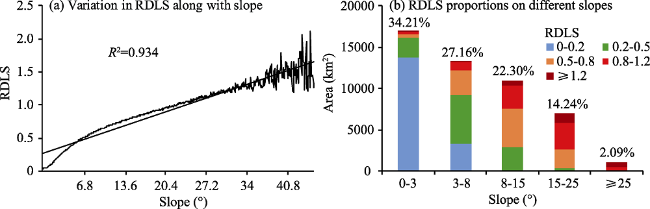
Figure 5 Variations in RDLS along with slope (a), and RDLS proportions on different slopes (b) |
Figure 6 Relationship between simulated and statistical values |
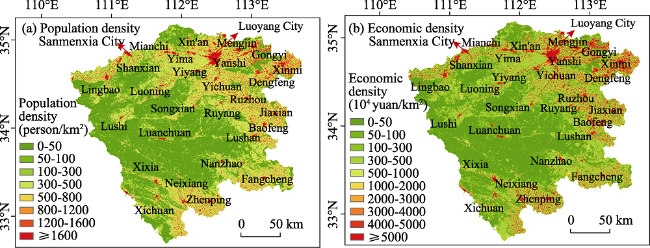
Figure 7 Spatial distribution of population density and economic density at a resolution of 200 m × 200 m |
Figure 8 Relationships of RDLS, elevation and slope with population density and economic density |
Figure 9 Variations in cumulative frequencies of population, gross regional product and land area with changes in RDLS |
Table 3 Statistics of land, population and economy at different RDLS |
| RDLS | Land | Population density (person/ km2) | Economic density (104 yuan/km2) | Population | Gross regional product | Cumulative frequency of population (%) | Cumulative frequency of gross regional product (%) | |||
|---|---|---|---|---|---|---|---|---|---|---|
| Area (km2) | Percentage (%) | Total (104 people) | Percentage (%) | Total amount (108 yuan) | Percentage (%) | |||||
| 0-0.1 | 11900.80 | 24.21 | 728.91 | 4542.99 | 892.42 | 49.86 | 5707.36 | 64.07 | 49.85 | 64.07 |
| 0.1-0.3 | 9760.52 | 19.86 | 511.11 | 2106.84 | 511.43 | 28.57 | 2133.51 | 23.95 | 78.43 | 88.03 |
| 0.3-0.5 | 7143.16 | 14.53 | 259.13 | 802.51 | 183.02 | 10.23 | 567.15 | 6.37 | 88.65 | 94.39 |
| 0.5-0.7 | 7399.40 | 15.05 | 132.73 | 349.79 | 98.93 | 5.53 | 255.89 | 2.87 | 94.18 | 97.27 |
| 0.7-1 | 7920.08 | 16.11 | 88.11 | 214.55 | 71.25 | 3.98 | 176.93 | 1.99 | 98.16 | 99.25 |
| 1-1.3 | 3720.68 | 7.57 | 67.63 | 143.66 | 25.23 | 1.41 | 53.59 | 0.60 | 99.57 | 99.85 |
| 1.3-1.6 | 1070.84 | 2.18 | 58.90 | 94.24 | 6.44 | 0.36 | 11.23 | 0.13 | 99.93 | 99.98 |
| 1.6-2.23 | 238.48 | 0.49 | 45.46 | 60.36 | 1.19 | 0.07 | 1.77 | 0.02 | 100.00 | 100.00 |
Table 4 Error analysis of simulated results |
| Type | Simulated data | Statistical value | Residual error | Relative error (%) |
|---|---|---|---|---|
| Total population (104 people) | 1802.64 | 1790.8 | 11.84 | 0.66 |
| Primary industry (108 yuan) | 989.7 | 976.09 | 13.61 | 1.39 |
| Secondary and tertiary industries (108 yuan) | 7988.51 | 7554.16 | 434.35 | 5.75 |
| Gross regional product (108 yuan) | 8978.21 | 8530.25 | 447.96 | 5.25 |
The authors have declared that no competing interests exist.
| [1] |
|
| [2] |
|
| [3] |
|
| [4] |
|
| [5] |
|
| [6] |
|
| [7] |
|
| [8] |
|
| [9] |
|
| [10] |
|
| [11] |
|
| [12] |
|
| [13] |
|
| [14] |
|
| [15] |
|
| [16] |
|
| [17] |
|
| [18] |
|
| [19] |
|
| [20] |
|
| [21] |
|
| [22] |
|
| [23] |
|
| [24] |
|
| [25] |
|
| [26] |
|
| [27] |
|
| [28] |
|
| [29] |
|
| [30] |
|
/
| 〈 |
|
〉 |

