Research Articles

Extraction and analysis of abandoned farmland:A case study of Qingyun and Wudi counties in Shandong Province

  • XIAO Guofeng , 1, 2, 3 ,
  • ZHU Xiufang , 1, 2, 3, * ,
  • HOU Chenyao 2 ,
  • XIA Xingsheng 1
Expand
  • 1. Key Laboratory of Environmental Change and Natural Disaster of Ministry of Education, Faculty of Geographical Science, Beijing Normal University, Beijing 100875, China
  • 2. State Key Laboratory of Earth Surface Processes and Resource Ecology, Beijing Normal University, Beijing 100875, China
  • 3. Beijing Engineering Research Center for Global Land Remote Sensing Products, Institute of Remote Sensing Science and Engineering, Beijing Normal University, Beijing 100875, China
*Corresponding author: Zhu Xiufang, PhD and Associate Professor, E-mail:

Author: Xiao Guofeng, Master Candidate, specialized in land use change monitoring research. E-mail:

Received date: 2018-09-10

  Accepted date: 2018-11-08

  Online published: 2019-04-12

Supported by

The National High Resolution Earth Observation System (The Civil Part) Technology Projects of China

State Key Laboratory of Earth Surface Processes and Resource Ecology, No.2017-FX-01(1)

Copyright

Journal of Geographical Sciences, All Rights Reserved

Abstract

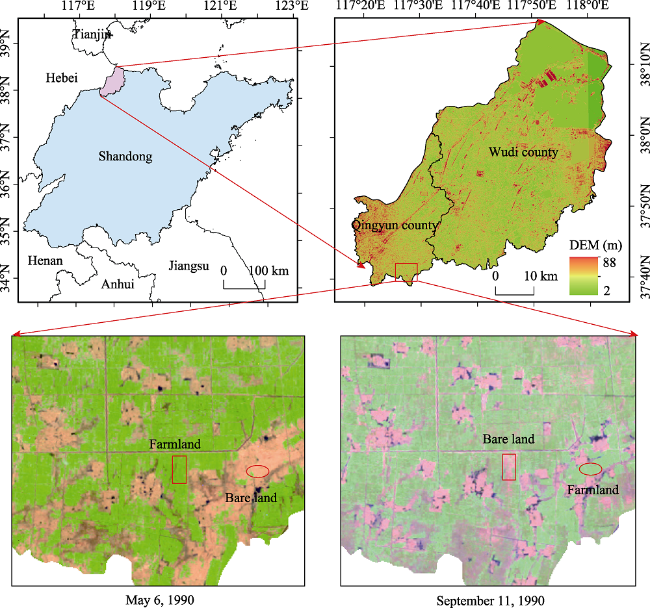
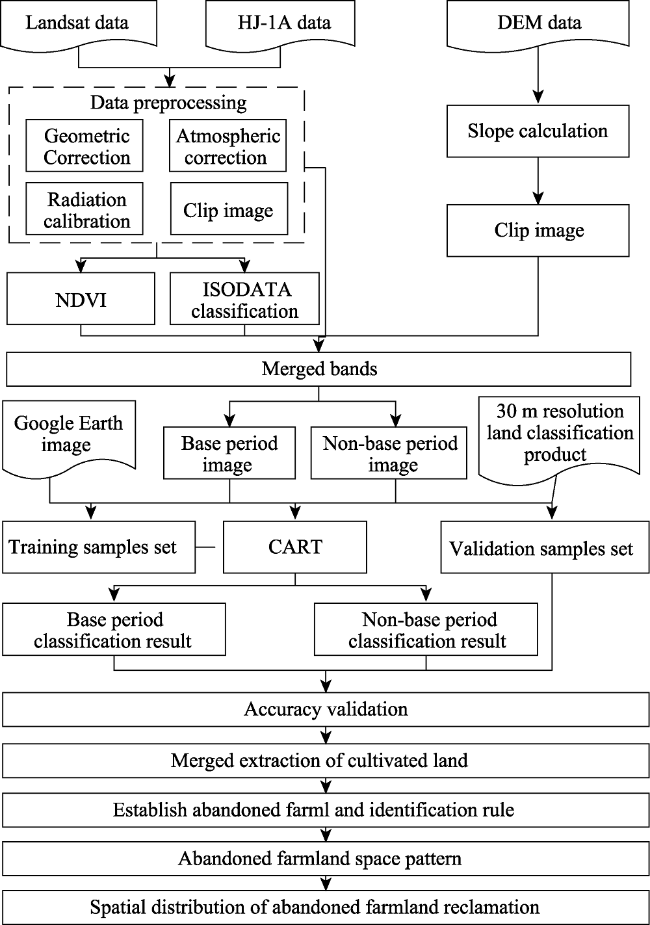
Rapid urbanization and continuous loss of rural labor force has resulted in abandonment of large areas of farmland in some regions of China. Remote sensing technology can indirectly help detect abandoned farmland size and quantity, which is of great significance for farmland protection and food security. This study took Qingyun and Wudi counties in Shandong Province as a study area and used CART decision tree classification to compile land use maps of 1990-2017 based on Landsat and HJ-1A data. We developed rules to identify abandoned farmland, and explored its spatial distribution, duration, and reclamation. CART accuracy exceeded 85% from 1990-2017. The maximum abandoned farmland area was 5503.86 ha during 1992-2017, with the maximum rate being 5.37%. Farmland abandonment rate was the highest during 1996-1998, and abandonment trend decreased year by year after 2006. Maximum abandonment duration was 15 years (1992-2017), mostly within 4 years and only a few exceeded 10 years. From 1993-2017, the maximum reclaimed abandoned farmland was 2022.3 ha, and the minimum ~20 ha. The maximum reclamation rate was 67.44%m, with annual average rate being 31.83%. This study will help analyze farmland abandonment driving forces in the study area and also provide references to identify abandoned farmland in other areas.

Cite this article

XIAO Guofeng , ZHU Xiufang , HOU Chenyao , XIA Xingsheng . Extraction and analysis of abandoned farmland:A case study of Qingyun and Wudi counties in Shandong Province[J]. Journal of Geographical Sciences, 2019 , 29(4) : 581 -597 . DOI: 10.1007/s11442-019-1616-z

1 Introduction

Rapid urbanization has changed land use types and population distributions, and as rural population continues to decrease large arable land areas have been abandoned (Li and Zhao, 2011). Abandonment is one of the most important forms of cultivated land use change. Under the joint action of economic and natural factors, land production operators stop or reduce cultivation for varying periods, leaving cultivated land barren or unused (Huang et al., 2008).
The overall quality of cultivated land in China is poor compared with other countries, the amount of cultivated land per capita is small (Qi, 2009), and the area of sloping farmland is large (Hou et al., 2004). Large areas of farmland have been abandoned in some regions of China (Zhang et al., 2014; Shi, 2015). Farmland abandonment not only aggravates the contradiction between man and land, but also challenges national food security. Many studies have shown that farmland abandonment also impacts biodiversity (Queiroz et al., 2014), soil quality (Molinillo et al., 1997; Bakker et al., 2008), carbon cycle (Vuichard et al., 2008; Batllebayer et al., 2010), environment (Macdonald et al., 2000), etc. Therefore, the spatial distribution of abandoned farmland can provide the basis to analyze abandoned farmland environmental impacts.
There is no China-wide measurement for farm abandonment and hence the current extent of abandonment is not well known. Spatial and temporal resolutions of remote sensing image have greatly improved with rapid remote sensing technology developments. High temporal and spatial resolution remote sensing images can not only extract abandoned land size and quantity, but also help identify abandonment trends and driving factors. Alcantara et al. (2012) used support vector machine (SVM) models to map abandoned agricultural land at broad scales across Eastern Europe and the former Soviet Union, based on the normalized difference vegetation index (NDVI) and reflectance bands (NASA Global MODIS Terra and Aqua 16-Day Vegetation Indices for 2003-2008, ~250 m resolution) and phenology metrics calculated by TIMESAT. Overall classification accuracy for abandoned agricultural land was 65%. Yusoff et al. (2017) used a SPOT-6 satellite images to extract and classify abandoned oil palm areas and multi-temporal Landsat Operational Land Imager (OLI) imagery to develop the phenology of abandoned oil palm sites. They were able to identify waste oil palm areas with 92%±1% accuracy. Alcantara et al. (2013) used MODIS NDVI time series data to extract abandoned farmland distributions for Central and Eastern Europe 2004-2006, and produced abandoned area maps. Abandoned farmland was widespread, totaling 52.5 million hectares (Mha). Baumann et al. (2011) used an SVM approach based on Gaussian kernel functions to extract abandoned farmland from 1986-2008 Landsat images for western Ukraine. Abandonment in the study area was widespread (56%), with approximately 6600 km2 (30%) of farmland used after 1991. Kuemmerle et al. (2009) used Landsat TM/ETM+ images to produce land use coverage maps to extract the range of abandoned farmland in southern Romania from 1990 to 2005, and found that the rate of abandonment was 21.1%. Estel et al. (2015) used MODIS time series data to extract abandoned farmland for Europe 2001-2012 based on random forest classification and detected approximately 128.7 Mha of fallow land (24.4% of all farmland). Ma (2010) used land use change data to extract the amount of abandoned farmland, abandonment speed, and abandonment rate for Hollinger County, Inner Mongolia, 1996-2009. Cheng (2011) analyzed the accuracy for three methods to extract abandoned farmland in Huidong, Haifeng, and Lufeng counties of Guangdong Province, establishing an interpretation mark based on NDVI time series features and spectral features. Extracting abandoned farmland based on NDVI time series features provided the best outcomes. Shi and Xu (2016) extracted farmland from topographical maps for 2002 and current land use maps for 2011, and superposed farmland layers for these periods to provide distribution maps for abandoned farmlands 2002-2011 in typical counties of Chongqing. Farmland abandonment rates in Shizhu, Wushan, and Youyang counties were 14.0%, 19.9%, and 19.2%, respectively for 2011. Niu et al. (2017) used four Landsat-8 OLI images from spring and autumn of 2013 and 2015 to obtain abandoned farmland spatial and temporal distribution for Zilu Town, Luoshan County, Henan Province. They found that interannual abandoned farmland area accounted for 7.45% of total Zilu Town farmland area, and seasonal abandoned farmland for 14.33%.
Most previous studies identified abandoned farmland using two temporal remote sensing images. There has been little research on long time series abandoned land and almost none on reclamation of abandoned land. This study selected the plains area of Shandong Province (Qingyun and Wudi counties) and created classification maps using the CART decision tree classification algorithm for 1990-2017 based on Landsat and HJ-1A data. Abandoned farmland spatial distribution for 1992-2017 was extracted relative to arable farmland in the datum year (1990), according to definition and recognition rules for abandoned farmland. We used GIS spatial statistical functions to calculate abandonment durations, and extract abandoned farmland reclamation. The results from this paper will not only help analyze driving forces underlying farmland abandonment in the study area, but also provide references to the identification of the abandoned farmland in other areas.

2 Study area and data

2.1 Study area

Figure 1 shows the selected study area: Qingyun and Wudi counties of Shandong, an eastern coastal province of China located at lower reaches and the Yellow River, ranging 34°22.9′N to 38°24.01′N and 114°47.5′E to 122°42.3′E, covering 155.8 thousand km2, including 17 cities and 137 counties. Climate in Shandong Province generally belongs to warm temperate monsoon type with concentrated rainfall, with rain and heat tending to occur over the same period. Frost free period increases from northeast to southwest. Light resources are abundant and general heat conditions can identify the need of two crops a year. Shandong is one of the major food production provinces in China, mainly producing wheat, corn, rice, soybeans, cotton, and peanuts. Previous studies (Li et al., 1994; Du et al., 2015) revealed that serious arable land abandonment has occurred in Qingyun and Wudi counties.
Figure 1 Location of Qingyun and Wudi counties, Shandogn Province, China

2.2 Data

The data used in this study include 30 m resolution Landsat images 1990-2011 and 2013-2017 from US Geological Survey (USGS) (http://glovis.usgs.gov/), with 30 m resolution HJ-1A data obtained from China Resource Satellite Application Center (http:// www.cresda.com/CN/) replacing 7 Landsat images of 2012 due to visible stripes in these mages. Time series images for 1990-2017 were collected with 2 images in each year, i.e. 56 images over 28 years in total. Images were mainly collected for the same two periods each year: April to June and July to October. Table 1 shows specific image details.
We also used 30 m resolution DEM data from the spatial data cloud (http://www.gscloud.cn/) as auxiliary data for classification. The 30 m resolution land classification product (1995, 2000, 2005, 2010, 2015) from Resource and Environment Data Cloud Platform (http://www.resdc.cn/) and Google Earth images were used as basic data to select training and validation samples.
Table 1 Image acquisition time and classification accuracy
Year Date
(month-day)
Date of
base image
Overall accuracy
(%)
Year Date
(month-day)
Date of
base image
Overall accuracy
(%)
Date1 Date2 Date1 Date2 Date1 Date2 Date1 Date2
1990 0506 0911 0911 92.5 94.2 2004 0528 1003 1003 87.5 89.1
1991 0509 1006 0509 90.3 84.3 2005 0515 0904 0904 87.7 89.9
1992 0527 1018 1018 91.7 91.8 2006 0502 0907 0907 89.1 90.4
1993 0514 0903 0903 86.0 92.1 2007 0505 0809 0809 84.0 90.9
1994 0517 0906 0517 92.6 91.4 2008 0608 0827 0827 84.2 88.3
1995 0504 0824 0504 93.7 88.4 2009 0526 0830 0830 86.9 89.2
1996 0522 1013 0522 86.4 83.5 2010 0427 0614 0427 90.1 86.4
1997 0423 1016 1016 85.3 88.7 2011 0516 0820 0820 86.8 86.9
1998 0528 0629 0629 85.2 85.2 2012 0527 0928 0928 89.6 90.2
1999 0429 0803 0803 90.4 92.4 2013 0521 0825 0825 84.1 91.1
2000 0501 0906 0906 85.3 88.6 2014 0508 0929 0929 86.5 90.9
2001 0418 0909 0909 87.0 92.2 2015 0425 0815 0815 87.9 90.0
2002 0710 1014 0710 91.7 86.4 2016 0513 1004 0513 91.4 84.2
2003 0627 0915 0915 88.8 91.1 2017 0516 1023 1023 91.5 91.4

3 Methodology

Figure 2 shows the study technical flowchart.
Figure 2 Technical flowchart of the study
(1) TM and HJ-1A images were preprocessed to generate CART inputs.
(2) Google Earth image and previous high resolution land classification datasets were used to select training and validation samples for each image. Each image was classified using CART classification and accuracy was assessed for each classification map.
(3) The two classification maps for each year were combined to generate the final land use map for each year.
(4) Identification rules for abandoned farmland were established, based on identified abandonment and abandoned farmland spatial distributions were mapped.
(5) Spatial distribution maps for abandoned farmland reclamation were generated as time series abandonment maps.

3.1 Data preprocessing

TM and HJ-1A images were processed by geometric correction, radiometric calibration, atmospheric correction and image clipping, and then NDVI were calculated for each image. Then ISODATA unsupervised classification was performed using ENVI 5.3, with 10-15 classes and 10 iterations. The physical slope of the study area was calculated pixel by pixel using ArcGIS and DEM data. Finally, red, green, blue, and near infrared bands from each original image were combined with slope, NDVI, and ISODATA classification map to generate a new 7 band image for further processing.

3.2 CART decision tree classification

Many methods have been proposed to improve classification accuracy, including artificial neural networks, decision trees, support vector machine, etc. Decision tree classification can make full use of spectral features and other auxiliary image information, and effectively solve the problem for different objects having the same spectra and similar objects having different spectra (Chen et al., 2008). Common decision tree algorithms include ID3, C4.5, CART (Classification and Regression Tree), etc. (Zhao et al., 2005). The CART decision tree algorithm is simpler than most other decision tree systems and classification thresholds are determined from the training sample to the automatically established decision tree. CART performs well and has higher precision compared with neural network and support vector machine (Ma et al., 2017).
CART algorithm was proposed by Breiman et al. (1984) and is based on two division recursive segmentation techniques that divide the sample set into two subsets, i.e., each non-leaf node of the decision tree has two branches. Hence CART generates binary trees, with only yes or no outcomes for every step.
The CART algorithm uses the Gini coefficient (Gini Index) from economics as the criterion to select the best test variables. The selection criterion is that each subnode achieves the highest purity, i.e., all subnode elements belong to the same category. Assuming the dataset can be grouped into m classes, the Gini coefficient for dataset D can be expressed as
$Gini(D)=1-\sum\limits_{i=1}^{m}{p_{i}^{2}}$, (1)
where pi refers to probability of a given element belonging to Ci and calculates by using $\left| {{C}_{i,D}} \right|/\left| D \right|$. $\sum\limits_{i=1}^{m}{p_{i}^{2}}$ is the sum of $p_{i}^{2}$.

3.3 Land use/land cover mapping

Considering the common practice for two crops per year in Shandong Province, two temporal high quality images should be selected for each year to improve cultivated land classification accuracy. From previous information, the two growing periods should be April to June and July to October. However, sowing ranges in cultivated farmland are inconsistent throughout the year. A pixel classified as cultivated land in the first temporal image may be bare land in the second temporal image and vice versa (Figure 3). Therefore, we merged identified farmland from each image for a given year to obtain the final farmland for the year. First, we classified the two temporal images in each year into six classes: farmland, woodland, grassland, water body, buildings, and bare land. Second, we validated the (two) classification map accuracy and used the classification map with the highest accuracy as the base map. Finally, we extracted farmland classified pixels from the other classification map to replace pixels in the same location that were classified as non-farmland in the base map (Figure 3).
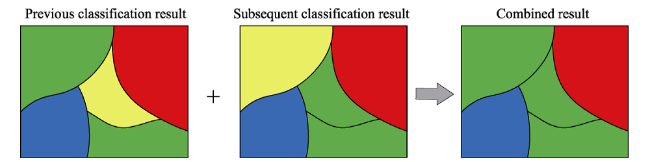
Figure 3 Example map of farmland extraction
Note:Green represents cultivated land; yellow represents bare land; blue represents water; red represents building land

3.4 Abandoned farmland identification

Some studies have defined arable land not cultivated for more than one year as abandonment, whereas others considered a single season as sufficient (Huang et al., 2008; Li and Li, 2016; Smaliychuk et al., 2016). This current study considered arable land barren for two or more years to be abandoned, while arable land barren for less than one year (including one year) was defined as fallow. Therefore, we set up the following identification rules for abandoned farmland. We used identified farmland from 1990 as the baseline and determined land use/land cover (LULC) change for each farmland pixel (T) year by year. If pixel T LULC type is farmland for a given year, then it was not abandoned in that year; if LULC type changed to water body, building area or woodland from the previous year, then it was not classed as abandoned; if LULC type changed to barren land or grassland, abandonment may have occurred. After the arable land is barren, its initial state becomes bare land. As time goes on, it gradually becomes grassland. Therefore, grassland is also suspected abandonment. However, conversion of arable land to grassland was quite rare in the study area. Therefore, this situation was ignored. The range of suspected abandoned farmland was identified year by year based on the above rules. Then, for a target year (t), if pixel T was identified as suspected abandoned farmland in the former two years (t-1 and t-2), it was regarded as being abandoned in the target year.
Thus, time series abandoned farmland distribution maps 1992-2017 were obtained. Abandonment duration was calculated pixel by pixel based on these maps, and the abandonment rate was calculated as the proportion of abandoned farmland year by year,
${{P}_{a}}=\frac{{{A}_{t}}}{{{A}_{0}}}\times 100%$, (2)
where Pa is abandonment rate, Ai is the area of abandoned farmland in the year t, and A0 is the area of farmland identified in the base year (1990).

3.5 Abandoned farmland reclamation

Cultivated land is the foundation for agricultural production. Large areas of abandoned farmland seriously hindered agricultural production and economic development. Restoration of abandoned land is the key to solve this problem. Restoration is the process of restoring abandoned farmland into arable land. The rule to identify a pixel as reclaimed was simple: if pixel T was identified as abandoned in year t-1 but identified as farmland in the target year t, then it was classified as reclaimed. Consequently, time series reclamation distribution maps 1993-2017 were obtained and the reclamation rate was calculated as the proportion of reclaimed farmland year by year,
${{P}_{r}}=\frac{{{{{A}'}}_{t+1}}}{{{A}_{t}}}\times 100%$, (3)
where Pr is reclamation rate, and ${{{A}'}_{t+1}}$ is the area of reclaimed land identified in the year t+1.

4 Results

4.1 CART decision tree classification and validation

Time series images 1990-2017 from TM and HJ-1A data were used to make LULC maps using the CART decision tree method, as shown in Figure 4. Figure 5 shows 8 exemplar LULC maps. The water body area has gradually increased with economic development, and most bare land near the sea has been converted into ponds. Building areas have expanded year by year, demonstrating urbanization, and the area of unused land was gradually reduced. Particularly in recent years, bare land has been utilized and transformed into water, building, and woodlands, except near the edge of the beach.
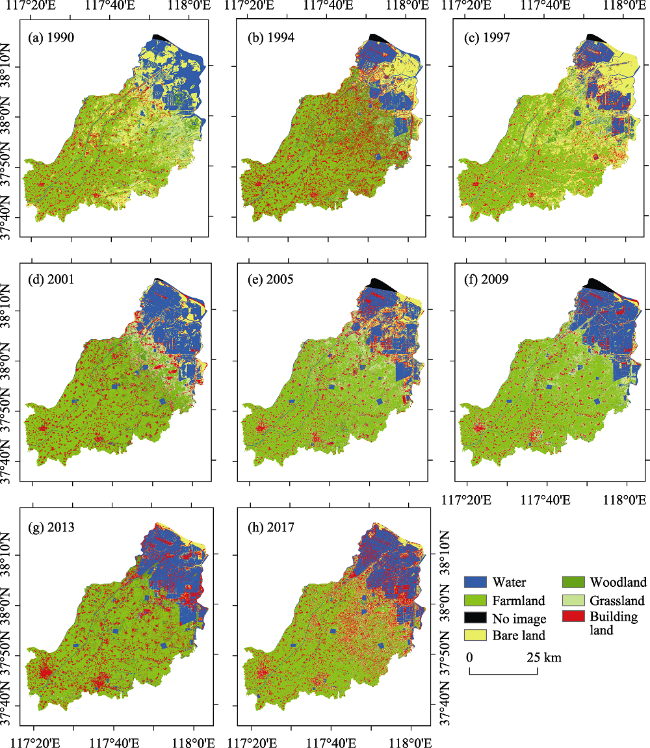
Figure 5 Land use classification results in Qingyun and Wudi counties
We used Google Earth images with similar acquisition times to the TM and HJ images and existing 30 m resolution land classification product as auxiliary data to select validation samples for each classification map, and then evaluated map accuracy using confusion matrices, as shown in Table 1. Overall classification accuracy ranged between 83.5%-94.2% over whole study period (1990-2017), with base image classification accuracy exceeding 85%.
Farmland classification from 1990 was the base data, hence its accuracy is crucial to abandoned land extraction and identification. Therefore, we selected a large number of training samples from 1990 images, and carefully checked them. Classification accuracy for the two 1990 images was 92.5% and 94.2%, respectively, which confirmed the 1990 data was suitable as farmland base data.

4.2 Abandoned farmland identification

Time series LULC classification maps were obtained using the CART algorithm, and then the spatial distribution maps of abandoned farmland for 1992-2017 were obtained using the identification rules for abandoned farmland. Figure 6 shows some examples of abandoned farmland distribution maps. Farmland abandonment mainly occurred in the central part of the study area.
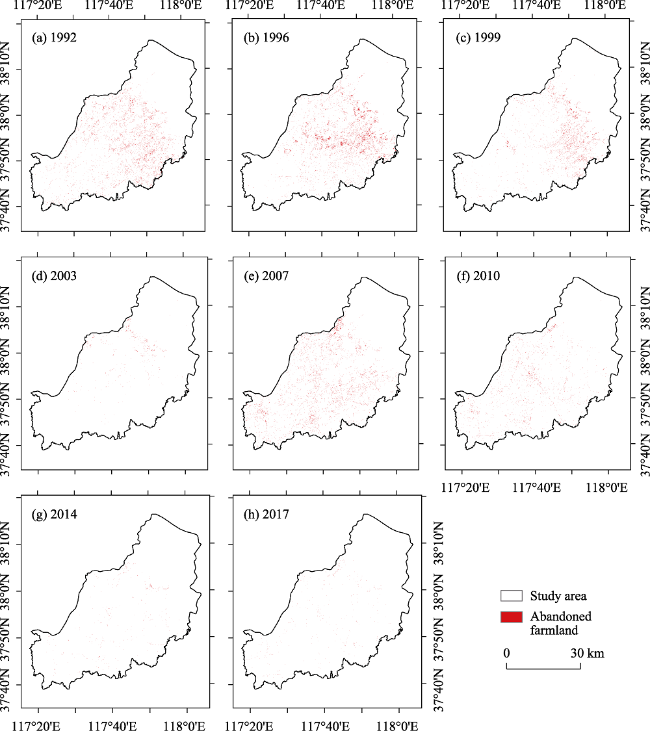
Figure 6 Distribution of abandoned farmland in Qingyun and Wudi counties
Table 2 shows the area of abandoned farmland and abandonment rate calculated year by year. Abandonment rates were higher in 1996, 1997, and 1998, with maximum abandonment rate 5.37% in 1997. Abandonment rates in 1994, 2003, 2013, 2014, 2016, and 2017 were all less than 0.4%.
Table 2 Abandoned farmland statistics in Qingyun and Wudi counties of 1992-2017
Year Abandonment area (ha) Abandonment rate (%) Year Abandonment area (ha) Abandonment rate (%)
1992 3526.74 3.44 2005 2564.73 2.50
1993 2355.03 2.30 2006 3287.61 3.21
1994 286.47 0.28 2007 2998.8 2.92
1995 650.34 0.63 2008 2850.75 2.78
1996 4372.47 4.26 2009 1851.66 1.81
1997 5503.86 5.37 2010 1307.16 1.27
1998 5288.40 5.16 2011 1519.11 1.48
1999 2255.31 2.20 2012 2418.12 2.36
2000 1097.01 1.07 2013 341.46 0.33
2001 628.02 0.61 2014 292.59 0.29
2002 842.04 0.82 2015 1285.74 1.25
2003 356.31 0.35 2016 226.44 0.22
2004 650.43 0.63 2017 263.97 0.26
Figure 9a shows abandonment trend 1992-2017. The area of abandoned farmland in 1997 was the largest (5503.86 ha) and the smallest in 2016 (226.44 ha). The change varied over the study period. 1992-1994, 1994-1997, 1997-2003, 2003-2006 and 2006-2017 alternated reducing and increasing around the overall trend. In particular, the area of abandoned farmland in 2016 and 2017 was less than 300 ha, indicating that abandonment was gradually decreasing and could be considered controlled.
Figure 7 shows abandonment duration and Table 3 shows abandoned area for different duration. Abandonment duration ranged from 1-15 years over 1992-2017. Long duration abandonment mainly occurred in the northeastern and eastern parts of the study area, whereas duration in the southwest was relatively short. Most abandoned farmland was abandoned for 4 years, with only a small amount abandoned for more than 10 years. The area of farmland abandoned for 1 year was the largest (11,183.67 ha, 48.81% of the total abandoned farmland area). Total abandoned farmland area with duration less than 4 years was 20,895.39 ha (91.20% of the total abandoned farmland).
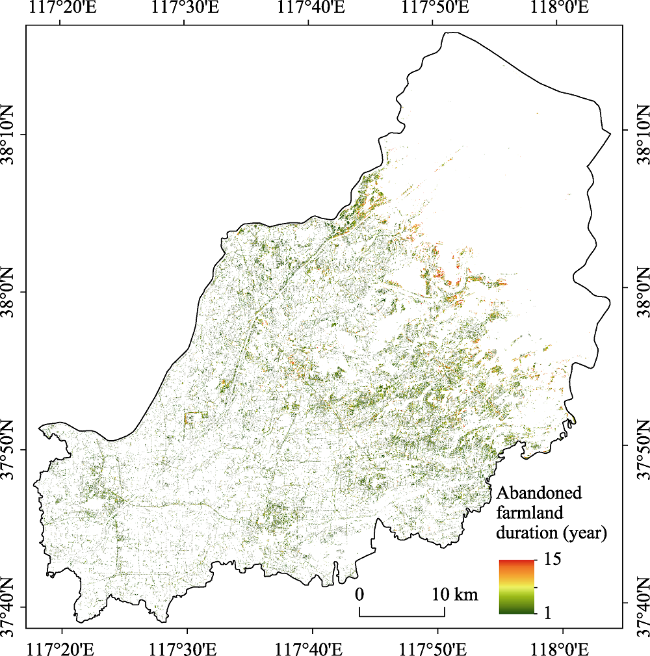
Figure 7 Distribution of abandoned farmland duration in Qingyun and Wudi counties of 1992-2017
Table 3 Abandoned farmland area for the duration of abandonment in Qingyun and Wudi counties
Abandonment duration (year) Abandonment area (ha) Abandonment duration (year) Abandonment area (ha) Abandonment duration (year) Abandonment area (ha)
1 11183.67 6 501.21 11 17.64
2 5278.32 7 288.9 12 8.46
3 2846.25 8 159.21 13 4.5
4 1587.15 9 82.26 14 1.44
5 910.17 10 40.86 15 0.99
Thus, abandonment duration for most farmland was short, and abandoned farmland area decreased with increasing duration. This may be attributed to three reasons.
1. Abandoned farmland was gradually restored to cultivated land, reducing the duration of continuous abandonment.
2. Farmland abandonment was successional: cultivated land → bare land → grassland → sparse shrub → woodland. When farmland is finally transformed into woodland, this is defined as an LULC change, and is not considered to be abandoned.
3. Rapid urbanization forced some farmland to transfer into building area. Due to lack of funds and other reasons, farmland transformed to abandoned land for many years, then when construction resumed, abandonment ceased.

4.3 Abandoned farmland reclamation

Farmland is an important land resource and abandonment is detrimental to food security and cultivated land protection. Hence reclamation of abandoned farmland is particularly important. We identified reclaimed pixels for 1993-2017 based on time series abandoned farmland and LULC maps. Figure 8 shows some examples of abandoned farmland reclamation. The distribution of reclamation was basically consistent with that of abandonment, mainly concentrated in the central part of the study area.
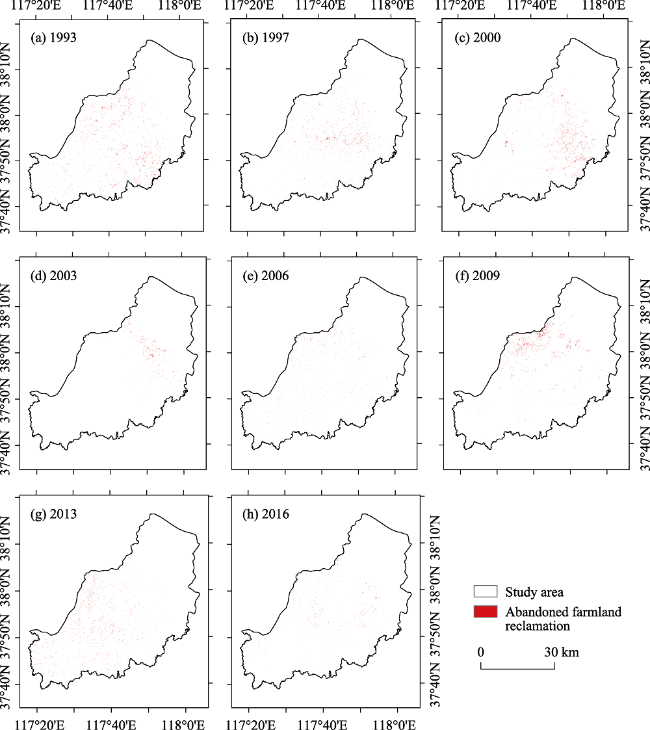
Figure 8 Reclamation of abandoned farmland in Qingyun and Wudi counties
Table 4 shows the area of reclaimed farmland and reclamation rate year by year and Figure 9b shows reclamation trends 1993-2017. Reclaimed farmland in 2008 was the largest (2022.3 ha), and the smallest in 2014 (roughly 20 ha). Maximum reclamation rate also occurred in 2008 (67.44%) with minimum in 2002 (4.61%), and the average was 31.83%. Only 4 years showed more than 50%, 12 years more than 30%, and 3 years less than 10% (2002, 2014, and 2015). Reclamation exhibited a similar time pattern of reducing and increasing changes to abandonment (Figure 9b).
Table 4 Statistics of abandoned farmland reclamation in Qingyun and Wudi counties of 1993-2017
Year Reclamation area (ha) Reclamation rate (%) Year Reclamation area (ha) Reclamation rate (%)
1993 1607.31 45.57 2006 431.28 16.82
1994 1539.09 65.35 2007 603.72 18.36
1995 89.10 31.10 2008 2022.30 67.44
1996 217.08 33.38 2009 1252.89 43.95
1997 1063.80 24.33 2010 281.79 15.22
1998 852.30 15.49 2011 141.66 10.84
1999 1010.52 19.11 2012 759.15 49.97
2000 1381.68 61.26 2013 1056.69 43.70
2001 266.49 24.29 2014 19.17 5.61
2002 28.98 4.61 2015 20.52 7.01
2003 400.68 47.58 2016 354.78 27.59
2004 183.69 51.55 2017 99.36 43.88
2005 141.30 21.72
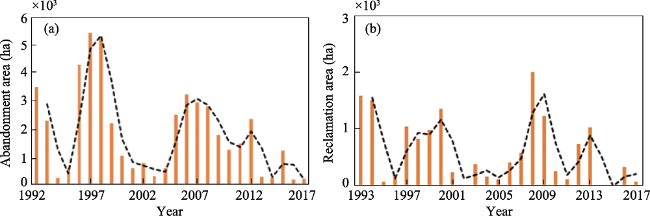
Figure 9 Statistical results of annual variation of abandoned farmland and reclaimed cultivated land in Qingyun and Wudi counties

5 Conclusion and discussion

5.1 Conclusions

This paper used the CART decision tree classification method based on 30 m spatial resolution time series remote sensing images to develop land use maps from 1990-2017, devise rules to identify abandoned farmland, and explore spatial distribution, duration, and reclamation area of abandoned farmland. Several conclusions could be drawn, as follows.
(1) Overall CART classification ranged between 83.5%-94.2% over whole study period (1990-2017), and base image classification accuracy exceeding 85%. Classification accuracy for the two 1990 images was 92.5% and 94.2%, respectively, verifying the images were suitable as farmland base data.
(2) Over the 26 years (1992-2017) study period, the largest area of annual abandoned farmland was 5503.86 ha and the smallest was 226.44 ha. Farmland abandonment rates for 1996, 1997, and 1998 were higher, with the maximum being 5.37% in 1997. Abandonment rates were less than 0.4% for 6 years (2003, 2013, 2014, 2016, and 2017). The area of abandoned farmland decreased year by year over 2006-2017.
(3) In the past 25 years (1993-2017), the largest annual reclaimed area was 2022.3 ha and the smallest 20 ha. The maximum rate was 67.44%, the minimum was 4.61%, and the average was 31.83%.

5.2 Discussion

Arable land is the most crucial material in agriculture. Arable land abandonment is closely related to ecological environment health and food security (Li and Li, 2018). Hence it is particularly important to determine the scale, quantity, duration, and reclamation for abandoned farmland. However, farmland abandonment is difficult to identify because it is driven by both natural and social factors, and abandoned farmland is usually fragmented and scattered. Small farmland patches are more vulnerable to abandonment (Lei, 2016), but spatial resolution of long time series remote sensing images is relatively low, and it is difficult to identify small abandoned land parcels in the low resolution images. On the other hand, high resolution long time series data is difficult to acquire, which poses significant challenges for abandoned farmland mapping at large scale.
This study collected 30 m spatial resolution time series images composed by Landsat and HJ-1A, combined the red, green, blue, and near infrared bands of each original image with slope, NDVI, and ISODATA classification map to generate new images with 7 bands, then classified each new image to provide LULC maps using CART. Identification rules for abandoned farmland were derived and abandoned farmland was mapped and analyzed. However, several problems should be acknowledged.
(1) There is currently no unified abandoned land definition. Various studies have considered many abandoned farmland definitions in different research areas. Some studies defined cultivated land unused for more than one year as abandoned, whereas other studies defined cultivated land unused for more than one season as abandoned, and other defined cultivated land unused for not less than two years as abandoned. This discrepancy has great influence on identification results. Considering the study area and previous investigations, this study defined abandoned farmland as cultivated land unused for two or more years.
(2) Vegetation succession on abandoned farmland is somewhat complicated. Farmland first changes to bare land after abandonment, then sparse grassland, followed by dense meadow. To protect the environment, local governments often introduce policies to return farmland to forests and grasslands. Therefore, it is difficult to determine abandoned land identification rules. This study did not consider returning farmland to forests and grasslands as abandonment, since this usually happens in mountainous areas and the study area focused on plains where farmland has little opportunity to directly convert to grassland. Collecting background details of returning farmland to forest will be useful to map abandoned farmland in mountainous areas.
(3) Image classification errors can be transferred to the final identification results. For example, crop and grass spectral characteristics are similar in spring across this study area, which could cause confusion errors during spring. However, their spectral characteristics differ in autumn, and they can be relatively easily distinguished. Therefore, we selected two temporal images for each studied year (April-June and July-October) to improve classification accuracy. It is also difficult to directly identify abandoned farmland from singe images per year. The current first created time series LULC maps and then derived identification rules to extract abandoned farmland. The LULC map errors will be transferred to abandoned farmland identification, which cannot be avoided. Thus, we reduce abandoned farmland extraction error by improving LULC map accuracy.
(4) It is difficult to directly assess abandoned farmland map accuracy. There are no statistical data on abandoned farmland. Previous studies mostly obtained small scale abandonment details (e.g. by village) using questionnaires or surveys. It is also difficult to obtain historical abandoned farmland distributions, although if abandoned land for the current year is extracted, actual abandoned samples can be investigated by field survey. Abandonment identification accuracy was indirectly assessed from image classification accuracy in this study due to the lack of real abandoned farmland data.
We must improve image classification accuracy to ensure abandoned farmland extraction accuracy and solve the problems discussed above. This study mainly used spectral information for classification. However, more information such as spatial location, should be introduced in the future to improve classification accuracy. Farmland cultivation is controlled by the natural environment and human factors (Shao et al., 2015; Li and Li, 2017). The number and optimal time for remote sensing images should be determined according to crop phenology calendars, which could reduce farmland omission errors. For example, areas with two crops per year should choose at least two temporal images, corresponding to the crop growth seasons, whereas area with three crops per year should choose at least three temporal images. Field surveys or questionnaires could also provide abandoned farmland validation samples to help improve abandoned farmland mapping accuracy, but this would require significant financial and human cost.

The authors have declared that no competing interests exist.

[1]
Alcantara C, Kuemmerle T, Baumann Met al., 2013. Mapping the extent of abandoned farmland in Central and Eastern Europe using MODIS time series satellite data.Environmental Research Letters, 8(3): 1345-1346.The demand for agricultural products continues to grow rapidly, but further agricultural expansion entails substantial environmental costs, making recultivating currently unused farmland an interesting alternative. The collapse of the Soviet Union in 1991 led to widespread abandonment of agricultural lands, but the extent and spatial patterns of abandonment are unclear. We quantified the extent of abandoned farmland, both croplands and pastures, across the region using MODIS NDVI satellite image time series from 2004 to 2006 and support vector machine classifications. Abandoned farmland was widespread, totaling 52.5 Mha, particularly in temperate European Russia (32 Mha), northern and western Ukraine, and Belarus. Differences in abandonment rates among countries were striking, suggesting that institutional and socio-economic factors were more important in determining the amount of abandonment than biophysical conditions. Indeed, much abandoned farmland occurred in areas without major constraints for agriculture. Our map provides a basis for assessing the potential of Central and Eastern Europe abandoned agricultural lands to contribute to food or bioenergy production, or carbon storage, as well as the environmental trade-offs and social constraints of recultivation.

DOI

[2]
Alcantara C, Kuemmerle T, Prishchepov A Vet al., 2012. Mapping abandoned agriculture with multi-temporal MODIS satellite data.Remote Sensing of Environment, 124(2): 334-347.78 Agricultural abandonment can be mapped across large areas from MODIS 250m. 78 Abandoned agriculture was widespread in Eastern Europe (15.1% of the total area). 78 Using multiple years of MODIS data did not increase classification accuracy. 78 Phenology metrics in conjunction with NDVI data improved classification accuracies.

DOI

[3]
Bakker M M, Govers G, Doorn A Vet al., 2008. The response of soil erosion and sediment export to land-use change in four areas of Europe: The importance of landscape pattern.Geomorphology, 98(3/4): 213-226.The response of erosion and sediment export to past land-use change has been studied in four agricultural areas of Europe. Three of these areas were subject to land abandonment or de-intensification and one to intensification of land-use practices. Erosion and sediment yield were modeled using the WaTEM/SEDEM model, which combines the RUSLE equation with a sediment routing algorithm. Spatial relationships between the RUSLE C-factor (i.e. land-use) and other erosion and sediment export-determining factors (slope, soil erodibility and distance to rivers) were investigated, as these account for non-linearity in the response of erosion and sediment export to land-use change. Erosion and sediment export have decreased enormously in the de-intensified areas, but slightly increased in the intensively cultivated area. The spatial pattern of land-use change in relation to other erosion and sediment export-determining factors appears to have a large impact on the response of soil erosion and sediment export to land-use change. That the drivers of abandonment of arable land and erosion coincide indicates that de-intensification leads to a more favourable landscape pattern with respect to reduction of erosion and sediment export. This mechanism applies not only within the study areas, but also among the European study areas where the process of intensification of some areas and de-intensification of others might result in an overall decrease of erosion and sediment yield through time.

DOI

[4]
Batllebayer L, Batjes N H, Bindraban P S, 2010. Changes in organic carbon stocks upon land use conversion in the Brazilian Cerrado: A review.Agriculture Ecosystems & Environment, 137(1): 47-58.This paper reviews current knowledge on changes in carbon stocks upon land use conversion in the Brazilian Cerrado. First, we briefly characterize the savanna ecosystem and summarize the main published data on C stocks under natural conditions. The effects of increased land use pressure in the Cerrado and current uncertainties of estimations of changes in land cover and land use are reviewed next. Thereafter, we focus on soil organic carbon (SOC) dynamics due to changes in land use, particularly conversion to pastures and soybean-based cropping systems, and effects of management practices such as soil fertilization, crop rotations and tillage practices. Most studies considered here suggest that more intensive agriculture, which include no-till practices and the implementation of best or recommended management practices (RMP), reduces SOC losses after land use conversion from conventional tillage-based, monocropping systems; however, these studies focussed on the first 0.3 m of soil, or less, and seldom considered full carbon accounting. To better estimate possible global warming mitigation with agriculture in the Cerrado more comprehensive studies are needed that analyse fluxes of the biogenic greenhouse gases (GHG; CO 2, N 2O and CH 4) to determine the net global warming potential (GWP). Follow up studies should include the application of an integrated modelling system, comprised of a Geographic Information System (GIS) linked to dynamic modelling tools, to analyse SOC dynamics and make projections for possible changes in net C flows in the Cerrado region upon defined changes in soil use and management.

DOI

[5]
Baumann M, Kuemmerle T, Elbakidze Met al., 2011. Patterns and drivers of post-socialist farmland abandonment in Western Ukraine.Land Use Policy, 28(3): 552-562.Farmland abandonment restructures rural landscapes in many regions worldwide in response to gradual industrialization and urbanization. In contrast, the political breakdown in Eastern Europe and the former Soviet Union triggered rapid and widespread farmland abandonment, but the spatial patterns of abandonment and its drivers are not well understood. Our goal was to map post-socialist farmland abandonment in Western Ukraine using Landsat images from 1986 to 2008, and to identify spatial determinants of abandonment using a combination of best-subsets linear regression models and hierarchical partitioning. Our results suggest that farmland abandonment was widespread in the study region, with abandonment rates of up to 56%. In total, 6600 km 2 (30%) of the farmland used during socialism was abandoned after 1991. Topography, soil type, and population variables were the most important predictors to explain substantial spatial variation in abandonment rates. However, many of our a priori hypotheses about the direction of variable influence were rejected. Most importantly, abandonment rates were higher in the plains and lower in marginal areas. The growing importance of subsistence farming in the transition period, as well as off-farm income and remittances likely explain these patterns. The breakdown of socialism appears to have resulted in fundamentally different abandonment patterns in the Western Ukraine, where abandonment was a result of the institutional and economic shock, compared to those in Europe's West, where abandonment resulted from long-term socio-economic transformation such as urbanization and industrialization.

DOI

[6]
Breiman L, Friedman J H, Olshen Ret al., 1984. Classification and regression trees.Biometrics, 40(3): 358.

[7]
Chen Yun, Dai Jinfang, Li Junjie, 2008. CART-based decision tree classifier using multi-feature of image and its application.Geography and Geo-Information Science, 24(2): 33-36. (in Chinese)In this paper,Baoying county is taken as an example to discuss the method of combing texture of the CBERS-02 CCD image with spectrum to improve the accuracy of extracted information of image using CART-based decision tree classifier.Firstly,principle components are extracted from the image,and textures are analyzed using Gray Level Co-occurrence Matrices and statistic index is calculated.By the rules of CART algorithm classification,selecting spectral characteristics,NDVI and textural characteristics as test variables,the node rules of decision tree are determined.The experiment proves that the CART-based decision tree classifier can get higher accuracy compared with the maximum likelihood-based supervised classification method.Especially,the CART-based decision tree classifier also gets better effect in extracting the lake enclosure cultivated areas and building areas.

DOI

[8]
Cheng W F, 2011. Study on remote sensing survey method of abandoned farmland in South China [D]. Beijing: University of Chinese Academy of Sciences. (in Chinese)

[9]
Du W W, Xing H Y, Wang L H, 2015. Investigation on the problem of abandoned farmland in Qingyun County of Shandong Province.Rural Economy and Science-Technology, 26(11): 25-27. (in Chinese)

[10]
Estel S, Kuemmerle T, Alcántara C,et al., 2015. Mapping farmland abandonment and recultivation across Europe using MODIS NDVI time series.Remote Sensing of Environment, 163: 312-325.

DOI

[11]
Hou Y K, Duan S G, Zhao S, 2004. Main Tree Species for Conversion of Cropland to Forest in China. Beijing: China Agricultural Press. (in Chinese)

[12]
Huang L M, Zhang A L, Liu C W, 2008. Research on the agriculture land abandoning and its quantitative description.Journal of Xianning University, 28(3): 113-116, 121. (in Chinese)The thing about agriculture land abandoning has happened in China about twenty years,some academicians have studied it case of some place,but them are not very entire.In this paper,we have studied the conception,styles and its quantificational characterization of agriculture land abandoning in this paper.The results show that(1) Agriculture land abandoning includes two states,one is that a agriculture land is abandoned and no one know what time it will be cultivated too,the other one is that a agriculture land is not used sufficiently.(2) Agriculture land abandoning can be differentiated some different styles.(3) The study of quantificational characterization of agriculture land abandoning provides theoretic gist for the study of the grain and economy effect of agriculture land abandoning.

[13]
Kuemmerle T, Müller D, Griffiths Pet al., 2009. Land use change in Southern Romania after the collapse of socialism.Regional Environmental Change, 9(1): 1-12.The drastic socio-economic and political changes that occurred after the breakdown of socialism in Eastern Europe triggered widespread land use change, including cropland abandonment and forest cover changes. Yet the rates and spatial patterns of post-socialist land use change remain largely unclear. We used Landsat TM/ETM+ images to classify land cover maps and assess landscape pattern changes from 1990 to 2005 in Arge艧 County, Southern Romania. Cropland abandonment was the most widespread change (21.1% abandonment rate), likely due to declining returns from farming, tenure insecurity, and demographic developments during transition. Forest cover and forest fragmentation remained remarkably stable during transition, despite widespread ownership transfers. Cropland abandonment provides opportunities for increased carbon sequestration, but threatens cultural landscapes and biodiversity. Continued monitoring is important for assessing whether abandoned croplands will eventually reforest or be put back into production and to better understand the consequences of post-socialist land use change for ecosystems and biodiversity.

DOI

[14]
Lei H, 2016. The cultivated farmland abandonment and risk assessment based on characteristics of abandoned farmland: Illustrated by the case of Shehong Tuopai Town and Three Others [D]. Chengdu: Sichuan Normal University. (in Chinese)

[15]
Li J X, Lu J F, 1994. Investigation report on abandoned farmland in Shandong Province.Management of Rural Cooperative Economy, (8): 35-36. (in Chinese)

[16]
Li S F, Li X B, 2016. Progress and prospect on farmland abandonment.Acta Geographica Sinica, 71(3): 370-389. (in Chinese)More and more farmland has been abandoned in many developed countries since the1950 s, and then the abandoned land further evolved into a global land use phenomenon, which deeply changed the landscape in vast rural areas. "Land use change-driving mechanism-impacts consequences- policy response" in global farmland abandonment were reviewed and the results indicated that:(1) Farmland abandonments mainly occurred in developed countries of Europe and North America, but the extent to which varied distinctly.(2) Socio- economic factors were the primary driving forces for the farmland abandonment. And land marginalization was the root cause of land abandonment, which was due to the drastic increase of farming opportunity cost, while the direct factor of abandonment was the decline of agricultural labor forces.(3) Whether to abandon, to what extent and its spatial distributions were finally dependent on combined effect from the physical conditions, labor characteristics,farming and regional socio- economic conditions at village, household and parcel scales.Farmland abandonment was more likely to occur in mountainous and hilly areas except for Eastern Europe due the unfavorable farming conditions.(4) Ecological and environmental effects should be the focus on the study of farmland abandonment, while which is positive or negative are still in dispute.(5) The increase of agricultural subsidies indeed will be conductive to slow down the farmland abandonment, but it is not the only and reasonable method.Due to rapid urbanization in China, there will be a high probability of abandonment expansion in the near future. However, few researches focused on this rapid land- use trend in China, leading to inadequate understandings of dynamic mechanism and consequences of this phenomenon. Thus, in the end of the paper, some directions of future research in China were presented: regional and national monitoring of abandonment dynamics, trend and risk assessment, social-economic effects assessment and informed policymaking.

DOI

[17]
Li S F, Li X B, 2017. Global understanding of farmland abandonment: A review and prospects.Journal of Geographical Sciences, 27(9): 1123-1150.Since the 1950s, noteworthy farmland abandonment has been occurring in many developed countries and some developing countries. This global land use phenomenon has fundamentally altered extensive rural landscapes. A review of global farmland abandonment under the headings of “land use change–driving mechanisms–impacts and consequences–policy responses” found the following: (1) Farmland abandonment has occurred primarily in developed countries in Europe and North America, but the extent of abandonment has varied significantly. (2) Changing socio-economic factors were the primary driving forces for the farmland abandonment. And land marginalization was the fundamental cause, which was due to the drastic increase of farming opportunity cost, while the direct factor for abandonment was the shrink of agricultural labor forces. (3) Whether to abandon, to what extent and its spatial distributions were finally dependent on integrated effect from the physical conditions, laborer attributes, farming and regional socio-economic conditions at the village, household and parcel scales. With the exception of Eastern Europe, farmland abandonment was more likely to occur in mountainous and hilly areas, due to their unfavorable farming conditions. (4) A study of farmland abandonment should focus on its ecological and environmental effects, while which is more positive or more negative are still in dispute. (5) Increasing agricultural subsidies will be conductive to slowing the rate of farmland abandonment, but this is not the only measure that needs to be implemented.Due to China’s rapid urbanization, there is a high probability that the rate of abandonment will increase in the near future. However, very little research has focused on this rapid land-use trend in China, and, as a result, there is an inadequate understanding of the dynamic mechanisms and consequences of this phenomenon. This paper concludes by suggesting some future directions for further research in China. These directions include monitoring regional and national abandonment dynamics, analyzing trends, assessing the risks and socio-economic effects of farmland abandonment, and informing policy making.

DOI

[18]
Li S F, Li X B, 2018. Economic characteristics and the mechanism of farmland marginalization in mountainous areas of China.Acta Geographica Sinica, 73(5): 803-817. (in Chinese)Farmland marginalization has become the main trend of land-use change in the mountainous areas of China. Using the China Agricultural Production Costs and Returns Compilation(annual survey data of major agricultural production costs and earnings at national and provincial levels), this paper first analyzed the changes in the cost structure of agricultural production and the farmers' responses, under the context of the rapid rise in agricultural labor prices since 2003, and further compared the responses from the mountainous and plain regions.We found that farmers on the plains have reduced their labor input effectively through intensive use of agricultural machinery, which has minimized the impact of the increase in labor price.However, it is a severe challenge for farmers in the mountainous areas to use the same method due to the rough terrains. Thus, the agricultural labor productivity in these areas has increased relatively slowly, causing a widening gap in agricultural labor productivity between the two regions. With the rapid rise in labor costs, the marginalization of cultivated land in the mountainous areas is evident. In 2013, the profit of agricultural production in mountainous China, which takes maize cultivation as a representative, has fallen below zero. Since 2000, the land-use and land cover change in these areas has been characterized by the reduction of farmland area, reforestation, and the enhancement of the NDVI value. The high correlation between the NDVI change rate and the ratio of change in farmland(r =-0.70) and forest(r =0.91) areas in mountainous areas at provincial level from 2000 to 2010, attests to the trend of farmland marginalization there. Finally, according to the analysis results, we summarized the mechanism of such marginalization against the backdrop of the rapid increase in the opportunity cost of farming and the sharp fall of agricultural labor forces. This study contributes to a deep understanding of the development process of farmland abandonment and forest transformation in the mountainous areas of China.

[19]
Li X B, Zhao Y L, 2011. Forest transition, agricultural land marginalization and ecological restoration.China Population Resources and Environment, 21(10): 91-95. (in Chinese)China ushered in the transition of its national land use morphology in the 1980s.Such a transition indicates that the space of nature represented by forest area down to a trough reversed upward,while the intensively-used space represented by cropland,from expansion to contraction.It is one of the most direct causes of the change in ecological state of the country from the overall deterioration to the overall improvement.Forest transition corresponds to the evolution stage of national economic and social development process.Its direct reason is that agriculture loses out in the competition with forestry for land resources in the ecotone between forest and cropland.The rising labor costs with industrialization and urbanization and the increasing demand for forest products with the improved living standards enhance the competitiveness of forestry to agriculture,while pre-transition ecological degradation caused by agricultural expansion triggers the implementation of the governmental policies favored forestry.Governmental policies played a key role in the early stages of China's forest transition.With the accelerated development of urbanization and aged society,China ushered in the continuously rising stage of labor wages.Slopeland cropping would tend to be "marginalized" because it is not easy in mechanization compared to the agriculture in plain area.This gives room for the further expansion of forest area or natural space.

[20]
Ma L L, 2010. Probe into the reasons of farmland abandoned in semi-arid regions based on remote sensing and the investigation of peasant household: A case study of Hollinger County in Inner Mongolia [D]. Huhhot: Inner Mongolia Normal University. (in Chinese)

[21]
Ma X, Wang X Y, Hu B, 2017. The cart automatic decision tree to multi-source remote sensing image classification based on ENVI: Taking Beijing as an example.Ningxia Engineering Technology, 16(1): 63-66. (in Chinese)

[22]
Macdonald D, Crabtree J R, Wiesinger Get al., 2000. Agricultural abandonment in mountain areas of Europe: Environmental consequences and policy response.Journal of Environmental Management, 59(1): 47-69.Agricultural abandonment reflects a post war trend in western Europe of rural depopulation to which isolated and poorer areas are most vulnerable. The commercialisation of agriculture, through technological developments, and the influence of Common Agricultural Policy have increased productivity and focused agricultural activity on more fertile and accessible land thus transforming traditional approaches to farming. In many areas this has lead to a decline in traditional labour intensive practices and marginal agricultural land is being abandoned. The problems that these trends create are particularly marked in mountain areas. The social and economic impacts of these changes have been well documented. However, the implications for environmental policy are less well recognised. This paper reviews the literature on abandonment and gives a comparative analysis of European mountain case studies to assess the environmental impacts of land abandonment and decline in traditional farming practices. It finds abandonment is widespread and that, while the influence of environmental changes is unpredictable due to environmental, agricultural and socio-economic contextual factors, abandonment generally has an undesirable effect on the environmental parameters examined. The application of agri-environment policy measures in relation to abandonment is discussed and suggestions for future policy are proposed.

DOI

[23]
Molinillo M, Lasanta T, Garcia-Ruiz J M, 1997. Research: managing mountainous degraded landscapes after farmland abandonment in the Central Spanish Pyrenees.Environmental Management, 21(4): 587-598.

DOI

[24]
Niu J Q, Lin H, Niu Y Net al., 2017. Analysis of spatial pattern and driving factors for abandoned arable lands in underdevelopment region.Transactions of the Chinese Society of Agricultural Machinery, 48(2): 141-149. (in Chinese)With rapid urbanization and industrialization,rural work forces have migrated to cities,leading to remarkable reduction in rural poulation. So large amounts of arable lands have been abandoned in China in recent years. Abandoned arable lands in under development region of China have seriously affected the redline of arable land and national food security,which has become a major practical problem facing urban-rural integration. Multispectral remote sensing has the advantage of wide range and high speed in terms of data acquisition. It has great potential in the study of lands use. A new research approach and technical roadmap were proposed for abandoned land information extraction based on remote sensing,geographic information system,support vector machines and landscape ecological index. The study area,Zilu town,Henan province,China,is a typical underdevelopment region. Four scenes Landsat-8 OLI data from 2013 to 2015 were used to extract abandoned arable land,and its spatialtemporal distribution was analyzed based on landscape metrics. Furthermore,analysis of driving factors was conducted,such as terrain,traffic,irrigation conditions and farming radius in terms of the impact of abandoned arable lands in the study area. The results showed that the accuracy of extracting abandoned arable lands using RS was above 90%. The area of abandoned arable lands was divided into seasonal and perennial abandoned,and the former was more severe. The factors of terrain,traffic,irrigation conditions and farming radius affected the spatial-temporal distribution of abandoned arable lands,and the slope of the terrain had the greatest impact. The results can provide technical support for spatial information extraction of abandoned arable land in underdevelopment region,and can be applied to establishment of regional sustainable development policy.

DOI

[25]
Qi M H, 2009. Current situation and countermeasures of farmland protection in China.Agriculture & Technology, 29(3): 1-3. (in Chinese)

[26]
Queiroz C, Beilin R, Folke C,et al., 2014. Farmland abandoned: Threat or opportunity for biodiversity conservation? A global review.Frontiers in Ecology and the Environment, 12(5): 288-296.Farmland abandonment is changing rural landscapes worldwide, but its impacts on biodiversity are still being debated in the scientific literature. While some researchers see it as a threat to biodiversity, others view it as an opportunity for habitat regeneration. We reviewed 276 published studies describing various effects of farmland abandonment on biodiversity and found that a study's geographic region, selected metrics, assessed taxa, and conservation focus significantly affected how those impacts were reported. Countries in Eurasia and the New World reported mainly negative and positive effects of farmland abandonment on biodiversity, respectively. Notably, contrasting impacts were recorded in different agricultural regions of the world that were otherwise similar in land-use and biodiversity characteristics. We showed that the conservation focus (pre- or post-abandonment) in different regions is an important factor influencing how scientists address the abandonment issue, and this may affect how land-use policies are defined in agricultural landscapes.

DOI

[27]
Shao J A, Zhang S C, Li X B, 2015. The role of rural farmland transfer in preventing farmland abandonment in the mountainous areas. Journal of Geographical Sciences, 70(4): 636-649. (in Chinese)

[28]
Shi T C, 2015. Research on farmland abandonment scale and influencing factors in Chongqing mountain area [D]. Beijing: University of Chinese Academy of Sciences. (in Chinese)

[29]
Shi T C, Xu X H, 2016. Extraction and validation of abandoned farmland parcel in typical counties of Chongqing.Transactions of the Chinese Society of Agricultural Engineering, 32(24): 261-267. (in Chinese)Farmland abandonment refers to the phenomenon of cultivated land remaining unused and idle for more than one year.Two-thirds of China's land area is hilly area and plateau area,and slope farmland area is larger.The quality of cultivated land in some provinces is not high as a whole,and there are a lot of phenomena of farmland abandonment.The farmland abandonment is distributed in many international and domestic regions,and in recent years there is a growing trend.But domestic research on farmland abandonment is more often conducted at the macro theoretical level,such as research on phenomenon,mechanisms,and countermeasures of farmland abandonment,however very few organizations or individuals have specified the scale of farmland abandonment or specific related data.Extraction of abandoned parcels is the foundation for further study on the status of farmland abandonment.This article describes the extraction process of abandoned farmland parcels in Chongqing's typical counties in detail,and selects the years of 2002 2011 as the study period; and for the regional level,through the general investigation of abandoned parcel,the article investigates the scale and distribution of abandonment.Farmland figure spots are extracted from the topographical map in 2002 and the current land use map in 2011.Then,the superposition of farmland layers in 2 periods provides a distribution map of abandoned farmlands in 2002-2011.The above step obtains information on abandoned farmlands,including abandoned farmlands that are returned to forest areas during the period of 2002-2011.The research object of this paper is abandoned farmland that was voluntarily abandoned by farmers,especially as this particular type of farmland must be removed.After eliminating the figure spots of returning farmland to forest(2002 2006) and forest projects(2008 2011),we get the distribution map of abandoned arable land.Through verifying abandoned farmland figure spots extracted from maps and Google Earth images,the correct rate of figure spot extraction of abandoned farmland reaches 85.3%.Based on the distribution map,farmland abandonment condition of Chongqing's typical counties is obtained.The study finds that farmland abandonment rates in Shizhu,Wushan and Youyang County were 14.0%,19.9% and 19.2% respectively in 2011.The total area and farmland abandonment rate of the 3 counties were 56.3 thousand hm2 and 18.0%.Dryland was the main type of abandoned farmland,which was about 82.4% of the total abandoned farmland; dryland abandonment rate was 20.4%,and paddy field abandonment rate was 11.5%.In the 3 counties,farmland abandonment rates of Wushan and Youyang County were higher than that of Shizhu County.Moreover,in the aspect of abandoned paddy field,the abandonment rates of Wushan and Youyang County were 17.2% and 13.9% respectively,also higher than Shizhu County(6.3%).The phenomenon of farmland abandonment in the study area is more serious,and the main reason is that non-farm employment income increases,causing local farmers to give up farming and to be migrant workers; at the same time,the land is barren in hill and mountain area,and the agricultural production income is low,which causes the massive farmland abandonment.Thus in essence,because the farmers' income is low,they have to give up farming.To alleviate the farmland abandonment,the government needs to protect the income level of farmers.

DOI

[30]
Smaliychuk A, Müller D, Prishchepov A Vet al., 2016. Recultivation of abandoned agricultural lands in Ukraine: Patterns and drivers.Global Environmental Change, 38: 70-81.

DOI

[31]
Vuichard N, Ciais P, Belelli Let al., 2008. Carbon sequestration due to the abandoned of agriculture in the former USSR since 1990.Global Biogeochemical Cycles, 22(4): 1417-1430.

[32]
Yusoff N M, Muharam F M, Khairunniza-Bejo S, 2017. Towards the use of remote-sensing data for monitoring of abandoned oil palm lands in Malaysia: A semi-automatic approach.International Journal of Remote Sensing, 38(2): 432-449.Oil palm is a commercial crop that is important for its food value and as a biofuel, along with its other benefits towards the economy and human health. Currently, Malaysia cultivates approximately 5.64 million ha of oil palm. To date, a study identifying abandoned oil palm areas using satellite images is almost non-existent. Conventionally, the monitoring of abandoned oil palm lands is tedious and time consuming, especially over large areas. Hence, in this article, the capability of high resolution satellite image via Satellite Pour I090005Observation de la Terre-6 (SPOT-6) products to extract abandoned oil palm areas was explored, as was the use of multi-temporal Landsat Operational Land Imager (OLI) imagery to develop the phenology of abandoned oil palm sites. Homogeneity measures derived through SPOT images played a more important role to identify abandoned oil palm than crop phenology characteristics extracted from high spectral resolution of Landsat images. With the advancement of object-oriented classification, monitoring of abandoned oil palm areas can be done semi-automatically with an accuracy of 9200±1%.

DOI

[33]
Zhang Y, Li X, Song W, 2014. Determinants of cropland abandoned at the parcel, household and village levels in mountain areas of China: A multi-level analysis.Land Use Policy, 41(4): 186-192.Cropland abandonment accompanying economic development has been observed worldwide. China has experienced a large amount of land abandonment in recent years. However, the reasons for it are not entirely clear. Although abandonment decisions are made by individual households, the underlying conditions reflect processes operating at multiple levels. Therefore, we aimed to detect the influences on land abandonment at the parcel, household and village levels. We developed and employed a multi-level statistical model using farm household survey data and geographical maps of Wulong County. Our model revealed that of the variance in occurrence of land parcel abandonment, 7% and 13% can be explained at the household and village levels, respectively, while the remnant 80% can be explained at the land parcel features itself. We found that land abandonment is more prone to occur on parcels that are on steep slopes, have poor quality soil, or are remote from the laborers residences. Households with less agricultural labor per unit land area showed a high probability of land abandonment. We also found a nonlinear influence of labor age on land abandonment, with households comprising middle-aged laborers having a low land abandonment probability. Parcels in villages with high elevation, far from the county administrative center or with low prevalence of leased land are inclined to abandonment. We also found, surprisingly, that the household proportion of males among its agricultural laborers did not significantly influence the occurrence of land abandonment at the parcel level, probably due to the male agricultural laborers being overwhelmingly old (average age greater than 56 years). To alleviate land abandonment, we suggest improving land tenure and transfer security to ensure stable access to the land rental market, and also improving infrastructure in remote regions.

DOI

[34]
Zhao P, Fu Y F, Zheng L G,et al., 2005. CART based land use/cover classification of remote sensing images.Journal of Remote Sensing, 9(6): 708-716.Nowadays,investigations on land use / land cover change detections constitute a main objective for the global research.As a part of rapid development in technology,remote sensing has become an important tool to acquire the information of the land use/cover.Therefore,how best the extraction of timely and accurate information from these remotely sensed images is an impending problem.Recently,the knowledge-based interpretation of these images has become an effective and efficient approach to realize the automatic interpretation,which can integrate the spectral and other associated information based on experts' knowledge and experience to improve the accuracy.However,it is a bottleneck problem to obtain the knowledge for its wide application.A case study on the land use/cover classification of Jiangning study area in Jiangsu Province is discussed in the present article.At first,the data are preprocessed,then the relevant sixteen variables including geographical coordinate,grey value of four bands,textural statistics,DEM,slope and aspect are selected and extracted.The defined training sample areas are picked up by stratified random sampling techniques based on geographical coordinates.Thirdly,classification rules are discovered from these samples through Classification and Regression Tree(CART) Analysis,which integrates spectral,textural and the spatial distribution characters.Fourthly,the interpretation was performed by a judgment based on these rules.Finally,the traditional supervised as well as logic channel classifications are also performed to check the classification accuracies.The results have suggested that the accuracy of classification based on the CART is higher than others',which can obtain a lot of reasonable rules most quickly and effectively.So,it was felt that it is a good way to promote the wide application of knowledge-based interpretation of remote sensing images.

Outlines

/