Research Articles

Spatial relationship of high-speed transportation construction and land-use efficiency and its mechanism: Case study of Shandong Peninsula urban agglomeration

  • CUI Xuegang , 1, 2 ,
  • FANG Chuanglin , 1, * ,
  • WANG Zhenbo 1 ,
  • BAO Chao 1
Expand
  • 1. Institute of Geographic Sciences and Natural Resources Research, CAS, Beijing 100101, China
  • 2. University of Chinese Academy of Sciences, Beijing 100049, China
*Corresponding author: Fang Chuanglin (1966-), PhD and Professor, E-mail:

Author: Cui Xuegang (1990-), PhD, specialized in urban geography and regional planning. E-mail:

Received date: 2018-09-19

  Accepted date: 2018-11-15

  Online published: 2019-04-12

Supported by

Major Program of National Natural Science Foundation of China, No.41590840, No.41590842

Copyright

Journal of Geographical Sciences, All Rights Reserved

Abstract

Land-use efficiency is low for the urban agglomeration of China. High-speed transportation construction has been an important factor driving land use change. It is critically important to explore the spatial relationship between the high-speed transportation superiority degree and land-use efficiency. We built a model to evaluate the benefits of convenient high-speed transportation using the relative density of highways and the distance from high-speed rail stations and airports as a metric. We used 42 counties of the Shandong Peninsula urban agglomeration as an example. Land-use efficiency was calculated by a DEA model with capital, labor, economic benefits and environmental benefits as input and output factors. We examined the spatial relationships between high-speed transport superiority degree and land-use efficiency and obtained the following results. First, there are significant spatial differences in the relationships between the high-speed transportation superiority degree and land-use efficiency. Taking the two major cities of Jinan and Qingdao as the hubs, the core surrounding counties show significant spatial relationship between land-use efficiency and the high-speed transportation superiority degree. Spatial correlation declines as the distance from the hubs increases. Land-use efficiency is less than high-speed transportation convenience in areas along the transportation trunks that are distant from the hub cities. Correlation is low in areas that are away from both hub cities and transportation trunk routes. Second, high-speed transportation has a positive relationship with land-use efficiency due to the mechanism of element agglomeration exogenous growth. Third, high-speed transportation facilitates the flow of goods, services and technologies between core cities and peripheral cities as space spillover (the hub effect). This alters the spatial pattern of regional land-use efficiency. Finally, the short-board effect caused by decreased high-speed transport construction can be balanced by highway construction and the proper node layouts of high-speed rail stations and airports, resulting in a well-balanced spatial pattern of land-use efficiency.

Cite this article

CUI Xuegang , FANG Chuanglin , WANG Zhenbo , BAO Chao . Spatial relationship of high-speed transportation construction and land-use efficiency and its mechanism: Case study of Shandong Peninsula urban agglomeration[J]. Journal of Geographical Sciences, 2019 , 29(4) : 549 -562 . DOI: 10.1007/s11442-019-1614-1

1 Introduction

During China’s rapid urbanization, many serious urban land use problems arose, such as the unconstrained scale of development, uncontrolled land use, imbalanced structural distribution, and environmental degradation (Liu et al., 2008; Wu et al., 2018). For example, the average annual increase in China’s urban construction land use was 1.09% between 2005 and 2014. In comparison with this sustained urban construction, the value-added growth of China’s secondary and tertiary industries decreased annually by 0.4% on average over the same period. Thus, in the last 10 years, China’s large-scale land development and construction have not increased income; on the contrary, they have wasted or even destroyed valuable land resources (Xu et al., 2009; Du, 2016). These conditions show a need not only to manage total land use but also to improve land use quality. We should focus on intensive land use and input-output analysis.
Land-use efficiency is a typical measure of the intensity of land use and is used to evaluate inputs and outputs (Chen et al., 2016). The Western ecological approach primarily involves land-use efficiency, and it includes descriptions and inference of land use. The approach examines urban land use with four types of models: transect models, concentric models, sector models, and multiple nuclei (core) models (Johnson, 1960; Chapin and Kaiser, 1967; Liu et al., 2001). In contrast, domestic Chinese scholars have studied basic urban land-use efficiency and have developed different practical methods of evaluation, such as principal component analysis (Li et al., 2005), regression analysis (Liu et al., 2005), synergy (Ou et al., 2007), fuzzy comprehensive assessment (Jia and Hao, 2011), data envelopment analysis (Wu et al., 2011), the analytic hierarchy process (Guan and Chen, 2013), and the SBM-Undesirable model (Yang et al., 2014). In these studies, the impacts of economic development, policy, industry, and consumption patterns on urban land use are identified (Peneder, 2003; Lambin and Geist, 2003; Defries et al., 2004; Akkemik, 2005).
Transportation is an important driving factor in land use change (Wang et al., 2015; Ma et al., 2018). It affects the form of urban space (Wang et al., 2008), land use structure (Cervero and Kang, 2011), and land prices (Gu and Zheng, 2010; Debrezion et al., 2011). The relationship between transportation and land use can be explained by a combination of models (Guo et al., 2015). Most research focuses on the relationship between land use and transportation systems within a single city. There are few studies of regionally integrated transportation systems and overall land use patterns. In recent years, China’s urban agglomerations have been extensively developed, and their input-output efficiency is low (Fang and Guan, 2011; Wang et al., 2014). The introduction of high-speed rail and other high-speed transportation modes makes it important to study their influence on land-use efficiency. To investigate these issues and identify the relationship between high-speed transportation and land-use efficiency, we use the Shandong Peninsula urban agglomeration as a case study and develop a method to evaluate the degree of superiority for a system of high-speed transportation.

2 Study area and data

2.1 Study area

The study area is the Shandong Peninsula urban agglomeration on the eastern coast of China. It includes Jinan, Qingdao, Zibo, Dongying, Yantai, Weifang, Weihai, Rizhao, and Zouping. The rapidly-developing transportation system has created a high-speed network of highways, high-speed railways and air transport which has given the urban agglomeration a significant competitive advantage. In 2014, there were 2782 km of highway in the Shandong Peninsula with a highway density of 0.037 km/km2, which is 3.1 times the national level. There are three major high-speed rail lines (the Jing-Hu line Shandong section, the Jiao-Ji line and the Qing-Yan-Wei-Rong line), six transport airports (Jinan, Qingdao, Dongying (Kenli), Yantai, Weifang and Weihai) and four general aviation airports (Xueye, Penglai, Dagao and Pingyin). The two major transportation centers of Jinan and Qingdao have become interregional high-speed transportation hubs.

2.2 Data

The study period was 2014, and the basic unit of evaluation is the county. The islands around the peninsula have no high-speed transport facilities, so the 42 land-based county-level units (counties, county-level municipalities or municipal districts) are the units of evaluation. Highway distance data for 2014 were provided by the Shandong Provincial Communications Planning and Design Institute. Six civil transportation airports (Jinan, Qingdao, Dongying, Yantai, Weifang and Weihai) and 16 high-speed rail stations (one representative station was selected for each county: Jinan West, Qingdao, Jiaozhou North, Jimo North, Laixi North, Zibo, Yantai South, Laiyang, Haiyang North, Weifang, Qingzhou, Gaomi, Changle, Weihai and Rongcheng) were selected. High-speed rail stations were selected according to the following principles: official stations have precedence over informal stations; informal stations are selected by frequency of use; and stations are selected randomly. For convenience and simplicity, the town-level stations along the Qing-Yan-Wei-Rong line are not included in the samples. Most of the stations identified only link with other stations along the line and lack interregional connections. Being close to an intercity connection is less distanct than to interregional connection, so the overall external strength of intercity nodes is inadequate. Land input and output data were obtained from the Shandong Province Urbanization Development Report (2015) and Shandong Statistical Yearbook (2015).

3 Methods

3.1 Evaluation of high-speed transportation superiority degree

The transportation superiority degree, which is a comprehensive index for regional transportation support, contact, agglomeration, and locational advantage, was first proposed by Jin et al. (2008). Taking a large-scale regional system, including the area to be evaluated, as the network object, transportation level and grade are quantified by analysis and comparison. To obtain the relative advantage of a single transportation mode, the high-speed transportation superiority degree is used to enumerate the advantages of regional high-speed transportation. The evaluation of high-speed transportation superiority uses a quantitative comparison model to evaluate the regional high-speed transportation level and grade, which includes the high-speed transportation network, density, and axial radiation. Then, transportation superiority is determined as follows (Jin et al., 2008; Wang et al., 2010; Meng et al., 2014).
(1) Calculate the density of the transportation network. If Ai is the administrative area and Li is the length of the transportation links or the number of nodes, transportation network density, then Di=Li/Ai.
(2) Evaluate the impact of transportation links and nodes (hubs) on the area. First, determine if there are transportation links and nodes (facilities) in the area. If there are not, then calculate the distance between the area and the closest transportation links and nodes. Then determine the impact value according to transportation type and distance.
(3) Evaluate regional superiority. Rank the distances between each area and the central city of the region, and then assign a value to each ranked item.
This framework allows the development of a simple and practical evaluation of high-speed transportation superiority. High-speed transportation has three major subsystems, i.e., highways, high-speed rail, and air transport. The superiority of each subsystem can be adjusted as follows.
(1) As highways have multiple entrances and are continuous and narrow, calculate their superiority by the highway network density (i.e., the ratio of highway distance to area).
(2) The station is the main point of impact of high-speed rail, so calculate its superiority at any point by observing its distance from the station, choosing 30 km and 60 km as base distance units (Jin et al., 2008).
(3) The superiority index for air transport superiority is similar to that of high-speed rail, but in order to highlight the difference, airports are divided into two important airports, Jinan and Qingdao, and four ordinary airports, Dongying, Yantai, Weifang and Weihai.
Each subsystem is given a weight of 1/3, and high-speed transport superiority is equal to the sum of the products of the score and the weight. Weight apportionments are given in Table 1.
Table 1 Evaluation of high-speed transportation superiority degree
Evaluation system Evaluation subsystem Score
High-speed transport superiority degree Highway superiority degree • The ratio of regional highway density to that of urban agglomeration
High-speed railway superiority degree • Has high-speed rail station (score 2)
• Within 30 km from the high-speed rail station (score 1.5)
• 30-60 km away from high-speed rail station (score 1)
Air transport superiority degree • Has important airport (score 2)
• Has ordinary airport (score 1.5)
• Within 50 km of the important airport (score 1) or ordinary airport (score 0.5)

3.2 Data envelopment analysis

3.2.1 Introduction
Data envelopment analysis (DEA) is a nonparametric linear programming method (Charnes et al., 1978; Banker et al., 1989). DEA uses relative efficiency to evaluate multiple inputs and outputs for decision-making units, and it avoids the subjectivity and computational overhead of parameter estimation (Li and Chen, 2003). There are five major DEA models: CCR, BCC, CCGSS, CCW and CCWH. As a measurement method in terms of constant return to scale, CCR is suitable for the evaluation of indicator validity and contribution rate, so it is an effective tool to evaluate land-use efficiency (Yu, 2002). An assumption of DEA is that the study object includes n decision-making units (DMUs), denoted by j (j = 1, 2, …, n). The variables for each DMU are denoted by xj (input) and yj (output); θ is the relative efficiency of each DMU; and λj is the coefficient of each linear combination of inputs and outputs. The formula for CCR is:
$\left\{ \begin{align} & Min\theta \\ & \text{s}\text{.t}\text{.}-\sum\limits_{j\in n}{\lambda jxj+\theta x0\ge 0} \\ & \sum\limits_{j\in n}{\lambda jyj\ge y0} \\ & \lambda j\ge 0j\in n \\ \end{align} \right.$ (1)
As aforementioned, CCR operates with constant returns to scale, and θ represents a comprehensive efficiency consisting of technical and scale efficiencies. If ∑λj = 1, the CCR model becomes a BCC model, and θ represents only technical efficiency.
3.2.2 Index
Land use efficiency assessment involves the economy, society, and environment (Wu et al., 2011; Yang et al., 2015). Because land use characteristics are for county-level units, we define land (built-up area, km2), capital (total investment in fixed assets, yuan×1,000,000), and labor (secondary and tertiary industry employees, persons×1,000,000) as inputs. We take only economic and environmental benefits as the outputs because social benefits and technological progress are difficult to quantify. Economic benefits correspond to secondary and tertiary industry added value (billion yuan) and government revenue (million yuan), and environmental benefits correspond to the green coverage proportion of the built-up area (ha).

4 Results and analysis

4.1 High-speed transportation superiority degree

The high-speed transportation superiority index values of the 42 evaluation units are classified as follows, based on Jenks Natural Breaks Classification.
(1) Type I (1.448-2.058) includes 14.2% of the units. Type I units are mainly distributed in the eastern coastal nodes, the peninsula and inland channel junctions, and inland core areas, and mostly belong to an integrated hub and its adjacent areas.
(2) Type II (1.091-1.447) includes 19% of the units. Type II units are mainly distributed on the periphery of type I units, and show circular or scatter distributions. The type II high-speed transport combination has fewer advantages than the hub and spoke configuration of type I.
(3) Type III (0.726-1.090) includes 35.7% of the units. Type III units are mainly distributed on the peripheries of type I and type II units. They are grouped along the Jiao-Ji and Qing- Yan-Wei-Rong rail lines, and have a circle + axis layout. High-speed transportation in type III units is less influenced than type II units by the hub and spoke arrangement of type I units.
(4) Type IV (0.343-0.725) includes 23.8% of the units. Type IV units are mainly distributed in the north and south, where they are far away from the transportation trunk routes. The effect of the hubs is weak. High-speed transportation in type IV is simple as only highways are built.
(5) Type V (0-0.342) includes only Dongying, Juxian and Wulian. Of the three, only Dongying has high-speed transportation links. Because they are far away from the hubs, type V units are difficult to include in an effective high-speed transportation network.
The type I, type II and type III units show an axis + radial spatial pattern along the Jiao-Ji and Qing-Yan-Wei-Rong lines, with Qingdao as the hub. Jinan (2.058), Weifang (1.564), Qingdao (2.038) and Yantai (1.721) are important nodes (Figure 1). Transportation routes in these areas were developed in ancient times, and the construction of highways (e.g., Ji-Qing), high-speed railways (e.g., Jing-Hu) and airports (e.g., Jinan and Qingdao) has maintained the advantage of this corridor. The status of these areas will not change in the future as more highways, high-speed railways (e.g., Ji-Qing line) and airports (e.g., Qingdao-Jiaodong and Penglai) are constructed.
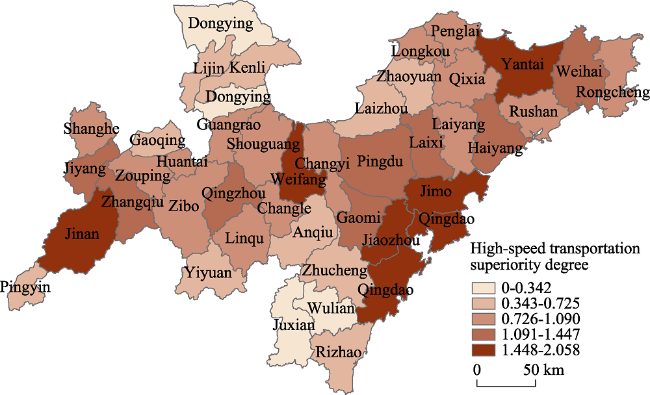
Figure 1 Spatial pattern of high-speed transportation superiority in Shandong Peninsula urban agglomeration in 2014
A layered structure has been formed, consisting of primary (e.g., Jinan and Qingdao) and secondary groupings (e.g., Yantai-Weihai and Weifang-Qingzhou). High-speed transportation facilities radiate spatially (e.g., the airports and high-speed railway stations in Jinan and Qingdao) and affect neighboring areas. High-speed transportation superiority increases quickly in such areas, and a circular pattern, with significant spatial correlation, is seen around high-speed transportation facilities. Highways and high-speed railways are spatially continuous and are adjacent to many areas. Thus they usually constitute a complex transportation network and the high-speed transportation superiority index of the areas around high-speed transportation facilities is high because of their well-developed transportation facilities. On the whole, the above reasons led directly to the circular structure of the high-speed transportation superiority degree around hubs and nearby areas.
The superiority degree of the coastal areas (Qingdao, Yantai and Weihai) is higher than the inland areas (Jinan, Zibo, Weifang and Zouping) and is also higher than the northern (Dongying) and southern regions (Rizhao). The coastal areas have the advantage in the number of airports (3), high-speed rail land coverage (56.3%) and highway density (0.045 km/km2), whereas the inland areas have a slightly lower superiority (2 airports, 36.8% high-speed rail land coverage, and 0.035 km/km2 highway density). The lowest superiority values are found for Dongying, Rizhao and southern Weifang, as well as western Yantai, where there is only one airport (Dongying airport), no high-speed railway stations have been built, in some areas the density of expressways is only 0.024 km/km2, and some areas (e.g., Juxian, Wulian and Anqiu) do not have expressways.
There is a significant positive correlation between the number of modes of high-speed transportation and superiority. We divided high-speed transportation modes into three main types (comprehensive mode: highway, high-speed railway and air transportation; portfolio mode: highway + high-speed railway; and single mode: highway) and we found that comprehensive mode (mean superiority 1.748) > portfolio mode (mean superiority 1.211) > single mode (mean superiority 0.789). In addition, the correlation between superiority and high speed railway (0.793) > the correlation between superiority and air transportation (0.779) > the correlation between superiority and highway (0.700), which is due to a relatively balanced distribution of the highway across units and the highly unequal distribution of high-speed rail and air transport across units, giving the latter two modes a larger influence on superiority.

4.2 Land-use efficiency

The land-use efficiencies of the 42 county-level units are divided into five types, based on Jenks Natural Breaks Classification and DEA, as follows.
(1) Type I (0.971-1.000) includes 33.3% of the evaluation units. Type I units generally reach optimal efficiency, and are concentrated in coastal areas of Jiaodong and inland areas with Jinan-Zibo as the core, including two central cities of Jinan and Qingdao. Most type I areas have a developed economy and a good industrial foundation or a well-developed high-tech industry.
(2) Type II (0.907-0.970) includes 28.6% of the evaluation units. Type II units are mostly concentrated on the periphery of type I units. They have different levels of economic development, due to some extent to the spatial spillover effect of land-use efficiency.
(3) Type III (0.859-0.906) includes 14.3% of the evaluation units. Type III units are mainly concentrated in the peripheries of type I and type II units, and their land-use efficiency lags behind the level of economic development in those units.
(4) Type IV (0.800-0.858) includes 14.3% of the evaluation units. Type IV units have low land-use efficiency and the less developed economy shows a scattered point distribution.
(5) Type V (0.746-0.799) includes 9.5% of the evaluation units. Type V units are located at the edge of urban agglomeration, and have low land-use efficiency and a low level of economic development.
High land-use efficiency units formed a few large groups with Jinan-Zibo, Qingdao and Weihai as cores (Figure 2). Land-use efficiency in the peripheral zones shows a decreasing gradient, while areas of low land-use efficiency show a scattered point distribution. Regional spatial spillover and linkage effects are especially significant in the Jinan-Zibo locus. The advantages of the core cities of Jinan and Zibo, such as in the technology industry, affect and effectively spread to adjacent areas, resulting in 7 units in the region achieving optimal land utilization efficiency of 1.000, which accounts for 53.8% of the total land use efficiency. The spatial spillover effect of coastal node cities is relatively low, and the spatial scales of Qingdao and Weihai are relatively large, resulting in relatively low land-use efficiency. The units having low land-use efficiency are mostly located on the boundaries and outer edges of high land-use efficiency groups. The spillover effects are significantly weaker than they could be and combinations of investment factors in these areas need to be optimized. Overall, land-use efficiency is high in Shandong Peninsula urban agglomeration. Type I and type II units accounted for 61.9% of the total area, whereas type IV and type V units accounted for 23.8% of the total area. The lowest land-use efficiency is 0.764.
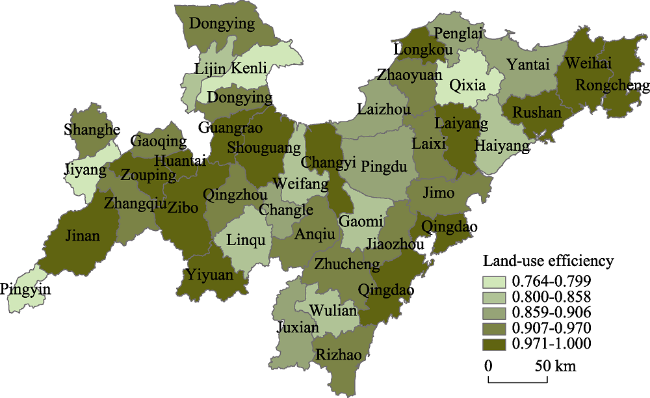
Figure 2 Spatial pattern of land-use efficiency in Shandong Peninsula urban agglomeration in 2014
The land-use efficiency of coastal areas (0.936) > that of inland areas (0.925) > that of northern areas (0.902) > that of southern areas (0.893). Land-use efficiency in coastal areas is high, but low in central inland areas. However, inland areas have land-use efficiency that is high in the core and low in the surrounding areas. The input factors in the coastal area of Jiaodong are more balanced than in inland units. The central belt of the Jiaodong coastal area and the marginal zones of inland units need to be optimized by adjusting input proportions. However, there is little incentive to optimize the inputs in Dongying due to abundant land resources and low population pressure. The spatial spillover effect of high land-use efficiency units is weak due to the relatively closed geographical boundaries. As a result, the land-use efficiency of the northern units is low, and only the urban areas reach type II. In contrast, the land-use efficiency of southern areas is low due to the low level of economic activity, unbalanced inputs and closed geographical boundaries.
There are 24 units (57%) that are increasing in income, mostly in the inland areas (13), followed by the coastal zones (7). Factor inputs are insufficient to match outputs. There are 13 units (31%) in which there is no change, 6 in each of the inland and coastal areas, and the input factors achieve maximum output. There are 5 units (11.9%) that are decreasing in income with redundant input factors (Table 2). In general, it is necessary to increase the inputs of factors in inland and coastal areas, and reduce the inputs of redundant factors in decreasing areas, to move land-use efficiency towards the optimum.
Table 2 Land scale income in Shandong Peninsula urban agglomeration in 2014
Scale income Areas
Increasing Zhangqiu, Pingyin, Jiyang, Shanghe, Pingdu, Laixi, Gaoqing, Yiyuan, Kenli, Lijin, Laizhou, Penglai, Zhaoyuan, Qixia, Haiyang, Weifang, Qingzhou, Zhucheng, Anqiu, Gaomi, Linqu, Changle, Wulian, Juxian
Balanced Jinan, Qingdao, Zibo, Huantai, Guangrao, Longkou, Laiyang, Shouguang, Changyi, Weihai, Rongcheng, Rushan, Zouping
Decreasing Jiaozhou, Jimo, Dongying, Yantai, Rizhao

4.3 Spatial relationship between high-speed transportation superiority degree and land-use efficiency

We used a scatter diagram (Figure 3) to study the spatial relationship of high-speed transportation superiority to land-use efficiency. We combined land-use efficiency types with high-speed transportation types and classified the type combinations as follows: H-H (high land-use efficiency and high high-speed transportation superiority) includes types I-I, I-II, II-I and II-II; H-L (high land-use efficiency and low high-speed transportation superiority) includes types I-IV, II-IV and II-V; L-H (low land-use efficiency-high high-speed transportation superiority) includes types IV-I, IV-II and V-II; and L-L (low land-use efficiency and low high-speed transportation superiority) includes types IV-IV, IV-V and V-IV. All other type combinations are classified as M-M (medium land-use efficiency and medium high-speed transportation superiority). We refer to these five classes as land-use-transportation coordination categories.
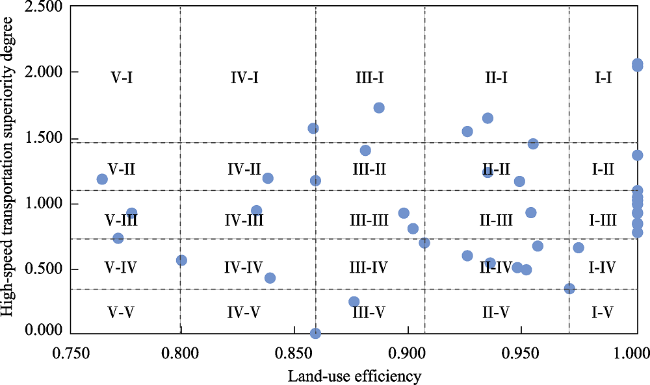
Figure 3 Combinations of types of land-use efficiency and high-speed transportation superiority degree in Shandong Peninsula urban agglomeration
We analysed land use-transportation coordination. Figure 4 shows that:
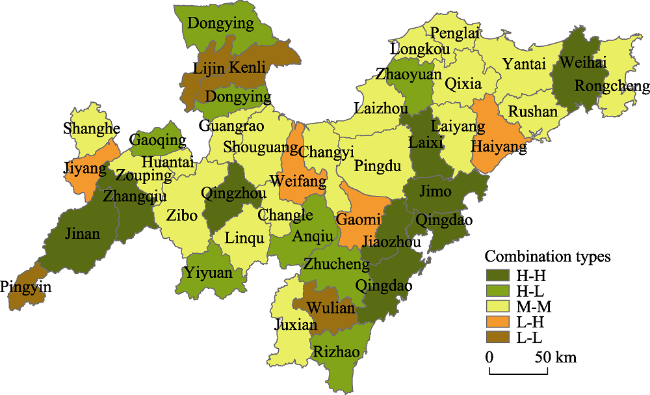
Figure 4 Spatial pattern of combined types of land-use efficiency and high-speed transportation superiority degree in Shandong Peninsula urban agglomeration
(1) 8 areas are H-H, 19% of the total. Most of them are regional centers and transportation hub cities (such as Jinan, Qingdao and Weihai) or regions peripheral to an important hub along a transportation link (such as Qingzhou, Jimo and Jiaozhou) which generally show a hub-spoke distribution along the Jiao-Ji and Qing-Yan-Wei-Rong rail lines.
(2) 7 areas are H-L, 16.7% of the total. Most of them are in the outer perimeter of hub cities and deviate from the main transportation arteries, and are affected by spatial spillover effects from the central city.
(3) 4 areas are L-H, 9.5% of the total. They are located mainly in the interstitial zones between the hub cities. Although they are along the main transportation links, they are weakly developed economically, and any spillover effects from the central city are weaker than for surrounding areas.
(4) 4 areas are L-L, 9.5% of the total. They are far away from the hub cities and the main transportation links, and land-use efficiency and high-speed transportation construction lag behind all other areas.
(5) 19 areas are M-M, 45.2% of the total. They are the largest and the widest range of types. In these areas, land-use efficiency of areas adjacent to hub cities is often high because of the construction of high-speed transportation infrastructure, but it is low for areas far away from the hub cities.
There are spatial differences between areas of equivalent land use-transportation coordination. If we take the two hub cities of Jinan and Qingdao as the core, land use-transportation coordination is correspondingly high in Jinan, Qingdao, Weihai and Qingzhou, which are located in the hub-hub network and are in the area containing the main transportation link. As the distance from the hub city increases, the degree of spatial coordination declines. Land-use efficiency in these units often lags behind the high-speed transportation superiority degree, as can be seen in Weifang and Haiyang, which are far away from both the core hub cities. Land use-transportation coordination is L-L in Lijin, Kenli, and Wulian, which are widely dispersed and underdeveloped regions far away from hub cities and transportation links.
The preceding analysis shows there is a significant positive correlation between high-speed transportation modes and superiority index. Further analysis of the relationship between high-speed transportation modes and land-use efficiency showed that they closely related. We created different combinations of different modes of high-speed transportation and found that there is a positive relationship between land-use efficiency and the number of high-speed transportation modes (Table 3). This is because the key factor affecting land-use efficiency is the allocation of resources. In the dynamic process we have described, high-speed transportation can positively promote resource exchange through factor agglomeration and endogenous growth mechanisms. High-speed transportation can significantly increase regional advantages, and promote aggregation at points along high-speed transportation routes or trunks to form regional growth poles. The formation of these polar cores optimizes the development of land resources. The increase in modes of high-speed transportation diversifies the allocations, so land-use efficiency becomes more optimal. Land-use efficiency of the highway + high-speed rail + air transport combination is the highest, and 60% of the sample areas have the optimal value (1.000).
Table 3 Average land-use efficiency in areas with different combinations of high-speed transportation modes in Shandong Peninsula urban agglomeration
High speed transportation
combination types
Species Number of
sample areas
Average land-use
efficiency
Highway + High Speed Rail + Air Transportation 3 5 0.949
Highway + High Speed Rail 2 10 0.929
Highway + Air Transportation 2 1 0.799
Highway 1 23 0.921
High Speed Rail 1 1 1.000
None 0 2 0.907
High-speed transportation can also promote the exchange of resources between core cities and general cities through the hub effect. Core cities release excess resources to neighboring cities via high-speed transportation, and acquire their required resources through polarization effects. Non-core cities exchange resources with neighboring cities via high-speed transportation to mutual advantage. Goods and technological advantages are a form of spatial spillover from high-speed transportation, and spatial spillover will alter the spatial pattern of regional land-use efficiency (Figure 5). Land-use efficiency in transportation and economically less developed regions around Qingdao is relatively high, because of the concentration of resources due to the hub effect, which explains the H-L areas clustered on the periphery of the hub cities. Although Weifang and Yantai are types of highway + high-speed rail + air transportation, they have inadequate or redundant inputs. They are also distant from key cities such as Jinan and Qingdao. The corridor effect of the hub cities on these two cities has been weakened, resulting in lower land-use efficiency in these two areas than in the outlying areas of Jinan and Qingdao.
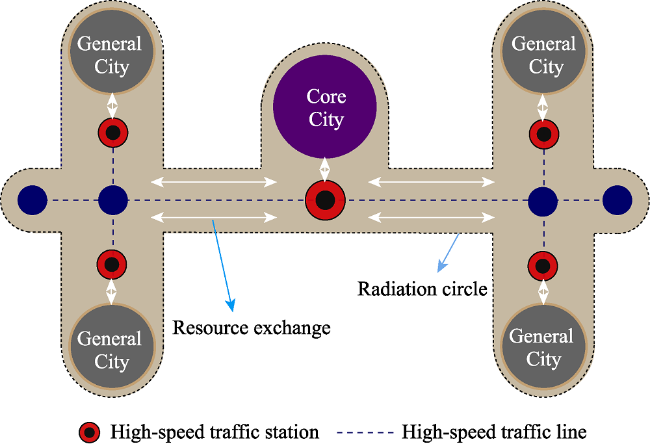
Figure 5 The influence of high-speed transportation on resource allocation
Shandong Peninsula urban agglomeration is mainly free from the constraints of the short-board effect caused by shortage of high-speed transportation facilities because the shortage is balanced by highway construction. This balance is seen at a macro level by high land-use efficiency. At the time of writing, the high-speed transportation network of the Shandong Peninsula has taken its initial shape, and it serves 95.2% of the region. The air transportation coverage rate was 14.3%, the high-speed rail coverage rate was 38.1%, and the highway coverage rate was 92.9%. These values show that the construction of highways is decisive in a high coverage rate for high-speed transportation networks. When we examine current land-use patterns in the Shandong Peninsula urban agglomeration, we see from the relative values that there are regional differences in land-use efficiency. The absolute values show that overall land-use efficiency is high level as the average value reaches 0.925. The difference between the maximum (1.000) and minimum (0.764) values is only 0.236, and 90.5% of the land-use efficiency is ≥0.800. In comparison with the relative spatial variability of high-speed transportation superiority degree and land-use efficiency, the absolute spatial difference between the two is not significant, and it shows there is coordination between the two at the macro level.
In summary, by balancing reduced high-speed transportation construction with increased highway construction, the Shandong Peninsula urban agglomeration can avoid the short-board effect. Proper node layouts of high-speed rail stations and airports, will ensure that land-use efficiency is spatially well-balanced.

5 Conclusions and recommendations

With the aid of GIS, we created an evaluative high-speed transportation superiority degree system, and used the DEA model to examine the influence of high-speed transportation on land-use efficiency from different perspectives, taking the 42 counties of the Shandong Peninsula urban agglomeration as an example. The main conclusions are:
(1) There is significant spatial variation in the relationship between high-speed transportation superiority degree and land-use efficiency. Taking the two major hub cities of Jinan and Qingdao as the core, the surrounding counties (including the Qingzhou and Weihai sub-hubs) show significant high land use-transportation coordination which decreases as the distance from the hub cities increases. Land-use efficiency usually lags behind high-speed transportation superiority degree in areas along the transportation trunk routes, which are also distant from the hub cities. Land use-transportation coordination is low in areas that are distant from hub cities and transportation trunk routes.
(2) The number of high-speed transportation modes is positively related to land-use efficiency due to input and output consolidation and endogenous growth.
(3) High-speed transportation facilitates flows of goods, services and technologies between core cities and peripheral cities as space spillover (the hub effect). This alters the spatial pattern of regional land-use efficiency.
(4) The Shandong Peninsula urban agglomeration can eliminate the short-board effect caused by reducing high-speed transportation construction by balancing it with expressway (highway) construction. A proper node layout for high-speed rail stations and airports will increase land-use efficiency and provide a well-balanced spatial pattern.
There are significant inconsistencies between high-speed transportation construction and land-use efficiency in some areas. We make four recommendations to reduce them and thus improve coordination between high-speed transportation and land-use efficiency:
(1) We must improve the coverage of high-speed transportation, achieve full county-level coverage of highways, and complete prefecture-level coverage of high-speed rail stations and airports. We must also speed up the construction of the high-speed rail links in the Bohai Rim (Shandong section) and the Jinan-Qingdao section, and strive for the early completion of major airports such as Zibo and Rizhao (which have been opened by the end of 2015). If these are done then we will achieve a better balance of high-speed transportation in the Shandong Peninsula and efficient land use.
(2) We must accelerate the construction of high-speed transportation in underserved areas, such as Dongying and Rizhao, to achieve transport integration with hub cities and other important trunk routes and to increase the advantageous spillover of outside resources.
(3) We must optimize the high-speed transportation network along the coast of Jiaodong to increase accessibility to external transportation modes, to facilitate the movement of goods and services, and to create more convenient and smoother communication with the hinterland.
(4) Most importantly, we should recognize the importance of the positive effects of high-speed transportation construction. By coordinating land-use efficiency and high-speed transportation, we will simultaneously expand both to provide the greatest benefits.

The authors have declared that no competing interests exist.

[1]
Akkemik K A, 2005. Labor productivity and inter-sectoral reallocation of labor in Singapore (1965-2002).Ge Growth Math Methods, 30: 1-22.

[2]
Banker R D, Charnes A, Cooper W W,et al., 1989. Constrained game formulations and interpretations for data envelopment analysis.European Journal of Operational Research, 40: 299-308.In a recent paper we presented a test, based on pairwise preference information, to identify to which class of functions (linear, quasi-concave, or neither) a decision-maker's (implicit) value function belongs. In this note we investigate the power of the test. Some improvements to the test are also suggested.

DOI

[3]
Cervero R, Kang C D, 2011. Bus rapid transit impacts on land uses and land values in Seoul, Korea.Transport Policy, 18(1): 102-116.Bus rapid transit (BRT) has gained popularity as a cost-effective alternative to urban rail investments; however, relatively little is known about its impacts on land-use changes and land values. This paper examines the land-market effects of converting regular bus operations to median-lane bus services in Seoul, Korea, one of the densest, most congested cities in the world. Multilevel models reveal BRT improvements prompted property owners to convert single-family residences to higher density apartments and condominiums. Land price premiums of up to 10% were estimated for residences within 300 m of BRT stops and more than 25% for retail and other non-residential uses over a smaller impact zone of 150 m. The research findings underscore the importance of introducing zoning and other land regulatory changes prior to the initiation of BRT improvements as well as applying value-capture tools to help finance investments and redress inequities.

DOI

[4]
Chapin F S, Kaiser E J, 1967. Urban Land Use Planning. 3rd ed. Illinois: University of Illinois Press.

[5]
Charnes A, Cooper W W, Rhodes E, 1978. Measuring the efficiency of decision making units.European Journal of Operational Research, 2(6): 429-444.A nonlinear (nonconvex) programming model provides a new definition of efficiency for use in evaluating activities of not-for-profit entities participating in public programs. A scalar measure of the efficiency of each participating unit is thereby provided, along with methods for objectively determining weights by reference to the observational data for the multiple outputs and multiple inputs that characterize such programs. Equivalences are established to ordinary linear programming models for effecting computations. The duals to these linear programming models provide a new way for estimating extremal relations from observational data. Connections between engineering and economic approaches to efficiency are delineated along with new interpretations and ways of using them in evaluating and controlling managerial behavior in public programs.

DOI

[6]
Debrezion G, Pels E, Rietveld P, 2011. The impact of rail transport on real estate prices: An empirical analysis of the Dutch Housing Market.Urban Studies, 48(5): 997-1015.

DOI

[7]
Defries R S, Foley J A, Asner G P, 2004. Land-use choices: Balancing human needs and ecosystem function.Frontiers in Ecology & the Environment, 2(5): 249-257.Conversion of land to grow crops, raise animals, obtain timber, and build cities is one of the foundations of human civilization. While land use provides these essential ecosystem goods, it alters a range of other ecosystem functions, such as the provisioning of freshwater, regulation of climate and biogeochemical cycles, and maintenance of soil fertility. It also alters habitat for biological diversity. Balancing the inherent trade-offs between satisfying immediate human needs and maintaining other ecosystem functions requires quantitative knowledge about ecosystem responses to land use. These responses vary according to the type of land-use change and the ecological setting, and have local, short-term as well as global, long-term effects. Land-use decisions ultimately weigh the need to satisfy human demands and the unintended ecosystem responses based on societal values, but ecological knowledge can provide a basis for assessing the trade-offs.

DOI

[8]
Du D, 2016. The causal relationship between land urbanization quality and economic growth: Evidence from capital cities in China.Quality & Quantity, 51: 2707-2723.The study of the relationship between economic development and land urbanization is significant not only for China but also for other developing countries. This paper investigates the causal relations

DOI

[9]
Fang C L, Guan X L, 2011. Comprehensive measurement and spatial distinction of input-output efficiency of urban agglomerations in China.Acta Geographica Sinica, 66(8): 1011-1022. (in Chinese)

[10]
Gu Y Z, Zheng S Q, 2010. The impacts of rail transit on property values and land development intensity: The case of No.13 Line in Beijing.Acta Geographica Sinica, 65(2): 213-223. (in Chinese)Abstract The submarket theory in urban economics tells that the effect of rail transit on housing price is greater in suburb area than that in central city. In this paper, we use No.13 rail transit line in Beijing to test this theory. The empirical results show that in suburb area, the housing price within 1000m of railway stations are higher by nearly 20% than that beyond that distance. However, with the development of surrounding urban transportation network, the above impact on housing price is declining. Also, rail transit has significant impact on urban land development intensity. The construction of No.13 line encourages the extension of land development to the northern suburb area of Beijing, and raises the land development intensity around stations. The FAR of new housing projects decreases by 1.0 every 3.3km further away from the stations in the suburban area. Those empirical results have important implications for the TOD strategy and the Cost-Benefit Analysis of rail transit construction in Chinese cities.

DOI

[11]
Guan Y J, Chen X J, 2013. A study on urban land use efficiency in Weinan City.Urban Problems, (10): 72-77. (in Chinese)

[12]
Guo Y Y, Li L, Li G C,et al., 2015. Overview of interaction between urban land use and transportation.Urban Planning International, 30(3): 29-36. (in Chinese)Interaction between urban land use and urban transportation has been a research hotspot in the fields of Geography, Economics and Urban Planning. This article gives an overview on the studies of urban land use and transportation interactions, both domestic and abroad. Base on the review, we found that: For the impact of urban land use on urban transportation, most researches get to the same conclusion that high-density development decrease the dependency on private cars, but this is not the case for the impact of mixed land use on transportation; besides the scale of the researches on the impact of land use pattern on transportation generally differs, researches abroad tend to focus on a plot scale while that in China focus on city scale; for the impact of urban transportation on urban land use, researches domestic and abroad show little difference in the research point of interest and methodologies, but the wide-spread of high-speed rail in China does provide a new context for related studies; integrating both impacts into a model is a hotspot in this area, and researches abroad tends to develop the land use and transportation integrated model, while that in China generally involve a land use and transportation coordination assessment. This article thus highlights some future prospects for further research.

[13]
Jia Z H, Hao J M, 2011. Evaluation of urban land intensive utilization based on fuzzy comprehensive assessment method: A case study of Changzhi City.China Population, Resources and Environment, 21(12): 129-134. (in Chinese)Shortage of land is a serious problem in urban economic development.Land intensive utilization to promote urban land use efficiency constandy is the inevitable choice to fix land shortage problem and solve conflicts between human and land.Fuzzy comprehensive assessment method is adopted to evaluate Changzhi County urban land intensive utilization.Through exploring the meaning of urban land intensive utilization,this paper sets up the index system of the urban land intensive degree evaluation from the aspects of land investment level,land use degree,and land use efficiency.The result are drew as follows:The intensive degree of urban land use is low in Changzhi City.The land use degree and land investment level are low.The land use efficiency is moderate.The method of fuzzy comprehensive assessment can be used to evaluate urban land use intensity,and the outputs fit into actualities and have certain feasibilities.

[14]
Jin F J, Wang C J, Li X W, 2008. Discrimination method and its application analysis of regional transport superiority.Acta Geographica Sinica, 63(8): 787-798. (in Chinese)Transport infrastructure has the inherent functions to shape the regional spatial structure and determine the accessibility of all the regions, which consequently formed into the spatial configuration with different transport superiorities. Based on the review of domestic and overseas research progress, this paper presented the concept of transportation superiority from three aspects-"quality", "quantity" and "field" to reflect the scale, technical level and relative advantage of transport infrastructure. Then the paper set up the expression structure for transport superiority degree, including transport network density, influence degree of transport trunk line and transport superiority degree of location. Moreover, this paper constituted the spatial mathematical model to evaluate transport superiority degree at the county level by utilizing GIS technology.Based on the theoretical analysis and the spatial mathematical evaluation model, this paper studied 2,365 counties in China to analyze the spatial patterns of transport superiority degree. This study reveals that, firstly, the distribution characteristic of transport superiority degree obeys the "partial normal distribution". Few regions, which merely account for 1.4% of the total number of counties, have prominent transport superiority degree and the traffic environment in these regions is superior for social and economic development. By contrast, one eighth of all the regions have inferior transport superiority degree and the traffic environment there is poor and impedes local social and economic development. The remaining regions, which are about 70% of the country's total area, have the middle level or barely better than the middle level in transport superiority degree. Secondly, the spatial characteristic shows that the transport superiority degree decreases gradually from coast areas to inland areas. The regions of the highest transport superiority degree centralize in the Yangtze River Delta, Beijing-Tianjin-Hebei Metropolitan Area, and Pearl River Delta. The regions of the second highest transport superiority degree concentrate in Chengdu, Chongqing, and Wuhan metropolises. However, the spatial distribution of the second highest regions is discontinuous and the coverage of these regions is relatively smaller than the regions with the highest transport superiority degree. The provincial capitals and some high-density cities/counties/towns enjoy the third highest transport superiority and follow the same spatial patterns as the regions of the second highest transport superiority.Through the above analysis, we could recognize the spatial mechanism of transport infrastructure and better understand how to leverage the advantages or circuit/change the disadvantages of transport infrastructure in regional development. Also this research may provide scientific guidance to all kinds of planning activities.

DOI

[15]
Johnson H M, 1960. Sociology: A Systematic Introduction. Paris: Allied Publishers.

[16]
Lambin E F, Geist H J, 2003. Regional differences in tropical deforestation.Environment, 45(6): 22-36.This study reviews the economics. logistics, and technology underlying the South African experiment of prepaid electricity. Although this experiment has resulted into benefiting large masses of small and dispersed consumers, it has also generated a set of new problems that could not be visualized at the inception of the experiment. The success of this program can be largely attributed to a number of factors. including a good marketing campaign. innovative tariff schedules, better planning and management. and so on. Lessons learned from this experiment are useful for policy-making purposes in other developing countries of Africa and Asia. (C) 2002 Elsevier Science Ltd. All rights reserved.

DOI

[17]
Li M J, Chen G H, 2003. A review on the research and application of DEA.Engineering Sciences, 5(6): 88-94. (in Chinese)

[18]
Li X, Xu X X, Chen H H, 2005. Temporal and spatial changes of urban efficiency in the 1990s.Acta Geographica Sinica, 60(4): 615-625. (in Chinese)Based on the data from 23 cities in 1983 and 1984, Charnes (1989) the first to employ DEA to evaluate the urban efficacy in China. Surprisingly, the corresponding Chinese literature has been in dark, even though scholars have highly recognized DEA and frequently used DEA in economic management and analysis. We, therefore, attempt to employ DEA to evaluate all the cities efficiency. Based on the data from 202 cities through 1990 to 2000, we find that the urban efficiency is relatively low, and diminishing from the east to the west, which coincides with the spatial pattern of economic development in China at present. Decomposing the urban efficiency into scale efficiency, congestion efficiency and pure technical efficiency, we further find it is the scale efficiency that determines the temporal and spatial patterns of urban efficiency. Specifically, both the congestion efficiency and the pure technical efficiency are high, and uniformly distributed across provinces. Scale efficiency, however, is low, and the principal factor among the three decompositions results in the low urban efficiency in China. The findings shed some highlights on how to implement the coordinated development of cities in China at present.

[19]
Liu C G, Gao G P, Zhuang J, 2005. An empirical analysis of urban economic development and land use efficiency in Shandong Province.China Economist, (8): 257-259. (in Chinese)

[20]
Liu S H, Wu C J, Chen T, 2001. A critical review on the progress of urban land use theories in the West.Geographical Research, 20(1): 111-119. (in Chinese)This paper carries out a systematical literature survey and critical review on the research progress of urban land use theories in the West, which are classified into historical morphological, locational economics, social behavior, and political economics by their research approaches. The historical morphological approach is good at exploring the spatial differentiation laws and the evolutionary models of urban land use, but its simple circular models are inconsistent with actual situation. The locational economics approach provides strong quantified economic explanation on the spatial structure of urban land use through deep decomposing the price components of urban land, but it pays more attention to “why” than to “what”. The behavior analysis approach becomes more comprehensive and practical because it additionally takes social driving forces into account, but it is based on the two concepts of “uncertainty” and “stochastity” of individual decision makers of land use, thus its theoretical explanation power is rather limited. The political economics approach focuses on the impact of the social production system and “power” on the process of urban land development, and greatly extends and enhances our understanding on inner dynamic mechanics of urban land development. Finally, this paper emphasizes that China should adopt and strengthen the application of locational economics and political economics approaches in its researches on urban land use in the future.

DOI

[21]
Liu X W, Zhang D X, Chen B M, 2008. Characteristics of China’s town-level land use in rapid urbanization stage.Acta Geographica Sinica, 63(3): 301-310. (in Chinese)

[22]
Ma X, Chen X, Li X,et al., 2018. Sustainable station-level planning: An integrated transport and land use design model for transit-oriented development.Journal of Cleaner Production, 170(1): 1052-1063.Urban rail transit system in China has been rapidly constructed in response to the effects of urbanization, such as severe urban congestion and excessive air pollution. The sustainable land use planning (i.e. transit-oriented development, TOD) around the subway stations is important for the rail transit system because of its long-term influence on travel demand. However, there are limited studies that focus on the station level TOD planning. In this context, the aim of this study is to propose a multi-objective programming model that integrates transport and land use design for station-level TOD planning. In this study, one subway station in Beijing City is taken as the case, considering the unique features of urban development (e.g. high density and diversity), five objectives are taken to account in our model, including rail transit ridership, compactness, accessibility, conflict degree, and environmental effects. Meanwhile, an improved immune-genetic based algorithm is designed to obtain the optimal solutions under alternative land use schemes. The model results show that the proposed algorithm is superior to conventional genetic algorithms. This study is hoped to provide sustainable station-level planning for urban planning decision-makers.

DOI

[23]
Meng D Y, Shen J H, Lu Y Q, 2014. Evolvement of spatial pattern of county level transportation superiority in Henan, China.Scientia Geographica Sinica, 34(3): 280-287. (in Chinese)In the article, the indicators of transportation superiority degree are established from the aspects of road network density, regional accessibility and location superiority; and the county level transportation superiority degree is evaluated in 2003 and 2008 in Henan province by the entropy weighted technique for order preference by similarity to ideal solution method(TOPSIS) and GIS technology. Then, the spatial pattern of degree and the growth trend of transportation superiority are deeply discussed by utilizing exploratory spatial data analysis method(ESDA) method. Result show that the transportation superiority degree of every county has been enhanced continuously since 2003 and displayed a strong trend of spatial correlation, the similar units cluster in space. The spatial difference is remarkable between core areas and periphery areas, and also between plain areas and mountain areas. The hotspots counties that with better transportation superiority are centralized in the areas along the transportation corridors of Beijing-Guangzhou highway, Beijing-Guangzhou railway in Zhengzhou, Xuchang and Xinxiang. Transportation superiority in many counties in Zhongyuan urban agglomeration zones got great progress following the construction of highway network. But the relative growth rate is higher in the mountain, basin zones in south and southwest Henan than other zones. At last, it is pointed that transport infrastructure is the antecedent condition to enhance regional spatial linkages and to promote location superiority. And also transport infrastructure is the basic condition to guide direction layout of industry, expanding of urban areas, and formation of traffic economic belt, optimization of regional spatial structure and growth of urban agglomeration zones or economic zones. Therefore, leverage the advantage or circuit the disadvantages of transport infrastructure in regional development is the key factor that should be considered in regional development policy planning, industry selection and regional spatial structure optimization.

DOI

[24]
Ou X, Feng C C, Shen Q Y, 2007. Application of synergisticity model in urban land-use potential appraisal.Geography and Geo-Information Science, 23(1): 42-45. (in Chinese)Traditional synergisticity model generally adopts two-paragraph efficacy function which is based the hypothesis that the efficacy of each parameter is uni-oriented,either negative or positive.But for urban land-use system,there are some parameters whose efficacy will change from negative to positive or opposite,and the two-paragraph efficacy function can't cover this kind of parameters,so it's necessary to introduce a third paragraph efficacy function,and modify the traditional efficacy function and synergisticity model to be more compatible to urban land-use system.And then the modified synergisticity model is used in the case study in Tianhe district,Guangzhou City for its urban land-use potential appraisal.The appraisal results show that the urban land-use potential of Tianhe district is moderately large and there is some space for the promotion of its urban land-use system.Especially for both environmental and social sub-system,there is still large potential space to explore,and more concerns should be given to them when digging up urban land-use potential in future.

DOI

[25]
Peneder M, 2003. Industrial structure and aggregate growth.Structural Change & Economic Dynamics, 14(4): 427-448.The paper aims for an empirical validation of the impact of industrial structure on aggregate income and growth. Various mechanisms for the linkage between meso-structure and macro-performance are identified: the income elasticity of demand, the structural bonus versus burden hypotheses, differential propensities towards entrepreneurial discovery, and producer or user related spillovers. After discussing detailed results from conventional shift-share analysis, dynamic panel estimations are applied to a standard growth model augmented by structural variables. Based on data for 28 OECD countries, the results confirm that industrial structure has been a significant determinant of macroeconomic development and growth in the 1990s.

DOI

[26]
Shen T, 2013. A review on land use at home and abroad.Contemporary Economics, (24): 156-157. (in Chinese)

[27]
Wang C X, Cui X G, Wang X Q, 2014. Analysis of Chinese “Urban Agglomerations Disease” phenomenon under new urbanization background.Urban Development Studies, 21(10): 12-17. (in Chinese)National Eleventh Five-Year Plan" put forward to taking urban agglomeration as the main form to promote urbanization,and " National New Urbanization Plan" affirmed it. In recent years,urban planning and construction of Chinese Urban Agglomerations have achieved rapid development. However,Chinese urban agglomerations are facing different kinds of contradictions and constraints during their development, and the " urban agglomeration disease " is highlighting. According to analysis of Chinese urban agglomerations' current situation and comparison with foreign ones, this paper summed up the problems of Chinese urban agglomerations based on requirements of the new urbanization,including much amount but lower strength,lacking of cooperation,internal development imbalances between urban and inter-regional pollution,and it summarized the impact mechanism from planning and construction,macroeconomic management errors,unperfect coordination mechanism,low central city driving and other objective factors. Finally,this paper appropriated measures to cure Chinese urban agglomerations disease,including changing the role of government,protrusion of market action,improvement in relevant policies and more investment on infrastructure.

[28]
Wang C X, Wang G F, Liu R C,et al., 2010. Empirical research on evaluation model of transport superiority degree: A case study of Shandong Province.Human Geography, 25(1): 73-76. (in Chinese)The transportation is just like the artery for regional development.The importance of traffic location is becoming more and more obvious in the period of rapid industrialization and urbanization in China.Based on the review of domestic and overseas research progress,this paper gives the concept of transportation supe-riority,and tries to set up an evaluation model of transport superiority degree,including transport network density,influence degree of transport trunk line and superiority degree of location of the main types of tran-port pattern,such as highway,railway,water way and air transportation.Different weights are given to each index in order to reflect the transport superiority degree well and exactly.Taking Shandong province as an ex-ample,the score of 139 Cities and Counties Governed by Shandong province can be calculated and analyzed.On the whole,transport superiority degree in each county is higher,and has great difference in every county in Shandong province,which can be divided into five types of transportation advantage degree by Cluster Analysis with SPSS.The regions with the highest transport superiority degree centralize in Jinan and Qingdao city where transpotantion is complete and perfect,and most of other counties are distributed like a circle whose core is a key city like Jinan.And the regions with the lowest transport superiority degree centralize in undeveloped counties,which lie in the north and south-west of Shandong province with low level of tranpor-tation.In conclusion,transport superiority degree is of great importance to the future of regional development.We also see that there is a close relationship between transport superiority degree and regional economy de-velopment.

[29]
Wang X W, Wang S J, Song Y,et al., 2015. Changchun land use spatio-temporal variation under the transportation elements’ driving.Economic Geography, 35(4): 155-161. (in Chinese)According to1995, 2005 and 2009 remote sensing image and relevant statistical data of Changchun, summarize14 years of traffic evolution and land use change characteristics of three period, and further analysisthe relationship between the transportation and land use spatio- Temporal variation in Changchun. studies suggest that:(1)1995- 2009 Transportation has some restraining effect on urban land expansion,convenient traffic conditions provide a good foundation environment for therelocation of production factors and the expansion of construction land;(2)expansion of construction land and arable land along traffic arteriesshowed significantcorridor effect, the relationship between transit and expansion of construction land and the loss of arable land are getting closer, closer distance along the traffic, the proportion of construction land increasing, Conversely the proportion of construction land reduce gradually;(3)expansion of construction land in Changchun major development alongoutbound traffic and urban roads, transportation routes become a major expansion shaft of the construction land. Transportation elementsbecome an important driving factor of urban land use change. traffic arteries continue to extend, causing the blind expansion of construction land,arable land loss gradually. therefore, the future development of Changchun city transportation construction should be optimized structure properly, stable the rate of land use change, to promote urban achieve sustainable development.

[30]
Wang Y P, Chen K M, Ma C Q, 2008. Quantitative analysis of coordination between rail transit network configuration and urban form.Journal of Railway Engineering Society, (11): 11-15. (in Chinese)Research purposes:At present,the coordination analysis between rail transit network configuration and urban form was restricted to qualitative method during urban rail transit network planning in China.A means of quantitative analysis will contribute to building a reasonable rail transit network.Research results:Three quantitative indexes were put forth such as the fitness between urban rail transit network middle and city gravity centre,the fractal dimension identity between urban rail transit network and urban form,and the direction coordination between urban rail transit and city developing.Based on these quantitative indexes,a compositive coordination index was built to quantitatively analyze the coordination between rail transit network configuration and urban form.Take Xi'an urban rail transit network planning for instance,the coordination between it is four pre-selection networks and urban form were analyzed.These compositive coordination indexes of four pre-selection network were 0.782 9,0.777 8,0.690 8,0.784 9,the computing results showed that the forth network is the best one.

DOI

[31]
Wu D W, Mao H Y, Zhang X L,et al., 2011. Assessment of urban land use efficiency in China.Acta Geographica Sinica, 66(8): 1111-1121. (in Chinese)Urban land use efficiency has direct influence on socio-economic development and construction of residential conditions in cities. Based on data envelopment analysis of the input-output and scalable efficiency of land use in 658 cities across China, some results are obtained as follows. First, the input-output efficiency of urban land use in China is low by large and ascends by the level of city scales, high in Eastern China and low in Central and Western China. The input-output efficiency of urban land use, however, is abnormally high in small cities. Second, there are a variety of factors contributing to low input-output efficiency of urban land use in China, ranging from redundant personnel investment in the secondary and tertiary industries, excessive fixed asset investment and construction land, to deficiency of environmental output which are more dramatic in different big cities by tiers. Third, the scale efficiency of land use in most of the cities in China is rising. The scale efficiency of urban land use is high in Eastern China and low in Central and Western China, descending by the level of city scales. It is of great significance to evaluate and analyze the factors contributing to different land use efficiency nationwide, three large regions and different tier cities, which will provide realistic ground for governments at all levels to stipulate urban development policies.

DOI

[32]
Wu Y, Hui E, Zhao P,et al., 2018. Land use policy for urbanization in China.Habitat International, 77: 40-42.The objective of this paper is to investigate the determinants and structure of public sector rents in Hong Kong. It looks at the trends and patterns of public housing rents over the past 20 years or so. The paper discusses the housing authority's setting approach and its inherent shortcomings with regard to income generation, equity, and efficiency. It presents a framework that examines the... [Show full abstract]

DOI

[33]
Xu X, Peng H, Xu Q,et al., 2009. Land changes and conflicts coordination in coastal urbanization: A case study of the Shandong Peninsula in China.Coastal Management, 37(1): 54-69.The coastal zone is an interaction region between land and ocean and an interface of geosphere, hydrosphere, atmosphere, and biosphere, as well as greatly affected by human activities. Driven by economic activities and increased population, urbanization is rapidly developing in coastal zones, and a series of land resource and environmental conflicts have occurred, especially in developing countries at times of economic transition. This article reports a case study of the Shandong Peninsula of East China. We analyze the land-use practices and land cover changes of six cities over a timeframe of nearly a decade. We then review the management conflict issues. The most commonly encountered conflicts fall into three categories: those between expanding constructed land and decreased cultivated land; those between land resource utilization and conservation; and those between increasing demand for land and degrading land quality. All in all, they reflect the fundamental conflicts between short-term economic development gains and long-term food security and ecosystem sustainability. This article puts forward an institutional approach to coordinate these conflicts so as to realize integrated and coordinated coastal management.

DOI

[34]
Yang H Q, Hu Y, Wang Q X, 2015. Evaluation of land use efficiency in three major urban agglomerations of China in 2001-2012.Scientia Geographica Sinica, 35(9): 1095-1100. (in Chinese)This article uses DEA model to calculate the land use efficiency of urban agglomerations in the Changjiang River Delta, Beijing-Tianjin-Hebei and the Zhujiang River Delta. The results show: 1) The land use efficiency of urban agglomerations showed a downward trend in 2001-2012, decline rates being 6.06%,2.86%, 24.34% in the Changjiang River Delta, Beijing-Tianjin-Hebei and the Zhujiang River Delta, respectively, and that of the Zhujiang River Delta urban agglomeration was the largest; 2) The overall efficiency of urban land use of Beijing-Tianjin-Hebei was high and had a relatively small amount of redundancy, deceleration of that was significantly lower than those of the two deltas. The latter two continued to be in the reduce state; 3)The validity of returns to scale of land use efficiency showed a downward trend, decline rates being 10.53%,10% and 33.34% in the urban agglomerations of the Changjiang River Delta, Beijing-Tianjin-Hebei and the Zhujiang River Delta. 4) The "Center-Periphery" phenomenon was evident in the three urban agglomerations.

DOI

[35]
Yang Q K, Duan X J, Ye L,et al., 2014. Efficiency evaluation of city land utilization in the Yangtze River Delta using a SBM-Undesirable model.Resources Science, 36(4): 712-721. (in Chinese)Current environment negative externalities have been neglected from analyses of urban land input-output efficiency. Here, we construct a undesirable output model SBM-undesirable, select 16 cities in the Yangtze River Delta and evaluate land use efficiency. We found that overall land use efficiency of the Yangtze River Delta remains at a low level and average efficiency maintained a trend of concave shape fluctuation. Environmental pollution and the presence of undesirable outputs reduce the overall level of land use efficiency of the Yangtze River Delta region, and differences in city land use efficiency within the study period increased. In the view of changes in efficiency decomposition, changes in the pure technical efficiency of land use are the main cause resulting in the evolution trend of technical efficiency. Except for the year 2006, the spatial distribution shows uneven feathers in land use efficiency. Land use efficiency in regional cities, such as Shanghai, Nanjing and Hangzhou maintain a high level over a long period of time. However, the efficiency in Nantong, Taizhou(central Jiangsu) and Zhoushan and Taizhou lying in the north of Zhejiang is at a low level. The spatial distribution patterns are a ig concentration-small dispersion'type, and characteristics of non-equilibrium are obvious. Through the analysis of land use non-DEA efficient urban, cities have common input redundancy and negative externality benefits, and environmental negative externalities output are too great. Optimization of the ability of resource allocation, reducing the negative external effect and increasing the output of per unit land is the realistic path to improve utilization efficiency.

[36]
Yu M, 2002. Data, Models and Decision. Beijing: China Machine Press, 196-198. (in Chinese)

Outlines

/