
Journal of Geographical Sciences >
Changes in air temperature over China in response to the recent global warming hiatus
Author: Du Qinqin (1994-), Master Candidate, specialized in global change and sustainable development.E-mail: geoduqin@163.com
Received date: 2018-10-08
Accepted date: 2018-12-18
Online published: 2019-04-12
Supported by
National Basic Research Program of China (973 Program), No.2013CBA01801
Promotion Project for Young Teachers in Northwest Normal University, No.NWNU-LKQN-15-8
Copyright
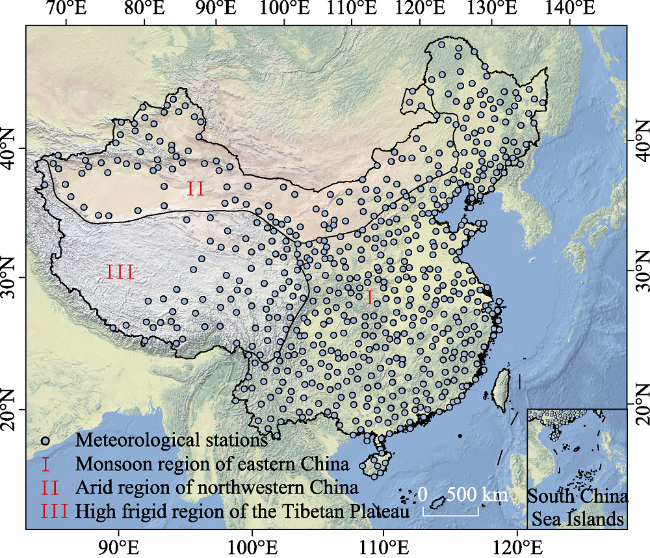
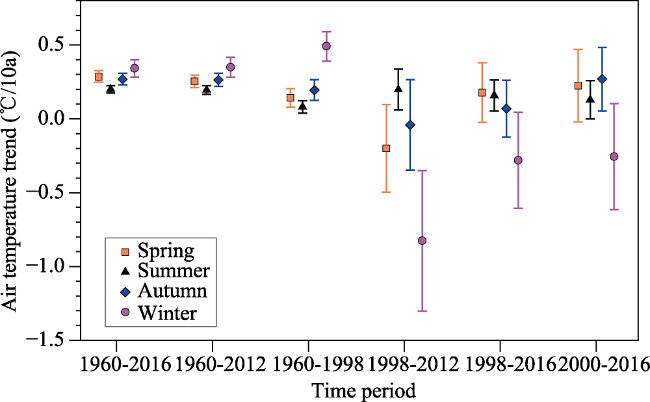
The 1998-2012 global warming hiatus has aroused great public interest over the past several years. Based on the air temperature measurements from 622 meteorological stations in China, the temperature response to the global warming hiatus was analyzed at national and regional scales. We found that air temperature changed -0.221℃/10a during 1998-2012, which was lower than the long-term trend for 1960-1998 by 0.427℃/10a. Therefore, the warming hiatus in China was more pronounced than the global mean. Winter played a dominant role in the nationwide warming hiatus, contributing 74.13%, while summer contributed the least among the four seasons. Furthermore, the warming hiatus was spatial heterogeneous across different climate conditions in China. Comparing the three geographic zones, the monsoon region of eastern China, arid region of northwestern China, and high frigid region of the Tibetan Plateau, there was significant cooling in eastern and northwestern China. In eastern China, which contributed 53.79%, the trend magnitudes were 0.896℃/10a in winter and 0.134℃/10a in summer. In the Tibetan Plateau, air temperature increased by 0.204℃/10a, indicating a lack of a significant warming hiatus. More broadly, the warming hiatus in China may have been associated with the negative phase of PDO and reduction in sunspot numbers and total solar radiation. Finally, although a warming hiatus occurred in China from 1998 to 2012, air temperature rapidly increased after 2012 and will likely to continuously warm in the next few years.
Key words: global warming hiatus; three geographic zones; temperature; China
DU Qinqin , ZHANG Mingjun , WANG Shengjie , CHE Cunwei , MA Rong , MA Zhuanzhuan . Changes in air temperature over China in response to the recent global warming hiatus[J]. Journal of Geographical Sciences, 2019 , 29(4) : 496 -516 . DOI: 10.1007/s11442-019-1612-3
Figure 1 Location of meteorological stations and divisions in China |
Table 1 Magnitude of average air temperature trends globally (IPCC, Climate Change 2013) and in China during different periods |
| Air temperature trend (℃/10a) | |||||
|---|---|---|---|---|---|
| 1951-2012 | 1998-2012 | 1998-2014 | 2000-2014 | ||
| Globe | Land and ocean | 0.117 | 0.04 | 0.059 | 0.116 |
| Land | 0.194 | 0.039 | 0.112 | 0.15 | |
| Ocean | 0.088 | 0.014 | 0.038 | 0.036 | |
| China | Land | - | -0.221 | -0.094 | 0.018 |
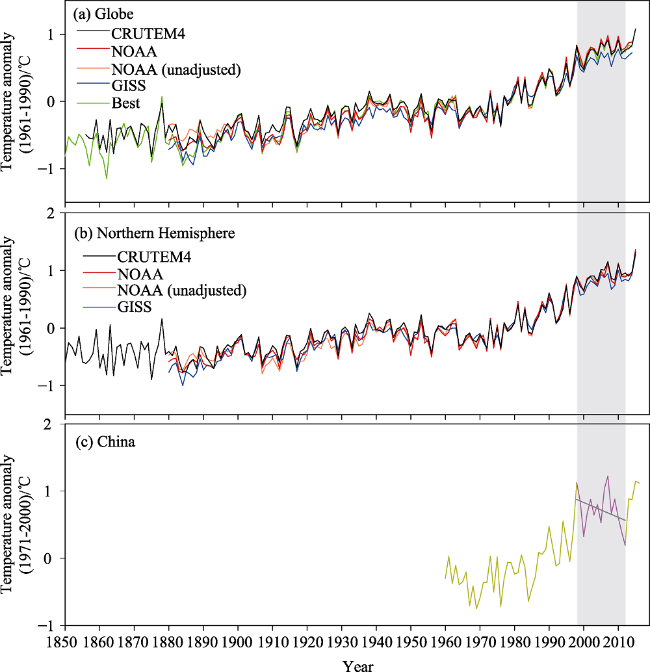
Figure 2 Terrestrial average air temperature anomalies globally, in the Northern Hemisphere and China |
Figure 3 Trends in average air temperature in China for each season during different periods (error bars denote the 90% confidence interval) |
Table 2 Seasonal contributions to air temperature changes in China for different periods |
| Time periods | Contribution (%) | |||
|---|---|---|---|---|
| Spring | Summer | Autumn | Winter | |
| 1960-2016 | 26.13 | 18.25 | 24.5 | 31.12 |
| 1960-2012 | 23.93 | 18.37 | 24.8 | 32.9 |
| 1960-1998 (Acceleration period) | 15.62 | 8.9 | 21.46 | 54.01 |
| 1998-2012 (Hiatus period) | 22.87 | -22.82 | 4.73 | 95.22 |
| 1998-2016 | 143.5 | 24.50 | 55.69 | -226.36 |
| 2000-2016 | 61.39 | 35.11 | 73.41 | 69.81 |
| 1998-2012 and 1960-1998 (Proportional contribution to warming hiatus) | 19.16 | -6.59 | 13.29 | 74.13 |
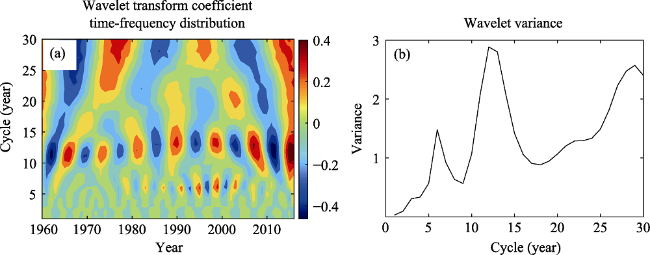
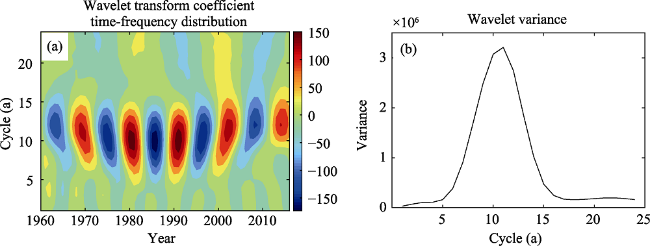
Figure 4 Wavelet analysis of average air temperature in China for 1960-2016 |
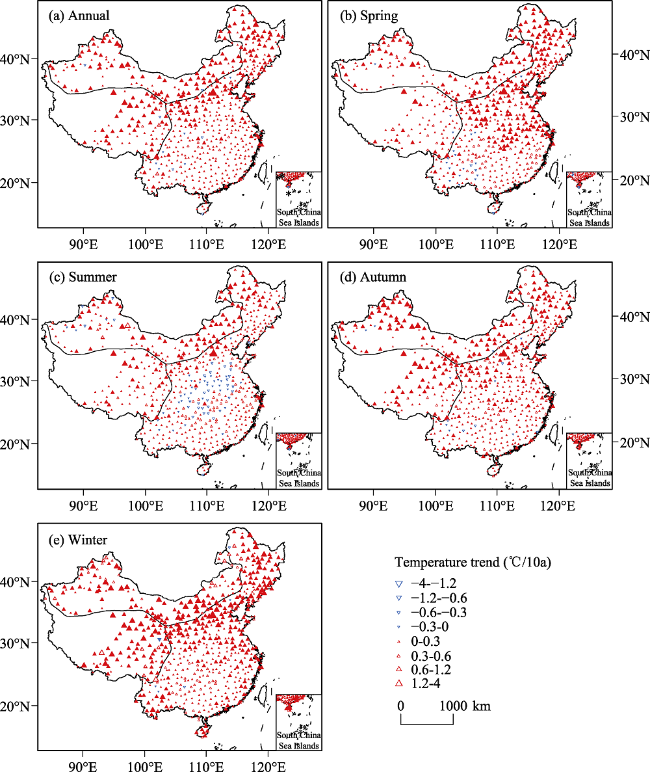
Figure 5 Spatial distribution of trends in annual/seasonal average air temperatures in China for 1960-2012 |
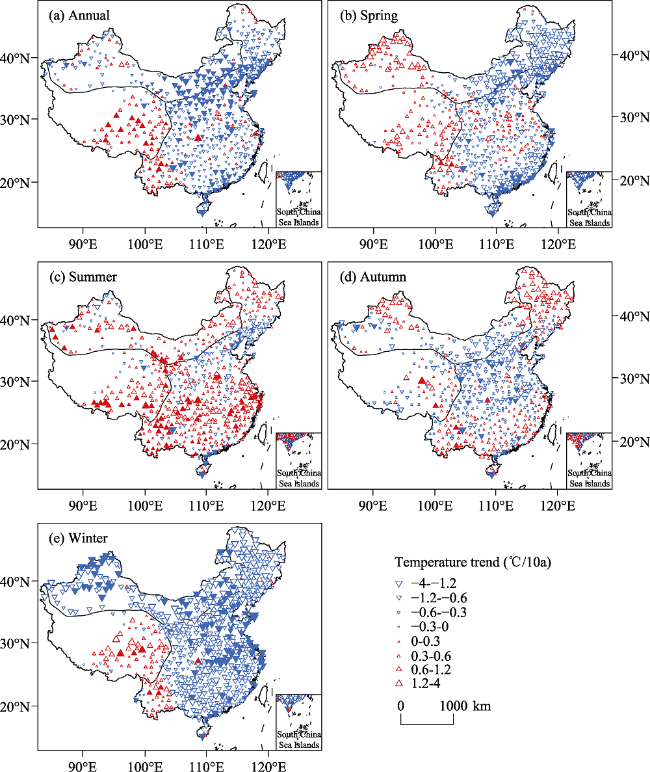
Figure 6 Spatial distribution of trends in annual/seasonal average air temperatures in China for 1998-2012 |
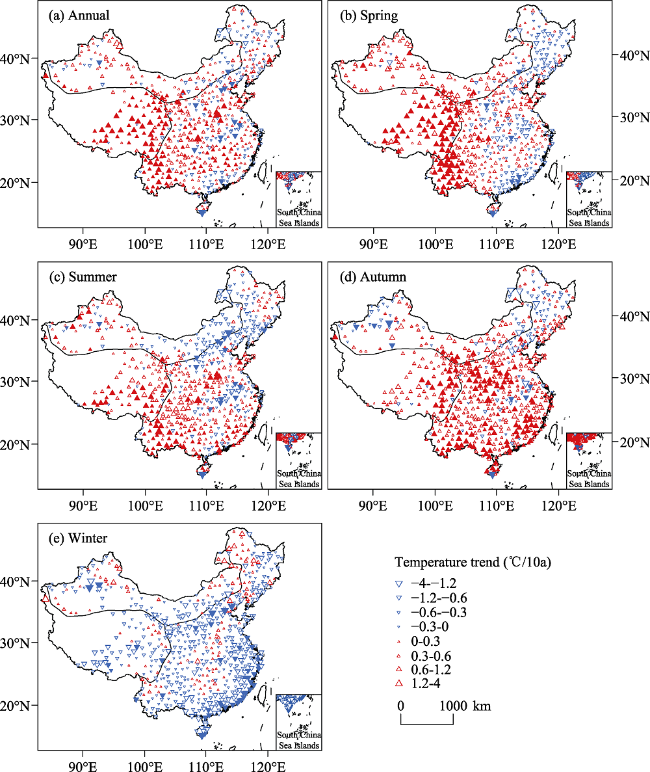
Figure 7 Spatial distribution of trends in annual/seasonal average air temperatures in China over 2000-2016 |
Table 3 Regional contribution to air temperature changes in China during different periods |
| Time periods | Contribution (%) | ||
|---|---|---|---|
| Monsoon region of eastern China | Arid region of northwestern China | High frigid region of the Tibetan Plateau | |
| 1960-2016 | 37.15 | 35.61 | 27.24 |
| 1960-2012 | 36.86 | 35.75 | 27.39 |
| 1960-1998 (Acceleration period) | 37.91 | 39.58 | 22.51 |
| 1998-2012 (Hiatus period) | 70.89 | 54.96 | 25.85 |
| 1998-2016 | -7.29 | 9.84 | 97.46 |
| 2000-2016 | 25.68 | 25.94 | 59.25 |
| 1998-2012 and 1960-1998 (Proportional contribution to warming hiatus) | 53.79 | 46.98 | -0.77 |
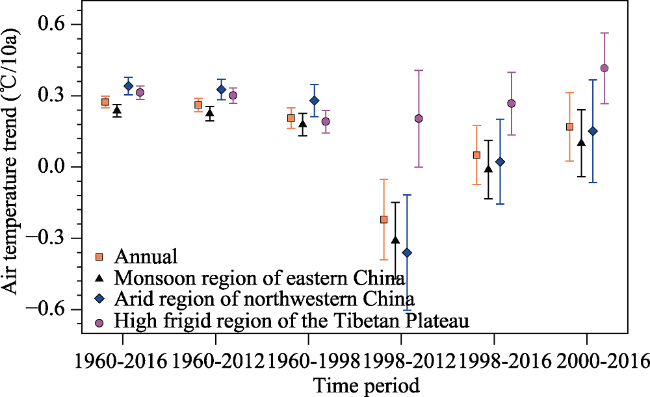
Figure 8 Trends in average air temperature for China and the three geographic zones during different periods (error bars denote the 90% confidence interval) |
Table 4 Trends in seasonal average air temperature for three geographic zones in China |
| Time period | Temperature trend (℃/10a) | |||||||||||
|---|---|---|---|---|---|---|---|---|---|---|---|---|
| Monsoon region of eastern China | Arid region of northwestern China | High frigid region of the Tibetan Plateau | ||||||||||
| Spring | Summer | Autumn | Winter | Spring | Summer | Autumn | Winter | Spring | Summer | Autumn | Winter | |
| 1960-2016 | 0.271 | 0.153 | 0.227 | 0.316 | 0.36 | 0.276 | 0.334 | 0.39 | 0.245 | 0.272 | 0.319 | 0.313 |
| 1960-2012 | 0.24 | 0.146 | 0.217 | 0.314 | 0.308 | 0.286 | 0.345 | 0.388 | 0.227 | 0.257 | 0.302 | 0.301 |
| 1960-1998 | 0.145 | 0.058 | 0.15 | 0.461 | 0.146 | 0.085 | 0.269 | 0.702 | 0.128 | 0.148 | 0.236 | 0.191 |
| 1998-2012 | -0.419 | 0.134 | -0.063 | -0.896 | -0.061 | 0.217 | -0.059 | -1.425 | 0.213 | 0.337 | -0.046 | 0.204 |
| 1998-2016 | 0.04 | 0.128 | 0.066 | -0.248 | 0.397 | 0.054 | -0.051 | -0.421 | 0.281 | 0.324 | 0.205 | 0.267 |
| 2000-2016 | 0.069 | 0.087 | 0.277 | -0.212 | 0.325 | -0.008 | 0.129 | -0.245 | 0.596 | 0.375 | 0.429 | -0.27 |
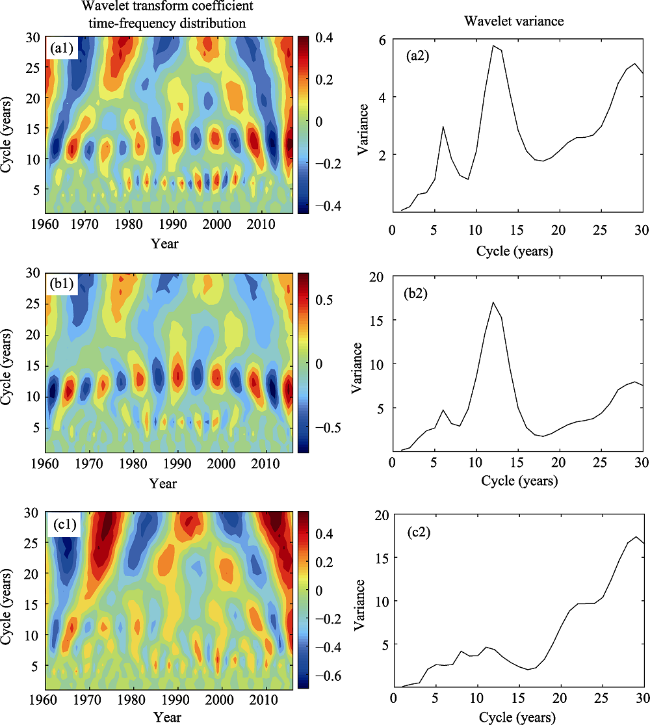
Figure 9 Wavelet analysis of average air temperature in the monsoon region of eastern China (a1 and a2), arid region of northwestern China (b1 and b2), and high frigid region of the Tibetan Plateau (c1 and c2) for 1960-2016 |
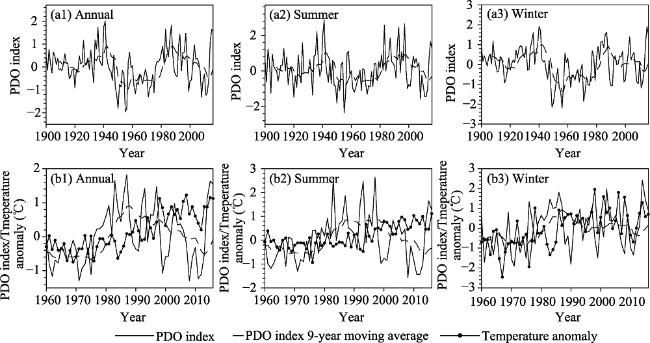
Figure 10 Changes in PDO index and average air temperature anomalies in China for 1900-2016 (a1, a2 and a3) and 1960-2016 (b1, b2 and b3) |
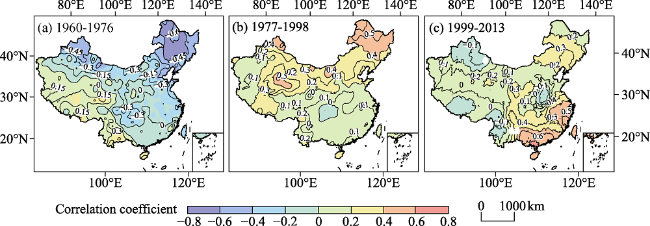
Figure 11 Spatial distribution of correlation coefficient between PDO index and average air temperature in China for different time periods |
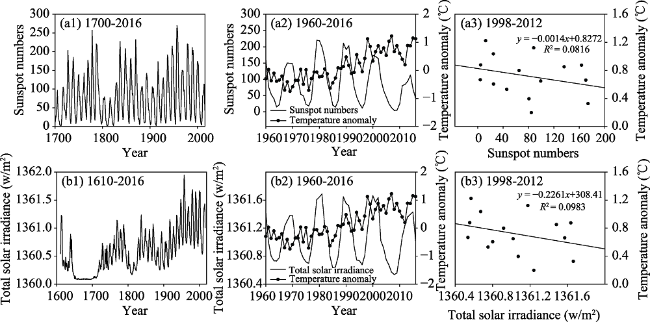
Figure 12 Changes in sunspot numbers, total solar irradiance and average air temperature anomalies in China (a1, a2, b1 and b2) during different periods. Correlation between sunspot numbers, total solar irradiance and average air temperature anomalies in China for 1998-2012 (a3 and b3) |
Figure 13 Wavelet analysis of sunspot numbers for 1960-2016 |
The authors have declared that no competing interests exist.
| [1] |
|
| [2] |
|
| [3] |
|
| [4] |
|
| [5] |
|
| [6] |
|
| [7] |
|
| [8] |
|
| [9] |
|
| [10] |
|
| [11] |
|
| [12] |
|
| [13] |
|
| [14] |
|
| [15] |
|
| [16] |
|
| [17] |
IPCC. Climate Change 2013: The Physical Science Basis, 2013. Contribution to Working Group I to the Fifth Assessment Report of the Intergovernmental Panel on Climate Change. Cambridge, United Kingdom and New York, USA: Cambridge University Press.
|
| [18] |
|
| [19] |
|
| [20] |
|
| [21] |
|
| [22] |
|
| [23] |
|
| [24] |
|
| [25] |
|
| [26] |
|
| [27] |
|
| [28] |
|
| [29] |
|
| [30] |
|
| [31] |
|
| [32] |
|
| [33] |
|
| [34] |
|
| [35] |
|
| [36] |
|
| [37] |
|
| [38] |
|
| [39] |
|
| [40] |
|
| [41] |
|
| [42] |
|
| [43] |
|
| [44] |
|
| [45] |
|
| [46] |
|
| [47] |
|
/
| 〈 |
|
〉 |