Research Articles

Simulating runoff generation and its spatial correlation with environmental factors in Sancha River Basin: The southern source of the Wujiang River

  • HOU Wenjuan ,
  • GAO Jiangbo , *
Expand
  • Key Laboratory of Land Surface Pattern and Simulation, Institute of Geographic Sciences and Natural Resources Research, CAS, Beijing 100101, China
*Corresponding author: Gao Jiangbo, PhD, E-mail:

Author: Hou Wenjuan, PhD, specialized in research on karst ecosystem services. E-mail:

Received date: 2018-07-12

  Accepted date: 2018-08-17

  Online published: 2019-03-20

Supported by

National Basic Research Program of China, No.2015CB452702

National Natural Science Foundation of China, No.41671098, No.41530749

“Strategic Priority Research Program” of the Chinese Academy of Sciences, No.XDA20020202

Open Foundation of Laboratory for Earth Surface Processes (LESP) Ministry of Education

Copyright

Journal of Geographical Sciences, All Rights Reserved

Abstract

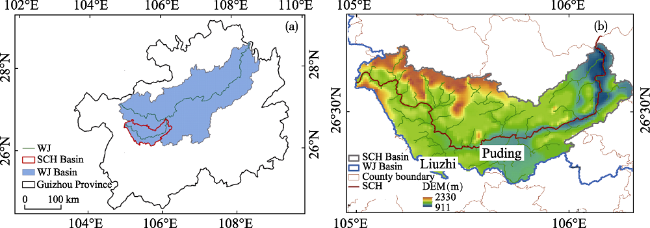
Runoff generation is an important part of water retention service, and also plays an important role on soil and water retention. Under the background of the ecosystem degradation, which was caused by the vulnerable karst ecosystem combined with human activity, it is necessary to understand the spatial pattern and impact factors of runoff generation in the karst region. The typical karst peak-cluster depression basin was selected as the study area. And the calibrated and verified Soil and Water Assessment Tool (SWAT) was the main techniques to simulate the runoff generation in the typical karst basin. Further, the spatial variability of total/surface/groundwater runoff was analyzed along with the methods of gradient analysis and local regression. Results indicated that the law of spatial difference was obvious, and the total runoff coefficients were 70.0%. The groundwater runoff was rich, about 2-3 times the surface runoff. Terrain is a significant factor contributing to macroscopic control effect on the runoff service, where the total and groundwater runoff increased significantly with the rising elevation and slope. The distribution characteristics of vegetation have great effects on surface runoff. There were spatial differences between the forest land in the upstream and orchard land in the downstream, in turn the surface runoff presented a turning point due to the influence of vegetation. Moreover, the results of spatial overlay analysis showed that the highest value of total and groundwater runoff was distributed in the forest land. It is not only owing to the stronger soil water retention capacity of forest ecosystem, and geologic feature of rapid infiltration in this region, but also reflected the combining effects on the land cover types and topographical features. Overall, this study will promote the development and innovation of ecosystem services fields in the karst region, and further provide a theoretical foundation for ecosystem restoration and reconstruction.

Cite this article

HOU Wenjuan , GAO Jiangbo . Simulating runoff generation and its spatial correlation with environmental factors in Sancha River Basin: The southern source of the Wujiang River[J]. Journal of Geographical Sciences, 2019 , 29(3) : 432 -448 . DOI: 10.1007/s11442-019-1608-z

1 Introduction

Ecosystem services refer to the environmental conditions and utility provided and maintained by ecosystems, on which humans rely for survival and development (Daily, 1997). Bridging the natural and social systems, ecosystem services are a key research topic in ecology and geography, and receive significant attention from researchers and scientific organizations (Fu et al., 2013; Fu and Zhang, 2014; Li, 2014). According to their utility, ecosystem services can be classified into supporting, provisioning, regulating, and cultural services (Costanza et al., 1997; Fu and Yu, 2016). The Millennium Ecosystem Assessment Report, however, highlighted that 60% of key ecosystem service items around the world have deteriorated since the late 20th century (among 24 global ecosystem services evaluated, 15 of them are deteriorating) and problems related to regulating services have become more severe (MEA, 2005). Water retention is an important ecosystem service that covers water supply and regulation. It plays an essential role in many aspects, such as maintaining ecological safety and ensuring a high quality of life for humans. Due to water cycle processes and water mass balances, different water retention indicators are closely related and interact with each other (Liu and Du, 1985). For example, water generation (i.e. water resource provisioning services) significantly affects other services such as soil moisture regulation and flood regulation and storage.
In southwest China, special geologic conditions and interconnected surface and subsurface hydrological systems result in fragile karst ecosystems. Global climate change and anthropogenic interference have led to serious vegetation deterioration and accelerated soil erosion, which eventually resulted in rocky desertification (Pan and Lu, 2010; Li et al., 2016). This severely hinders sustainable development and ecological civilization construction in southwest China (Yuan, 2015). Soil and water loss is the core issue behind rocky desertification (Bai and Wang, 2011), soil and water conservation (soil moisture retention and soil conservation) in karst areas is critical to prevent rocky desertification and to promote ecological restoration. Runoff processes provide water resources for humans and are essential for soil moisture and soil conservation. Studies on runoff generation services in typical karst areas are beneficial for strengthening the water-retention and soil-fixing capacity in karst areas, and enable analysis of the weighted relationship between runoff generation and soil moisture retention, providing theoretical evidence for rocky desertification control and ecological restoration.
At present, studies on the karst runoff generation focus either on the macroscopic scale, where the total volume and value of water retention are calculated using empirical formulae or value equivalent methods based on water balance theories (Zhang et al., 2011), or at the plot scale, where dynamic pattern analysis of eco-hydrological processes (Chen et al., 2013; Dai et al., 2017) reveals the factors contributing to runoff processes (Hu et al., 2012). However, highly heterogeneous landscapes in karst areas lead to remarkable spatial differences in runoff generation. It is difficult to upscale the empirical patterns observed at observation plots to the regional scale. Empirical formulae and value equivalent methods also do not consider the physical mechanisms and spatial patterns of runoff volumes (Zhang et al., 2013), which should be the main focus in karst areas with relatively high landscape fragmentation. Conversely, the Soil and Water Assessment Tool (SWAT) model is based on physical mechanisms and depicts some processes using empirical models. Thus, it is widely employed in runoff studies under different environments (Zhou et al., 2013; Lv et al., 2014; Xu et al., 2015). In particular, its simplified calculation method makes the SWAT model somewhat applicable to karst areas, where the underlying surface conditions are complicated, and hydrogeological conditions are unusual (Wang et al., 2014; Tian et al., 2016). Therefore, this study uses the SWAT model to simulate runoff generation services in a typical karst drainage basin. Spatial variation characteristics are examined by various topographic background and land cover systems in order to promote the development of karst ecosystem services research, and to provide theoretical support for regional sustainable development.

2 Study area

The Sancha River is a primary tributary of the southern source of the Wujiang River, lying between 104°54′-106°24′E and 26°06′-27°00′N with a drainage area of 4681 km2. It originates from Wumeng Mountain in west Guizhou. In Dongfeng Reservoir in Qianxi county, Bijie city, the Sancha River joins the Liuchong River, a primary tributary of the northern source of the Wujiang River, to form the Yachi River in the midstream of the Wujiang River. The Sancha drainage basin is situated in northwest Guizhou, which is a typical karst peak-cluster depression region. The area exhibits unique hydrogeological structures, thin and discontinuous surface soils, rapid hydrological processes, and uneven spatial distributions of water and land resources (Wang et al., 2004). Fragile eco-geological environments, together with anthropogenic interference, have led to severe rocky desertification in the region. Recently, the first stage of a comprehensive rocky desertification mitigation project has been completed, and has proven to be effective. However, related research is lagging behind project progress.
The drainage basin is higher in the west and lower in the east, and elevation ranges between 911 and 2330 m. Land use types include forest, orchard, farmland, grassland, commercial land, and industrial and mining storage. Most of the basin is covered by forests, which occupy 45% of the entire region, and orchards rank second (25%). Farmland and grassland cover relatively small areas. Because both commercial land and land for industry and mining are dominated by human activities, they are combined into one group. According to land use remote sensing data from 1990 to 2010, there have been no significant dynamic changes in land use in the Sancha River Basin. Changes in farmland, grassland, woodland, and unused land are between -0.2% and 9%.
Figure 1 Map showing basic information of the Sancha River Basin (SCH: Sancha River; WJ: Wujiang River)

3 Materials and methods

3.1 Data preparation

Meteorological data, soil data, and DEM are the input data for the model simulation. Hydrologic data are used to verify the simulated effect. The rationality and accuracy of the input data are all very important for the simulation performance of the model.
3.1.1 Meteorological data
The meteorological database comprises daily measurements collected at Anshun weather station by the China Meteorological Data Service Center (http://cdc.cma.gov.cn/home.do). The database includes daily average temperature, precipitation, average wind speed, relative humidity, and sunshine duration. In addition, because this study focuses on runoff simulations, which are more prone to the influence of precipitation, four precipitation stations in the Sancha River Basin were selected for precipitation data. These stations are located at Bide, Machang, Santang, and Qibo. Measurements at the precipitation stations were collected from the Institute of Geographic Sciences and Natural Resources Research, Chinese Academy of Sciences (CAS): Hydrological Yearbook of the People’s Republic of China - the Wujiang River Region of Yangtze River Basin. Basic information from weather and precipitation stations is shown in Table 1.
Table 1 Information for meteorological and rainfall stations
Station types Station name Latitude Longitude Elevation (m) River system Period
Meteorological station Anshun 26º15´ 105º54´ 1431 Preheat year: 2006-2007;
Calibration year: 2008-2010;
Validation year: 2011-2013
Precipitation station Bide 26º34´ 105º10´ 1500
Machang 26º19´ 105º33´ 1320
Santang 26º35´ 105º33´ 1588
Qibo 26º34´ 106º10´ 990
Hydrological station Yangchang 26º39´ 105º11´ Sancha River
Longchangqiao 26º23´ 105º47´ Sancha River
Hongjiadu 26º52´ 105º52´ Liuchonghe
Yachihe 26º51´ 106º09´ Wujiang River
3.1.2 Hydrological data
According to the Yangtze River Basin record in the Hydrological Yearbook of the People’s Republic of China (Ministry of Water Resources of the People’s Republic of China), there are two hydrological stations in the Sancha River Basin: the Yangchang station and the Longchangqiao station, which are located in the upstream and midstream regions, respectively. Runoff data from hydrological stations in the discharge areas of the basin are required for model calibration, so Hongjiadu station (at the Liuchong River mouth) and Yachi station (in the mainstream of the Wujiang River, where the Liuchong River and Sancha River converge) were selected. Daily and monthly average runoff data from the Yangchang, Longchangqiao, Hongjiadu, and Yachi stations were used to calibrate and validate the SWAT model. Information about these stations is listed in Table 1.
3.1.3 Remote sensing data
Remote sensing data include digital elevation model (DEM) data, land use data, and soil data, which include soil types and associated physical and chemical properties. The Normalized Difference Vegetation Index (NDVI) was adopted for the spatial statistical analysis of runoff model simulation results. DEM data at 1 km resolution were obtained from the HYDRO1K database at the U.S. Geological Survey (USGS) EROS Center (http://eros.usgs. ov/#/Find_Data/Products_and_Data_Available/HYDRO1K). The 1:100,000 scale land use vector data of 2010 obtained from the Resources and Environmental Science Data Center, CAS (Liu et al., 2014) were applied. Soil data were collected from the Harmonized World Database version 1.1 (HWSD), established jointly by the Food and Agriculture Organization of the United Nations (FAO) and the International Institute for Applied System Analysis (IIASA) (Fischer et al., 2008). The main soil properties include soil type according to the FAO90 soil classification scheme, reference depth, and physical (such as gravel volume percentage, sand/silt/clay content, and effective moisture content) and chemical properties (namely organic carbon content and cation exchange capacity). NDVI data and the Moderate Resolution Imaging Spectroradiometer (MODIS) product (http://ladsweb.ascom. asa.gov/) from 2005-2010 were used, with temporal and spatial resolutions of 16 d and 500 m, respectively. Vegetation index data were mainly used to study the statistical spatial relationship between land cover and runoff generation in the river basin. NDVI in the Sancha River Basin is higher in the west and lower in the east, showing a banded spatial distribution (Figure 2).
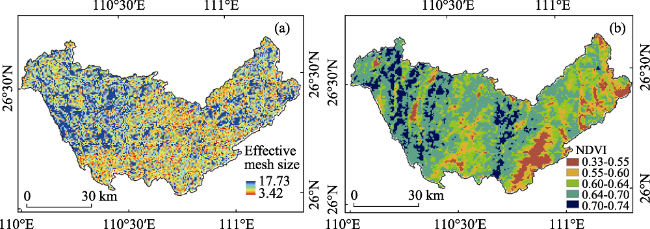
Figure 2 Spatial pattern of NDVI and index of landscape fragmentation in the Sancha River Basin

3.2 SWAT model introduction

This study used the SWAT model, which was calibrated and validated using measured runoff data from hydrological stations. It was then utilized to simulate runoff generation in a typical karst river basin, including total runoff, surface runoff, and groundwater runoff. The water cycle in the model was based on various hydrological variables:
$S{{W}_{t}}=S{{W}_{0}}+\sum\limits_{i=1}^{t}{({{R}_{day}}-{{Q}_{surf}}-{{E}_{a}}-{{W}_{seep}}-{{Q}_{gw}})}$ (1)
where SWt denotes the final soil moisture content (mm); SW0 denotes the initial soil moisture content on the i th day (mm); t represents the time (d); Rday represents the precipitation on the ith day (mm); Qsurf is the surface runoff on the ith day (mm); Ea is the evapotranspiration on the i the day (mm); Wseep denotes the water seepage from the soil profile to the vadose zone (mm); and Qgw denotes the baseflow returned on the i th day (mm).
Compared to other hydrological models (distributed and conceptual hydrologic models), the SWAT model is more favorable because it is based on hydrological processes and is more efficient due to easily obtained parameters. For example, the MIKE SHE hydrological model comprehensively considers hydrological processes, boundary conditions, and the spatial heterogeneity of collective characteristics in river basins; however, it is difficult to collect data on underlying surfaces and hydrogeological conditions (McMichael et al., 2006). The TOPMODEL model has a simple structure and demands fewer parameters, but it does not thoroughly consider the spatial heterogeneity of hydrological elements, and the coupled relationships between hydrological units (Beven et al., 1984). In the SWAT model, runoff simulation is performed using different modules (surface runoff, groundwater, and river confluence). For surface runoff, this study employs the relatively mature SCS curve number method (empirical model), which is a function of soil permeability, land use, and antecedent soil moisture conditions. The soil permeability is predominantly calculated according to the physical and chemical properties of different soil types in the karst area, which can reasonably reflect actual soil permeability in the region. Different land use types will affect runoff by changing surface evaporation, soil moisture conditions, and interception of land cover. As an input data point, the land use types in the river basin are eventually reflected by the SCS curve number. Studies have indicated that surface runoff will occur after the precipitation depth reaches 40 mm in karst areas (Peng and Wang, 2012). Therefore, antecedent soil moisture conditions are also a key factor influencing surface runoff in typical karst river basins. Groundwater runoff was calculated using water mass balance equations of shallow and deep aquifers. The volume was calculated based on different movement processes, and each module was controlled by the corresponding parameters. Groundwater runoff simulation results in karst areas are generally affected by factors such as the baseflow alpha factor (ALPHA_BF, a direct indicator of groundwater runoff in response to recharge variations) and threshold water depth in the shallow aquifer for flow (GWQMN).
3.2.1 Data preparation and model construction
(1) Construction of spatial database
Coordinate systems of different spatial data were consolidated (Krasovsky_1940_Albers) through ArcGIS using the .img data format. According to the land use data classification in the SWAT model, land use raster data were re-classified and converted to codes defined by the model. The 1:1,000,000 soil data for the Sancha River Basin underwent projection conversion, and special situations in the attribute tables were determined according to previous research experience.
(2) Preparation of attribute database
Soil database. The major parameters required by “USERSOIL” in the SWAT database are soil physical and chemical properties. Physical properties include mechanical composition, saturated hydraulic conductivity, and available water capacity, and chemical properties include organic carbon content, electrical conductivity, and others. Some parameters were obtained from the HWSD soil database, for example, soil layer thickness and organic carbon content, and saturated hydraulic conductivity and available water content were calculated using software (SPAW) or empirical equations.
Meteorological database. For each weather station, the .DBF documents of daily precipitation, daily maximum and minimum temperatures, solar radiation, average wind speed, and relative humidity were established. Meanwhile, a geographic information document (.DBF) of weather and precipitation stations was created to link the location map of the weather stations with the meteorological database.
Land use and soil index table. The index table links the SWAT attribute data with the spatial distribution maps of land use and soil type.
3.2.2 Sensitivity analysis and parameter calibration of SWAT model
This study utilizes measured runoff data from the Yangchang, Longchangqiao, Yachi, and Hongjiadu hydrological stations for parameter sensitivity analyses and model calibration and validation. Parameter sensitivity analyses were performed using the LH-OAT method embedded in the model and measured runoff data from hydrological stations. The results are shown in Table 2, which demonstrates that the most influential parameters for the runoff simulation were: the initial curve number (II) value (CN2), which controls surface hydrological processes under soil moisture condition II (moderately moist soils); available water capacity (SOL_AWC); the soil evaporation compensation factor (ESCO); maximum canopy storage (CANMX); baseflow alpha factor (ALPHA_BF), which controls subsurface hydrological processes; the groundwater delay time (GW_DELAY); threshold water depth in the shallow aquifer for flow(GWQMN); and channel effective hydraulic conductivity (CH_K2), which controls the main stream confluence. Based on the parameter sensitivity results and actual hydrological processes, the adjustable parameters were CN2, SOL_AWC, ALPHA_BF, GWQMN, and CH_K2. These parameters were adjusted several times until the simulated values were close to the measured values. The final values for all parameters are listed in Table 2. For groundwater runoff, previous studies on subsurface hydrological processes in karst areas (recharge, runoff, and discharge) (Amatya et al., 2011; Chen et al., 2014) were examined. Parameters were adjusted and validated several times to ensure accurate simulation results. Eventually, ALPHA_BF and GWQMN were set to 0.048-0.5 and 1000, respectively.
Table 2 Results of the sensitivity analysis and parameter calibration for the SWAT model
Parameters Sensitivity rank Parameter value
Physical significance Code Process YC LCQ CK Default range Adjustment range
SCS runoff curve number under normal moisture conditions CN2 (.mgt) Surface runoff 2 3 5 35-98 50-98
Soil available water content SOL_AWC (.sol) Soil moisture 9 11 8 0-1 0.05-0.16
Baseflow alpha factor ALPHA_BF (.gw) Groundwater 5 14 15 0-1 0.048-0.5
Threshold water level in the shallow aquifer for groundwater to enter the main stream (mm) GWQMN (.gw) Groundwater 7 4 4 0-5000 1000
Channel effective hydraulic conductivity (mmh-1) CH_K2 (.rte) Interflow 6 1 1 0-150 0-25
The Nash-Sutcliffe efficiency, Ens, coefficient of determination, r2, and hydrograph based on measured monthly runoff data for 2008-2010 were applied to evaluate the efficiency of the model and validate the calibration results. Ens values closer to 1 indicate simulation values that are closer to the measured values. Ens was calculated as follows:
${{E}_{ns}}=1-\frac{\sum\limits_{i=1}^{n}{{{({{O}_{i}}-{{P}_{i}})}^{2}}}}{\sum\limits_{i=1}^{n}{{{({{O}_{i}}-\overline{O})}^{2}}}}$ (2)
where Oi, O, Pi, and P are measured values, average measured values, simulated values, and average simulated values, respectively. It is generally believed that Ens within 0.5-0.65 indicates acceptable simulation results. Ens values of 0.65-0.75 and above 0.75 signify relatively good and excellent simulation results, respectively (Popov, 1979).
The results suggest that simulated monthly average precipitation at Longchangqiao station matches the measured values relatively well during the calibration period, with an Ens of 0.82 and an R2 of 0.92 (Figure 3 and Table 3). During the validation period, Ens and R2 are 0.90 and 0.93, respectively. The simulation agrees well with the measurement at Yangchang station during both calibration and validation periods, with corresponding Ens values of 0.70 and 0.73. The simulation results are thus relatively good. In addition, from the hydrograph, the simulated and measured values at Yangchang and Longchangqiao stations are relatively coherent. Furthermore, simulation results at the basin outlet of both stations are not as good as those of Longchangqiao and Yangchang stations. The measured runoff in the discharge areas is estimated based on the difference between Yachi and Hongjiadu stations, which may contribute to the partial discrepancy.
Table 3 Statistical indicators of model performance at the three different monitoring stations of the Sancha River Basin
Hydrological stations Calibration period (2008-2010) Validation period (2011-2013)
Ens R2 Ens R2
Yangchang 0.70 0.84 0.73 0.93
Longchangqiao 0.82 0.92 0.90 0.95
Basin outlet 0.64 0.92 0.50 0.78
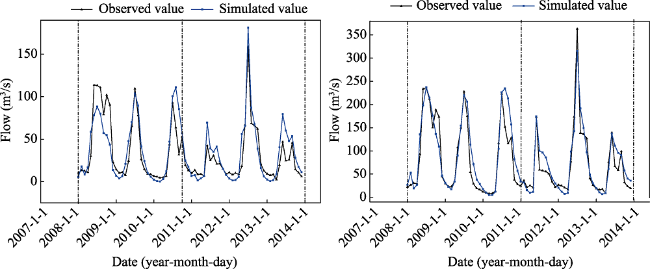
Figure 3 Simulated and observed monthly runoff at Yangchang (left) and Longchangqiao (right) station (Calibration period: 2008-2011; Verification period: 2011-2014)

3.3 Landscape fragmentation index

This study used the NDVI vegetation index to examine the spatial heterogeneity of runoff generation, and the land use landscape fragmentation index to explain the spatial relationship between runoff service spatial heterogeneity and runoff volumes. The degree of landscape fragmentation was measured using the effective mesh size (Jaeger, 2000), which refers to the average value of the continuous area of each land use type in a landscape. A small value denotes a less fragmented landscape. The landscape fragmentation index can spatially reflect the intensity of land use type variations among different hydrological response units (HRUs). In more fragmented areas, there are remarkable differences in land use types between neighboring HRUs. The index integrates ecological processes, landscape compositions, and spatial patterns, and can therefore comprehensively and objectively express the degree of fragmentation (Gao and Cai, 2010). The equation is as follows:
${{m}_{eff}}(j)={{A}_{j}}\cdot \sum\limits_{i=1}^{n}{{{(\frac{{{A}_{ij}}}{{{A}_{j}}})}^{2}}}=\frac{1}{{{A}_{j}}}\sum\limits_{i=1}^{n}{{{A}_{ij}}^{2}}$ (3)
where m(j), n, Aij, and Aj denote the effective mesh size of landscape j, the number of complete patches in landscape j, the area of patch i in landscape j, and the area of landscape j, respectively. If the minimum of the index equals the size of the grid, it indicates that land use types are different for all neighboring grids. If the maximum equals the landscape area, it suggests that the landscape is of a homogeneous type. This study used the ‘moving window’ analysis (research amplitude) in the landscape pattern analyzing software FRAGSTATS (McGarigal and Marks, 1995) to compute the effective mesh size.
Based on the 30-m land use data (2010) in the Sancha River Basin (Figure 2b), it demonstrates that areas with high and low landscape fragmentation indices are scattered all over the region. The total area of low-value (highly fragmented) regions is larger than that of high-value regions. High-value areas are mainly located along the upstream region with higher elevations and less anthropogenic interference. Low-value areas are concentrated in the mid- and downstream regions.

3.4 Geographically weighted regression

Geographically Weighted Regression (GWR), proposed by Brunsdon et al. (1996; 1998), is a simple and practical local spatial analysis technique. GWR depicts the internal spatial relationships in the study area. In this study, it was used to reveal the spatial relationships of runoff volume with landscape fragmentation indices and the NDVI vegetation index under linear non-stationary conditions. The GWR model is an extension of the traditional regression model. It uses the spatial locations of data as one of the parameters, and evaluates spatial variations in independent variable-dependent variable relationships through using parameters.
The basic form of the GWR model is:
${{y}_{i}}={{\beta }_{0}}({{\mu }_{i}},{{\nu }_{i}})+\sum\limits_{k=1}^{p}{{{\beta }_{k}}({{\mu }_{i}},{{\nu }_{i}})}{{x}_{ik}}+{{\varepsilon }_{i}}$ (4)
where (μi, vi) and k represent the coordinates of the ith sampling point and the number of independent variables, respectively; yi, xik, and εi are the independent variables (total, surface, and groundwater runoff volumes), dependent variables (landscape fragmentation index and NDVI), and random errors at regression point i, respectively. β0(μi, vi) and βk(μi, vi) denote the intercept and slope of the GWR model at regression point i, respectively. The parameters can be estimated using the following formula:
$\beta ({{\mu }_{i}},{{\nu }_{i}})={{({{X}^{T}}W({{\mu }_{i}},{{\nu }_{i}})X)}^{-1}}{{X}^{T}}W({{\mu }_{i}},{{\nu }_{i}})Y$ (5)
where β(μi, vi) and W(μi, vi) are, respectively, the unbiased estimator of the regression coefficient and the spatial weighting matrix, which is the core of the GWR model; the weight increases when the observation point is closer to the defined point. X and Y are the matrices for independent and dependent variables, respectively.
The Gaussian Spatial Weight function is universal, and its expression formula is as follows:
${{\omega }_{ij}}=\exp \left( -\frac{d_{ij}^{2}}{{{b}^{2}}} \right)$ (6)
where ωij, dij, and b denote the weight of observation point j, the Euclidean distance between regression point i and observation point j, and the non-negative attenuation parameter describing the weight-distance function relationship (also called bandwidth), respectively. When the distance between observation points is greater than b, the weight rapidly approaches 0.

4 Results and analysis

4.1 Spatial pattern of runoff services in the Sancha River Basin

The spatial patterns of runoff generation in the Sancha River Basin, including total runoff volume (TOTAQ), surface runoff (SURQ), and groundwater runoff (GWQ), are obtained using the SWAT model. In addition, because evapotranspiration significantly affects water balance, this study also analyzes the simulation results of actual evapotranspiration (ET). The average total runoff volume over the study period is higher in the north and lower in the south of the Sancha River Basin (Figure 4a), and fluctuates within 510-1177 mm, with an average of 826.4 mm. The total runoff coefficient reaches 70%. Areas with higher total runoff volumes (900-1100 mm) are mostly located in the east and the north, and cover 22% of the basin. The total runoff volume in the south of the basin is smaller and mostly within 500-700 mm.
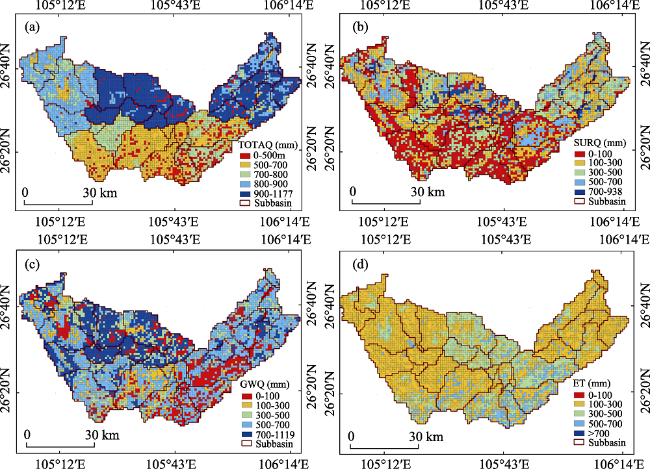
Figure 4 Spatial pattern of TOTAQ (a), SURQ (b), GWQ (c), and ET (d) in the Sancha River Basin
The overall surface runoff is relatively low in the river basin, with an average value of 276 mm, and shows remarkable spatial heterogeneity. The surface runoff coefficient is 23.9%. Surface runoff in 50% of the river basin is between 0 and 300 mm, and mainly located in the southern portion. Areas with more than 300 mm runoff are scattered in the east and the north. This is because the Sancha River Basin is situated in a typical karst area, and surface runoff patterns are highly heterogeneous. The unique surface-subsurface binary hydrological structures cause a considerable amount of surface water loss to the subsurface. Hence, there is relatively abundant subsurface runoff in the river basin (Figure 4c). Approximately 60%-70% of the region has an underground runoff volume of 500-700 mm. Underground runoff volume in upstream areas is typically over 500 mm.
The actual evapotranspiration amounts show no significant differences over the river basin. Most areas in upstream and downstream regions experience evapotranspiration of 100-300 mm (Figure 4d), covering 53% of the total area. Evapotranspiration is 300-500 mm in certain parts of central and southern regions. Compared to the spatial patterns of different runoff types, the distribution of actual evapotranspiration is relatively homogeneous in the Sancha River Basin. This is because evapotranspiration is mostly influenced by temperature, precipitation, wind speed, and vegetation type (Borba et al., 2012). The DEM data (Figure 1) show 70% of the area is within the range of 900 to 1500 m and no remarkable differences in temperature and wind speeds over the study area. Coniferous forests and shrubs are the dominant vegetation types (more than 80%), which results in relatively low spatial heterogeneity of evapotranspiration.

4.2 Gradient analysis of runoff generation based on topographic factors

Elevation in the Sancha River Basin ranges between 911 and 2330 m. The corresponding average values and coefficients of variation for the total runoff volume, surface runoff, underground runoff, and actual evapotranspiration at elevation gradients of 911-1000 m, 1000-1500 m, and 1500-2330 m are obtained. Figure 4 and Table 4 show that variations in the total runoff volume with elevation are small (803-882 mm), and fluctuations in the coefficient of variation are insignificant (0.09-0.21), while surface runoff variations are relatively large. At elevations of 911-1000 m, the surface runoff is 401 mm and the coefficient of variation is 0.52. As the elevation increases, the surface runoff decreases to 154 mm and the coefficient of variation increases to 0.85. The average value of underground runoff gradually increases at higher elevation. The actual evapotranspiration exhibits no difference at different elevation gradients. In general, elevation has significant effects on surface and underground runoff in the Sancha River Basin. The percentage of underground runoff increases with elevation, while that of surface runoff decreases.
The gradient analysis of slope (Table 4) indicates that the total runoff volume increases on steeper slopes. The surface runoff first increases and then decreases with increasing slope. It reaches a maximum (319 mm) on slopes from 5-10°. For a slope range of 0-10°, the surface runoff increases with slope. The force in the water layer along the slope surface increases, and the pressure perpendicular to the slope surface decreases. This leads to a smaller infiltration rate and greater surface runoff. As the slope becomes steeper, the vertical action force exerted by precipitation on the ground surface is smaller, and soil crust formation is slower, resulting in less surface runoff. This is similar to the law of runoff generation on karst slopes studied by Hu et al. (2012), whereby groundwater runoff essentially increases on steeper slopes. The highest runoff value is 629 mm. For steeper slopes, the vertical action force exerted by precipitation on the ground surface is smaller, and underground runoff increases at slower rates (Wu and Zhang, 2006). In different slope ranges, the average actual evapotranspiration fluctuates between 222 and 259 mm.
Table 4 Runoff and evapotranspiration based on different elevations of hydrological response units (HRUs) in the Sancha River Basin
Terrain factors Total flow (mm) Surface runoff (mm) Groundwater (mm) Evapotranspiration (mm)
Element Gradient Percentage area Average CV Average CV Average CV Average CV
Elevation (m) 911-1000 1.8% 882 0.09 401 0.52 481 0.52 212 0.28
1000-1500 64.2% 803 0.17 310 0.75 493 0.48 251 0.27
1500-2330 34.0% 882 0.15 154 0.85 591 0.42 245 0.27
Slope (°) 0-5 61.9% 825 0.17 301 0.80 523 0.46 253 0.27
5-10 24.5% 838 0.16 319 0.72 519 0.46 241 0.27
10-15 12.3% 881 0.15 303 0.75 578 0.49 227 0.27
15-24 1.3% 863 0.21 233 0.85 629 0.44 222 0.28

4.3 Spatial statistical relationship between land cover and runoff services

4.3.1 Statistical characteristics of runoff services under different land cover conditions
Vegetation cover influences runoff by reducing the kinetic energy of raindrops, intercepting precipitation, modifying soil crusts, and altering soil infiltration capacity (Wu and Zhang, 2006). The total runoff volumes are similar for the five land use types, and all fluctuations are within 718-850 mm. Total runoff volumes for grassland are slightly lower. There are relatively significant differences in surface and underground runoff among the different land use types. In particular, industrial and commercial land experiences the highest surface runoff (544 mm), followed by farmland. Commercial and industrial land is dominated by heavy human activities and impermeable layers in urban areas, which substantially weaken the capacity of soil to retain and store water. Consequently, most precipitation becomes surface runoff. Meanwhile, underground runoff shows the opposite trend. It accounts for more than 70% of the total runoff in orchard and forest land underground, and is the highest in forests (628 mm). Soils in forests have better physical structures, higher permeability, and the litterfall excels at retaining water (Shi and Li, 2001). Moreover, forests are often located in higher-altitude and steeper regions.
Vegetation cover conditions affect the hydrological processes and runoff generation in the river basin by changing surface evaporation, soil moisture conditions, and interception of land cover. The NDVI in the Sancha River Basin is divided into three classes: <0.5, 0.5-0.7, and >0.7, and the corresponding runoff for each NDVI gradient is analyzed. Figure 5 shows that the total runoff and underground runoff increase with higher NDVI, while the surface runoff increases at first but subsequently decreases (259-319-282 mm). This is because improved vegetation cover conditions reduce with limits resulting in water loss, which is due to surface-subsurface binary hydrological structures. As NDVI continues to rise, interception by the vegetation canopy increases and transpiration becomes stronger, and the soils can retain and store more water, which decreases surface runoff.
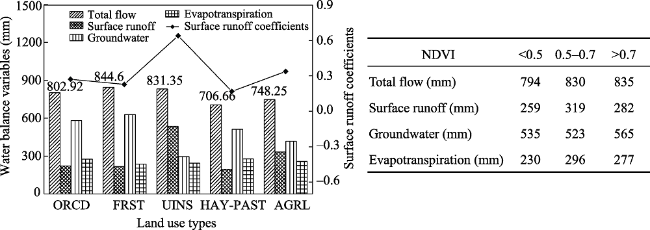
Figure 5 Runoff generation of different land use types in the Sancha River Basin
4.3.2 Spatial correlation between landscape fragmentation, vegetation cover, and runoff generation
Based on the GWR model, the landscape fragmentation index (meff), and NDVI, the local spatial relationships between land cover and different runoff volume variations are analyzed at the HRU scale (Figure 6). To ensure accurate characterization of macroscopic patterns and local details over the entire study area, R2 and residual sum of squares of regression models are employed as criteria to determine the optimal bandwidth, which is 7 km. The Gaussian function is selected as the weight function. The total runoff volume and the landscape fragmentation index in the Sancha River Basin show mostly positive correlations. Areas with positive correlations occupy 96.5% of the entire region. Negative correlations mainly occur in limited areas in the southeast. Areas with strong positive spatial correlations are located in the south and northeast. The spatial regression relationship between underground runoff volume and the landscape fragmentation index is similar to that of the total runoff volume. 99.9% of the river basin shows positive correlations, and correlations gradually weaken from west to east. A relatively heterogeneous spatial relationship is noted between surface runoff and the landscape fragmentation index; they are mostly negatively correlated (74.2%) in western and central regions. Positive correlations are only observed in limited areas in the east and north. The actual evapotranspiration volume and the landscape fragmentation index demonstrate negative spatial correlations overall (96.9%).
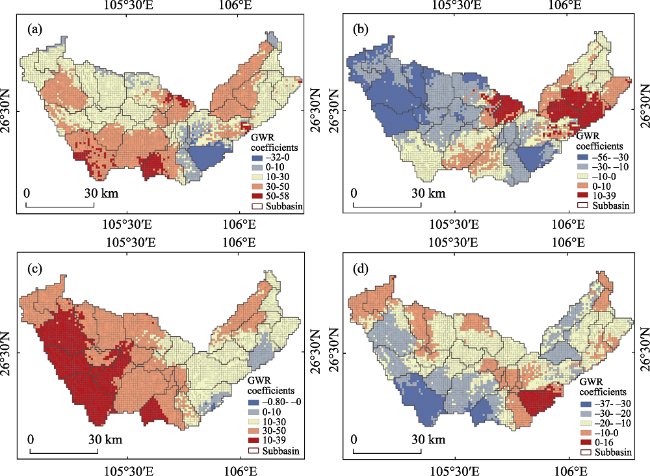
Figure 6 Spatial pattern of regression coefficients using the GWR model of the landscape fragmentation index and water balance components in the Sancha River Basin (a. total flow, b. SURQ, c. GWQ, d. ET)
The spatial non-stationary relationship of the GWR regression coefficient between NDVI and runoff shows remarkable differences in the south and west (Figure 7). In the upstream and midstream regions of the Sancha River Basin, the total runoff volume and NDVI are mostly positively correlated, which accounts for 61.4% of the entire basin. The correlations become negative in the north and the downstream region. The spatial relationship between surface runoff and NDVI is relatively complex, and the positively and negatively correlated areas are scattered throughout the basin. The positively correlated areas cover 67.3% of the entire region, and are mostly located in the western and central regions as well as the outlet of the basin. The underground runoff demonstrates negative correlations with NDVI for 56.4% of the basin. Figures 6 and 7 jointly suggest that areas with relatively better ecological background in the upstream region have higher elevation, less landscape fragmentation, greater NDVI, higher total runoff volume, more underground runoff, and less surface runoff. This indicates relatively effective ecological restoration. 52.5% of the basin shows negative correlations between actual evapotranspiration and NDVI, predominantly in the south and upstream regions.
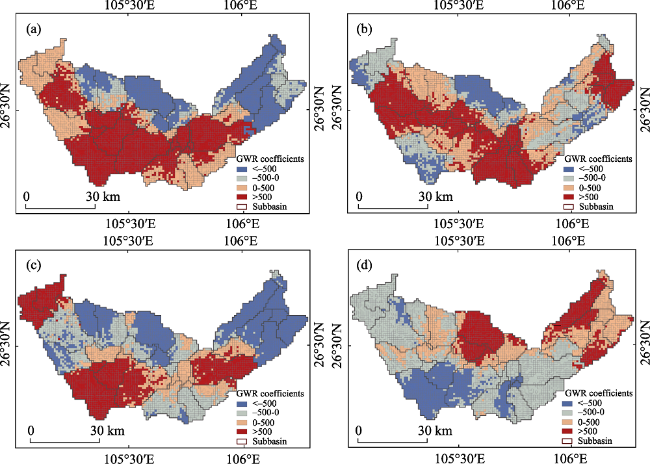
Figure 7 Spatial pattern of regression coefficients using the GWR model of the NDVIand water balance components in the Sancha River Basin (a. TOTAQ, b. SURQ, c. GWQ, d. ET)

5 Conclusions and discussion

Based on the calibrated SWAT model, the runoff services of typical karst basin were simulated, and the spatial variability of different services were analyzed along with the methods of gradient analysis and local regression. The applicability of the SWAT model to the Sancha River Basin was enhanced through sensitivity analyses and parameter calibration. The simulated average total runoff volume is higher in the north and lower in the south, and the total runoff coefficient of the basin is 70%. The surface runoff demonstrates remarkable spatial heterogeneity, and the overall value is relatively low. There is abundant underground runoff, which is closely related to the typical karst topography and surface-subsurface binary hydrological structures. Higher elevations and steeper slopes increase the percentages of total runoff and underground runoff. Vegetation cover conditions impose different influences on runoff generation. Relatively significant differences exist among the effects of vegetation cover types on surface runoff and underground runoff. NDVI is mostly positively correlated with surface runoff generation. Together with the influence of vegetation cover, steeper slopes cause surface runoff to first increase and then decrease. Spatial overlay analyses indicate that total runoff and underground runoff attain their maximum values in forests. This is because forest ecosystems have a stronger soil moisture retention capacity, and water can rapidly infiltrate into the soils in the study area. Moreover, because forests are mainly located at higher elevation, and the slopes are relatively steep, underground runoff is formed easily.
To summarize, in upstream regions of the Sancha River Basin, elevation is the dominant factor affecting total runoff volume and underground runoff, while land cover conditions determine the surface runoff volume. In downstream regions, both topography and elevation affect the total runoff volume and underground runoff. Specifically, orchards (56% of the total area) play an important role in retaining water and modifying evapotranspiration, affecting surface runoff. By studying runoff generation in a typical karst river basin, and their spatial variation characteristics, it is concluded that specifically designed ecological restoration measures (Grain to Green Project in upstream regions, and garden construction in downstream regions) can enhance the total water retention in the region, and reduce the surface runoff volume, therefore strengthening the regional soil conservation capability. Eventually, the capacity of carbon fixation in forests in upstream regions will increase, and the wellbeing for downstream areas can be improved.
This study makes full use of the fact that a semi-distributed hydrological model (SWAT) is based on hydrological processes and requires easily obtainable input data. The most influential parameters for runoff simulation in karst river basins, namely CN2 and ALPHA_BF, were adjusted to attain a final Nash-Sutcliffe efficiency above 0.7. The objective of this study was to analyze the spatial patterns of runoff in the Sancha River Basin, and the spatial statistical relationships with different environmental factors. After parameter calibration and validation, the SWAT model can effectively achieve this goal. Therefore, the SWAT model was employed to simulate the spatial patterns of runoff generation services during the study period. Subsequently, based on the quantification of landscape fragmentation, the GWR model was used to quantitatively examine the spatial correlations between land cover conditions and runoff generation. This study therefore fills the gap in previous research that solely analyzed runoff characteristics based on statistical surveys on different land use types and landscape indices (Lin et al., 2014), and which lacked information on relevant macroscopic patterns. Moreover, although the SWAT model provides superior simulation results after parameter calibration and validation, it is hard to completely avoid equifinality due to the extremely complex hydrological processes and hundreds of parameters involved. It is possible that the final simulation results are satisfactory only because some combinations of parameters reach the ideal levels. Hence, in future, meticulous optimization of hydrological process simulation should be performed, considering the special hydrogeological conditions in karst areas, so that the model better depicts actual hydrological processes in the study area.

Acknowledgements

All the authors thank the Data Center for Resources and Environmental Sciences, Chinese Academy of Sciences (RESDC) and EOS/Terra of National Aeronautics and Space Administration, for producing and sharing the land use and NDVI dataset, respectively.

The authors have declared that no competing interests exist.

[1]
Amatya D M, Jha M, Edwards A Eet al., 2011. SWAT-based streamflow and embayment modeling of karst-affected chapel branch watershed, South Carolina.Transactions of the ASABE, 54(4): 1311-1323.http://elibrary.asabe.org/abstract.asp??JID=3&amp;AID=39033&amp;CID=t2011&amp;v=54&amp;i=4&amp;T=1

DOI

[2]
Bai Xiaoyong, Wang Shijie, 2011. Relationships between soil loss tolerance and karst rocky desertification.Journal of Natural Resources, 26(8): 1315-1322. (in Chinese)http://en.cnki.com.cn/Article_en/CJFDTOTAL-ZRZX201108006.htmTo understand the relationships between soil loss tolerance(T value) and karst rocky desertification(KRD),T value was calculated using digital-distribution map of carbonate rock assemblages types in this paper,based on pedospheric system theory.And the impacts of T value on KRD were discussed also based on GIS and field survey comprehensively.The results showed that:1) T values in karst areas can be divided into three categories,which are 20,100 and 250 t·km-2·a-1 respectively in the purest,purer and nonpure carbonate rock areas but only less than 20 t·km-2·a-1 in rocky mountain region.2) In the three carbonate areas where T=20,100 and 250 t·km-2·a-1 respectively,KRD incidence rates are 29.86%,28.12% and 23.25% with KRD severity being 73.55%,60.57% and 52.19%.Therefore,T value in karst areas is very low,and has such characteristics as diversity and heterogeneity in spatial distribution.T value has great impacts on incidence rate and severity of rocky desertified land.In the same social context,or neglecting the differences of human activities,the lower T value is,the smaller the threshold,the weaker anti-jamming capability is,the higher KRD incidence rate is,and the more KRD severity is.

DOI

[3]
Beven K J, Kirkby M J, Schofield N et al. , 1984. Testing a physically-based flood forecasting model (TOPMODEL) for three U.K. catchments.Journal of Hydrology, 69(1): 119-143.https://linkinghub.elsevier.com/retrieve/pii/0022169484901598A previously developed model has been tested on three catchments: Crimple Beck (8 km 2) near Harrogate, Hodge Beck (36 km 2) on the North York Moors and the Wye headwater (10.5 km 2) in central Wales. The model was originally validated on subcatchments within Crimple Beck. For this study forecasts were made over a period of one year, based only on rainfall and evaporation data. The model parameters were derived from a defined program of field measurements over a period of 2鈥4 weeks, and no formal optimization procedures were carried out before comparing forecasts with the measured stream discharge record. As a result of the comparisons, the model is seen as a useful approach for ungauged catchments of up to 500 km 2 in humid-temperature climates.

DOI

[4]
Borba B S M C, Szklo A, Schaeffer R, 2012. Plug-in hybrid electric vehicles as a way to maximize the integration of variable renewable energy in power systems: The case of wind generation in northeastern Brazil.Energy, 37(1): 469-481.https://linkinghub.elsevier.com/retrieve/pii/S0360544211007262Several studies have proposed different tools for analyzing the integration of variable renewable energy into power grids. This study applies an optimization tool to model the expansion of the electric power system in northeastern Brazil, enabling the most efficient dispatch of the variable output of the wind farms that will be built in the region over the next 20 years. The expected combined expansion of wind generation with conventional inflexible generation facilities, such as nuclear plants and run-of-the-river hydropower plants, poses risks of future mismatch between supply and demand in northeastern Brazil. Therefore, this article evaluates the possibility of using a fleet of plug-in hybrid electric vehicles (PHEVs) to regularize possible energy imbalances. Findings indicate that a dedicated fleet of 500 thousand PHEVs in 2015, and a further 1.5 million in 2030, could be recharged overnight to take advantage of the surplus power generated by wind farms. To avoid the initial costs of smart grids, this article suggests, as a first step, the use of a governmental PHEV fleet that allows fleet managers to control battery charging times. Finally, the study demonstrates the advantages of optimizing simultaneously the power and transport sectors to test the strategy suggested here.

DOI

[5]
Brunsdon C, Fotheringham A S, Charlton M, 1996. Geographically weighted regression: A method for exploring spatial nonstationarity.Geographical Analysis, 28(4): 281-298.http://onlinelibrary.wiley.com/doi/10.1111/j.1538-4632.1996.tb00936.x/fullSpatial nonstationarity is a condition in which a simple 090008global090009 model cannot explain the relationships between some sets of variables. The nature of the model must alter over space to reflect the structure within the data. In this paper, a technique is developed, termed geographically weighted regression, which attempts to capture this variation by calibrating a multiple regression model which allows different relationships to exist at different points in space. This technique is loosely based on kernel regression. The method itself is introduced and related issues such as the choice of a spatial weighting function are discussed. Following this, a series of related statistical tests are considered which can be described generally as tests for spatial nonstationarity. Using Monte Carlo methods, techniques are proposed for investigating the null hypothesis that the data may be described by a global model rather than a non-stationary one and also for testing whether individual regression coefficients are stable over geographic space. These techniques are demonstrated on a data set from the 1991 U.K. census relating car ownership rates to social class and male unemployment. The paper concludes by discussing ways in which the technique can be extended.

DOI

[6]
Brunsdon C, Fotheringham A S, Charlton M, 1998. Geographically weighted regression: Modelling spatial non-stationarity.Journal of the Royal Statistical Society Series D: The Statistician, 47(3): 431-443.http://www.jstor.org/stable/2988625In regression models where the cases are geographical locations, sometimes regression coefficients do not remain fixed over space. A technique for exploring this phenomenon, geographically weighted regression is introduced. A related Monte Carlo significance test for spatial non-stationarity is also considered. Finally, an example of the method is given, using limiting long-term illness data from the 1991 UK census.

DOI

[7]
Chen Hongsong, Nie Yunpeng, Wang Kelin, 2013. Spatio-temporal heterogeneity of water and plant adaptation mechanisms in regions: A review.Acta Ecologica Sinica, 33(2): 317-326. (in Chinese)http://en.cnki.com.cn/Article_en/CJFDTOTAL-STXB201302002.htmKarst ecosystem is very fragile and sensitive to environmental change.China has the largest karst area(344.3 104 km2) with the widest distribution and highest landform diversity in the world,mainly or primarily concentrating in the southwest(about 55 104 km2).The karst region of southwest China is geology-controlled eco-environment,and the basic characteristics include the shortage of surface water and soil resources,low vegetation coverage and high diversity of microhabitats.Due to special geological background,intensive karst process and recent irrational land uses,both vegetation destruction and soil and water loss are increasingly serious in karst region of southwest China.This results in karst desertification,a process of land degradation involving extensive exposure of basement rocks and drastic decrease in soil productivity.Karst desertification has been leading to the concentrated poverty population and the lack of cultivated land.The karst region of southwest China,the crucial area for the West Development in China,is easy to plunge into a vicious circle between poverty and environmental degradation.Therefore,how to rehabilitate vegetation effectively and to utilize soil and water resources harmoniously are the primary problems for the comprehensive control of karst desertification in this region.Although rainfall is abundant,surface water is leaked heavily and groundwater is buried deeply due to dual hydrological structure in karst region of southwest China.Karst drought is serious and water deficit is still the primary factor for influencing vegetation restoration due to discontinuous shallow soils and low soil storage capacity.Thus,study on spatio-temporal heterogeneity of water and plant adaptation mechanisms is very important for vegetation restoration in karst region of southwest China.Water movement in karst region is significantly different from other kinds of region because of special geological background,complex landform and high heterogeneous habitat,and the effects of lithology,topography,the soil-rock distribution and vegetation should be considered altogether.Although many advances have been achieved on hillslope rainfall infiltration and runoff generation,spatial variability of soil water,adaptation of plants to water stress in different habitats,the current researches can not illustrate the difference of water status in various soil-rock environments and the corresponding adaptation mechanisms in karst regions.This heavily affects the achievement of vegetation restoration and reconstruction.In this paper,on the basis of the simple introduction to the characteristics of soil-rock environment,the research advances on rainfall infiltration and runoff generation,spatio-temporal variability of soil water,plant water sources and its adaptation mechanisms were summarized in karst regions.The further study should attach importance to investigate the relationship between water movement in soils and fractured rocks and plant water utilization,and to survey the effects of various environmental factors on eco-hydrological processes in the atmosphere-plant-soil-rock system.In order to reveal the interactive mechanism of vegetation and hydrological processes at hilllsope and catchment scales in karst areas,the multi-disciplinary research methods and techniques,including soil physics,eco-hydrology,plant physiology and karstology,should be applied to discuss the hydrological regulation function of epikarst and its primary influencing factors.These studies would provide scientific basis for optimal disposition of plant community with water-conserving function in karst region of southwest China.

DOI

[8]
Chen Xi, Zhang Zhicai, Rong Li et al., 2014. Process of Water Cycle and Effect of Eco-hydrology in the Karst Region of Southwestern China. Beijing: Science Press. (in Chinese)

[9]
Costanza R, D’Arge R, Groot R Det al., 1997. The value of the world’s ecosystem services and natural capital.Nature, 387(15): 253-260.

DOI

[10]
Dai Quanhou, Peng Xudong, Yang Zhi et al., 2017. Runoff and erosion processes on bare slopes in the karst rocky desertification area.Catena, 152: 218-226.https://linkinghub.elsevier.com/retrieve/pii/S034181621730020661Soil & water loss in underground pore fissure is the special pattern in karst region.61Surface runoff was easier generated for greater rainfall intensity compared with underground.61Surface runoff yield increased with increasing rainfall duration while underground decreased.61Surface & underground sediment yield first decreased and increased with increasing bed rock bareness rate.61Underground runoff and sediment increased with increasing underground pore fissure degree.

DOI

[11]
Daily G C, 1997. Nature’s Services: Societal Dependence on Natural Ecosystems. Washington, DC: Island Press.

[12]
Fischer G F, Nachtergaele S, Prieler H T et al., 2008. Global agro-ecological zones assessment for agriculture (GAEZ 2008). IIASA, Laxenburg, Austria and FAO, Rome, Italy.

[13]
Fu Bojie, Wang S, Su C Het al., 2013. Linking ecosystem processes and ecosystem services.Current Opinion in Environmental Sustainability, 5(1): 4-10.https://linkinghub.elsevier.com/retrieve/pii/S1877343512001893The metaphor of ecosystem service may blind us to the complexity of the natural systems which underpin and produce services. We reviewed key references and propose a framework to illustrate the social system relying on the ecological system and the relationships between ecosystem composition, ecosystem structure, ecosystem processes and ecosystem services, in order to reduce this complexity. We argue that plans to manage ecosystem services will not be successful without a deep understanding of their link with the ecosystem processes that support them. By linking ecosystem processes and ecosystem services, we explore the possible determinants of the biodiversity components on the quantity, quality and reliability of ecosystem services at all levels, and its usefulness in making targeted decisions. Disentangling the complex interrelationships among multiple ecosystem services from the driven processes is helpful in lowering the risk of unwanted trade-offs, and taking advantage of synergies. In landscape management, it is advisable to design suitable ecosystem structures for maximizing ecosystem services based on knowledge of the natural ecosystem processes.

DOI

[14]
Fu Bojie, Yu Dandan, 2016. Trade-off analyses and synthetic integrated method of multiple ecosystem services.Resources Science, 38(1): 1-9. (in Chinese)http://www.en.cnki.com.cn/Article_en/CJFDTotal-ZRZY201601001.htmEcosystem services are the benefits that people obtain from ecosystems.Research on ecosystem services has been a hotpot in the fields of ecology,geography and environmental sciences since 1990 s.Towards a better understanding of ecosystem services and a strengthened linkage between science and policy,Intergovernmental Platform for Biodiversity and Ecosystem Services(IPBES)was established officially by the United Nations General Assembly in 2012.To date,IPBES has built a conceptual framework for assessment of ecosystem services,and determined the main tasks,including three rapid assessments and two assessments for policy decision.To provide insights into the main tasks,we synthesized trade- off analyses and synthetic integrated method of multiple ecosystem services,and took the Loess Plateau as a case to identify the potential and effectiveness of the above method.The results showed that there was a positive relationship between land use and soil conservation,carbon sequestration,while there was a negative relationship between land use and water yield.In addition,the grain productive capacity was closely related to agricultural production condition,artificial input and technical progress.As trade- off and synergy among the multiple ecosystem services are scale- dependent,more research should be carried out in the aspects of regional suitability assessment of vegetation restoration and water effect.

[15]
Fu Bojie, Zhang Liwei, 2014. Land-use change and ecosystem services: Concepts, methods and progress.Progress in Geography, 33(4): 441-446. (in Chinese)http://en.cnki.com.cn/Article_en/CJFDTotal-DLKJ201404001.htmAs a frontier and hot topic in ecology and geography,the study of ecosystem services has attracted the interest of many scholars and research institutions.By changing the structure and processes of ecosystems,landuse change affects the provisioning capability of ecosystems for products and services.Study of the relationships between ecosystem processes and services,the relationships among multiple ecosystem services,and the integration and optimization of these services at the regional scale in the context of land-use change urgently needs to be enhanced.The results of such research will be critically important for informing and supporting activities of ecosystem management.This paper introduces the concepts and methods of the study of land-use change and ecosystem services and discusses the shortcomings of existing studies and future prospects of land-use change and ecosystem services research.

DOI

[16]
Gao Jiangbo, Cai Yunlong, 2010. Spatial heterogeneity of landscape fragmentation at multi-scales: A case study in Wujiang river basin, Guizhou Province, China.Scientia Geographica Sinica, 30(5): 742-747. (in Chinese)http://en.cnki.com.cn/Article_en/CJFDTOTAL-DLKX201005017.htmEffectively revealing landscape pattern and its spatial heterogeneity are basic for researches of landscape function and dynamic.Based on the land use classification data,this paper explored the spatial pattern,spatial heterogeneity and its scale-dependence for effective mesh size using ArcGIS 9.3,FRAGSTATS 3.3 and GS + 7.0,with a case study of Wujiang River Basin in Guizhou Province,China.The results show that the relation between spatial heterogeneity of landscape fragmentation and extent exhibits significant power law with a characteristic scale of 4590 m.The regions with lower values of effective mesh size are the northeast mountainhill area,the west of central hill-basin area and the north of west plateau-mountain area,which possess the similar characteristic of dissected topography;the regions with higher values of effective mesh size are the east of central hill-basin area and the north of west plateau-mountain area with comparatively subdued topography.The structural components such as topography and climate play the main role in the spatial heterogeneity;the data series is complex due to the influences of topography,climate,and human activities,and exhibits significant spatial auto-correlation with range of 33 km.The fractal dimensions are bigger,and the auto-correlation scales are smaller in the directions of northeast-southwest and east-west than the north-south and southeast-northwest directions.Isotropic heterogeneity and anisotropic heterogeneity are in accordance with the physical geographical characteristics.The results can provide a basis for biodiversity conservation,land use management and regional landscape planning and construction.

DOI

[17]
Hu Yi, Dai Quanhou, Wang Peijiang, 2012. Runoff features and the influencing factors on karst sloping farmland.Journal of Soil and Water Conservation, 26(6): 46-51. (in Chinese)http://en.cnki.com.cn/Article_en/CJFDTOTAL-TRQS201206011.htmThis paper chose the Karst area of southwest China as the research region,took yellow soil for test,through the Karst slope surface simulation runoff process of artificial rainfall experiment,to explore the runoff characteristics and the influencing factors,Results are as follows:(1)Surface runoff had very significant positive correlation with rainfall intensity,and negatively correlation with underground crevasse ratios,rocks cover rate.Underground crevasse flow was positively related with rainfall intensity,underground crevasse ratios and rocks cover rate,but its relevance was weak.Along with the increase of the slope,the surface flow in first increased,then decreased,while underground crevasse flow continued to decrease.(2)The influencing degree's order of factors to surface runoff was: Rainfall intensity slope underground crevasse ratios rocks cover rate,that to the underground runoff was: The slope rainfall intensity underground crevasse ratios rocks cover rate.(3)The overall features of runoff rate with the change of time was that the first increased rapidly,and then slowly decreased,and the last,in the 50~60 minutes later became stable trend.The underground runoff with the growth of the rainfall duration revealed a decreasing trend,but under different level of the factors,the rate of surface and underground runoff had a great difference with the change of time.

[18]
Jaeger J A G, 2000. Landscape division, splitting index, and effective mesh size: New measures of landscape fragmentation.Landscape Ecology, 15(2): 115-130.http://link.springer.com/10.1023/A:1008129329289

DOI

[19]
Li Shuangcheng, 2014. The Geography of Ecosystem Services. Beijing: Science Press. (in Chinese)

[20]
Li Zhou, Gao Kaimin, Liu Jinchunet al., 2016. Growth response of two annual herb species to alternating drying-wetting and nitrogen addition in the karst area of Southwest China.Acta Ecologica Sinica, 36(11): 3372-3380. (in Chinese)

[21]
Lin Bingqing, Chen Xingwei, Chen Ying et al., 2014. Simulations and analysis on the effects of landscape pattern change on flood and low flow based on SWAT model.Acta Ecologica Sinica, 34(7): 1772-1780. (in Chinese)

[22]
Liu Changming, Du Wei, 1985. An application of system analysis to water allocation in the first-stage project of the east-route water transfer in China.Geographical Research, 4(3): 81-88. (in Chinese)http://en.cnki.com.cn/Article_en/CJFDTOTAL-DLYJ198503011.htmThe present paper mainly deals with water allocation in the First-Stage Projeet of the East-Route Water Transfer in China on the basis of system analysis from geographical point of view. According to water-heat budget of the water transfer regions, the water allocation can be estimated geographicallyby an index of aridity.where. P = precipitation; Eo = potential evaporation. As for the value T, it is referred to as the water allocation from the geographical point of view. The T also depends on Agricultural and industrial sectors and water consumption of urban and rural population.The objective function is obtained as follows.It's the subject of water consumption from all the sectors of water user. Finally, this paper illustrates the results calculated by the output of the presented model. 1, Water allocation varies nonlinearly in accordance with the magnitude of water diversion; 2, Two major water supply sections would be found in northern Jiangsu and southwestern Shandong Provinces respectively and 3 , Water allocation should be subjected to the benefit of environmental ecosystems

DOI

[23]
Liu Jiyuan, Kuang Wenhui, Zhang Zengxiang et al., 2014. Spatiotemporal characteristics, patterns and causes of land use changes in China since the late 1980s.Acta Geographica Sinica, 69(1): 3-14. (in Chinese)

[24]
Lv Leting, Peng Qiuzhi, Guo Yuanyuanet al., 2014. Runoff simulation of Dongjiang river basin based on the soil and water assessment tool. Journal of Natural Resources, 29(10): 1746-1757. (in Chinese)http://en.cnki.com.cn/Article_en/CJFDTotal-ZRZX201410010.htmThe Dongjiang River(East River) is one of the three major tributaries of the Pearl River in southern China. It is also the vital water source for lots of important cities, such as Hong Kong, Shenzhen and Dongguan. Changes of runoff will have a significant impact on the environmental security and economic development of this region. A distributed hydrological cycle model of Dongjiang River Basin was developed based on the SWAT model(Soil and Water Assessment Tool) and the hydrological cycle of 51 years(1960-2010) was simulated. The"Sequential Uncertainty Fitting Algorithm"(SUFI- 2) was used to calibrate/validate and analyze the uncertainty of the model. Firstly, the monthly flow data from 1960 to 1985 of the four main hydrometric stations was used to calibrate. Then the model was validated with the monthly flow data from 1986 to 2010. And prediction uncertainties were quantified by P-factor and Rfactor. Model performance varied from weak at Heyuan to satisfactory at Longchuan, Lingxia and Boluo(outlet of the basin). This is because Heyuan hydrologic station was located closely to Xinfengjiang Reservoir, the largest reservoir in Guangdong Province. The results(coefficient of determination, Nash-Sutcliffe efficiency) of calibration and validation at Boluo station were0.83, 0.83 and 0.84, 0.84 respectively. The P-factor and R-factor at Boluo were 0.76, 0.54 and 0.74, 0.59 respectively. On the whole, the model performed well, and then the spatial difference of the hydrological processes was discussed. The runoff depth of Dongjiang River Basin was affected mainly by precipitation, ascending from the north to the central and descending from the central to the south. Hydrological characteristic of basin underlayer(slope, vegetation, soil,etc.) also affects the processes of runoff generation. For example, soil moisture differs significantly from the north to the south. In the north more rain turned into soil water because of the high forest coverage and the soil properties. This is conducive to water conservation and soil conservation. And also, the evapotranspiration accounted for the largest proportion of rainfall in the north attributed to the impact of forest cover.

DOI

[25]
Mcgarigal K, Marks B J, 1995. FRAGSTATS: Spatial analysis program for quantifying landscape structure. Dolores Po Box, 351.http://xueshurefer.baidu.com/nopagerefer?id=17371ea64d354387bec412f84bec9b83

[26]
Mcmichael C E, Hope A S, Loaiciga H A, 2006. Distributed hydrological modeling in California semi-arid shrublands: MIKESHE model calibration and uncertainty estimation. Journal of Hydrology, 317(3): 307-324.https://linkinghub.elsevier.com/retrieve/pii/S0022169405002866The Generalized Likelihood Uncertainty Estimation (GLUE) methodology is used for model calibration, testing and predictive uncertainty estimation in the application of the MIKE SHE hydrologic model for estimating monthly streamflow in a semi-arid shrubland (chaparral) catchment in central California. Monte Carlo simulation is used to randomly generate one thousand parameter sets for a 20-year calibration period encompassing variable climatic and wildfire conditions, from which behavioural (acceptable) MIKE SHE parameter sets are identified and 5% and 95% uncertainty bounds for monthly streamflow are calculated. This group of behavioural parameter sets is subsequently used to predict streamflow and to construct uncertainty bounds for a 12-year test period with climatic and fire characteristics different from those of the calibration period. More than two-thirds of the observations in each period fell within the corresponding uncertainty bounds, suggesting a similar level of model performance in the calibration and test periods. Prediction errors (i.e. observations falling outside the uncertainty bounds) were generally associated with large rainfall and wildfire events and are indicative of deficiencies in model structure, uncertainty in input data, and/or errors in observed streamflow. The effect of uncertainty in remote sensing-based LAI model inputs on the uncertainty associated with MIKE SHE streamflow predictions receives special attention in this work due to the fire-prone nature of the study area and the increasing use of remotely sensed LAI estimates in distributed hydrological modelling applications. Results from MIKE SHE simulations for seven LAI input scenarios (including the baseline LAI sequence used in the model calibration and testing phase of this study) indicate that differences in predictive uncertainty between scenarios are usually less than 10%. This is evidence that the baseline LAI trajectory is generally appropriate for distributed hydrological modelling of chaparral catchments.

DOI

[27]
Millennium Ecosystem Assessment (MEA), 2005. Ecosystems and Human Well-Being. Washington DC: Island Press.

[28]
Pan Shibing, Lu Jingxuan, 2010. Karst groundwater exploitation in Southwest and countermeasure to cope with drought.China Water Resources, 13: 40-42. (in Chinese)http://en.cnki.com.cn/Article_en/CJFDTOTAL-SLZG201013024.htmThe severe drought,happened in Southwest during 2010,basically distributes in Karst areas.For the lack of precipitation during drought season and shortage of surface water,Karst groundwater is the only water source for residents in the mountain area.It discusses the distribution law of Karst groundwater,exploitation condition,exploitation model,as well as the major problems existing.For the severe reality of engineering water shortage exposed by this drought,it proposes to stand on high of overall economic and social development strategy with poverty alleviation of people in the regional of the mountain and ecological environment restoration,to strengthen the usage of Karst groundwater.Reserving Karst groundwater sources and corresponding emergency water supply support system should be considered especially,to cope with exceptionally severe drought disaster.

[29]
Peng T, Wang S J, 2012. Effects of land use, land cover and rainfall regimes on the surface runoff and soil loss on karst slopes in southwest China.Catena, 90(1): 53-62.https://linkinghub.elsevier.com/retrieve/pii/S034181621100193778 Surface runoff and soil loss on the karst hill slopes were very small. 78 Runoff and soil loss were affected by land use, land cover and rainfall regimes. 78 Antecedent precipitation could promote runoff and soil loss on limestone slopes. 78 Due to the low soil formation rates, soil erosion risk was quite high.

DOI

[30]
Popov E G, 1979. Gidrologicheskie Progonozy (Hydrological Forecasts). Leningrad: Gidrometeoizdat.

[31]
Shi Peili, Li Wenhua, 2001. Influence of forest cover change on hydrological process and watershed runoff.Journal of Natural Resources, 16(5): 481-487. (in Chinese) Forest cover change plays an important role in regulating water distribution in forest and watershed runoff.Literature review and analysis of the influence of forest cover change on hydrological process and runoff showed that deforestation or forest fire can reduce the capabilities of rainfall interception in canopythroughfall interception and water conservation in litter layer and soil infiltration and water storage.The influence of forest cover change on watershed runoff presented diverse patterns in different regions.Howevera primary conclusion can be reached is that deforestation will reduce forest transpiration and enhance runoff except the Yangtze River showed a contradictory case. With similar effect forest fire will reduce vegetation transpiration and increase watershed runoff.

[32]
Southwestern China.Beijing: Science Press, 2014. (in Chinese)

[33]
Tian Y, Wang S, Bai X et al., 2016. Trade-offs among ecosystem services in a typical karst watershed, SW China.Science of the Total Environment, s566/567: 1297-1308.http://www.sciencedirect.com/science/article/pii/S004896971631128761We developed an integrated model to quantify ecosystem services by coupling CASA and SWAT.61Cultivated field shrinkage, pasture and forest land expansion were observed during 2000–2010.61The sediment and water yields exhibited a decreasing trend, whereas NPP was reversely varied.61We assessed the synergies and trade-offs relationships among ecosystem services.

DOI PMID

[34]
Wang S J, Liu Q M, Zhang D F, 2004. Karst rocky desertification in southwestern China: Geomorphology, land use, impact and rehabilitation.Land Degradation & Development, 15(2): 115-121.

[35]
Wang X Z, Liang Z X, Wang J, 2014. Simulation of runoff in karst-influenced Lianjiang Watershed using the SWAT model.Scientific Journal of Earth Science, 4(2): 85-92.

[36]
Wu Xiyuan, Zhang Liping, 2006. Research on effecting factors of precipitation’s redistribution of rainfall intensity, gradient and cover ratio. Journal of Soil and Water Conservation, 20(4): 28-30. (in Chinese)

[37]
Xu H, Xu C Y, Sælthun N R et al. , 2015. Entropy theory based multi-criteria resampling of rain gauge networks for hydrological modelling: A case study of humid area in southern China.Journal of Hydrology, 525(A): 138-151.https://linkinghub.elsevier.com/retrieve/pii/S002216941500205XRain gauge networks are used to provide estimates of area average, spatial variability and point rainfalls at catchment scale and provide the most important input for hydrological models. Therefore, it is desired to design the optimal rain gauge networks with a minimal number of rain gauges to provide reliable data with both areal mean values and spatial emporal variability. Based on a dense rain gauge network of 185 rain gauges in Xiangjiang River Basin, southern China, this study used an entropy theory based multi-criteria method which simultaneously considers the information derived from rainfall series, minimize the bias of areal mean rainfall as well as minimize the information overlapped by different gauges to resample the rain gauge networks with different gauge densities. The optimal networks were examined using two hydrological models: The lumped Xinanjiang Model and the distributed SWAT Model. The results indicate that the performances of the lumped model using different optimal networks are stable while the performances of the distributed model keep on improving as the number of rain gauges increases. The results reveal that the entropy theory based multi-criteria strategy provides an optimal design of rain gauge network which is of vital importance in regional hydrological study and water resources management.

DOI

[38]
Yuan Daoxian, 2015. Scientific innovation in karst resources and environment research field of China.Carsologica Sinica, 34(2): 98-100. (in Chinese)http://en.cnki.com.cn/Article_en/CJFDTotal-ZGYR201502002.htmIn karst areas of China,the natural resources and environment have some serious problems,which constrain the development of social economy.The Central Government has promoted the scientific and technical innovation and ecological civilization construction vigorously since the Eighteenth National Congress of Communist Party of China.Scientific and technical innovation can not only helps to face and solve the resource and environment problems in karst areas,but also promote the development of karstology,and provide service to the ecological civilization construction.The research on karst in the future should concentrate on the following aspects:to implement the application of earth system science in karstology,exert the regional advantages of China on the karst research,and explore the characteristics and significant processes of critical zones in karst areas of China;strengthen the research on the response of karstification to global change,the rate of carbon cycle and stability,and establish the permanent mechanism towards extremely climate;consider the influence of paleo-magnitude and paleo-climate on paleo-karst;explore deeply the functions of microbes to the formation of carbonate rock;summarize systemically the experiences and problems of the first phase improvement project on rock desertification control in China,in order to better guide the control work in the next step;pay attention to the declaration of karst natural heritage in terms of the karst boundary between north and south;apply the big data technology to the karst resources and environment as well as hydrogeological research,improve the warning and forecast research on geological hazards,and the research on the shortage of resources to serve our country.

[39]
Zhang Mingyang, Wang Kelin, Liu Huiyu et al., 2011. The response of ecosystem service values to ambient environment and its spatial scales in typical karst areas of northwest Guangxi, China.Acta Ecologica Sinica, 31(14): 3947-3955. (in Chinese)

[40]
Zhang Z, Chen X, Huang Y et al., 2013. Effect of catchment properties on runoff coefficient in a karst area of southwest China.Hydrological Processes, 28(11): 3691-3702.

[41]
Zhou F, Xu Y, Chen Y et al., 2013. Hydrological response to urbanization at different spatio-temporal scales simulated by coupling of CLUE-S and the SWAT model in the Yangtze River Delta region.Journal of Hydrology, 485: 113-125.https://linkinghub.elsevier.com/retrieve/pii/S0022169412011237The Main objective of the study is to understand and quantify the hydrological responses of land use and land cover changes. The Yangtze River Delta is one of the most developed regions in China with the rapid development of urbanization which serves as an excellent case study site for understanding the hydrological response to urbanization and land use change. The Xitiaoxi River basin, one of the main upstream rivers to the Taihu Lake in the Yangtze River Delta, was selected to perform the study. The urban area in the basin increased from 37.8km2 in 1985 to 105km2 in 2008. SWAT model, which makes direct use of land cover and land use data in simulating streamflow, provides as a useful tool for performing such studies and is therefore used in this study. The results showed that (1) the expansion of urban areas had a slight influence on the simulated annual streamflow and evapotranspiration (ET) as far as the whole catchment is concerned; (2) surface runoff and baseflow were found more sensitive to urbanization, which had increased by 11.3% and declined by 11.2%, respectively; (3) changes in streamflow, evapotranspiration and surface runoff were more pronounced during the wet season (from May to August), while baseflow and lateral flow had a slight seasonal variation; (4) the model simulated peak discharge increased 1.6 4.3% and flood volume increased 0.7 2.3% for the selected storm rainfall events at the entire basin level, and the change rate was larger for smaller flood events than for larger events; (5) spatially, changes of hydrological fluxes were more remarkable in the suburban basin which had a relative larger increase in urbanization than in rural sub-basins; and (6) analysis of future scenarios showed the impacts of urbanization on hydrological fluxes would be more obvious with growth in impervious areas from 15% to 30%. In conclusion, the urbanization would have a slight impact on annual water yield, but a remarkable impact was found on surface runoff, peak discharge and flood volume especially in suburban basins in the study area. The study suggested that more attention must be paid for flood mitigation and water resources management in planning future urban development in the region.

DOI

Outlines

/