Research Articles

Evolutionary dynamics of the main-stem longitudinal profiles of ten kongdui basins within Inner Mongolia, China

  • GU Zhenkui , 1, 2 ,
  • SHI Changxing , 1, * ,
  • PENG Jie 3
Expand
  • 1. Key Laboratory of Water Cycle and Related Land Surface Processes, Institute of Geographic Sciences and Natural Resources Research, CAS, Beijing 100101, China
  • 2. University of Chinese Academy of Sciences, Beijing 100049, China
  • 3. China University of Geosciences, Beijing 100083, China
*Corresponding author: Shi Changxing, PhD and Professor, specialized in fluvial geomorphology and sediment dynamics. E-mail:

Author: Gu Zhenkui, PhD, specialized in fluvial geomorphology. E-mail:

Received date: 2017-10-25

  Accepted date: 2018-02-22

  Online published: 2019-03-20

Supported by

National Natural Science Foundation of China, No.41671004, No.41371036

Copyright

Journal of Geographical Sciences, All Rights Reserved

Abstract

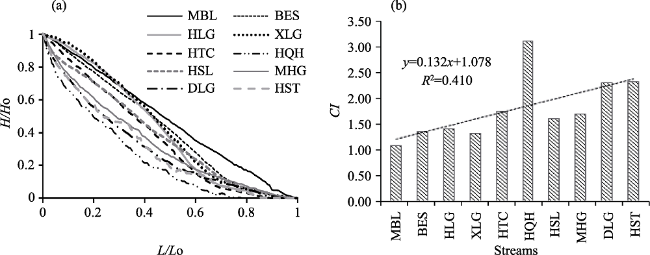
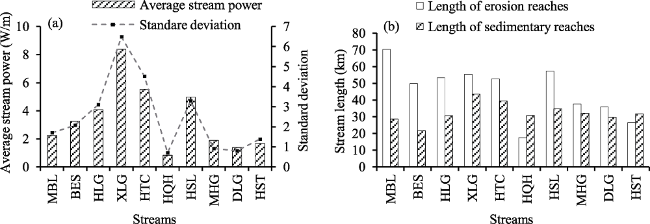
The longitudinal profiles of main streams of ten kongdui basins within Inner Mongolian Autonomous Region of China were characterized in this study by analyzing a series of quantitative indexes that are relevant to tectonic activity and river action, and by establishing a series of multiple regression models. The results reveal that all longitudinal profiles are concave in shape, with a range of concavity between 1.1 and 3.1, increasing from west to east. Data also show that the concavity of the profiles is significantly negatively correlated with profile length, altitude difference, average altitude, drainage area and sediment load of the basins. Analysis reveals that kongdui basins have suffered from moderate-to-weak tectonic activity over time, again characterized by a west-to-east weakening trend. Stream power also varies along the main channels of the ten kongdui basins; average values in each case fall between 0.8 W/m and 8.4 W/m, generally higher within the middle reaches. This decreasing trend in stream power within the lower reaches of kongdui basins might provide one key explanation for sedimentation there. Data also show that the average stream power in western and central basins tends to be higher than that in eastern examples, even though both the highest and the lowest values are seen within two middle ones. This analysis shows that the longitudinal profile concavity values are mainly controlled by tectonic activity and that the effect of river action is insignificant.

Cite this article

GU Zhenkui , SHI Changxing , PENG Jie . Evolutionary dynamics of the main-stem longitudinal profiles of ten kongdui basins within Inner Mongolia, China[J]. Journal of Geographical Sciences, 2019 , 29(3) : 417 -431 . DOI: 10.1007/s11442-019-1607-0

1 Introduction

River channels are the most important conduits for the transport of material and energy throughout geomorphological evolution. In the long term evolutionary processes, changes in sediment within main channels as well as in stream profile and surface morphology all occur in response to spatial and temporal variations in tectonic activity, lithologic characteristics, and climate. Such changes are indicative of morphological evolutionary characteristics (e.g., Rãdoane et al., 2003; Font et al., 2010; Pérez-Peña et al., 2010; Ambili and Narayana, 2014). As one basic channel element of river basins, the longitudinal profiles of their main streams are created by the collective influence of both internal and external forces; understanding the development of such features is a key research topic within the fields of tectonics and river geomorphology. A large range of studies have been carried out over the last few decades on the longitudinal profiles; the research methods currently applied to the analyses in this area include profile fitting via mathematical functions to assess evolutionary stage (e.g., Ohmori, 1991; Rãdoane et al., 2003) as well as quantitative parameter extraction to analyze the characteristics of basin tectonic activity (e.g., Font et al., 2010; Pérez-Peña et al., 2010; Mahmood and Gloaguen, 2012; Pan et al., 2015; Gao et al., 2016; Owono et al., 2016). The physical mechanisms that underline the evolution of longitudinal profiles have also been investigated by many scholars in recent years through utilizing stream power erosion models to pinpoint and explain the formation and changes of profile morphology (e.g., Snow and Slingerland, 1987; Hu et al., 2010; Miller et al., 2013; Ambili and Narayana, 2014; Gallen and Wegmann, 2017). A suite of geomorphic parameters in these models are applied to analyze the characteristics of longitudinal profiles, including length gradient (e.g., Font et al., 2010; Mahmood and Gloaguen, 2012) and steep indexes (e.g., Hu et al., 2010, 2014; Miller et al., 2013) as well as concavity values (e.g., Langbein, 1964; Jiang, 1987; Phillips et al, 2008); not only do these parameters describe the morphological features of longitudinal profiles, they are also indicative of the characteristics of tectonic and river activities. The characteristics of a single dynamic factor, either tectonic activity or river action, have often been evaluated in previous analyses, while the coupled dynamic structure of internal-external forces has usually been ignored (e.g., Rãdoane et al., 2003; Zhao et al., 2014; Dušan et al., 2017). Stream power erosion models often simultaneously encapsulate tectonic activity and river action (e.g., Snow and Slingerland, 1987; Font et al., 2010; Hu et al., 2010, 2014; Pérez-Peña et al., 2010) and include a number of empirical parameters that are often difficult to ascertain as they vary between different areas. Constant improvements in the accuracy of digital elevation models (DEMs) and in GIS technology over the last 20 years (e.g., Bergonse and Reis, 2015) have enabled the characteristics of tectonic and fluvial actions to be reliably described via quantitative indicators. These developments mean that uncertain empirical parameters can be discarded by establishing multiple regression models, and the dynamic mechanisms that underlie longitudinal profile evolution can be understood.
The section of the Yellow River within the Inner Mongolian Autonomous Region of China includes ten tributaries (“kongdui” in Mongolian). They are characterized by strong wind-fluvial interactive erosion as well as high floods and heavy sediment loads. The Yellow River itself is therefore also heavily influenced by huge input of sediments from these kongduis. Although scholars to date have studied sediment transport mechanisms (Xu, 2013; Yao et al., 2016), estimated sediment discharge (Lin et al., 2014), and analyzed the characteristics of wind-fluvial interactive erosion (Xu et al., 2014), little attention has so far been afforded to the dynamic mechanisms that underlie longitudinal profile evolution. The aim of this study is therefore to identify the main dynamic factors that have driven the longitudinal profiles to evolve by analyzing tectonic activity and river action characteristics and longitudinal profile morphological features.

2 Study area

The ten tributaries of the Yellow River in this region flow into the main channel from south-to-north (Figure 1). Identified from west-to-east (Table 1), they are the Maobula Kongdui (MBL), the Buersetai Kongdui (BES), the Heilaigou Kongdui (HLG), the Xiliugou Kongdui (XLG), the Hantaichuan Kongdui (HTC), the Haoqinghe Kongdui (HQH), the Hashilachuan Kongdui (HSL), the Muhuagou Kongdui (MHG), the Dongliugou Kongdui (DLG), and the Husitai Kongdui (HST). This study area experiences a temperate continental monsoonal climate and it is noteworthy that the morphological features of tributary basins were mainly formed during the Quaternary. The climate of this region is consistent with an arid grassland and semi-desert zone (Xu, 2013); annual average precipitation within western basins is about 250 mm, gradually increasing to 350 mm in the east, while rainfall in July and August encompasses between 50% and 60% of the overall annual total. The upper reaches of the XLG and the HTC also experience frequent rainstorms (Lin et al., 2014); these basins mainly comprise two tectonic units, i.e., a downstream alluvial plain within the Hetao Basin that formed in the Cenozoic, and the upstream area on the Ordos Plateau. This latter region was also uplifted to a plateau within the Cenozoic and experienced several episodes of uplift during the Quaternary (Yue et al., 2007) with a current uplift rate between 1 mm/a and 2.8 mm/a (Deng et al., 1999). The basins have a maximum altitude of approximately 1,600 m. The upstream basins are mainly underlain by gray-green and purple Mesozoic fluvial-lacustrine clastic rocks that have loose lithological structure and poor resistance to erosion (Yang et al., 2015), while their downstream counterparts are mainly covered by Quaternary alluvial deposits.
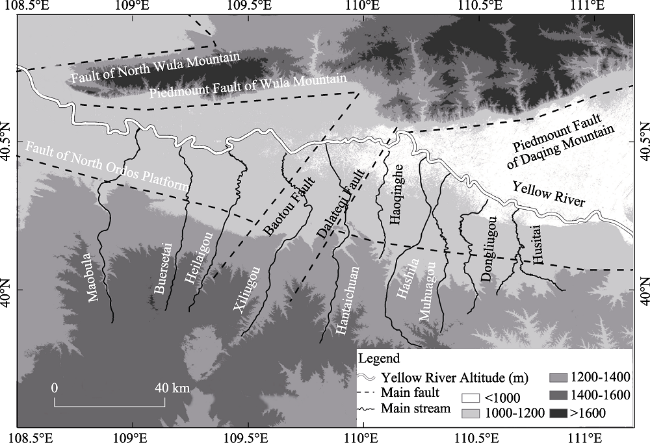
Figure 1 Map showing location of the tributaries (kongduis)
Table 1 Kongdui landform elements and sediment yields
Kongdui Longitudinal profile
length (km)
Altitude
difference (m)
Drainage area
(km²)
Sediment
yield (104 t/yr)*
MBL 101 501 1,261 439
BES 74 545 545 205
HLG 86 439 944 329
XLG 101 394 1,194 482
HTC 94 438 875 184
HQH 50 242 213 41
HSL 94 395 1,089 201
MHG 72 366 407 72
DLG 68 329 451 77
HST 60 268 406 67

*Xu (2014)

3 Methodology and data

3.1 Data

The topographic data used in this study are derived from a SRTM 1″DEM (http://earthexplorer.usgs.gov/) that has a spatial resolution of approximately 30 m and about a 5 m elevation error (Pipaud et al., 2015; Yu et al., 2017). Values for average annual rainfall within kongdui basins were generated by interpolating data recorded at meteorological stations across the study area (http://data.cma.cn) via the inverse distance weight method (IDW).

3.2 Longitudinal profile concavity

Based on Langbein’s (1964) concavity index, longitudinal profile concavity index values were computed as follows:
CI = S1 / S2 (1)
where S1 and S2 denote the areas of upper and lower sections, respectively, encapsulated by the longitudinal profile and the rectangular boundary (Figure 2). If 0 < CI < 1 then the longitudinal profile is convex and prone to erosion. If CI = 1, then the profile almost comprises a straight line and can be said to be in a transitional evolutionary phase. If 0 > CI > 1, then the profile has a concave shape and can be said to be in an adjustment phase (Phillips et al., 2008). It is generally thought that the morphology of a longitudinal profile is related to both tectonic activity and river action within catchments where substrate is uniform. Thus, in order to obtain longitudinal profile concavity values, a number of basin hydrological characteristics were analyzed using DEM data in the ArcGIS software platform following the processes shown in Figure 3.
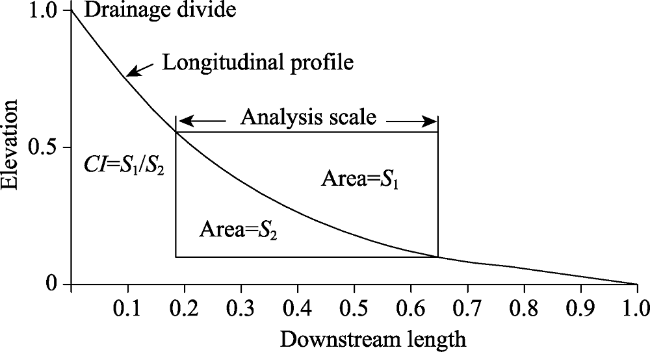
Figure 2 Sketch of definition of concavity index
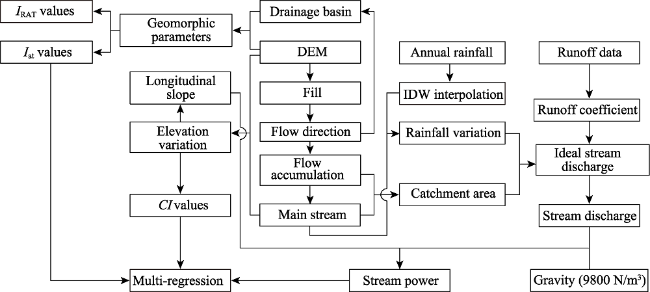
Figure 3 The processes followed to acquire parameters

3.3 The intensity of tectonic activity

The morphological characteristics of river longitudinal profiles are influenced by tectonic activity within basins, the intensity of which can be evaluated using a range of geomorphic indexes (e.g., Hamdouni, 2008; Gao et al., 2016; Owono et al., 2016). These include hypsometric integral (HI), asymmetry factor (AF), stream length gradient (SL), basin shape (Bs), and valley floor width-to-height (Vf) ratio; all of these measures were extracted from a DEM (Table 2).
Table 2 The formulae used in this study to compute geomorphic parameters and corresponding threshold value interpretations
Parameter Formula Threshold value interpretation
HI HI = (Hmean - Hmin) / (Hmax - Hmin)
Hmean, Hmax, and Hmin denote the mean, maximum, and minimum heights of a basin, respectively.
HI > 0.7, 0.5 ≤ HI ≤ 0.7, and HI < 0.5 equate to high, moderate, and low levels of tectonic activity, respectively (e.g., Altın, 2012; Mahmood and Gloaguen, 2012).
AF AF = 100 × (Ar / At)
Ar denotes the area of the basin on the right side of the trunk stream, while At refers to the total basin area.
|AF - 50| > 15, 7 ≤ |AF - 50| ≤ 15, and |AF - 50| < 7 equate to high, moderate, and low levels of tectonic activity, respectively (e.g., Hamdouni et al., 2008; Gao et al., 2013).
SL SL = (ΔH / ΔL) × L
ΔH denotes the difference in elevation between the ends of the river reach under consideration, while ΔL denotes the length of the reach, L is the distance between the measured reach and the drainage divide.
SL > 500, 300 ≤ SL ≤ 500, and SL < 300 equate to high, moderate, and low levels of tectonic activity, respectively (e.g., Hamdouni et al., 2008; Gao et al., 2016).
Bs Bs = B1 / Bw
B1 denotes the basin length measured from the headwater to the mouth, while Bw is the maximum basin width.
High, moderate, and low levels of tectonic activity have values of Bs > 3, 2-3, and < 2, respectively (e.g., Hamdouni et al., 2008; Gao et al., 2016).
Vf Vf = 2Vfw / [(Eld - Esc) + (Erd - Esc)]
Vfw denotes the width of the valley floor, while Eld and Erd refer to the elevations of the left and right valley divides, respectively, and Esc is the elevation of the valley floor.
Vf < 1, 1 ≤ Vf ≤ 3, and Vf > 3 equate to high, moderate, and low levels of tectonic activity, respectively (e.g., Hamdouni et al., 2008; Altın, 2012; Mahmood and Gloaguen, 2012; Gao et al., 2016). For calculating Vf, numerous erosional valley cross-sections were obtained using the “interpolate line” tool in the software ArcGIS. The horizontal width between two shoulders and the width of the valley bottom at a height of 5 m were measured from each valley cross-section, and an average Vf value was calculated for each basin.
The high, moderate, and low levels of tectonic activity for each geomorphic parameter are assigned 1, 2, and 3, respectively. The mean of level values of all geomorphic parameters is used as an index of relative tectonic activity (IRAT):
$\mathop{I}_{\text{RAT}}=\frac{\mathop{S}_{HI}+\mathop{S}_{AF}+\mathop{S}_{SL}+\mathop{S}_{Bs}+\mathop{S}_{Vf}}{5}$ (2)
where S denotes the level value and IRAT index outputs are generally divided into four classes, scaled between 1 and 4. The four classes are 1.0 ≤ IRAT < 1.5, 1.5 ≤ IRAT < 2.0, 2.0 ≤ IRAT < 2.5, and 2.5 ≤ IRAT < 3, indicating intense, strong, moderate, and weak tectonic activities, respectively (e.g., Hamdouni et al., 2008; Altın, 2012; Mahmood and Gloaguen, 2012; Gao et al., 2016). As the index IRAT is calculated from the level values of geomorphic parameters, some information of tectonic activity intensity may lose in the conversion from continuous values to level ones. For avoiding this defect of IRAT, we defined another index for relative tectonic activity. It is the index Iat, which is the mean of all normalized values of geomorphic indexes, as follows:
$\mathop{I}_{\text{at}}=\frac{\mathop{N}_{HI}+\mathop{N}_{|AF-50|}+\mathop{N}_{SL}+\mathop{N}_{Bs}+\mathop{N}_{1/Vf}}{5}$ (3)
In this expression, N denotes normalized values for geomorphic indexes (i.e., HI, |AF-50|, SL, Bs, and 1/Vf) and ranges between zero and one.

3.4 Stream power

Stream power (Sp), measured in W/m, was defined as follows (Summerfield, 1991):
$p=\gamma \times Q\times s$ (4)
where γ denotes the specific weight of water (9,800 N/m³), s is the slope of the water surface (generally approximated as the channel bed slope), and Q is water discharge (m³/s). The stream power of a river determines sediment transport capacity and is therefore fundamental to longitudinal profile development; in other words, a greater stream power equates to a higher transport capacity, and thus a longitudinal profile that is more vulnerable to down-cutting. This feature can be clearly described via a stream power gradient (SPG); when the SPG is greater than zero, power increases along the profile, and thus eroding and delivering more sediment downstream and increasing concavity. In contrast, power decreases downstream when the SPG is less than zero, the energy needed to transport sediments is inadequate and deposition occurs. In order to compute SPG along the mainstream, stream discharge along the channel was calculated as follows:
$\left\{ \begin{align} & \mathop{Q}_{1}=\mathop{c\times A}_{1}\mathop{\times q}_{1} \\ & \mathop{Q}_{i}=c\times \text{(}\mathop{A}_{i}-\mathop{A}_{i-1}\text{)}\times \mathop{q}_{i}+\mathop{Q}_{i-1} \\ \end{align} \right.$ (5)
where Q1, A1, and q1 refer to discharge, confluence area, and annual rainfall adjacent to the river source, respectively, while Qi and qi denote the discharge and rainfall at point i, respectively, (Ai-Ai-1qi is the discharge generated by the added confluence areas at point i, Qi-1 is the discharge at point i-1, and c is the runoff coefficient. In this case, as three hydrological stations are present within the study area and the lithologies of kongdui basins are all nearly identical, all runoff coefficients are also almost the same. We therefore used the value 0.02 in this study in all cases as this corresponds with the ratio of measured discharge to precipitation within the HTC, XLG, and MBL basins.

3.5 Coupling between concavity, tectonic activity, and stream power

The morphologic characteristics of longitudinal profiles are related to both internal and external forces. We therefore utilized CI, Iat, and Sp as proxy indicators in this analysis to describe the morphological features of profiles, basin tectonic activity, and river action, respectively. In this context, CI values denote the long-term effects of tectonic and river activities, so their historic averages should be used. The Iat values calculated based on geomorphic parameters of modern topography can be directly used as proxies for the approximate average intensities of past tectonic activity. Assuming an existing river profile has been developed from an initial linear profile as shown in Figure 4, historic average river power can be approximately expressed as follows:
$\mathop{Sp}_{mean}\approx \frac{(Spl-e)+Sp}{2}$ (6)
where Spl denotes average stream power under present climatic conditions of the original straight longitudinal profile not subject to later tectonic uplift, Sp is the average stream power calculated for modern climatic and topographic conditions, and e denotes the change in average stream power caused by climate change, tectonic uplift, and watershed expansion over the course of basin evolution (Figure 4). In this case, as the duration of the dry-cold period was generally about 2.6 times that of the warm period and continual tectonic uplift is known to have occurred throughout the Quaternary (Deng et al., 1999; Yue et al., 2007), the e value must be considerably lower than Spl. Further, as the CI value of a small-scale longitudinal profile is larger than that of a large-scale longitudinal profile under the same stream power conditions, a binary regression model with the scale influence eliminated can be established, as follows:
$CI=a\times \mathop{I}_{\text{at}}+b\times \mathop{SP}_{\text{mean}}\text{+}c$ (7)
where a and b are the regression coefficients, SPmean=Spmean/L, L is stream length, and c is a constant. Prior to establishing a model, values for both Iat and SPmean were normalized to eliminate any differences due to the indicator unit as well as to make it simpler to determine the significance of tectonic activity and river action on longitudinal profiles. This latter step was accomplished by comparing the magnitudes of |a| and |b|.
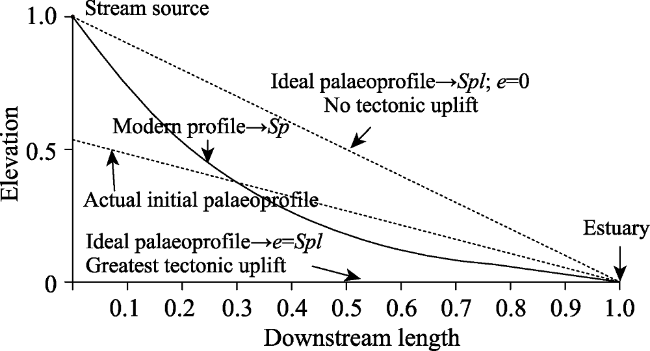
Figure 4 Modern and three hypothetical original profiles for a stream. We assume that the highest profile will remain steady while the other two initial examples will be elevated to the highest extent by later tectonic uplift in the absence of erosion

4 Results and discussion

4.1 The concavity of longitudinal profiles

The ten streams evaluated in this study were all generated during uplift of the same tectonic unit, and therefore have nearly the same evolutionary history (e.g., Deng et al., 1999). Nevertheless, besides spatial and temporal changes in tectonic activity and precipitation conditions, a number of parameters have varied over the course of stream evolution, including watershed area, channel length, and altitude differences (e.g., Marple et al., 1993; Whipple et al., 2000; Hu et al., 2010). The consequent longitudinal profiles and their sub-segments have therefore different values of concavity (e.g., Snow and Slingerland, 1987; Phillips et al., 2008; Miller et al., 2013; Pan et al., 2015). As for the ten streams under discussion, they all have a concave profile (Figure 5a) with their profile CI values being greater than one and conspicuously increasing from west-to-east (Figure 5b).
Figure 5 Longitudinal profile shapes (a) and CI values (b). Abbreviations: H/Ho, ratio between height at the point of measurement above the river mouth (H) and the total fall of the stream (Ho); L/Lo, ratio between stream length from the river mouth to the point of measurement (L) and total length (Lo)
The data presented in Table 3 reveal significant negative correlations between CI values and drainage area, as well as versus altitude differences, altitude averages, and profile lengths. Such negative correlations with landform variables are expected; in the first place, if all other conditions are held the same, a large drainage area and a long river profile length usually implies that main-stem channel within a basin has experienced a high degree of erosion. Further, a larger difference in altitude within a basin is also associated with a high rate of uplift and the average altitude of a longitudinal profile reflects integrated features of both erosion and tectonic uplift; thus, a higher average altitude implies faster historic tectonic uplift and/or a slower erosion rate. We therefore conclude that negative CI correlations with respect to these four landform variables indicate that channel erosion has significantly persisted within all ten kongduis. Data also show that CI is negatively correlated with sediment yield; this demonstrates that sediment yield decreases as the concavity of longitudinal profiles increases.
Table 3 Correlation coefficients between landform elements within the ten kongdui basins
Profile
length
Altitude
difference
Average
altitude
Drainage
area
Concavity Sediment
yield
Profile length 1 0.674* 0.730* 0.964** ‒0.844** 0.854**
Altitude difference 1 0.961* 0.592 ‒0.869** 0.366
Average altitude 1 0.701* ‒0.887** 0.437
Drainage area 1 ‒0.781** 0.897**
Concavity 1 ‒0.639*
Sediment yield 1

* significant at α = 0.05; **significant at α = 0.01

In order to further analyze the characteristics of concavity value variation along each longitudinal profile, we calculated individual values for segments at certain points in each case. We used a segment length of 15 km in this analysis because correlations between CI values of whole profiles and corresponding average values for segments become less significant below this cut-off distance (Figure 6). Our use of lengths greater than 15 km may therefore mean that the overall segment CI values are indicative of the physical mechanisms for forming the entire profile; indeed, data show that the highest CI value for each longitudinal profile generally occurs within its lower reaches while values for middle and upper sections tend to fluctuate around one (Figure 7). The higher CI values in the lower reaches of these kongduis are favorable for sediment deposition, while the lower CI values in the middle and upper reaches promote sediment delivery.
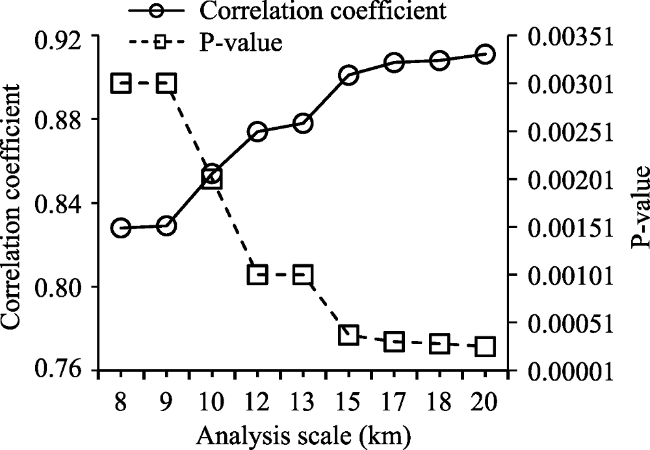
Figure 6 Changes in coefficients and P-values (significance) of correlations between profile CI values and segment averages as segment length increases
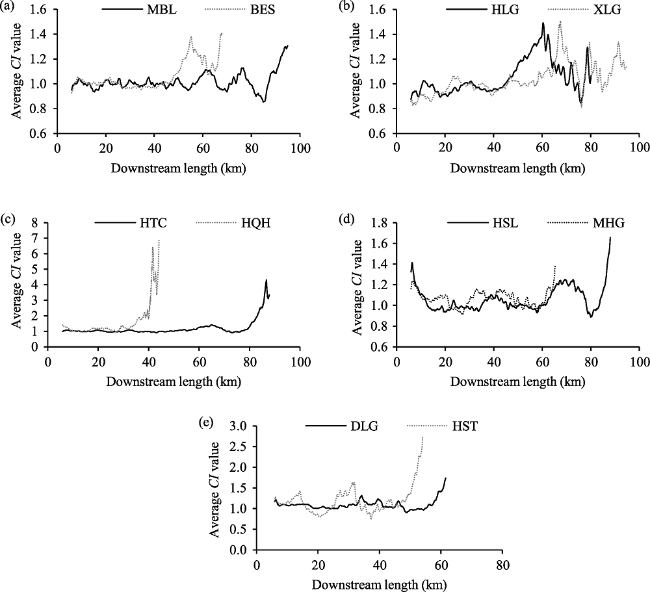
Figure 7 Variation in CI values of 15-km long segments along the longitudinal profiles

4.2 The intensity of tectonic activity

The basements of all the river basins considered in this study comprise parts of the western North China Craton (e.g., Wang et al., 2010; Zhang et al., 2011). Thus, as a result of Ordos Block-associated tectonic activity, the upstream regions of all basins have also undergone several cycles of subsidence and uplift over the course of their geologic history (e.g., Deng et al., 1999; Zheng et al., 2006; Yue et al., 2007) within mainly a terrestrial environment (Wang, 1985). The basic features of the current landscape of the basins were formed via uplift of the Ordos Block and subsidence of Hetao Basin during the Cenozoic (Deng et al., 1999). Although movement of the Ordos Block has been dominated by vertical uplift, the intensity of tectonic activity within the basins evaluated here remains unclear. Current results reveal a range of IRAT values between 2.2 and 3, implying that moderate-to-weak intensity tectonic activities have occurred within these basins (Table 4). Amongst them, western ones (i.e., the MBL, BES, HLG, XLG, and HTC) are characterized by relatively stronger intensities of tectonic activity compared to their eastern counterparts (Figure 8a). Tectonic activity within the basins is usually manifested in a variety of ways including uplift, subsidence, and dislocation (e.g., Font et al., 2010; Mahmood and Gloaguen, 2012);the first two of these can be recorded via longitudinal profile deformation. A large amount of previous work has shown that a higher Hack profile bulge corresponds with faster tectonic uplift (e.g., Hack, 1973; Merritts, 1989; Rhea, 1989; Chen et al., 2003; Brookfield, 2008), and that the shape of such profiles (Figure 8b) reflects the rate of uplift. It is noteworthy that the lower concave segments of kongdui Hack profiles usually occur at altitudes below 1,050 m (Figure 8b), indicative of structural subsidence.
Table 4 Geomorphic indexes and values for the intensity of tectonic activity within the ten kongdui basins evaluated in this study
Basins HI AF SL Bs Vf IRAT Geomorphic index class IRAT class Intensity
HI AF SL Bs Vf
MBL 0.55 61.76 245.56 3.77 6.49 2.2 2 2 3 1 3 3 Moderate
BES 0.51 21.92 286.97 2.73 6.51 2.2 2 1 3 2 3 3 Moderate
HLG 0.54 45.52 250.92 3.08 8.37 2.4 2 3 3 1 3 3 Moderate
XLG 0.60 63.58 222.36 2.70 6.57 2.4 2 2 3 2 3 3 Moderate
HTC 0.63 56.70 224.94 3.50 5.67 2.4 2 3 3 1 3 3 Moderate
HQH 0.31 55.54 100.96 1.75 4.85 3 3 3 3 3 3 4 Weak
HSL 0.52 47.89 177.22 2.60 5.77 2.8 2 3 3 3 3 4 Weak
MHG 0.41 48.94 153.84 4.23 6.15 2.6 3 3 3 1 3 4 Weak
DLG 0.41 54.59 128.57 3.28 7.09 2.6 3 3 3 1 3 4 Weak
HST 0.50 38.83 119.75 1.24 5.30 2.6 2 2 3 3 3 4 Weak
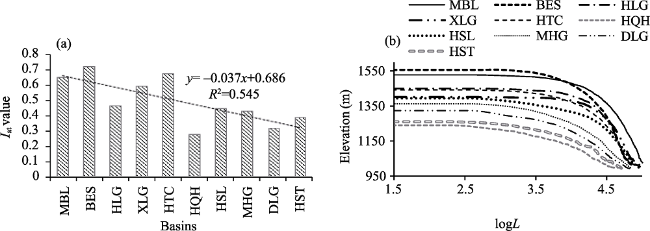
Figure 8 The intensity of tectonic activity (a) and Hack profiles for the ten kongdui basins evaluated in this study (b)

4.3 Stream power characteristics

The magnitude of stream power directly influences fluvial erosion and sediment transport capacities. Thus, the greater the power, the more the sediments can be transported by runoff (Whipple et al., 1999; 2000). The data assembled here (Figure 9) reveal significant spatial variations in stream power along the ten streams, with higher values generally found within middle reaches. This is because the upper parts of river basins comprise the main drainage areas for the ten kongduis, and so water discharge peaks within middle reaches; this corresponds with the fact that the ability of a river to erode sand rises to a maximum within middle reaches, clearly visible in the XLG, HTC, HLG, and HSL examples. At the same time, a downstream reduction in stream power is also seen markedly within the lower reaches of the streams considered here and might be a key factor underlying sediment deposition and the formation of alluvial fans. In this context, the MBL is unusual because stream power predominantly increases overall downstream into the estuary; it is therefore possible that the sediment load in this case also gradually increases downstream, and so the volume of sediments deposited within lower reaches is less than seen in its counterparts. This phenomenon is reflected distinctly by the SPG (Figure 9); this gradient is generally higher than zero within the upper reaches of most streams and below this value only in lower section. Indeed, the SPG of some streams switches to negative values within their middle reaches, indicating regions that are most prone to sediment deposition (i.e., the HLG, XLG, HTC, and MHG). Average SPG values for some profiles remain higher than zero, however (i.e., the MBL, BES, HLG, XLG, and MHG), and these streams are therefore subject to overall channel erosion (Figure 10a). The length of the erosional section is larger than the depositional in most profiles (Figure 10b), while channel erosion of streams in the central part of the study area tends to be more active than in eastern and western cases, in concert with average power (Figure 10a). The most actively eroded stream within the study area is the XLG while the least active is the HQH; the former consequently is also characterized by the highest sediment discharge while the latter has the lowest (Table 1).
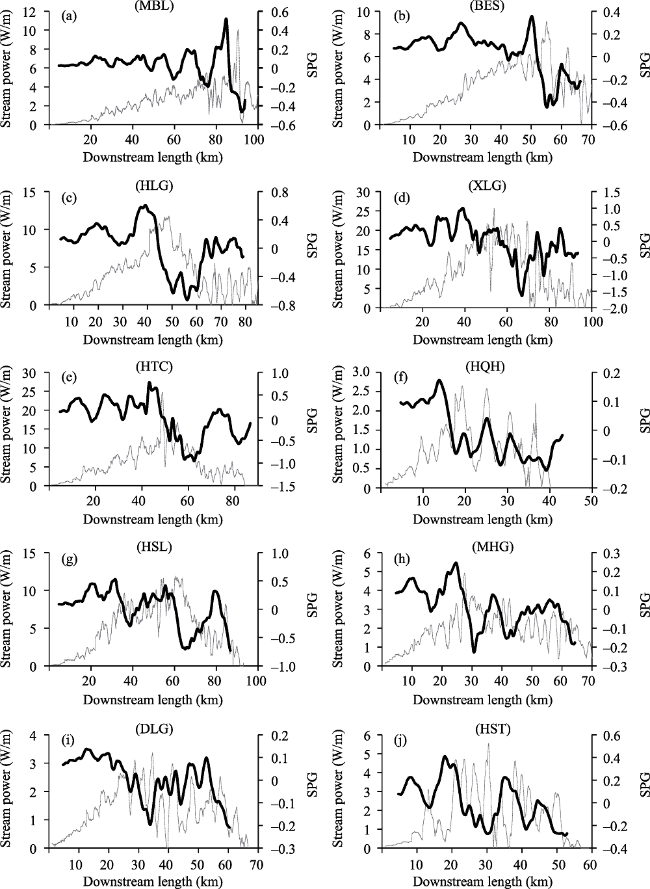
Figure 9 Stream power and SPG variations over a fixed 10-km distance in streams across the study area. The gray line denotes stream power while the black one indicates SPG.
Figure 10 Average stream power values (a) and the lengths of erosional and depositional reaches (b)

4.4 Coupled characteristics of profiles and internal-external forces

The nature of each longitudinal profile can be viewed as a function of stream action, lithology,and tectonic activity (Hu et al., 2010; Gallen and Wegmann et al., 2017). Thus, as the ten kongdui basins discussed here have nearly the same underlying substrates, two binary regression models were established based on CI values of their longitudinal profiles as well as average stream power and Iat values that were used as proxies for the intensity of tectonic activity (Figure 11a). These models enabled us to determine the dynamic mechanisms that have influenced stream longitudinal profiles under two extreme conditions. Results reveal that simulated concavity values derived from both regression models are similar to actual numbers (Figure 11b); indeed, both regression coefficients and P-values highlight the fact that profile morphological features have all been markedly affected by tectonic activity (Table 5).
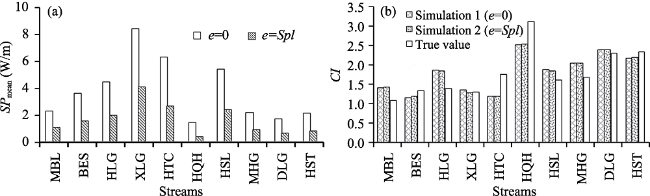
Figure 11 Average values of stream power (a) and simulated concavity (b)
Table 5 Relations between profile concavity and internal-external forces
Extreme case Natural conditions Regression model Factor P-value Equation P-value R2
$e=0$ Elevation of the stream source is constant and water discharge has remained the same. $CI=-1.38\times \mathop{I}_{\text{at}}-0.07\times \mathop{SP}_{\text{mean}}+2.51$ $Iat$: 0.0226 0.0333 0.62
$\mathop{SP}_{mean}$: 0.8980
$e=Spl$ The difference in height between the stream source and the estuary is zero. $CI=-1.26\times \mathop{I}_{\text{at}}-0.30\times \mathop{SP}_{\text{mean}}+2.53$ $I\text{at}$: 0.0344 0.0288 0.64
$\mathop{SP}_{mean}$: 0.5930

5 Conclusions

The results presented in this study lead to a number of clear conclusions for the ten kongduis. These are founded on analyses of longitudinal profile concavity values, stream power, the intensity of tectonic activity, and the relationships between CI values and internal-external forces.
In the first place, the data presented here show that the longitudinal profiles of the ten kongduis are all concave up and have CI values in the range between 1.1-3.1, increasing from west-to-east. CI values for longitudinal profiles are significantly negatively correlated with profile length, altitude difference and average as well as drainage area and sediment yield. The negative relationship seen between the CI values of longitudinal profiles and sediment yield within kongduis implies that the latter decreases as concavity increases, and that sediment transport within eastern streams has been hindered markedly. This latter conclusion is clear from the higher CI values seen in eastern kongduis compared to their western counterparts. The largest values of segment concavity are seen in the lower reaches of each longitudinal profile and so sediment transport capacity is also reduced within these reaches.
Second, our data show that all ten kongdui basins have experienced both moderate and weak tectonic activities over time, and that intensity has weakened from west-to-east but the lowest is seen in the HQH. It is also noteworthy that the influence of tectonic activities on longitudinal profiles is mainly manifested as tectonic uplift.
Third, the results of this study reveal that stream power varies greatly along channels but peaks within the middle reaches of all kongduis, with the exception of the MBL. A conspicuous downstream reduction in stream power within the lower reaches of all kongduis is also marked in our data and is considered to be the main reason underlying sediment deposition and alluvial fan formation. Average stream power values range between 0.8 W/m and 8.4 W/m; overall, average stream power values for western kongduis tend to be higher than those for the eastern ones. We have also been able to show that river channel erosion in western and central basins is more active than in eastern examples.
Fourth, data show that kongdui longitudinal profile concavity values have mainly been affected by tectonic uplift over time and that the influence of river action has been insignificant.

The authors have declared that no competing interests exist.

[1]
Altın T B, 2012. Geomorphic signatures of active tectonic in drainage basins in the southern Bolkar Mountains, Turkey.Journal of the Indian Society of Remote Sensing, 40(2): 271-285.http://link.springer.com/10.1007/s12524-011-0145-8AbstractBolkar Mountain forms the northeast extent of the Central Taurus Mountains, which are located north of the eastern Mediterranean Sea and consist of 3000 m or higher summits. The study area southern part of Bolkar Mt, has been investigated for geomorphic signatures of active tectonics using Geographical information system (GIS). The lower valley floor-to-width to height and elongation ratios, higher convexity, stream length-gradient (SL) indices, hypsometric integral and convex nature of the hypsometric curves and topographic asymmetry show that relative tectonic activity is greater in the eastern sector affected by Ecemi fault. Spatial variations of tectonic activity along rivers studied point to a general trend of decreasing activity towards the west as well as tectonic activity again increase in the west. Westward migration of basin and range extension is consistent with the place of uplift in the southern Bolkar Mt. Topography of the southern sector is the result of Late Miocene-Early Pliocene extension related uplift. Drainage systems in the upper part of the central and western sectors are under the lithological control and karstic denudation; whereas the development of the drainage systems in the middle and outlet parts of all sectors depend on sea level changes and Late Quaternary tectonism. The development of drainage systems of the eastern sector depends mostly on fault tectonism and climatic changes in the Late Quaternary.

DOI

[2]
Ambili V, Narayana A C, 2014. Tectonic effects on the longitudinal profiles of the Chaliyar River and its tributaries, southwest India. Geomorphology, 217(2): 37-47.https://linkinghub.elsevier.com/retrieve/pii/S0169555X14001986Chaliyar River, a west-flowing river, originates at about 2300m elevation in the Western Ghat hill ranges in the southern part of India. We have studied geomorphic aspects of this river by examining longitudinal profiles and drainage pattern in order to understand the rock uplift and river incision. Chaliyar River and its tributaries display uneven longitudinal profiles with numerous knickpoints along the profiles. River concavity and river morphology were analysed to better understand the influence of tectonics and rock uplift on the fluvial and topographic system in the Chaliyar River basin. Wide variability in the concavity index of the tributaries of the Chaliyar River reflects the role of tectonism in carving the present river profiles. Steepness and concavity indices computed for the longitudinal profiles suggest that the rate of uplift is exceeding the rate of incision and are independent of lithology. River incision is not uniform in the Chaliyar River. The streams become graded (absence of knickpoints) towards the river mouth, suggesting that the uplift and incision are in equilibrium.

DOI

[3]
Bergonse R, Reis E, 2015. Reconstructing pre-erosion topography using spatial interpolation techniques: A validation-based approach.Journal of Geographical Sciences, 25(2): 196-210.http://link.springer.com/10.1007/s11442-015-1162-2Understanding the topographic context preceding the development of erosive landforms is of major relevance in geomorphic research, as topography is an important factor on both water and mass movement-related erosion, and knowledge of the original surface is a condition for quantifying the volume of eroded material. Although any reconstruction implies assuming that the resulting surface reflects the original topography, past works have been dominated by linear interpolation methods, incapable of generating curved surfaces in areas with no data or values outside the range of variation of inputs. In spite of these limitations, impossibility of validation has led to the assumption of surface representativity never being challenged. In this paper, a validation-based method is applied in order to define the optimal interpolation technique for reconstructing pre-erosion topography in a given study area. In spite of the absence of the original surface, different techniques can be nonetheless evaluated by quantifying their capacity to reproduce known topography in unincised locations within the same geomorphic contexts of existing erosive landforms. A linear method (Triangulated Irregular Network, TIN) and 23 parameterizations of three distinct Spline interpolation techniques were compared using 50 test areas in a context of research on large gully dynamics in the South of Portugal. Results show that almost all Spline methods produced smaller errors than the TIN, and that the latter produced a mean absolute error 61.4% higher than the best Spline method, clearly establishing both the better adjustment of Splines to the geomorphic context considered and the limitations of linear approaches.The proposed method can easily be applied to different interpolation techniques and topographic contexts, enabling better calculations of eroded volumes and denudation rates as well as the investigation of controls by antecedent topographic form over erosive processes.

DOI

[4]
Brookfield M E, 2008. The evolution of the great river systems of southern Asia during the Cenozoic India-Asia collision: Rivers draining north from the Pamir syntaxis.Geomorphology, 22(3/4): 285-312.http://www.sciencedirect.com/science/article/pii/S0169555X0800007XDuring uplift of the Tibetan plateau and surrounding ranges, tectonic processes have interacted with climatic change and with local random effects (such as landslides) to determine the development of the major river systems of Asia. Rivers draining northward from the Pamir syntaxis have three distinctive patterns that are controlled by different tectonic and climatic regimes. West of the Pamir, the rivers have moderate but irregular gradients and drain northwards to disappear into arid depressions. Relatively steady uplift of the Hindu Kush in northern Afghanistan allowed rivers to cut across the rising ranges, modified by the shear along the Harirud fault zone, local faulting, and by increasing rain-shadow effects from the rising Makran. In the transition to the Pamir the rivers have steeper but more even gradients suggesting more even flow and downcutting during uplift, possibly related to larger glacial sources. In the central Pamir, only one antecedent river, the Pyandzh appears to have kept its northward course with compression and uplift of the indenter, and its course strangely corresponds with a major geophysical boundary (a distorted subducted slab) but not a geological boundary: the other rivers are subsequent rivers developed along deformation fronts during development and northward displacements of the Pamir structural units. The above areas have sources north of the Cretaceous Karakorum outh Pamir Andean margin. On the eastern flank of the Pamir, in the Kunlun and northern Tibetan plateau, the rivers rise similarly north of the Cretaceous Andean margin of southern Tibet, but then flow with low gradients across the plateau, before cutting and plunging steeply down across the Kunlun to disappear into the arid Tarim. These steep profiles are the result of late Neogene uplift of the northern Tibetan plateau and Kunlun possibly modified by glacial diversion and river capture. The drainage history of the Pamir indenter can be reconstructed by restoring the gross movements of the plates and the tectonic displacements, uplift, and erosion of individual tectonic units. Most important changes in drainage took place in the last 10 million years, late Miocene to Quaternary times, as the Pamir syntaxis developed.

DOI

[5]
Chen Y C, Sung Q C, Cheng K Y, 2003. Along strike variations of morphotectonic features in the western foothills of Taiwan: Tectonic implications based on stream-gradient and hypsometric analysis.Geomorphology, 22(1/2): 109-137.http://www.onacademic.com/detail/journal_1000035492964810_a49b.htmlhttp://linkinghub.elsevier.com/retrieve/pii/S0169555X0300059X

DOI

[6]
Deng Q D, Cheng S P, Min Wet al., 1999. Discussion on Cenozoic tectonics and dynamics of the Ordos Block.Journal of Geomechanics, 5(3): 13-19. (in Chinese)http://en.cnki.com.cn/Article_en/CJFDTOTAL-DZLX199903002.htmThe Ordos block is peripherally surrounded by fault zones and faulted basin zones of Cenozoic age.Its southwestern boundary is a compressional tectonic belt trending NW, along which left lateral strike slip fault zones with thrust components,such as the Haiyuan Liupanshan fault zone,and corresponding faulted basins have developed,with both the maximum left lateral strike slip rate and the maximum horizontal shortening rate of 10mm/a.Both the Yinchun\|Jilantai faulted basin zone of its western boundary and the Shanxi faulted basin zone of its eastern boundary are NNE trending right\|lateral shear zones with extension components,while both the Weihe faulted basin zone of its southern boundary and the Hetao faulted basin zone of its northern boundary are nearly EW trending left\|lateral shear zones with extensional components.All these shear zones have Holocene horizontal and vertical slip rates of 5mm/a and 0 3 3mm/a,respectively.With regard to the history of their development these faulted basin zones have a different timing of initiation.The Weihe and Yinchuan faulted basin zones have at first initiated in Eocene,the Hetao faulted basin zones in Oligocene,and the Shanxi faulted basin zones in Pliocene.During the Cenozoic,the Ordos block has been a situation of slow uplift,with an amount of uplift of 160m since 1 4Ma B.P. For the Ordos internor,the Moho discontinuity is 40~42km in depth,with a gentle variance,and the high conductive layer of the upper mantle is 123~131km in depth,while for the peripheral faulted basin zones of the block,the Moho discontinuity has relatively uplifted about 1 5~6km,and the high conductive layer of the upper mantle is only 70~100km in depth.Deformation analysis from geodetic surveying indicates that the Ordos block and its southwestern boundary area now are still uplifting,with uplift rates of 1~2 8mm/a and 4 4mm/a,respectively,and that the peripheral faulted basin zones are relatively subsiding,with an amount of -4 -5mm/a.Within the internor of the Ordos block,there are a few earthquakes of magnitude 4~5,and no earthquakes magnitude equal to and more than 6. All the earthquakes whose magnitudes are equal to and more than 6 in this area have occurred along peripheral active fault zones and in faulted basin zones.The results of the solutions of mechanism at the sources and the measurments of ground stress and the fault slip vector indicate that the principle compressional stress in the Ordos area is oriented in NE\|NEE,consisting with the regional stress field showed by the kinematic characterics of the peripharal active fault zones of the Ordos block.Such a stress regime may probably come from the Qingzang Block movement which is towards the northeast.On the other hand,the upwelling of deep materials beneath the faulted basins could play an important role in the neotectonic movement of the Ordos block.So the combination of the regional stress field with the upwelling of deep materials controls the dynamics of the Cenozoic Ordos block movements.

[7]
Dušan B, Ján B, Daniel Ket al., 2017. Morphometric and geological conditions for sediment accumulation in the Udava River, Outer Carpathians, Slovakia.Journal of Geographical Sciences, 27(8): 981-998.http://link.springer.com/10.1007/s11442-017-1416-2

DOI

[8]
Font M, Amorese D, Lagarde J L, 2010. DEM and GIS analysis of the stream gradient index to evaluate effects of tectonics: The Normandy intraplate area (NW France).Geomorphology, 119(3):172-180.https://linkinghub.elsevier.com/retrieve/pii/S0169555X10001248Computer-based geomorphometry using a DEM (Digital Elevation Model) allows the analysis of the three-dimensional properties of landscape. This methodology is particularly useful in an intraplate region like western Europe where the simple visual inspection of the topography cannot resolve the evolutionary trends of landforms. In these domains, the morphologies of the topographic surface may be controlled mainly by climate under a low rate of tectonic deformation. Among the geomorphometric parameters, the stream length index ( SL) has been used to characterize fluvial systems in relation to tectonics movements. This work develops an algorithm to derive and map the SL index using a DEM and GIS, to investigate its spatial variations in a broad area. The algorithm is applied to a zone of weak intraplate deformation: the coastal lowlands of Normandy (France). The obtained spatial distributions of SL point to anomalous zones with high SL values. These zones are adjacent to mapped fault scarps and characterized by changes in flow direction. A Kruskal allis test shows that the bedrock lithology has no impact on the SL value. Therefore, the SL variations can be related mainly to a differential uplift due to Quaternary tectonic forcing. Quaternary sea level fluctuations may also be responsible for high SL values in a part of the coastal lowland.

DOI

[9]
Gallen S F, Wegmann K W, 2017. River profile response to normal fault growth and linkage: An example from the Hellenic forearc of south-central Crete, Greece.Earth Surface Dynamics, 5(1): 1-47.https://www.earth-surf-dynam.net/5/1/2017/Understanding the spatial organization of river systems in light of natural and anthropogenic change is extremely important because it can provide information to assess, manage, and restore them to ameliorate worldwide freshwater fauna declines. For gravel- and cobble-bedded alluvial rivers studies spanning analytical, empirical and numerical domains suggest that at channel-forming flows there is a tendency towards covarying bankfull bed and width undulations amongst morphologic units such as pools and riffles, whereby relatively wide areas have relatively higher minimum bed elevations and relatively narrow areas have relatively lower minimum bed elevations. The goal of this study was to determine whether minimum bed elevation and flow-dependent channel top width are organized in a partially confined, incising gravel obbled bed river with multiple spatial scales of anthropogenic and natural landform heterogeneity across a range of discharges. A key result is that the test river exhibited covarying oscillations of minimum bed elevation and channel top width across all flows analyzed. These covarying oscillations were found to be quasiperiodic at channel-forming flows, scaling with the length scales of bars, pools and riffles. Thus, it appears that alluvial rivers organize their topography to have quasiperiodic, shallow and wide or narrow and deep cross section geometry, even despite ongoing, centennial-scale incision. Presumably these covarying oscillations are linked to hydrogeomorphic mechanisms associated with alluvial river channel maintenance. The biggest conclusion from this study is that alluvial rivers are defined more so by variability in topography and flow than mean conditions. Broader impacts of this study are that the methods provide a framework for characterizing longitudinal and flow-dependent variability in rivers for assessing geomorphic structure and aquatic habitat in space, and if repeated, through time.

DOI

[10]
Gao M, Zeilinger G, Xu X et al., 2016. Active tectonics evaluation from geomorphic indices for the central and the southern Longmenshan range on the Eastern Tibetan Plateau, China.Tectonics, 35: 1812-1826.http://doi.wiley.com/10.1002/tect.v35.8We applied the geomorphic indices (hypsometry and stream length gradient) to evaluate the differential uplift of the central and southern Longmenshan, a mountain range characterized by rapid erosion, strong tectonic uplift, and devastating seismic hazards. The results of the geomorphic analysis indicate that the Beichuan-Yingxiu fault and the Shuangshi-Dachuan fault act as major tectonic boundaries separating areas experiencing rapid uplift from slow uplift. The results of the geomorphic analysis also suggest that the Beichuan-Yingxiu fault is the most active fault with the largest relative uplift rates compared to the rest of the faults in the Longmenshan fault system. We compared reflected relative uplift rates based on the hypsometry and stream length gradient indices with geological/geodetic absolute rates. Along-strike and across-strike variations in the hypsometry and stream length gradient correlate with the spatial patterns derived from the apatite fission track exhumation rates, the leveling-derived uplift rate, and coseismic vertical displacements during the 2008 Wenchuan earthquake. These data defined multiple fault relationships in a complex thrust zone and provided geomorphic evidence to evaluate the potential seismic hazards of the southern Longmenshan range.

DOI

[11]
Hack J T, 1973. Stream-profile analysis and stream-gradient index.Journal of Research of the U.S. Geological Survey, 1: 421-429.

[12]
Hamdouni R E, Irigaray C, Fernández T et al., 2008. Assessment of relative active tectonics, southwest border of Sierra Nevada (Southern Spain).Geomorphology, 96: 150-173.https://linkinghub.elsevier.com/retrieve/pii/S0169555X07003893We present a new method for evaluating relative active tectonics based on geomorphic indices useful in evaluating morphology and topography. Indices used include: stream length-gradient index (SL), drainage basin asymmetry (Af), hypsometric integral (Hi), ratio of valley-floor width to valley height (Vf), index of drainage basin shape (Bs), and index of mountain front sinuosity (Smf). Results from the analysis are accumulated and expressed as an index of relative active tectonics (Iat), which we divide into four classes from relatively low to highest tectonic activity. The study area along the southwest border of the Sierra Nevada in southern Spain is an ideal location to test the concept of an index to predict relative tectonic activity on a basis of area rather than a single valley or mountain front. The study area has variable rates of active tectonics resulting from the collision of Africa with Europe that has produced linear east est anticlinal forms, as well as extension with variable vertical rates of normal faulting to about 0.5 m/ky. We test the hypothesis that areas of known, relatively high rates of active tectonics are associated with indicatives values of Iat.

DOI

[13]
Hu X F, Pan B T, Kirby E et al., 2010. Spatial differences in rock uplift rates inferred from channel steepness indices along the northern flank of the Qilian Mountain, northeast Tibetan Plateau.Chinese Science Bulletin, 55(27/28): 3205-3214.http://link.springer.com/10.1007/s11434-010-4024-4The rate and distribution of deformation along the Qilian Mountain, on the northeastern Tibetan Plateau, is needed to understand the evolution of high topography associated with the plateau. Recently, a number of empirical studies have provided support for the contention, common to most models of fluvial incision, that rock uplift rate exerts a first-order control on the gradient of longitudinal river profiles. Along the northern Qilian Mountain, this method is used to extract information about the spatial patterns of differential rock uplift. Analysis of the longitudinal profiles of bedrock channels reveals systematic differences in the channel steepness index along the trend of the frontal ranges. Local comparisons of channel steepness reveal that lithology and precipitation have limited influence on channel steepness. Similarly, there is little evidence suggesting that channel steepness is influenced by differences in the sediment loads. We argue that the distribution of channel steepness in the Qilian Mountain is mostly the result of differential rates of rock uplift. Thus, channel steepness indices reveal a lower rock uplift rate in the eastern portion of the Qilian Mountain and a higher rate in the middle and west. The highest rates appear to occur in the middle-west portions of the range, just to the west of the Yumu Shan.

DOI

[14]
Hu X F, Pan B T, Li Q, 2014. Principles of the stream power erosion model and the latest progress in research.Journal of Lanzhou University (Natural Sciences), 50(6): 824-831. (in Chinese)http://www.en.cnki.com.cn/Article_en/CJFDTotal-LDZK201406009.htmThe stream power erosion model, which has been developed in the recent two decades, serves as a new method to quantitatively analyze the geomorphic evolution. This model is built on basic physical processes of stream erosion, practical experiments and some empirical equations, and is simplified to a mathematical model that can be easily applied in modeling and tectonic analysis. In preview studies, this model has been widely used in tectonic uplift rate study and modeling of geomorphic evolution, while great uncertainties would be introduced by some assumptions in the simplifying process. The uncertainties mainly be derived from the slop exponent, stream width, lithology and stream bed sediment. How these factors influence the model and how we can reasonably integrate them into the model are most urgent questions needing an answer. While using the stream power model in a geomorphic study, we paid great attention to those uncertainties so as to increase the reliability of our results.

DOI

[15]
Jiang Z X, 1987. Model of development and rule of evolution of the longitudinal profiles of the valley of the Three Rivers in the northwestern part of Yunnan Province.Acta Geographica Sinica, 42(1): 16-26. (in Chinese)http://en.cnki.com.cn/Article_en/CJFDTOTAL-DLXB198701001.htmThe longitudinal profile of a river valley is morphologically the assemblage of every reach profile in various developing stages and changes in the development and evolution of every reach profile. According to this point of view of time and space, under the condition that the earth crust is under long stabilization after a long and homogeneous speed of uplift, the model diagram of longitudinal profile of the river valley for an idealized drainage with uniform condition is a parabola pattern with the river mouth and the river head as the prime points of the coordinate axis: h = alN. When the river is in an incised erosive stage, the morphology of its longitudinal profile has. a convex parabola pattern. In a stable stage, the river has a stage of graded adjustment and the morphology of its longitudinal profile is a concave parabola pattern. During the transitional stage between incised erosion and graded adjustment, the longituinal river valley profile isali-nearization. From the beginning of rising to the stage of equilibrium an erosional cycle is formed. The geomorphology of the drainage area developes with the erosional cycle and finally a peneplain is formed. The tectonic and drainage condition of the three mentioned rivers', lie on the plateau of Northwestern Yunnan, and conform with the above mentioned hypothesis. Therefore, their development and the evolution of the longitudinal profiles obey the diagram and rule.

[16]
Langbein W B, 1964. Profiles of rivers of uniform discharge.United States Geological Survey Professional Paper, 501B: 119-122.

[17]
Lin X Z, Guo Y, Hou S Z, 2014. Estimation of sediment discharge of ten tributaries of the Yellow River in Inner Mongolia.Journal of Sediment Research, 2: 15-20. (in Chinese)

[18]
Mahmood S A, Gloaguen R, 2012. Appraisal of active tectonics in Hindu Kush: Insights from DEM derived geomorphic indices and drainage analysis.Geoscience Frontiers, 3(4): 407.https://linkinghub.elsevier.com/retrieve/pii/S1674987111001265), valley floor width to valley height ratio () and mountain front sinuosity ().The results obtained from these indices were combined to yield an index of relative active tectonics (IRAT) using GIS. The average of the seven measured geomorphic indices was used to evaluate the distribution of relative tectonic activity in the study area. We defined four classes to define the degree of relative tectonic activity: class 1very high (1.0 ≤ IRAT high (1.3 ≥ IRAT

DOI

[19]
Marple R T, Talwani P, 1993. Evidence of possible tectonic unwarping along the South Carolina coastal plain from an examination of river morphology and elevation data.Geology, 21(7): 651-654.https://pubs.geoscienceworld.org/geology/article/21/7/651-654/191235Although the fault(s) responsible for the 1886 Charleston, South Carolina, earthquake have not yet been identified (primarily because of the lack of surface rupture), evaluation of Landsat imagery, aerial photography, and topographic maps have revealed an 200-km-long, 15-km-wide, north- northeast-trending zone composed of subtle topographic highs and morphologic changes in rivers that may be associated with tectonic activity. River anomalies observed within this zone include river bends that are convex toward the north- northeast, incised channels, changes in river patterns, and convex-upward longitudinal profiles. Analyses of geologic and geophysical data further indicate that these surface features may be the result of ongoing tectonic uplift along a north-northeast-trending fault zone possibly associated with recent seismicity near Charleston.

DOI

[20]
Merritts D, Vincent K R, 1989. Geomorphic response of coastal streams to low, intermediate, and high rates of uplift, Mendocino triple junction region, northern California.Geological Society of America Bulletin, 110(11): 1373-1388.

[21]
Miller S R, Sak P B, Kirby E et al., 2013. Neogene rejuvenation of central Appalachian topography: Evidence for differential rock uplift from stream profiles and erosion rates.Earth & Planetary Sciences Letters, 369(3): 1-12.http://www.sciencedirect.com/science/article/pii/S0012821X1300188XThe persistence of topography within ancient orogens remains one of the outstanding questions in landscape evolution. In the eastern North American Appalachians, this question is manifest in the outstanding problem of whether topographic relief is in a quasi-equilibrium state, decaying slowly over many millennia, or whether relief has increased during the late Cenozoic. Here we present quantitative geomorphic data from the nonglaciated portion of the Susquehanna River drainage basin that provide insight into these end-member models. Analysis of channel profiles draining upland catchments in the northern Valley and Ridge, Appalachian Plateau, Blue Ridge, and Piedmont provinces reveals that a large number of streams have well defined knickpoints clustered at 300-600 m elevation but not systematically associated with transitions from weak to resistant substrate. Cosmogenic Be-10 inventories of modern stream sediment indicate that erosion rates are spatially variable, ranging from similar to 5-30 m/Myr above knickpoints to similar to 50-100 m/Myr below knickpoints. Overall, channel gradients, normalized for drainage area, scale linearly with catchment-averaged erosion rates. Collectively, regionally consistent spatial relationships among erosion rate, channel steepness, and knickpoints reveal an ongoing wave of transient channel adjustment to a change in relative base level. Reconstructions of relict channel profiles above knickpoints suggest that higher rates of incision are associated with similar to 100-150 m of relative base level fall that accompanied epierogenic rock uplift rather than a change to a more erosive climate or drainage reorganization. Channel response timescales imply that the onset of relative base level change predates similar to 3.5 Ma and may have begun as early as similar to 15 Ma. We suggest that adjustment of the channel network was likely driven by changes in mantle dynamics along the eastern seaboard of North America during the Neogene. (C) 2013 Elsevier B.V. All rights reserved.

DOI

[22]
Ohmori H, 1991. Change in the mathematical function type describing the longitudinal profile of a river through an evolutionary process.Journal of Geology, 99: 97-110.https://www.journals.uchicago.edu/doi/10.1086/629476Japanese rivers where a large amount of sediment accumulates along the middle reaches are today not at grade. Nevertheless, most of their longitudinal profiles can be described by one of the mathematical functions proposed for graded rivers. For these rivers, the mathematical function should show an aspect of fluvial processes different from the explanations of grade theories. The geomorphological significance of differences in the mathematical functions describing the longitudinal profiles of rivers is discussed here. A dynamic change in the shape of longitudinal profile of a river accompanying the change in mathematical function type is proposed in relation to changes in fluvial processes and stage of evolution of a river. Most Japanese rivers can be described by either exponential or power functions. The fluvial processes of the rivers described by exponential functions are in the depositional state. The front of depositional area of gravels increases in altitude and migrates downstream. The rivers expressed by power functions are in the transportational state. The front of depositional area of gravels decreases in altitude and migrates downstream. The rivers matched by linear functions, indicating that their longitudinal profiles are almost straight lines, are in mass equilibrium: the sediment load is balanced between inflow and outflow. Through aggradational processes, the shape of longitudinal profile of a river changes with the change in mathematical function type, from exponential, to power, and finally to linear functions. The difference in the type of function best fitting the longitudinal profile of a river reflects variations in fluvial processes and the evolutionary stage of the river.

DOI

[23]
Owono F M, Ntamak-Nida M J, Dauteuil Oet al., 2016. Morphology and long-term landscape evolution of the South African plateau in South Namibia.Catena, 142: 47-65.https://linkinghub.elsevier.com/retrieve/pii/S034181621630057161We document the different behaviour of the Namibia rivers.61The formation of the scarps results from the balance between weathering and erosion.61Planation surfaces differ by their elevation, slope, relative relief and incision.61The Interior Great Escarpment represents a cliff of more than 200 m high.61Climates processes and tectonics control the evolution of the interior plateau.

DOI

[24]
Pan B T, Li Q, Hu X Fet al., 2015. Bedrock channels response to differential rock uplift in eastern Qilian Mountain along the northeastern margin of the Tibetan Plateau.Journal of Asian Earth Sciences, 100: 1-19.https://linkinghub.elsevier.com/retrieve/pii/S1367912015000048The response of bedrock channels to differential rock uplift in eastern Qilian Mountain significantly dictates the topographic evolution of the northeastern margin of the Tibetan Plateau. Our ability to extract tectonic information directly from channel profiles mainly depends on the calibration of incision processes laws. Here we assess the degree and nature of channels response to differential rock uplift in eastern Qilian Mountain base on an empirical calibration of the shear-stress incision model utilizing field survey data (lithologic resistance, sediment flux, discharge and channel width). Parameters calibration indicates that channels developed in the high mountain zone (HMZ) show an approximate 1.1 1.3 times increase in erosion coefficient K than in the low mountain zone (LMZ), mainly attributing to the adjustments of channel width and discharge. Moreover, profiles analysis reveals a systematic geographic distribution of steepness indices and concavity in this area. The regions of high and low steepness indices are spatially associated with the higher (high rock uplift rates) and lower (low rock uplift rates) parts of landscape, respectively, suggesting that the spatial distribution pattern of channel steepness mainly reflects the differential rock uplift. Channels with abnormal high concavity values apparently associate with the major thrust faults, suggesting that the differential rock uplift is controlled by the thrusting of major active faults. Combining parameters calibration with profile analysis between the two zones, the possible increase in rock uplift rates is 2 4 times in the HMZ than in the LMZ indeed.

DOI

[25]
Pérez-Peña J V, Azañón J M, Azor Aet al., 2010. Spatial analysis of stream power using GIS: SLk anomaly maps.Earth Surface Processes & Landforms, 34(1): 16-25.http://onlinelibrary.wiley.com/doi/10.1002/esp.1684/pdfThe stream length-gradient index (SL) shows the variation in stream power along river reaches. This index is very sensitive to changes in channel slope, thus allowing the evaluation of recent tectonic activity and/or rock resistance. Nevertheless, the comparison of SL values from rivers of different length is biased due to the manner in which the index is formulated, thus making correlations of SL anomalies along different rivers difficult. Therefore, when undertaking a comparison of SL values of rivers of different lengths, a normalization factor must be used. The graded river gradient ( K ) has already been used in some studies to normalize the SL index. In this work, we explore the relationships between the graded river gradient ( K ), the SL index and the stream power, proposing the use of a re-named SLk index, which enables the comparison of variable-length rivers, as well as the drawing of SLk anomaly maps. We present here a GIS-based procedure to generate SLk maps and to identify SLk anomalies. In order to verify the advantages of this methodology, we compared an SLk map of the NE border of the Granada basin with both simple river profile-knickpoint identification and with an SL map. The results show that the SLk map supplies good results with defined anomalies and suitably reflects the main tectonic and lithological features of the study area. Copyright 2008 John Wiley & Sons, Ltd.

DOI

[26]
Phillips J D, Lutz J D, 2008. Profile convexities in bedrock and alluvial streams.Geomorphology, 102(3): 554-566.https://linkinghub.elsevier.com/retrieve/pii/S0169555X08002560Longitudinal profiles of bedrock streams in central Kentucky, and of coastal plain streams in southeast Texas, were analyzed to determine the extent to which they exhibit smoothly concave profiles and to relate profile convexities to environmental controls. None of the Kentucky streams have smoothly concave profiles. Because all observed knickpoints are associated with vertical joints, if they are migrating it either occurs rapidly between vertical joints, or migrating knickpoints become stalled at structural features. These streams have been adjusting to downcutting of the Kentucky River for at least 1.302Ma, suggesting that the time required to produce a concave profile is long compared to the typical timescale of environmental change. A graded concave longitudinal profile is not a reasonable prediction or benchmark condition for these streams. The characteristic profile forms of the Kentucky River gorge area are contingent on a particular combination of lithology, structure, hydrologic regime, and geomorphic history, and therefore do not represent any general type of equilibrium state. Few stream profiles in SE Texas conform to the ideal of the smoothly, strongly concave profile. Major convexities are caused by inherited topography, geologic controls, recent and contemporary geomorphic processes, and anthropic effects. Both the legacy of Quaternary environmental change and ongoing changes make it unlikely that consistent boundary conditions will exist for long. Further, the few exceptions within the study area–i.e., strongly and smoothly concave longitudinal profiles–suggest that ample time has occurred for strongly concave profiles to develop and that such profiles do not necessarily represent any mutual adjustments between slope, transport capacity, and sediment supply. The simplest explanation of any tendency toward concavity is related to basic constraints on channel steepness associated with geomechanical stability and minimum slopes necessary to convey flow. This constrained gradient concept (CGC) can explain the general tendency toward concavity in channels of sufficient size, with minimal lithological constraints and with sufficient time for adjustment. Unlike grade- or equilibrium-based theories, the CGC results in interpretations of convex or low-concavity profiles or reaches in terms of local environmental constraints and geomorphic histories rather than as “disequilibrium” features.

DOI

[27]
Pipaud I, Loibl D, Lehmkuhl F, 2015. Evaluation of TanDEM-X elevation data for geomorphological mapping and interpretation in high mountain environments: A case study from SE Tibet, China.Geomorphology, 246: 232-254.https://linkinghub.elsevier.com/retrieve/pii/S0169555X15300428Highlights 61 An experimental DEM with 15&nbsp;m posting was processed from TanDEM-X CoSSC data. 61 Landform cognoscibility in the new DEM was evaluated and compared to SRTM and ASTER. 61 Detailed geomorph. mapping using the TanDEM-X DEM and basic derivatives was applied. 61 Geomorphometric analysis was carried out to complement visual DEM assessment. 61 TanDEM-X data has high potential for DEM-based geomorphological applications. Abstract Digital elevation models (DEMs) are a prerequisite for many different applications in the field of geomorphology. In this context, the two near-global medium resolution DEMs originating from the SRTM and ASTER missions are widely used. For detailed geomorphological studies, particularly in high mountain environments, these datasets are, however, known to have substantial disadvantages beyond their posting, i.e., data gaps and miscellaneous artifacts. The upcoming TanDEM-X DEM is a promising candidate to improve this situation by application of state-of-the-art radar technology, exhibiting a posting of 12&nbsp;m and less proneness to errors. In this study, we present a DEM processed from a single TanDEM-X CoSSC scene, covering a study area in the extreme relief of the eastern Nyainqêntanglha Range, southeastern Tibet. The potential of the resulting experimental TanDEM-X DEM for geomorphological applications was evaluated by geomorphometric analyses and an assessment of landform cognoscibility and artifacts in comparison to the ASTER GDEM and the recently released SRTM 1″ DEM. Detailed geomorphological mapping was conducted for four selected core study areas in a manual approach, based exclusively on the TanDEM-X DEM and its basic derivates. The results show that the self-processed TanDEM-X DEM yields a detailed and widely consistent landscape representation. It thus fosters geomorphological analysis by visual and quantitative means, allowing delineation of landforms down to footprints of ~&nbsp;30&nbsp;m. Even in this premature state, the TanDEM-X elevation data are widely superior to the ASTER and SRTM datasets, primarily owing to its significantly higher resolution and its lower susceptibility to artifacts that hamper landform interpretation. Conversely, challenges toward interferometric DEM generation were identified, including (i) triangulation facets and missing topographic information resulting from radar layover on steep slopes facing toward the radar sensor, (ii) low coherence values on leeward slopes, (iii) decorrelation effects over water bodies, and (iv) challenges for phase unwrapping in settings of strong topographic contrasts. There is, however, a high probability that these drawbacks can be overcome by applying multiple interferograms exhibiting different perpendicular baselines as planned for the generation of the final TanDEM-X DEM product. Graphical abstract

DOI

[28]
Rãdoane M, Rãdoane N, Dan D, 2003. Geomorphological evolution of longitudinal river profiles in the Carpathians.Geomorphology, 50(4): 293-306.http://linkinghub.elsevier.com/retrieve/pii/S0169555X02001940The main rivers which drain the east and southeast side of the Eastern Carpathians and those that drain the Southern Carpathians have been analysed regarding the sediment transit, the change of the riverbeds and the type of channel deposits. In this paper, attention is focused on the concavity of the stream profile. On this basis, we tried to determine the evolution of some Carpathian rivers and thus estimate their long-term evolutionary tendencies. The concavity index of the east-Carpathian rivers shows a trend to increase from north to south from the Eastern Carpathians to the Carpathian Bend and the Bucegi Mountains. The explanation of this situation required a review of the evolutionary stages of the Eastern Carpathians, in order to establish the age and the evolutionary tendencies of the river network in our study area: the Rivers Suceava, Moldova and Bistri00a have followed the same courses since the Sarmathian (approximately 13.5 million years ago); the Trotu06 River, between 10 million and 5.4 million years ago); the Rivers Putna, Buz00u, Prahova, and Ialomi00a suffered the most important changes, so the age of their present course is about 2.5 million years. The rivers could be grouped according to the mathematical model which fits best: the exponential, exponential–logarithmic, and logarithmic model. Finally, we tried to correlate the age of the river with the form of its longitudinal profile. The customary theoretical models require that: the older a river is, the more its concavity should increase in the headwater area and should asymptotically approach a longitudinal equilibrium profile or “grade” as Davis calls it. However, the Carpathian rivers do not follow this general tendency. What we have demonstrated is that age had no influence on the form of the longitudinal profiles for the rivers on the exterior side of the Carpathians. This is because tectonic uplift was important, and this phenomenon is still present today with values of over 6 mm/year.

DOI

[29]
Rhea S, 1989. Evidence of uplift near Charleston, South Carolina.Geology, 17(4): 311-315.https://pubs.geoscienceworld.org/geology/article/17/4/311-315/187740In spite of extensive research, the causal structure of the 1886 magnitude 7 earthquake near Charleston, South Carolina, has not been identified. In this study I analyzed digital surface topography and river morphology in light of earlier studies using seismic reflection, seismic refraction, earthquake seismology, and gravity and magnetic surveys. This analysis revealed an area approximately 400 kmnorthwest of Charleston that may have been repeatedly uplifted by earthquakes. Geologic and seismic reflection data confirm alteration of formations at depth. Deformation of the surface is supported by observations on aerial and LANDSAT photographs. Therefore, the structure on which the 1886 earthquake occurred may be within the uplifted area defined in this report.

DOI

[30]
Snow R S, Slingerland R L, 1987. Mathematical modeling of graded river profiles.Journal of Geology, 95(1): 15-33.https://www.journals.uchicago.edu/doi/10.1086/629104Numerical modeling of the longitudinal profiles of rivers at grade is accomplished using the basic equations of open-channel flow, sediment transport equations, and empirical relations for downstream variation in flow discharge, sediment discharge, sediment caliber, and channel width. Only in some cases are the computed stream profiles fit exactly by any one of the commonly supported mathematical function analogs to graded profile form-exponential, logarithmic, or power function, but in most cases any of these functions can provide a fit with a degree of error smaller than would be noted in treating field data. Profiles dominated by spatial change in fluid and sediment discharge are distinctly power functions, while profiles dominated by sediment size reduction are not necessarily exponential in form. Other important controls on profile shape are the degree of downstream width change in response to increasing discharge and the general range of sediment size. A dynamic model of a river''s approach to grade indicates that disequilibrium river profiles closely approximate a graded profile shape even while the general slope is relatively high, and significant erosion remains to achieve equilibrium.

DOI

[31]
Summerfield M A, 1991. Global Geomorphology. Longman:Singapore.

[32]
Wang H Z, 1985. Atlas of the Palaeo-Geography of China. Beijing: Sinomap Press. (in Chinese)

[33]
Wang Q S, Teng J W, An Y Let al., 2010. Gravity field and deep crustal structures of the Yinshan Orogen and the northern Ordos Basin.Progress in Geophysics, 25(5): 1590-1598. (in Chinese)

[34]
Whipple K X, Hancock G S, Anderson R S, 2000. River incision into bedrock: Mechanics and relative efficacy of plucking, abrasion, and cavitation.Geological Society of America Bulletin, 112(3): 490-503.https://pubs.geoscienceworld.org/gsabulletin/article/112/3/490-503/183620Presents qualitative field evidence on the relative efficacy of the various processes of fluvial erosion such as plucking, abrasion, cavitation and solution, into river bedrock. Inference from detailed observation of the morphology of erosional forms on channel beds and banks; Importance of the study for the study of long-term landscape evolution.

DOI

[35]
Whipple K X, Tucker G E, 1999. Dynamics of the stream power river incision model: Implications for height limits of mountain ranges, landscape response timescales, and research needs.Journal of Geophysical Research, 104(B8): 17661-17674.http://doi.wiley.com/10.1029/1999JB900120The longitudinal profiles of bedrock channels are a major component of the relief structure of mountainous drainage basins and therefore limit the elevation of peaks and ridges. Further, bedrock channels communicate tectonic and climatic signals across the landscape, thus dictating, to first order, the dynamic response of mountainous landscapes to external forcings. We review and explore the stream-power erosion model in an effort to (1) elucidate its consequences in terms of large-scale topographic (fluvial) relief and its sensitivity to tectonic and climatic forcing, (2) derive a relationship for system response time to tectonic perturbations, (3) determine the sensitivity of model behavior to various model parameters, and (4) integrate the above to suggest useful guidelines for further study of bedrock channel systems and for future refinement of the streampower erosion law. Dimensional analysis reveals that the dynamic behavior of the stream-power erosion model is governed by a single nondimensional group that we term the uplift-erosion number, greatly reducing the number of variables that need to be considered in the sensitivity analysis. The degree of nonlinearity in the relationship between stream incision rate and channel gradient (slope exponent n) emerges as a fundamental unknown. The physics of the active erosion processes directly influence this nonlinearity, which is shown to dictate the relationship between the uplift-erosion number, the equilibrium stream channel gradient, and the total fluvial relief of mountain ranges. Similarly, the predicted response time to changes in rock uplift rate is shown to depend on climate, rock strength, and the magnitude of tectonic perturbation, with the slope exponent n controlling the degree of dependence on these various factors. For typical drainage basin geometries the response time is relatively insensitive to the size of the system. Work on the physics of bedrock erosion processes, their sensitivity to extreme floods, their transient responses to sudden changes in climate or uplift rate, and the scaling of local rock erosion studies to reach-scale modeling studies are most sorely needed.

DOI

[36]
Xu J X, 2013. Erosion and sediment yield of ten small tributaries joining Inner Mongolia reach of upper Yellow River in relation to coupled wind-water processes and hyper-concentrated flows.Journal of Sediment Research, (6): 27-36. (in Chinese)

[37]
Xu J X, 2014. Temporal and spatial variations in erosion and sediment yield and the cause in the ten small tributaries to the Inner Mongolia Reach of the Yellow River.Journal of Desert Research, 34(6): 1641-1649. (in Chinese)http://en.cnki.com.cn/Article_en/CJFDTotal-ZGSS201406028.htmSediment supply from the ten small tributaries causes strong sedimentation in the upper Yellow River.For the purpose of reducing sediment-related disasters through soil erosion control measures in the ten small tributaries,we studied the soil erosion regularity in the ten small tributaries based on data of sediment load,runoff and precipitation from1960 to 2005.The total sediment supply in the 46 years was highly concentrated in a few years with large sediment load and runoff,and the sediment yield from the remaining years made little contribution.The cumulative maximum 1-year,3-year,5-year and 10-year sediment yield accounts for 21.26%,37.18%,47.92% and 69.29% of the 46-year's total,respectively.Comparison with during1960-1991,the annual sediment yield from the Xiliugou River during 1992-2005 decreased by 37%.This difference can be explained by two factors,the difference in rainstorms and the variation of vegetation.After 1990,although annual precipitation shows no significant change,the maximum1-day rainfall has a decreasing trend(p0.10).The NDVI shows an increasing trend(p0.01),which is caused by the transfer of surplus rural labors out of the land.The specific sediment yield shows clear spatial difference.In the ten small tributaries,it increases from west to east,reaching the maximum in the Xiliugou River,and then decreases.In the same direction,annual precipitation increases,the frequency of sand-dust storms decreases,and the types of sand dunes gradually change from movable to semi-fixed ones.Thus,the wind-blown sand to the rivers decreases,while the erosion and sediment transport by water increases.The superposing of these two processes leads to the occurrence of a peak of specific sediment yield near the Xiliugou River.

[38]
Yang M, Li L, Zhou J et al., 2015. Mesozoic structural evolution of the Hangjinqi area in the northern Ordos Basin, North China.Marine and Petroleum Geology, 66: 695-710.https://linkinghub.elsevier.com/retrieve/pii/S026481721530035061Three tectono-sequences separated by four erosional surfaces have been recognized.61Tectonic inversion occurred due to the changes of the HFZ from dextral to sinistral.61Late Triassic compression was related to the collision between the NCC and the Yangtze Plate.61Middle Jurassic transtension was caused by oblique subduction of the paleo-Pacific Plate.

DOI

[39]
Yao H, Shi C, Shao W, 2016. Changes and influencing factors of the sediment load in the Xiliugou basin of the upper Yellow River, China.Catena, 142: 1-10.https://linkinghub.elsevier.com/retrieve/pii/S034181621630053461The hyperconcentrated floods are common in the Xiliugou basin.61The hyperconcentrated floods transferred the most of sediment yield.61The gully erosion played a dominate role in the Xiliugou basin.61Human activities reduced sediment yield by damping hyperconcentrated flows.

DOI

[40]
Yu H Y, Luo L, Ma H Het al., 2017. Application appraisal in catchment hydrological analysis based on SRTM 1 Arc-second DEM.Remote Sensing for Land & Resources, 29(2): 138-143. (in Chinese)http://www.en.cnki.com.cn/Article_en/CJFDTotal-GTYG201702020.htmHigh-precision DEM data constitute the basis of watershed hydrology analysis. SRTM 1 Arc-Second Global elevation data,released by US Geological Survey,offer worldwide coverage data at a resolution of 1″( 30m). In order to evaluate and analyze the potential watershed hydrologic applications of SRTM,the authors used Tanghe watershed in Hebi as the experimental area and airborne LiDAR DEM data as a reference to assess vertical accuracy of SRTM( 1″) data and the impact of slope,aspect,land cover on errors of SRTM( 1″). Hydrologic indexes based on the terrain,such as Topographic Wetness Index( TWI),Length Slope Factor( LSF) and Stream Power Index( SPI),were computed for analysis. Finally the basin's characteristic parameters,such as catchment basin area,longest path length,shape factor,curvature coefficient,were extracted from the two DEM data and the results were compared. Studies show that SRTM( 1″) DEM data have high precision,the RMSE of the original data is 5. 98 m,and the RMSE of the data with the elimination of the plane displacement is reduced to 4. 32 m.Hydrological analysis shows that SRTM DEM and LiDAR DEM produce some different results: the average of TWI of SRTM is slightly higher,the average of SLF and SPI is lower and the dispersion degree is smaller. This is associated with the terrain distortion of SRTM DEM in micro-topography and high slope area. The basin parameters extracted from both of the DEM data have smaller differences,which shows that SRTM DEM( 1″) has wide application prospects in hydrologic analysis.

[41]
Yue L P, Li J X, Zheng G Z et al. , 2007. Evolution of the Ordos Plateau and environmental effects.Science in China (Series D: Earth Sciences), 50(Suppl.2): 19-26.http://link.springer.com/10.1007/s11430-007-6013-2Based on the analysis of temporary-spatial distribution, geomorphic position, contact relationship with underlying strata and grain size of red clay, we studied the formation and environmental background of red clay. During late Miocene-Pliocene, the Ordos Block finished the transformation from the basin to the plateau, which had an obvious environmental effect on the topography, indicated by the formation of highland undergoing wind erosion and lowland receiving red clay deposits. The red clay materials were sourced from dusts carried by wind energy and covered on the initial topography. Unlike Quaternary loess dust covering the overall the Loess Plateau, red clay deposited on the highland would be transported to the lowlands by wind and fluvial process. As a result, there was no continuous ed Clay Plateau in the Ordos region and red clay was only preserved in former lowlands. However, red clay was discontinuously distributed through the Loess Plateau and to some extent modified the initial topography. The differential uplift in interior plateau is indicated by the uplift of northern Baiyushan, central Ziwuling and southern Weibeibeishan. The Weibeibeishan Depression formed earlier and became the sedimentary center of red clay resulting in the thicker red clay deposits in Chaona, Lingtai and Xunyi. Since Quaternary the aridity in the northern plateau enhanced and accelerated loess accumulation caused the formation of the Loess Plateau. During the late Pleistocene the rapid uplift led to the enhancement of erosion. Especially after the cut-through of Sanme Lake by the Yellow River, the decline of base level caused the falling of ground water level and at the same time the increase of drainage density resulting in the enhancement of evaporation capacity, which enhanced the aridity tendency of aridity in the Loess Plateau region.

DOI

[42]
Zhang Y Q, Teng J W, Wang F Yet al., 2011. Structure of the seismic wave property and lithology deduction of the upper crust beneath the Yinshan orogenic belt and the northern Ordos Block.Chinese Journal of Geophysics, 54(1): 87-97. (in Chinese)http://en.cnki.com.cn/Article_en/CJFDTOTAL-DQWX201101009.htmA deep seismic wide-angle reflection/refraction sounding profile was set across the Yinshan orogenic belt and the northern Ordos basin.Using the travel time data obtained from the seismic sounding record,we determined the S wave velocity structure of the upper crust beneath the profile.Meanwhile,we calculated the Poisson ratio distribution along the profile using both the P wave and S wave velocity data.Based on the seismic wave field properties and structure,as well as the geological research result and the borehole data,the lithological distribution beneath the profile was deducted.The research result suggests that this profile could be divided into four major parts,which are the northern part of the Ordos basin,the Hubao depression basin, Yinshan orogenic belt and the Sunit fold system.There exist different characteristics in velocity structure,Poisson ratio distribution,and lithological composition in these four tectonic units.On basis of all the research mentioned above,we discussed the occurrence and exploitation prospects of mineral resources,coal,oil and gas energy in different tectonic units along the profile.

DOI

[43]
Zhao G H, Li Y, Yan Z Ket al., 2014. Tectonic geomorphology analysis of piedmont rivers in the middle MT. Longmenshan based on Hack profile and hypsometric integral.Quaternary Sciences, 34(2): 302-310. (in Chinese)http://www.en.cnki.com.cn/Article_en/CJFDTOTAL-DSJJ201402004.htmThe Mt.Longmenshan is located at the eastern margin of the Qinghai-Tibetan Plateau.It is not the one which has the greatest transmutation of steepness among those around the Qinghai-Tibetan Plateau,but also one of the areas where the strongest climate and tectonic activities have been happened.In recent years,the apparent seismic activity around the Mt.Longmenshan has included the Wenehuan Earthquake(magnitude 8.0)and the Lushan Earthquake(magnitude 7.0),occurring in 2008 and 2013,respectively.Thus,this area has been one of the best places to study the relationships about tectonic-geomorphy-water system.Tectonic activity has important influence on stream development and shape(including shape of longitudinal profile,plane configuration,three dimension landforms).The paper has extracted the drainage basins of 5 rivers,which they are Qianjiang River(R_1),Jinhe River(R_2),Mianyuanhe River(R_3),Ganhezi River(R_4)and Anchanghe River(R_5)in the middle segment of Mt.Longmenshan,and their sub-drainage basins by using GIS technology.Hack Profile,SL Index(SL)and Gradient Index(SL/K)are examined for concavity studies of each profile and withdraw hypsometric integral from5 drainage basins and their sub-drainage basins.By the analysis of above parameters,we state that Convex Hack profile of 5 rivers shows that piedmont drainage basins of the middle Mt.Longmenshan is in the stage of tectonic uplifting in the Cenozoic.The river segments with abnormally high SL values,which mainly represented faults activity of study area.The obviously high SL values appear in Yingxiu-Beichuan fault,which shows the strongest activity of the fault zone.It is transitional stage in "manhood" and "old age",because of hypsometric curves of 5rivers from S-shaped to concave development in the piedmont of middle Mt.Longmenshan.However,the tectonic processes are distinguished in the study area,which tectonic activities are declining from the middle-south to northwest segment along the piedmont of middle Mr.Longmenshan.

[44]
Zheng M L, Jin Z J, Wang Y et al., 2006. Structural characteristics and evolution of the North Ordos Basin in Late Mesozoic and Cenozoic.Journal of Earth Sciences and Environment, 28(3): 31-36. (in Chinese)

Outlines

/