Research Articles

Developing a comprehensive evaluation method for Interconnected River System Network assessment: A case study in Tangxun Lake group

  • YANG Wei , 1, 2 ,
  • ZHANG Liping 1 ,
  • ZHANG Yanjun , 1, * ,
  • LI Zongli 3 ,
  • XIAO Yi 1 ,
  • XIA Jun 1
Expand
  • 1. State Key Laboratory of Water Resources and Hydropower Engineering Science, Wuhan University, Wuhan 430072, China
  • 2. Hubei Provincial Water Resources and Hydropower Planning Survey and Design Institute, Wuhan 430064, China
  • 3. General Institute of Water Resources and Hydropower Planning and Design, Ministry of Water Resources, Beijing 100120, China
*Corresponding author: Zhang Yanjun (1982-), PhD and Associate Professor, E-mail:

Author: Yang Wei (1991-), PhD, specialized in numerical simulation of water environment. E-mail:

Received date: 2018-03-01

  Accepted date: 2018-05-08

  Online published: 2019-03-20

Supported by

National Key Research and Development Program, No.2017YFA0603704, No.2017YFC1502500

Copyright

Journal of Geographical Sciences, All Rights Reserved

Abstract

The Interconnected River System Network (IRSN) plays a crucial role in water resource allocation, water ecological restoration and water quality improvement. It has become a key part of the urban lake management. An evaluation methodology system for IRSN project can provide important guidance for the selection of different water diversion schemes. However, few if any comprehensive evaluation systems have been developed to evaluate the hydrodynamics and water quality of connected lakes. This study developed a comprehensive evaluation system based on multi-indexes including aspects of water hydrodynamics, water quality and socioeconomics. A two-dimensional (2-D) mathematical hydrodynamics and water quality model was built, using NH3-N, TN and TP as water quality index. The IRSN project in Tangxun Lake group was used as a testbed here, and five water diversion schemes were simulated and evaluated. Results showed that the IRSN project can improve the water fluidity and the water quality obviously after a short time of water diversion, while the improvement rates decreased gradually as the water diversion went on. Among these five schemes, Scheme V showed the most noticeable improvement in hydrodynamics and water quality, and brought the most economic benefits. This comprehensive evaluation method can provide useful reference for the implementation of other similar IRSN projects.

Cite this article

YANG Wei , ZHANG Liping , ZHANG Yanjun , LI Zongli , XIAO Yi , XIA Jun . Developing a comprehensive evaluation method for Interconnected River System Network assessment: A case study in Tangxun Lake group[J]. Journal of Geographical Sciences, 2019 , 29(3) : 389 -405 . DOI: 10.1007/s11442-019-1605-2

1 Introduction

In urban systems, lakes play a key role in maintaining ecological balance by providing water supply, regulating runoff, adjusting climate, defending flood and conserving biodiversity. However, with the acceleration of the urbanization process and the increasing of urban population density, more and more urban lakes have been encroached upon and become fragmented (Tan et al., 2012). Meanwhile, industrial and municipal wastewater exacerbates the pollution problems in these water bodies. Both of the hydraulic and quality conditions degrade the regulating function of urban lakes and influence ecosystems balance. Most urban lakes’ water quality cannot meet the daily functional requirements (Chen, 2010), poses serious threats to the ecological security and the health of urban residents.
The concept of the Interconnected River System Network (IRSN) is proposed to provide a new approach for solving the environmental problems of water networks (Zuo et al., 2011). By enhancing the hydraulic liquidity and continuity in water bodies, IRSN can help improve water bodies’ self-recovery ability and realize the long-term health and stability. This method has been widely applied in projects of water resource allocation, water ecological restoration and water quality improvement (Cui et al., 2011; Li et al., 2011). Many scholars have analyzed the effect of the IRSN project, but both technical theory and assessment methods of IRSN still remain in the exploratory stage (Li et al., 2011). Kang Ling et al. (2012) established a hydrodynamic and water quality model to analyze the water quality improvement of COD, TN and TP under three schemes. Xie et al. (2009) demonstrated that water transfer project could effectively decrease the TN, TP and Chl-a concentration of Chaohu Lake. To evaluate the performance of different water diversion cases, Chen et al. (2015) used multi-indexes including water quality improvement rate, category change index and concentration change index. Besides the water quality indicators mentioned above, other useful indicators are used to evaluate hydrodynamics improvement. Li et al. (2011, 2013) used the water age to describe spatiotemporal environmental benefits in the water transfer process. The concept of water exchange rate was applied to analyze the river network’s hydrodynamics of multiple water diversion plans (Lu et al., 2015). The cost and benefit evaluation indexes are also applied to determine the optimal diversion flow discharge of IRSN projects (Liu J M et al., 2014). Xie et al. (2015) used the river water surface curve, the water area ratio and the ecological water requirement to estimate the flood control effect, the ecological effect and the water landscape effect of the IRSN in Chaozhou City. Cui et al. (2017) proposed a river network connectivity assessment method based on the concept of structural connectivity and functional connectivity.
Most previous studies used a single index to evaluate the hydrodynamics or water quality effect and determine the optimal connectivity scheme, and few if any considered both the hydrodynamics and water quality to give an overall evaluation for the IRSN projects. In this paper, a comprehensive evaluation system was built based on multiple evaluation indexes, including water hydrodynamics, water quality and socioeconomics. And a two-dimensional (2-D) mathematical hydrodynamic and water quality model was built. We use the Tangxun Lake group as a testbed to test this evaluation system under different IRSN schemes.

2 Study area

The Tangxun Lake is the largest urban lake in China, with a water surface area of 52.19 km2 and a storage capacity of 32.85 million m3. It is located in the middle and lower reaches of the Yangtze River, and serves as the backup water source area for Wuhan, the capital city of Hubei Province. The Tangxun Lake Basin is a complicated water network system consisting of rivers and lakes (Figure 1).
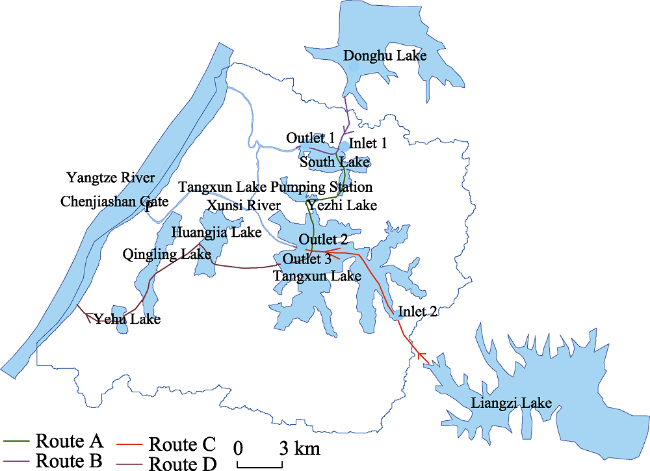
Figure 1 Sketch of the Interconnected River System Network project of the Tangxun Lake group
With accelerating urbanization and increasing pollutants in recent decades, water quality in Tangxun Lake deteriorated gradually (Chu et al., 2009; Yang et al., 2009). According to the National Surface Water Quality Standards of China (GB3838-2002), the average water quality of the lake could meet Grade IV during 2011-2013, but it has deteriorated to Grade V since 2014. The water quality of the surrounding lakes such as South Lake, Yehu Lake and Yezhi Lake is even worse than Grade V (WMWA, 2011-2016). These surrounding lakes are in the moderate eutrophication stage and they cannot meet the basic ecological function requirements. To improve water quality and alleviate eutrophication, the IRSN project was put forward by the Wuhan Municipal Government. This project is designed to reestablish the hydraulic connection of the Tangxun Lake group to the Dadonghu Lakes and the Liangzi Lake via some existing and newly-built channels (see Section 5.1 for more details).

3 Methodology

3.1 The DEM-based parallel computing hydrodynamic and water quality model

The Tangxun Lake is a typical shallow lake with a mean water depth of 1.5-3.3 m, and the bottom slope is about 0.005. The horizontal scale is greater than the vertical scale. We only consider the 2-D horizontal water flow simulation with an evenly distributed water flow in the vertical direction. This 2-D hydrodynamic and water quality model is based on the continuity equation, momentum equation and transport equation to simulate the flow field and water concentration (Zhang et al., 2008; Zhang et al., 2012).
(1) Hydrodynamic model
The continuity equation and momentum equations can be expressed as:
$\frac{\partial h}{\partial t}+\frac{\partial hu}{\partial x}+\frac{\partial hv}{\partial y}=q$ (1)
$\begin{matrix} \frac{\partial hu}{\partial t}+u\frac{\partial hu}{\partial x}+v\frac{\partial hu}{\partial y}=fhv-g\frac{\partial {{h}^{2}}}{\partial x}-gh\frac{\partial z}{\partial x}-g{{n}^{2}}\frac{u\sqrt{{{u}^{2}}+{{v}^{2}}}}{{{h}^{{1}/{3}\;}}}+ \\ \frac{\partial }{\partial x}\left( {{\varepsilon }_{x}}h\frac{\partial u}{\partial x} \right)+\frac{\partial }{\partial y}\left( {{\varepsilon }_{x}}h\frac{\partial u}{\partial y} \right)+\frac{{{C}_{a}}{{\rho }_{a}}{{W}_{x}}{{(W_{x}^{2}+W_{y}^{2})}^{{1}/{2}\;}}}{\rho } \\ \end{matrix}$ (2)
$\begin{matrix} \frac{\partial hv}{\partial t}+u\frac{\partial hv}{\partial x}+v\frac{\partial hv}{\partial y}=-fhu-g\frac{\partial {{h}^{2}}}{\partial y}-gh\frac{\partial z}{\partial y}-g{{n}^{2}}\frac{v\sqrt{{{u}^{2}}+{{v}^{2}}}}{{{h}^{{1}/{3}\;}}}+ \\ \frac{\partial }{\partial x}\left( {{\varepsilon }_{y}}h\frac{\partial v}{\partial x} \right)+\frac{\partial }{\partial y}\left( {{\varepsilon }_{y}}h\frac{\partial v}{\partial y} \right)+\frac{{{C}_{a}}{{\rho }_{a}}{{W}_{y}}{{(W_{x}^{2}+W_{y}^{2})}^{{1}/{2}\;}}}{\rho } \\ \end{matrix}$ (3)
where x and y represent vertical and horizontal length of water area, respectively; t is time; q is interzone inflow quantity; u and v represent vertical and horizontal velocity of the water, respectively; h is water depth; z is water level; g is the gravitational constant; f is the Coriolis force constant; n is roughness coefficient; Ca is the wind resistance coefficient; ρ and ρa are the density of water and wind, respectively; εx and εy are vertical and horizontal eddy viscosity coefficients, respectively; Wx and Wy are vertical and horizontal wind speed, respectively.
(2) Water quality model
The mass transport equation can be expressed as:
$\frac{\partial hc}{\partial t}+u\frac{\partial hc}{\partial x}+v\frac{\partial hc}{\partial y}=\frac{\partial }{\partial x}\left( {{E}_{x}}\frac{\partial hc}{\partial x} \right)+\frac{\partial }{\partial y}\left( {{E}_{y}}\frac{\partial hc}{\partial y} \right)+h\sum{{{S}_{i}}}$ (4)
where c is concentration of water quality index; Ex and Ey are the sum of the molecular diffusion coefficient, the turbulent diffusion coefficient and the dispersion coefficient in the x, y direction, respectively; ∑Si is the source and sink terms of water quality index.
The FVM method (Patankar, 1980) was used to discretize the equations, and the equations were solved using the Tri-Diagonal Matrix Algorithm method (TDMA) and the Alternating Direction Implicit method (ADI). The details of these methods can be found in Tao’s study (2001).

3.2 The IRSN scheme evaluation method

In this study, we propose a comprehensive evaluation system based on the aspects of water hydrodynamics, water quality and socioeconomics to evaluate the IRSN effects and determine the optimal connectivity scheme. Mean flow velocity, maximum flow velocity and stagnant water ratio are selected as hydrodynamic indexes. Water quality improvement rate, concentration change index, water quality category ratio and water standard exceeding ratio are selected as water quality indexes. Economic benefits, costs and the net benefits are selected as the socioeconomic indexes. These indexes can reflect the improvement of the lakes from different perspectives, and the implications of the indexes are shown in Table 1.
Table 1 Evaluation system of IRSN scheme
Index categories Indexes Units Implications
Hydrodynamic evaluation indexes Mean flow velocity m/s Reflecting the water renewable capability and the self-purification ability.
Maximum flow velocity m/s Representing the maximum flow velocity of the lake.
Stagnant water ratio % The proportion of the stagnant water area (the velocity less than 0.0006 m/s) to the total area.
Water quality evaluation indexes Water quality improvement rate % Reflecting the change trend of water quality indexes in lakes.
Concentration change index - Reflecting the improvement of water quality in lakes, and the larger concentration change index is, the better the water quality becomes.
Water quality category ratio % Reflecting the spatial distribution of water quality before and after water diversion.
Water standard exceeding ratio % Reflecting the exceeding standard ratio of each pollutant before and after diversion.
Socioeconomic indexes Economic benefits yuan Reflecting the environmental benefits of water quality improvement in lakes.
Costs yuan Reflecting the costs incurred in the operation of the project.
Net benefits yuan It is the difference between economic benefits and costs. The greater the net benefits, the better the water diversion effect.
3.2.1 Water quality improvement rate
The water quality improvement rate (Zhai et al., 2008) can be expressed as:
${{R}_{i}}=\frac{{{C}_{bi}}-{{C}_{ai}}}{{{C}_{bi}}}\times 100%$ (5)
where Ri is the water quality improvement rate of the i-th water quality index; Cbi is the mean concentration of the i-th water quality index before water diversion; Cai is the mean concentration of the i-th water quality index after water diversion.
If Ri>0, the water quality is improved after water diversion; while if Ri<0, the water quality becomes worse after water diversion. The larger the Ri is, the better the water quality is.
3.2.2 Concentration change index
The concentration change index (Zhai et al., 2008) can be expressed as:
$P=\frac{2}{n}\sum\limits_{i=1}^{n}{\frac{{{C}_{bi}}-{{C}_{ai}}}{{{C}_{bi}}+{{C}_{ai}}}}$ (6)
where P is the concentration change index; Cbi is the mean concentration of the i-th water quality index before water diversion; Cai is the mean concentration of the i-th water quality index after water diversion; n is the total number of water quality indexes.
P reflects the changes of various water quality indexes comprehensively. If P>0, the water quality is improved after water diversion; while if P<0, the water quality becomes worse after water diversion. The larger the P is, the better the water quality becomes.
3.2.3 Water standard exceeding ratio
The water standard exceeding ratio is the proportion of the water area whose water quality exceeds the standard in the total lake area. The water quality management target of the Tangxun Lake is Grade III, so the water standard exceeding ratio of the Tangxun Lake refers to the proportion of the water area whose water quality is worse than Grade III in the total lake area. The water quality management target of both the Qingling Lake and the Huangjia Lake is Grade III, and the target of both the South Lake and the Yehu Lake is Grade IV. The water standard exceeding ratio is defined as:
$T=\frac{1}{n}\sum\limits_{i=1}^{n}{\frac{{{A}_{i}}}{A}}$ (7)
where T is the water standard exceeding ratio; Ai is the area that the i-th water quality index exceeds the standard; A is the total lake area; n is the total number of water quality indexes.
3.2.4 Cost and benefit evaluation method
This paper evaluates the diversion benefits of different schemes by improving the cost and benefit evaluation method proposed by Liu J M et al. (2014). Economic benefits in this paper only involve the environmental benefits which are brought by the reduction of pollution abatement costs due to the decrease of pollutant concentration in lakes. The ecological, landscape and other benefits are not considered. The environmental benefits are calculated using the pollution charges standard characterization (PCSC) method (Tan et al., 2007), and the method can be expressed as:
$B={{P}_{b}}/\alpha $ (8)
where B is the economic benefits, which represents the reduction of pollution abatement costs after the diversion; α is the adjustment coefficient, which represents the compensation degree to which the pollution charges compensate to the environmental pollution. The annual pollution charge is about 1/30 of the environmental protection investment (Jiang, 2014), so the adjustment coefficient is 1/30. Pb is the reduction of pollution charges after the diversion, and it can be calculated based on the pollution equivalent method.
${{P}_{b}}=\sum\limits_{i=1}^{3}{{{R}_{i}}{{N}_{i}}}\text{=}\sum\limits_{i=1}^{3}{{{R}_{i}}\times \frac{{{M}_{bi}}-{{M}_{ai}}}{{{K}_{i}}}}$ (9)
where Ni is the reduction of pollution equivalent amount of the i-th water quality index; Ri is the charge standards of each pollution equivalent, and the charge standards of NH3-N, TN and TP are 1.4 yuan, 0.7 yuan and 0.7 yuan, respectively (Wang, 2003; NDRC, 2014); Mbi is the total amount of the i-th pollutant before the diversion (kg); Mai is the total amount of the i-th pollutant after the diversion (kg); Ki is the pollution equivalent value of the i-th pollutant (kg). The pollution equivalent values of NH3-N, TN and TP are 0.8 kg, 0.8 kg and 0.25 kg, respectively (Wang, 2003).
The costs in this paper refer to the operating costs of the pumping station, and the construction costs of the IRSN project are not taken into account. The costs can be calculated as:
$C={{P}_{c}}\times Q\times T$ (10)
where C is the operating costs; Pc is the operating costs per flow discharge (yuan/m3); Q is the water diversion flow discharge (m3/s); T is the water diversion time (s).
${{P}_{c}}=\frac{f\rho g{{H}_{st}}}{3600000{{\eta }_{st}}}$ (11)
where f is the local electricity price (yuan/kWh); ρ is the water density (kg/m3); g is the gravitational acceleration; Hst is the net head of the pumping station (m); ηst is the efficiency of the pumping station.
According to the Power Grid Sales Tariff in Hubei Province (implemented since June 1, 2016), the electricity price of general business is 0.85 yuan/kWh. With reference to the basic parameters of the Tangxun Lake pumping station, the working head is taken to be 6 m, and the pump efficiency ηst is 80%. The value of Pc is calculated to be about 0.017 yuan/m3.
The net benefits (E) are the difference between the economic benefits (B) and the costs (C). If the value of E is greater than 0, the economic benefits are greater than the costs, indicating that the scheme is feasible. The greater the net benefits are, the more effectively can the scheme achieve the goal of improving the water environment.

4 Model setup

4.1 Mesh generation

In this study, the DEM grid data, with a resolution of 30 m×30 m, was used as the grid of the simulation domain. The data was generated using the spatial interpolation methods based on the underwater topographic map of the Tangxun Lake group (Figure 2). The Tangxun Lake, the South Lake, the Huangjia Lake, the Yehu Lake, the Yezhi Lake and the Qingling Lake were divided into 44,526, 8200, 7449, 1527, 1805 and 7540 valid grid cells, respectively.
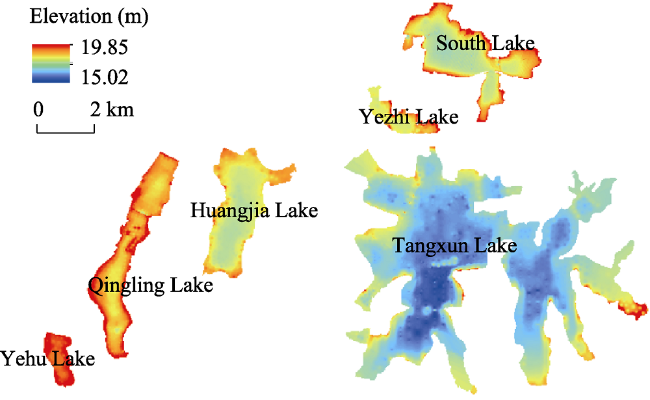
Figure 2 The underwater topographical map of the Tangxun Lake group

4.2 Initial and boundary conditions

The lakes mentioned above are typical shallow lakes with wind- driven currents. The dominant wind direction near the lakes is southeast, with a mean velocity of 2.8 m/s. The time step was set to 3600s. During the simulation period, the first day’s concentration field, which was interpolated according to the data of the nine sampling sites (Figure 3), was set as the initial concentration. The normal water level of the lakes was set as the initial water level. The initial flow velocity was set to 0 m/s. According to the actual water quality situation of the Tangxun Lake group, NH3-N, TN and TP were chosen as the water quality indexes.
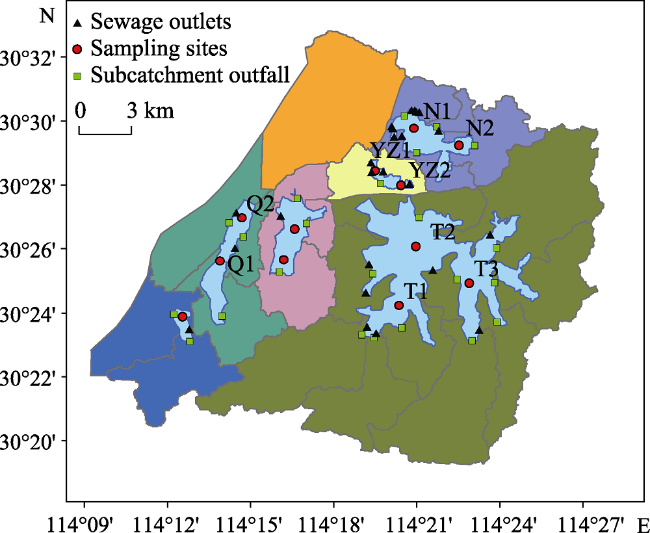
Figure 3 Location of sampling sites and sewage outlets in the Tangxun Lake group
The boundary conditions include inlets, outlets and the inputs of point source and non-point source. The inflow boundary is determined by flow discharge, and the outflow boundary is determined by water level. There are many sewage outlets around the Tangxun Lake group. In the simulation, these sewage outlets were integrated into 23 sewage outlets (Figure 3), and the measured data of point source concentration were used. The urban non-point source pollution has become the main causation of water pollution, and it is mainly caused by runoff scouring. The Tangxun Lake Basin was divided into 24 sub-basins based on the topographic data, and each sub-basin was generalized as a catchment inlet. The locations are shown in Figure 3. The average annual total non-point source pollutants of NH3-N, TN and TP in the Tangxun Lake Basin are 93.5 t, 204.5 t and 74.2 t, respectively (Wang et al., 2012). Due to lack of measured data, the non-point source pollution concentration of each sub-basin was simulated on the basis of the annual total non-point source pollutants. The temporal non-point source pollution concentration was calculated according to the rainfall process, and the spatial non-point source pollution concentration was calculated according to the sub-catchment’s area. The flow discharge of the sub-basins was calculated via the runoff coefficient method (Zhang et al., 2015), and the runoff coefficient was set to 0.49 according to Wang et al. (2012). Daily precipitation data were obtained from the Wuhan station which is in the vicinity of the lakes.

4.3 Model calibration and verification

Model calibration was conducted from February 10 to March 3, 2014 according to the actual situation of the Tangxun Lake group before water diversion. The boundary conditions include the inputs of point source and non-point source and two outlets. One of the outlets is located in the Tangxun Lake, and the other is in the South Lake. The model calibration parameters were shown in Table 2. The simulated and measured values at nine stations (Figure 4) showed that the mean relative errors of NH3-N, TN and TP were 8.9%, 10.27% and 13.39%, respectively.
Table 2 The calibration parameters in hydrodynamic and water quality model
Parameter name Value Parameter name Value
Coriolis force constant 7.27×10⁻⁵ s-1 Wind resistance coefficient 0.0012
Horizontal diffusion coefficient 0.5 m2/s Vertical diffusion coefficient 0.8 m2/s
Horizontal eddy viscosity 8.9 m2/s Vertical eddy viscosity 8.9 m2/s
Roughness 0.02 NH3-N degradation coefficient 0.05 d-1
TP degradation coefficient 0.008 d-1 TN degradation factor 0.015 d-1
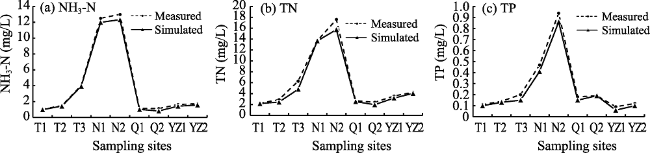
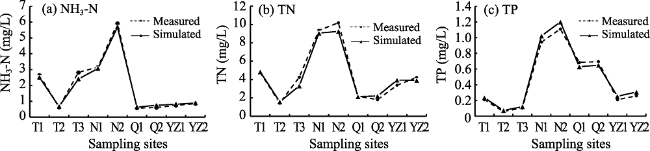
Figure 4 Simulated and measured values at nine stations during model calibration
The model was verified by the measured data of the sampling sites in June 2014. The result (Figure 5) showed that the simulated values were very close to the measured data. The mean relative errors of NH3-N, TN and TP were 9.18%, 11.14% and 14.56%, respectively, indicating that the model was reasonable and can be used as an effective tool for the IRSN scheme evaluation.
Figure 5 Simulated and measured values at nine stations during model verification

5 Evaluation of the IRSN scheme of the Tangxun Lake group

5.1 Connectivity scheme

According to the Lakes Planning of Wuhan, the Tangxun Lake water system will be connected with the Donghu Lake water system and the Liangzi Lake water system, thus finally forming an interconnected water network of the Yangtze River, the Donghu Lake, the Liangzi Lake, the Tangxun Lake and the Jinshui River. Fresh water from the Donghu Lake is diverted into the Tangxun Lake via Inlet 1, and fresh water from the Liangzi Lake is diverted into the Tangxun Lake via the Dongba River and Inlet 2. One part of the water is eventually discharged from the Tangxun Lake and the South Lake to the Yangtze River via Outlet 1 and Outlet 2, respectively, and another part of the water is discharged via the newly built Outlet 3 to the Huangjia Lake and the Qingling Lake (Figure 1).
With reference to the current water diversion projects in China, the water diversion flow discharge is set to 40 m3/s. Five connectivity schemes with different water transfer routes were formulated to evaluate the water transfer project’s impact on the hydrodynamics and water quality of the Tangxun Lake group (Table 3).
Table 3 The IRSN schemes of the Tangxun Lake group
Connectivity schemes Flow discharge (m3/s) Outlets Water diversion routes
From Donghu Lake From Liangzi Lake
Scheme I 40 0 Outlet 1, Outlet 2 Route A, Route B
Scheme II 0 40 Outlet 2 Route C
Scheme III 40 40 Outlet 1, Outlet 2 Route A, Route B, Route C
Scheme IV 0 40 Outlet 2, Outlet 3 Route C, Route D
Scheme V 40 40 Outlet 1, Outlet 2, Outlet 3 Route A, Route B, Route C, Route D
The water transfer routes were as follows:
(1) Route A: the Donghu Lake → the South Lake → the Yezhi Lake → the Tangxun Lake → the Xunsi River (the Qingling River) → the Tangxun Lake Pumping Station (the Chenjiashan Gate) → the Yangtze River;
(2) Route B: the Donghu Lake → the South Lake → the Xunsi River → the Yangtze River;
(3) Route C: the Liangzi Lake → the Dongba River → the Tangxun Lake → the Xunsi River (the Qingling River) → the Tangxun Lake Pumping Station (the Chenjiashan Gate) → the Yangtze River;
(4) Route D: the Tangxun Lake → the Huangjia Lake → the Qingling Lake → the Yehu Lake → the Shili Channel → the Haikou Pumping Station → the Yangtze River.
The annual mean value of the sampling sites’ water quality measured data in 2014 was set as the initial concentration. The target water quality of the Donghu Lake is Grade III, and it was set as the water quality of the water discharged from the Donghu Lake. According to GB3838-2002, the corresponding concentration of NH3-N, TN and TP were 1.0 mg/L, 1.0 mg/L and 0.05 mg/L, respectively. The current water quality of the South Lake is worse than the Tangxun Lake, so the water from the South Lake should be treated to correspond with the standard of Grade III before it was discharged to the Tangxun Lake for fear that the water quality of the Tangxun Lake might be worse than before. The current water quality of the Liangzi Lake is Grade II, and it was set as the water quality of the water discharged from the Liangzi Lake. Similarly, the corresponding concentration of NH3-N, TN and TP were 0.5 mg/L, 0.5 mg/L and 0.025 mg/L, respectively. The outflow boundary is determined by the normal water level of the lakes.

5.2 Connectivity scheme assessment

5.2.1 Hydrodynamic analysis
The hydrodynamic effects of the five schemes were simulated by the model set up in this study. The flow velocity of the Tangxun Lake group before and after water diversion is shown in Table 4. Before water diversion, the overall water liquidity of the lakes was weak. The mean flow velocity was 0.0015 m/s and the stagnant water ratio was 31.4%. After the diversion, the overall liquidity of the lake group improved to a certain degree. The mean and maximum flow velocity of the lake group increased, and the stagnant water ratio decreased obviously. More specifically, the mean flow velocity of both Scheme I and II is no more than 0.006 m/s, indicating that these two schemes have a little impact on the hydrodynamic process. As for Scheme V, the overall liquidity of the lake group improved greatly after the diversion. The mean flow velocity increased to 0.0087 m/s, and the stagnant water ratio decreased to 21.6%.
Table 4 The flow velocity and stagnant water ratio under different schemes
Schemes Mean flow velocity (m/s) Maximum flow velocity (m/s) Stagnant water ratio (%)
Before diversion 0.0015 0.0065 31.4
Scheme I 0.0051 0.483 29.9
Scheme II 0.0056 0.690 24.8
Scheme III 0.0079 0.666 23.7
Scheme IV 0.0084 0.749 23.0
Scheme V 0.0087 0.743 21.6
The spatial distribution of the flow field in the Tangxun Lake was analyzed, as shown in Figure 6. At present, surface wind-forcing is the dominant factor that influences the water flow pattern of the Tangxun Lake. Before water diversion, there were numerous wind-driven circulations in the lake and the velocity was very slow (Figure 6a). For Scheme I, the improvement of the lake’s water liquidity was not obvious (Figure 6b). Since the distance between the inlet and the outlet is short, the water replacement area is limited to the northwest of the lake. For Scheme II, the flow field distribution of the Tangxun Lake changed significantly. There was a directional water movement from the southeast near the inlet to the northwest near the outlet. By enhancing the water exchange and increasing the flow velocity, Scheme II had a positive impact on the lake, especially the areas near the inlet and outlet. However, there were some lake regions such as the south bay and the northeast bay that had no obvious changes. It was because these areas were so far from the inlet and outlet that it was hard for fresh water to reach there. Scheme III combined the water transfer routes of schemes I and II, which had more obvious impact on the water exchange of the lake. Scheme V added a water transfer route to connect the Huangjia Lake and Qingling Lake based on Scheme III. Compared with the other four schemes, the improvement of the lake’s water liquidity under Scheme V was the most obvious and the water replacement area was the largest, indicating that additional water inlets and outlets can accelerate the water flow in lakes and reduce the area of stagnant water.
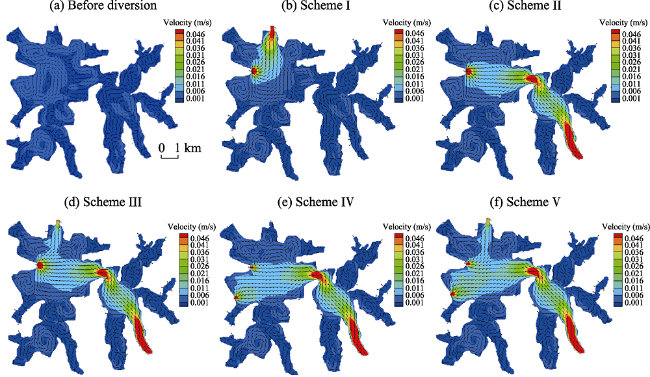
Figure 6 Spatial distributions of flow field under different schemes
5.2.2 Water quality analysis
The water quality of the Tangxun Lake, the South Lake, the Huangjia Lake, the Qingling Lake and the Yehu Lake under the five schemes was simulated. The results (Figure 7) show that the water standard exceeding ratio under Scheme I slowly increased with the diversion time increasing, indicating that the water quality of the Tangxun Lake may become worse. For schemes II-V, the water standard exceeding ratio decreased with the diversion time increasing, and the decreasing range got smaller gradually. Specifically, the lake’s water quality situation improved significantly 10 days after water diversion, and it tended to be stable 20 days later.
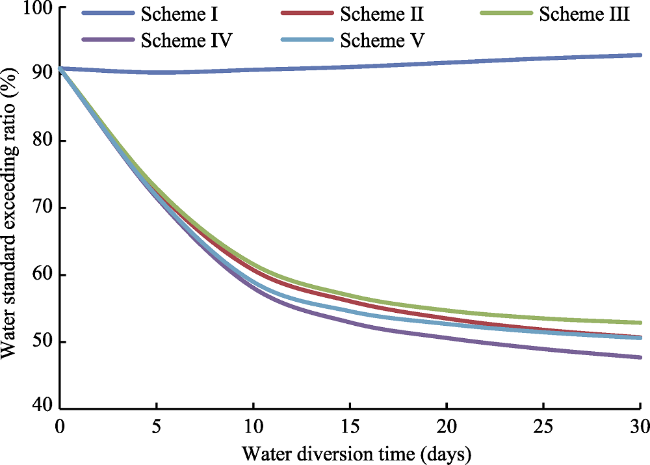
Figure 7 Time-variation of the water standard exceeding ratios of the Tangxun Lake under different schemes
Furthermore, the water quality improvement rate, the concentration change index and the water quality category ratio of the lakes 20 days later after water diversion were analyzed, as shown in Table 5. It can be seen that the water quality in the South Lake improved obviously after the water was diverted from the Donghu Lake under Scheme I, and the water quality improvement rates of NH3-N, TN and TP were 31.21%, 38.85% and 55.97%, respectively. The water standard exceeding ratio reduced from 98.03% before water diversion to 32.89%. Relatively, Scheme I had less effects on the water quality of the Tangxun Lake. For Scheme II, the water quality of the Tangxun Lake improved significantly. However, for the reason that Scheme II only diverted water from the Liangzi Lake and water can hardly flow to the South Lake located in the upstream of the Tangxun Lake, Scheme II almost had no effect on the water quality of the South Lake. Scheme III diverted water from both the Donghu Lake and the Liangzi Lake, and the water quality of both the South Lake and the Tangxun Lake improved significantly. The proportion of grades I-III increased obviously, and the proportion of Grade V and worse than Grade V decreased to some extent. Schemes IV and V were designed to connect the Tangxun Lake and the South Lake with the downstream lakes through the newly-built channels. As a result, the water quality of the Huangjia Lake and the Yehu Lake also improved after water diversion. Generally, the water quality of the Huangjia Lake was slightly worse than that of the Qingling Lake. For this reason, the water quality of the Qingling Lake deteriorated after water diversion.
Table 5 Water quality of the Tangxun Lake group before and after IRSN under different schemes
Schemes Lakes Water quality
improvement rate (%)
Concentration change index Water quality category ratio (%) Water
standard exceeding
ratios (%)
NH3-N TN TP I~III IV V Worse
than
Grade V
Before diversion TXL - - - - 9.18 23.78 40.38 26.66 90.82
SL - - - - 0 1.97 6.93 91.1 98.03
Scheme I TXL -1.32 12.54 10.81 0.078 8.33 49.97 23.89 17.8 91.67
SL 31.21 38.85 55.97 0.543 4.57 62.54 16.4 16.49 32.89
Scheme II TXL 16.51 31.42 30.63 0.305 46.49 28.69 13.98 10.84 53.51
Scheme III TXL 15.85 33.5 32.43 0.321 45.31 31.48 13.37 9.83 54.69
SL 31.21 38.85 55.97 0.543 4.57 62.54 16.4 16.49 32.89
Scheme IV TXL 17.17 31.32 31.53 0.311 49.41 25.28 13.51 11.79 50.59
HJL 21.52 14.87 51.72 0.366 6.91 15.25 43.45 34.39 93.09
QLL 2.33 -1.6 -62.14 -0.298 21.03 19.03 29.74 30.2 78.97
YL 27.71 2.13 36.57 0.264 0 33.33 50.6 16.07 66.67
Scheme V TXL 16.04 32.65 31.53 0.313 47.31 28.66 12.93 11.1 52.69
SL 31.21 38.85 55.97 0.543 4.57 62.54 16.4 16.49 32.89
HJL 17.63 22.97 52.47 0.388 0.04 23.91 48.32 27.72 99.96
QLL 2.37 -0.85 -62.03 -0.295 22.52 19.07 32.03 26.38 77.48
YL 27.76 2.2 36.83 0.265 0 33.35 50.57 16.08 66.65

Note: TXL, SL, HJL, QLL and YL represent the Tangxun Lake, the South Lake, the Huangjia Lake, the Qingling Lake and the Yehu Lake, respectively.

The spatial distribution of the concentrations of NH3-N, TN and TP in the Tangxun Lake under different schemes was analyzed, as shown in Figures 8-10. After water diversion, the enhancement of the lake’s water liquidity accelerated the diffusion and degradation of pollutants. As a result, the water quality in most areas of the lake improved, while the improvement of water quality in the southern area of the lake was not obvious. Among these five schemes, Schemes IV and V had the most obvious effects on the improvement of the lake’s water quality. Under Scheme I, the scope of the regions where the water quality improved was smaller, and most of these regions were near the inlets and outlets of the water diversion routes.
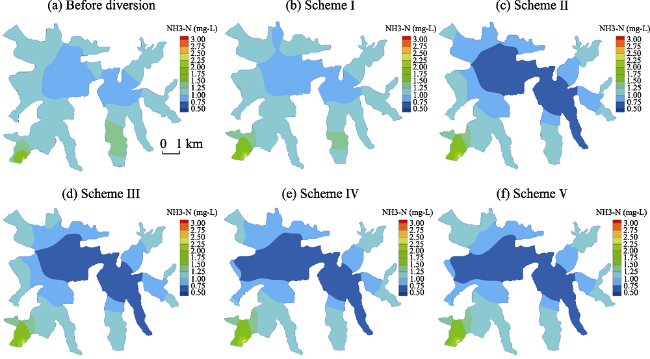
Figure 8 Spatial distributions of NH3-N concentration 20 days later after the diversion under different schemes
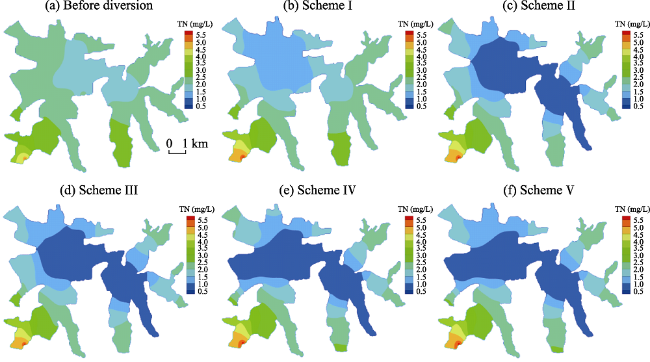
Figure 9 Spatial distributions of TN concentration 20 days later after the diversion under different schemes
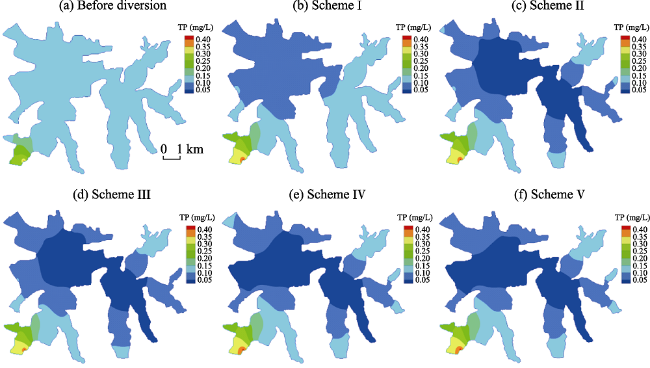
Figure 10 Spatial distributions of TP concentration 20 days later after the diversion under different schemes
Compared with the distribution of flow field, it is suggested that the water liquidity may have great effects on the water quality improvement. The improvement of water quality in the regions with larger flow velocity was more obvious, such as the regions near the water transfer inlets and outlets. However, there was only a slight change of water quality in the southern part of the lake due to the long distance to the inlet and outlet. In these regions, the water replacement rate was low and the water liquidity was still weak. What was worse, the concentrations of the NH3-N, TN and TP in the southwest of the Tangxun Lake increased due to the continuous sewage discharge from the two sewage outlets.
5.2.3 Water diversion benefits assessment
Setting up more water inlets can effectively improve the lakes’ water quality, while the costs will increase correspondingly. In this paper, the cost and benefit evaluation method was used to evaluate the feasibility of different schemes. According to the simulated pollutants of the five lakes before and after water diversion, relevant indexes were calculated via Eqs. 8-11, as shown in Table 6. It can be seen that the net benefits of the five schemes are all greater than 0, indicating that all these five schemes are feasible. Schemes III and V diverted water from the Donghu Lake and the Liangzi Lake simultaneously, which has a remarkable effect on reducing the pollutant concentration and can bring enormous economic benefits. In general, the net benefits of Scheme V are approximate 155.98×10⁴ yuan, which is the most among all the schemes.
Table 6 Benefits and investments under different schemes
Schemes Total flow discharge (m3/s) Water pollutants (kg) Economic benefits
(×104 yuan)
Costs
(×104 yuan)
Net benefits
(×104 yuan)
NH3-N TN TP
Before diversion - 133821.2 212388.9 18383.1 - - -
Scheme I 40 119334.1 174779.1 14984.7 203.33 117.50 85.83
Scheme II 40 122782.3 167619.4 16223.4 193.62 117.50 76.11
Scheme III 80 107856.8 144923.0 13418.5 355.11 235.01 120.11
Scheme IV 40 119391.0 165971.8 14044.5 234.05 117.50 116.54
Scheme V 80 105319.4 143262.0 11252.8 390.99 235.01 155.98
5.2.4 Optimal connectivity scheme
In order to determine the optimal connectivity scheme, indexes from the aspects of water hydrodynamics, water quality and socioeconomics were chosen as the evaluation indexes, and then a comprehensive evaluation system was established. The mean flow velocity and stagnant water ratio were selected to evaluate the hydrodynamics of the lakes. The water quality improvement rate and the concentration change index were selected to evaluate the water quality. The net benefits were selected as the socioeconomic indicator.
It can be seen from the evaluation results (Table 7) that the lakes under Scheme V have the largest mean flow velocity and the lowest stagnant water ratio. In addition, the lakes under Scheme V have the largest water quality improvement rate and the largest concentration change index. As for the aspect of the socio-economic indexes, it is still Scheme V that can bring the most net benefits. Moreover, Scheme V can improve both the hydrodynamic condition and the water quality condition of the six lakes simultaneously by diverting water from the Donghu Lake and the Liangzi Lake. In summary, Scheme V is chosen as the optimal scheme.
Table 7 Comprehensive evaluation results of the five schemes
Schemes Hydrodynamic
evaluation indexes
Water quality evaluation indexes Socio-economic index
Mean flow velocity (m/s) Stagnant water ratio (%) Water quality
improvement rate (%)
Concentration change index Net benefits
(million)
NH3-N TN TP
Scheme I 0.0051 29.9 2.85 12.66 13.57 0.114 85.83
Scheme II 0.0056 24.8 10.61 20.19 19.68 0.196 76.11
Scheme III 0.0079 23.7 13.88 26.13 27.46 0.271 120.11
Scheme IV 0.0084 23.0 14.23 21.61 19.9 0.213 116.54
Scheme V 0.0087 21.6 16.78 28.02 26.62 0.281 155.98

6 Conclusions and discussion

In this paper, a comprehensive evaluation system based on evaluation indexes from the aspects of water hydrodynamics, water quality and socioeconomics was established to evaluate the IRSN effects of the lakes. A 2-D hydrodynamic and water quality model was built to simulate the flow field and water quality. We took IRSN of the Tangxun Lake group as a case study and assessed five connectivity schemes using this evaluation system. The main conclusions can be generalized as follows:
(1) The comprehensive evaluation method was successfully applied to assess the five schemes of the IRSN project. Scheme V has the most significant improvement in both hydrodynamics and water quality and bring the most economic benefits. It is demonstrated that setting up more water inlets and outlets can accelerate water exchange and reduce the ​​stagnant water area in lakes.
(2) The water diversion of the IRSN can improve the lakes’ water environment effectively by improving water mobility to enhance the pollutant diffusion and degradation. The hydrodynamics and water quality conditions of the lakes improved obviously at the initial ten days of the water diversion. As the water quality becomes better, the improvement rate gradually decreased with the further water diversion, which was consistent with the previous studies (Liu J M et al., 2014; Bi, 2014).
In this paper, we further develop the calculation process of the cost and benefit evaluation method (Liu J M et al., 2014). Instead of using traditional sewage treatment charge method to calculate the pollution abatement costs, we adopted the PCSC method and utilized the concept of pollution equivalent with consideration of multiple pollutants. Moreover, traditional methods (Liu J M et al., 2014) estimated the operating costs per flow discharge with the existing pump station as the reference, but there had not been any specific quantitative calculation method. This study presents a quantitative method to calculate the operating costs per flow discharge based on its relationship with the pump station head and the electricity price, which can provide a more reliable support for the calculation of the operating costs.
The IRSN will change the flow pattern and water quality of lakes, thus changing the living environment of aquatic ecosystems including aquatic plants, phytoplankton, zooplankton and zoobenthos (Xia et al., 2012; Liu B J et al., 2014). In the future research, we also need to consider the water ecosystem into our evaluation system. It is necessary to combine the water ecological model with the hydrodynamic and water quality model to assess the benefits from the IRSN projects.
The connectivity has become an important indicator of river health and water resources utilization (Wu et al., 2007; Xia et al., 2012). The essence of maintaining water connectivity is to maintain the liquidity and continuity of water in rivers and lakes, so as to enhance the lakes’ self-recovery ability and realize the long-term health and stability of the lakes. In the implementation process of the IRSN projects, it is essential to take some other measures such as ecological restoration and sewage interception project at the same time to achieve the purpose of improving the lakes’ ecological environment comprehensively.

The authors have declared that no competing interests exist.

[1]
Bi Sheng, 2014. Study on numerical simulations of hydrodynamics and pollutant transport in river and shallow lakes [D]. Wuhan: Huazhong University of Science and Technology. (in Chinese)

[2]
Chen Xiaojiang, 2010. Eutrophication status and monitoring of urban lakes in China. Science & Technology Information, (5): 416, 465. (in Chinese)

[3]
Chen Zhentao, Hua Lei, Jin Qiannan, 2015. Assessing the efficacy of water diversion to improve water quality in city river network.Journal of Yangtze River Scientific Research Institute, 32(7): 45-51. (in Chinese)http://www.en.cnki.com.cn/Article_en/CJFDTOTAL-CJKB201507013.htmWater diversion is one of the most common methods to improve water quality in city river network. However,there is no uniform standard or system to evaluate the diversion effect. With Jianggan District of Hangzhou City as a case study,we built a one-dimensional river network model to simulate the water quality in different diversion cases,and assessed the effect of water quality improvement through the rate of water quality improvement,the category change index and concentration change index. Results showed that increasing water quantity could improve the water quality of the city rivers,however,the efficiency decreased with the increase of water quantity. Moreover,the improvement of source water quality is a crucial factor which affects the diversion effect as it could apparently improve the water quality of river network,and the rate of improvement also increased with the improvement of the source water quality.

[4]
Chu Junying, Qin Dayong, Wang Haoet al., 2009. Simulation of lake water environment trends in Tangxun Lake of Wuhan under rainfall uncertainty.China Environment Science, 29(9): 955-961. (in Chinese)http://www.cabdirect.org/abstracts/20093295697.htmlFocus on the quantity and quality process in the whole basin, TXHwater model was developed to evaluate water environment trends of Tangxun Lake in Wuhan. Through Monte Carlo techniques, characteristics of watershed pollution loads, water flows and water quality trends under rainfall uncertainty were presented. The uncertainty of simulated COD and TP was largest and smallest, respectively, while uncertainty of simulated NH3-N and TN in the medium level. Rainfall conditions had significant impacts on the runoff yield and stream inflow of Xunsi river mostly during the flood season. If no further pollution control measures were planned, degradation of water quality will be aggravated to V category in 2010 and 2020 year. TN and TP were the key pollution factors, and will reach their maximum value from June to August during the year, and almost exceeded the required water environment standard for total rainfall possibilities.

[5]
Cui Guangbai, Chen Xing, Xiang Longet al., 2017. Evaluation of water environment improvement by interconnected river network in plain area.Journal of Hydraulic Engineering, 48(12): 1429-1437.http://en.cnki.com.cn/Article_en/CJFDTOTAL-SLXB201712006.htmRiver water system is an important resource and environmental carrier of the city. The contradiction between urban development and water environment protection is becoming more and more prominent in recent years,especially in the plain river network area. Due to geographical constraints,the improvement of urban river water environment is challenging. The sustainable development of urban water system will be directly related to the healthy development of cities and the whole society. Therefore implement modern water system management theory and promote water environment improvement through the interconnected river system has become an important step of urban water management. In this paper, the urban area of Changshu city is selected as the research area. The water transfer experiment and the hydraulic model areapplied as technical support to formulate river interconnected schemes for the sake of water environment enhancement. Based on the concept of structural connectivity and functional connectivity, the river network connectivity assessment method is proposed. In the water transfer experiment,flow exchange in major rivers is satisfied and water quality of indexes is increased 20%-30% in average. Yet the river connectivity inthe central downtown is limited which leads to less flow access. The improvement of river channel connectivity and the reasonable dispatching of water conservancy project have important influence on the connectivitysystem. Taking the scenario simulations in the paper as an example,channel regulation projects increase river connectivity and give rise to water quality about 30%-50%. The change of connectivity index also prove that structural connectivity greatly enhances water transfer efficiency,and promotes better flow distribution and water environment. The establishing methodology of interconnected water system to improve water environment can provide theoretical basis for water system connectivity decision,and provide reference for urban water system connectivity in China.

[6]
Cui Guotao, Zuo Qiting, Dou Ming, 2011. Development evolution and influences of the interconnected river system network at home and abroad.South-to-North Water Diversion and Water Science & Technology, 9(4): 73-76. (in Chinese)

[7]
Cui Guotao, Zuo Qiting, Li Zongliet al., 2012. Analysis of function and adaptability for interconnected river system network.Water Resources and Power, 30(2): 1-5. (in Chinese)http://en.cnki.com.cn/Article_en/CJFDTOTAL-SDNY201202002.htmBased on China's fundamental realities and development trend of water conservancy,the function of Interconnected River System Network(IRSN) is discussed.Water resources allocation,improving water quality and enhancing flood drought control in IRSN are simplified to the second-stage function.And then the function system of IRSN is proposed.Taking water distribution project of Dahuofang Reservoir for an example,the adaptability condition of IRSN is analyzed.The results will provide reference for the theoretical research of IRSN.

[8]
Jiang Mengwei, 2014. China’s sewage charge is only 1/30 of environmental management investment. Beijing Business Today, 04-08(002). (in Chinese)

[9]
Kang Ling, Guo Xiaoming, Wang Xueli, 2012. Study on water diversion schemes of large urban lake group.Journal of Hydroelectric Engineering, 31(3): 65-69. (in Chinese)http://en.cnki.com.cn/Article_en/CJFDTotal-SFXB201203013.htmEast lake in Wuhan is the largest urban lake in China and East lake,Shahu lake,Yanxi lake and North lake compose a large group of urban lakes.The project of East lakes ecology-oriented water network is to reestablish a hydraulic connection of this lake group to the Yangtze River and to improve its water ecology system by water diversion from the Yangtze River.A hydrodynamic and water quality model based on rectangular meshes was developed to determine a suitable water diversion scheme.In this model,natural degradation and release of contaminants from sediment are considered and thin plates are used to simulate the dikes in the lakes.The model was calibrated and verified using field data.A typical normal year was selected according to the total diversion volume available from the river and the total runoff into the lakes.To provide a technical support to the water network project,three schemes and their effects in water quality improvement were studied and compared.

[10]
Li Yiping, Acharya Kumud, Yu Zhongbo, 2011. Modeling impacts of Yangtze River water transfer on water ages in Lake Taihu, China.Ecological Engineering, 37(2): 325-334.https://linkinghub.elsevier.com/retrieve/pii/S0925857410003186To improve water quality and alleviate eutrophication in Lake Taihu, the third largest freshwater lake in China, a Yangtze River water transfer project was initiated in 2002 to bring water from the Yangtze River to Lake Taihu to dilute and divert pollutants out of the lake. We used a three-dimensional numerical model, Environmental Fluid Dynamics Code, to study the impacts of water transfer on the transport of dissolved substances in the lake by using the concept of water age. In particular, the influences of inflow tributaries and wind forcing on water age were investigated. Model results showed that the effect of water transfer on transport processes in the lake is strongly influenced by hydrodynamic conditions induced by wind and inflow/outflow tributaries. During the simulation year (2005), the water ages in Lake Taihu were highly variable both spatially and temporally, with a mean of approximately 130 days in summer and 230 days in the other seasons. Southeasterly winds ominant in the summer ould improve the quality of water by reducing the water age in the eastern areas of the lake, which are used as a drinking water source, and in Meiliang Bay, the most polluted bay. In terms of dilution, the most efficient flow rate for transferred water was predicted to be approximately 100 m/s. The spatial distribution of water ages showed that water transfer may preferentially enhance exchanges in some areas of the lake unless nutrient concentrations in the transferred water are reduced to a reasonable level. This study provides useful information for a better understanding of the complex hydrodynamic and mass transport processes in the lake, which is important for developing and implementing effective ecological restoration strategies in the region.

DOI

[11]
Li Yiping, Tang Chunyan, Wang Chaoet al., 2013. Assessing and modeling impacts of different inter-basin water transfer routes on Lake Taihu and the Yangtze River, China.Ecological Engineering, 60(11): 399-413.https://linkinghub.elsevier.com/retrieve/pii/S0925857413004138To enhance water exchange and alleviate eutrophication in Lake Taihu, the third largest freshwater lake in China, four different inter-basin water diversion named Route One to Four, have been implemented or planned to flush pollutants out of Lake Taihu by transporting freshwater from Yangtze River. Due to the shallowness and large size of Lake Taihu, it is quite complex to set the optimal transferred inflow rate for each route or the combination of routes to maximize the benefits for improving the lake's water exchange with minimum economical cost and environmental impact. In this study, the appropriate transferred inflow rates and environmental impacts of the different water transfer routes on both Lake Taihu ("receiver") and the Yangtze River ("supplier") were assessed using the concept of water age and Lagrangian particle tracking based on a three-dimensional Environmental Fluid Dynamic Code (EFDC) model. The results showed that the appropriate flow rates were quite different from the single route diversion to the combination of routes, depending on priorities such as lowest economical cost and high-est water quality improvement for specific lake regions or the entire lake. Two optimal combinations of routes to achieve specific results in different seasons were determined to improve the water exchange of the lake. During the algal bloom seasons, the objective of the combination focused on enhancing water exchange in the specified lake regions such as Meiliang Bay and Zhushan Bay. The optimal flow rates for Route One to Route Four were 80, -70 ("-" means outflow), 100 and 20 m(3)/s, respectively. In the non-algal bloom seasons, the combination concentrated on lowering water ages in the entire lake. The optimal flow rates for Route One to Route Four were 90, -40, 70 and 20 m(3)/s, respectively. The results suggested that the Yangtze River Diversion, as an emergency stopgap measure, played important roles on enhancing water exchange in the lake, but had minimal impact on the Yangtze River. The findings of this study provide useful information for the local government and decision-makers to better understand the physical and hydrological processes of water transfer projects and to assist in managing the water transfer projects. (C) 2013 Elsevier B.V. All rights reserved.

DOI

[12]
Li Zongli, Li Yuanyuan, Wang Zhonggenet al., 2011. Research on interconnected river system network: Conceptual framework.Journal of Natural Resources, 26(3): 513-522. (in Chinese)http://en.cnki.com.cn/Article_en/CJFDTOTAL-ZRZX201103018.htmThe remarkable growth in China's population and economy over the past several decades has come to realize at a tremendous cost to the country's environment,particularly around water.China's water resources are over-allocated,inefficiently used,and grossly polluted by domestic and industrial wastes,to the point that vast stretches of rivers are dead and dying,lakes are cesspools of waste,groundwater aquifers are over-pumped and unsustainably consumed,and direct adverse impacts on both human and ecosystem health are widespread and growing.For addressing these crippling water problems,a new strategy of Interconnected River System Network(IRSN) is put forward,which is of great necessity for improving the capacity of water resources allocation,sustaining river's heath and enhancing flood and drought control.However,up to now both the theory and technology of IRSN have still been a blank,far from the practices.Based on the further requirement of national water security and the improvement of the ecological civilization,with the new idea of human-water harmony and water resources livelihood,this paper presents a concept of IRSN,which can be defined as a river system network formed by constructing the hydraulic connection of water bodies of rivers,lakes and wetlands with various kinds of water projects,characterized by proper diversion and drainage,reasonable storage and discharge,adjustment of low and high runoff,complementary water multisource,controllable capacity,and the river system network appears to be complex,systematic,dynamic,temporal and spatial.Then the general thoughts of IRSN is proposed on the basis of the river system connection goal,the study of the IRSN can be carried out at four steps: 1) mechanism analysis,the theoretical basis of the whole study;2) system identification and assessment,the analysis of the current status of IRSN in the researched region/basin,and the construction of Safety Evaluation Model with the complete indicators;3) IRSN project plan,the make-out of the programmers with the requirement and problems of the society,and choosing the optimal decision from the solutions set;and 4) river system optimization and adjustment,the river system network will be reevaluated with the information of the monitoring system,and adjusted according to the principle of realizing the goal of sustainable development.According to the general thought of IRSN,some key problems worth specially concerning in the study are discussed,including different scales of IRSN,the process of river network connection,the pattern matching,the function of IRSN and the control methods.

DOI

[13]
Liu Bojuan, Deng Qiuliang, Zou Chaowang, 2014. Study on necessity of project construction for connecting rivers and lakes.Yangtze River, 45(16): 5-6. (in Chinese)http://en.cnki.com.cn/Article_en/CJFDTotal-RIVE201416002.htmThe water system of rivers and lakes is not only the carrier of water cycle and formation of water resources in a basin,but also an important foundation to support regional economic and social development. With the rapid development of economy,the impact of human activities on the water system is growing,and a variety of problems in water resources and water environment have become more prominent. The presentation of project construction for connecting rivers and lakes provides technical guidance for tackling the shortage of water resources,deterioration of water environment and fragility of water ecology. And on this basis,the necessity of the connecting project is deeply analyzed from the aspects of flood and water- logging control,guarantee of water- supply and pollution treatment with practical cases.

[14]
Liu Jiaming, Zhang Yanjun, Song Xingyuanet al., 2014. Optimal discharge of pollution flushing in an interconnected river-lake network: A case study of Lake Cihu, Hubei Province.Journal of Lake Sciences, 26(5): 671-681. (in Chinese)<![CDATA[http://www.jlakes.org/ch/reader/view_abstract.aspx?doi=10.18307/2014.0504]]>Interconnections of rivers and lakes,which can improve short-term water qualities in lakes,have been widely used in China. It is necessary to search for the reasonable discharge of pollution flushing in order to achieve the best flushing effect as well as the lowest cost. In this paper,the water environmental improvement effect of different flushing discharges is analyzed,using the two-dimensional water quality mathematical model based on DEM. Furthermore,the cost and benefit evaluation method is put forward to find the quantitative relation between pollution flushing discharges and project benefits. Based upon the Lake Cihu project,the pollution flushing discharges and project benefits curve has been obtained by simulating eight different flushing conditions. The results indicate that with the increase of pollution flushing discharge,the benefit first increases and then decreases,while the maximum benefit is about $ 40500,and corresponds to an optimal pollution flushing discharge of 10. 62 m3/s. This study could provide scientific basis for pollution control and cost control in Lake Cihu and other similar lakes with the river-lake interconnection systems.

DOI

[15]
Lu Xuchuan, Li Yiping, Huang Dongqinget al., 2015. Study on water diversion schemes for improvement of hydrodynamics in plain river network.Water Resources and Power, 33(4): 93-95, 138. (in Chinese)http://en.cnki.com.cn/Article_en/CJFDTotal-SDNY201504023.htmFor the sake of improving the flowing condition in plain river network area,aprototype of water transfer experiment was executed in principal urban area of Taicang city.Based on the experimental results,an unsteady water quantity model tallying with the local river network was established.And then,the improvement of water exchange in river network of urban area was analyzed under different plans of water diversion.The research demonstrates that with the impact of Yangtze River's tide,water transferring can effectively ameliorate the water exchange in river canal,of which a drawing project works better than a discharging one.As transferring discharge increases,some of the river canals have lower exchange rate influencing by the backwater effect with the inflow.

[16]
National Development and Reform Commission, Ministry of Finance of the People’s Republic of China, Ministry of Ecology and Environment of the People’s Republic of China, 2014. Notice on relevant issues concerning adjustment of expropriation of sewage charge.Green Finance and Accounting, (10): 37-38. (in Chinese)

[17]
Patankar Suhas V, 1980. Numerical Heat Transfer and Fluid Flow. Washington DC: Hemisphere Publishing Corp.http://adsabs.harvard.edu/abs/1980wdch.book.....PA mathematical description of physical phenomena is given and discretization methods are discussed. Heat conduction is considered along with convection and diffusion, and calculation of the flow field, source-term linearization, irregular geometries, two- and three-dimensional parabolic flow, partially parabolic flows, the finite-element method, and illustrative applications. Attention is given to governing differential equations, the nature of coordinates, the nature of numerical methods, methods of deriving the discretization equations, steady and unsteady one-dimensional conduction, two- and three-dimensional situations, overrelaxation and underrelaxation, and steady one-dimensional convection and diffusion. Discussed applications are related to developing flow in a curved pipe, combined convection in a horizontal tube, melting around a vertical pipe, turbulent flow and heat transfer in internally finned tubes, and a periodic fully developed duct flow.

DOI

[18]
Tan Feifan, Wang Haiyun, Xiao Weihuaet al., 2012. Talk about lakes present situation and existing problems and countermeasure thought in China.Water Conservancy Science and Technology and Economy, 18(4): 57-60. (in Chinese)http://en.cnki.com.cn/Article_en/CJFDTOTAL-SLKY201204025.htmLakes as human a precious natural resources,in the country′s economic and social sustainable development plays an important role.However,due to the rapid development of economy,the industrialization,the urbanization and the rapid development of human resources of lake predatory exploration and development of lakes have caused serious damage,leading to the lakes present situation as grim.Aiming at the analysis the current situation of the lakes behind the deep reason,and brings forward the corresponding and constructive opinions and Suggestions.

[19]
Tan Yarong, Zheng Shaofeng, 2007. Study on the method of determining unit cost of environmental pollutants.Productivity Research, 24: 52-53. (in Chinese)

[20]
Tao Wenquan, 2001. Numerical Heat Transfer. 2nd ed. Xi’an: Xi’an Communication University Press, 273-276. (in Chinese)

[21]
Wang Guiming, 2003. Measures for the administration of expropriation of sewage charge.Guangxi Jieneng, (3): 1-6. (in Chinese)

[22]
Wang Hao, Qin Dayong, Xiao Weihua et al., 2012. Study on the Key Technology of Environmental Carrying Capacity and Water Pollution Control in Tangxun Lake Watershed. Beijing: Science Press. (in Chinese)

[23]
Wu Daoxi, Huang Siping, 2007. Study on the index system of healthy Yangtze River.Express Water Resources & Hydropower Information, 28(12): 1-3. (in Chinese)

[24]
Wuhan Municipal Water Authority, 2011-2016. Wuhan Water Resources Bulletin. (in Chinese)

[25]
Xia Jun, Gao Yang, Zuo Qitinget al., 2012. Characteristics of interconnected rivers system and its ecological effects on water environment.Progress in Geography, 31(1): 26-31. (in Chinese)http://en.cnki.com.cn/Article_en/CJFDTOTAL-DLKJ201201007.htmAs there is a trend of deterioration of the water resource and environmental quality in China,the interconnected rivers system,which is an important target for river health and enhancing water resource utilization,was emphasized by National 12th Five-year Plan(2011-2015).Currently,we are lack of knowledge in characteristics on drainage connectivity and river health.Thus,the aim of this paper is to clarify the definition of interconnected rivers system,classification,evaluation indicators,impact factors and the effects on water environment health.The interconnected rivers system can improve wetland ecological environment,maintain biodiversity,and safeguard flood control security and sustainable utilization of water resources.However,interconnected rivers system has eclogical and environmental adventure,including:(1) because of interconnected rivers,the water quality,wherein original river is good,will be worse due to mixing with poor water quality;(2) interconnected rivers will increase the competition of fish and other species in the rivers;(3) through interconnected rivers system,the rivers and lakes which have plenty of rainwater supplement those lack of rainwater,which will greatly reduce the effective water resource;(4) reducing runoff from the rivers and lakes which are plenty of rainwater will result in reducing evaporation in the area of the land surface and the water cycle,and then,lead to climate change in the region;(5) the connectivity of upstream and downstream will result in dramatic increase in sand and sediment in downstream rivers.

DOI

[26]
Xie Lili, Liu Xia, Huang Chenget al., 2015. Applications and effects of river-lake connectivity to urban river harnessing in Chaozhou city.Guangdong Water Resources and Hydropower, (10): 8-11. (in Chinese)http://www.en.cnki.com.cn/Article_en/CJFDTotal-GDSD201510004.htmBased on studying the basic connotation of river-lake connectivity,the principle and measures of river-lake connectivity in Chaozhou City river harnessing have been introduced,and the flood control effect,the ecological effect and the water landscape effect have been analyzed. The result indicates that the water surface curves of the main rivers decline after river-lake connectivity measures,and the measures increase the water area ratio and ensure the ecological water requirement of river and lake. Besides,the measures bring about obvious water landscape effect.

[27]
Xie Xingyong, Qian Xin, Zhang Yuchao, 2009. Effect on water quality of Chaohu Lake with the water transfer project from Yangtze River. In: The 3rd International Conference on Bioinformatics and Biomedical Engineering, 1-4.http://ieeexplore.ieee.org/xpls/icp.jsp?arnumber=5162725One-dimensional DYRESM-CAEDYM model was used to study the effect of water transfer project on water quality of Chaohu Lake, which is situated in central Anhui Province, the lower reaches of Yangtze River. The simulated results of temperature, TN, TP showed good agreement with observed data in 2005. There was also good agreement between monitored data and simulated concentrations of chlorophyll-a although the peaks deviated from observations. Simulations of the water transfer project showed that the concentration of TN decreased 16% and the concentration of TP decreased 19% compared with the case of no water transfer. The peaks of the chlorophyll-a decreased almost 10ug/L.

DOI

[28]
Yang Huadong, Yuan Weihua, Ouyang Xuejunet al., 2009. Current situation and countermeasures on the eutrophication of the Tangxun lakes in Wuhan city.Journal of Water Resources & Water Engineering, 20(4): 34-38. (in Chinese)http://en.cnki.com.cn/article_en/cjfdtotal-xbsz200904010.htmA half-year field investigation on Tangxun Lake and around water areas in Wuhan City had been conducted from November 2007 to April 2008.And the water pollution indexes of eleven water sample points were inspected and analyzed in the middle April 2008.The results reveal that the contamination degrees and causes differ greatly because of different economic development conditions between east and west shore.In general,the contamination degree of lake water is close to V.TLI method was adopted to perform an assessment of current eutrophication status that lakes was mesotrophicstate.Based on the analysis report and combined the surrounding ecological environment,the paper put forward some suggestions for controlling eutrophication and improving water quality.

[29]
Zhai Shuhua, Zhang Hongju, Hu Weipinget al., 2008. Evaluation on result of Yangtze-Taihu water diversion.China Water Resources, (1): 21-23. (in Chinese)http://en.cnki.com.cn/Article_en/CJFDTotal-SLZG200801008.htmAn index system and Taihu Water Environment Model are developed for a quantitative and comprehensive water environment assessment,on the basis of actual observation data of quantity and quality during the experiment of Yangtze-Taihu Water Diversion.A comprehensive and objective assessment on the result and influence of water diversion on the river system and water environment of the Taihu Lake is made,which provides an essential theoretical and practical base for the further implementation of Yangtze-Taihu Water Diversion.

[30]
Zhang Yanjun, Jha Manoj, Gu Royet al., 2012. A DEM-based parallel computing hydrodynamic and transport model.River Research and Applications, 28(5): 647-658.http://doi.wiley.com/10.1002/rra.v28.5The sudden and accidental water pollution response system (SAWPRS) for Yangtze River in central China required to develop a hydrodynamic and transport model, which is readily available and capable of simulating a large river system within GIS environment. This study facilitates such effort by developing a parallel computing method based on digital elevation model (DEM) using overlapping domain decomposition approach (ODDA) and message passing interface (MPI) protocol. The hydrodynamic and transport model was redesigned using finite volume method for hydrodynamic and transport model dispersion, the SIMPLEC method for solving the flow field, and the pressure weighted interpolating method for the flow field modification. This modelling approach was verified in two experiments using different sets of computer clusters. The model output was evaluated against the measured data collected for the year 1998 for Wanzhou, an upstream river segment of Yangtze River. The relative error was found to be less than 10%. The performance of parallel computation was found excellent as evident from the cost efficiency values greater than 0.81 in both experiments and increased computation speed while increasing the number of computer clusters. Overall, the parallel computing modelling system developed here was found to meet all requirements of SAWPRS. Copyright 漏 2010 John Wiley & Sons, Ltd.

DOI

[31]
Zhang Yanjun, Luo Wensheng, Lei Alinet al., 2008. Arithmetic research of water quantity and quality model based on DEM.Engineering Journal of Wuhan University, 41(5): 45-49. (in Chinese)http://en.cnki.com.cn/Article_en/CJFDTOTAL-WSDD200805010.htmIn order to standardize the water quantity and quality model and make it as a natural foundation of geographic information system(GIS),this paper provides a new algorithm which uses digital elevation model(DEM) as grid and contains some methods which are algorithm for DEM,collocated grid,FVM,and SIMPLEC.The water body recognition,boundary generation,initial and boundary conditions,moving boundary,solving linear algebraic equations are expounded in detail.At last,the new algorithm is applied to the Three Gorges emergency system successfully so as to offer an efficient algorithm to GIS.

[32]
Zhang Yilong, Wang Hongwu, Qin Yuhan, 2015. Review of urban surface runoff calculation method and relevant models.Sichuan Environment, 34(1): 113-119. (in Chinese)

[33]
Zuo Qiting, Ma Junxia, Tao Jie, 2011. New thoughts of modern water management and harmony ideas.Resources Science, 33(12): 2214-2220. (in Chinese)http://en.cnki.com.cn/Article_en/CJFDTOTAL-ZRZY201112003.htmWater resources management can generally experience four phrases, i.e., infancy, development, rapid development, and formation. At present, existing problems of water resources management are as follows: a decentralized water resources management system, an imperfect law system, a weak implementation, a premature market policy, an irrational water price system, incomplete water-saving measures, a weak water-saving consciousness, an incomplete technical supporting system, and an imperfect examination system. In this context, modern water resources management emerges. This paper expounds the necessity of structuring modem water resources management system, and analyzes the connotations of"Three Red Lines"and"Interconnected River and Lake System Network Connotation"that reflect new thoughts of water resources management. They all reflect the sustainable utilization of water resources and human-water harmony. The"Three Red Lines"is the key of the most strict water management system, and represents distribution, protection, and saving tasks of water resources management from total water amount control, water use efficiency control, and quantity control of pollutants discharge into the water function area. It makes water resources management more effective, specific, and systemic. The"Three Red Lines"points out the direction and establishes the key for modern integrated water resources management of China. The"Interconnected River and Lake System Network Connotation"is a positive strategy for increasing water resources deployment ability, improving water environment status, and resisting flood and drought in the new situations. The aim is to thoroughly resolve three water-related problems, i.e., drought and water shortage, flood disaster, and deterioration of water environment, through constructing an interconnected river and lake system network, and to finally realize the human-water harmony. At last, concepts, quantification methods, and applications in water resources management of harmony theory were introduced. Concrete applications in water resources management include: 1) the harmonious way between human and nature; 2) a harmony strategy for water resources management; 3) a rational allocation mode of water resources among different areas and departments based on harmony theory; 4) water allocation issues of transboundary rivers based on harmony theory; 5) water transfer problems of inter-basin based on harmony theory; and 6) control of pollutants discharge based on harmony theory. Harmony theory and its applications guide a right path for water resources management in China.

DOI

Outlines

/