
Journal of Geographical Sciences >
Comprehensive evaluation of regional resources and environmental carrying capacity using a PS-DR-DP theoretical model
Author: Wang Liang (1989-), PhD, specialized in regional sustainable development. E-mail: wangl.17b@igsnrr.ac.cn
Received date: 2018-05-21
Accepted date: 2018-07-15
Online published: 2019-03-20
Supported by
The Specific Project of National Key Research and Development Program of China, No.2016YFC0503506
Strategy Priority Research Program of Chinese Academy of Sciences, No.XDA20010103
Copyright
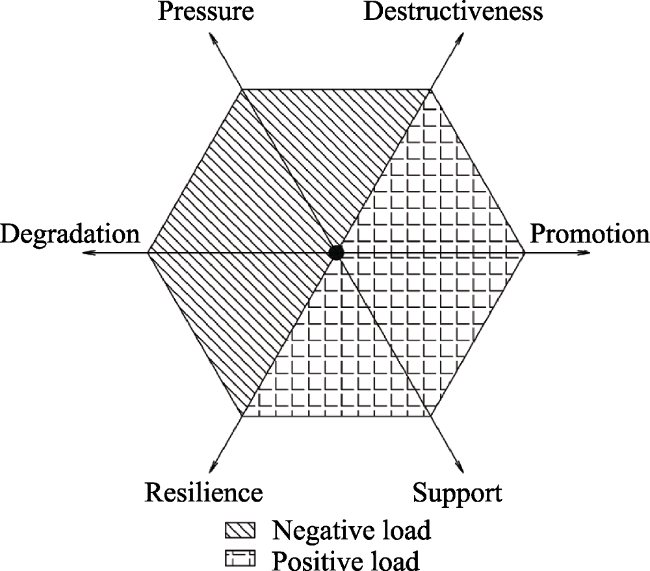
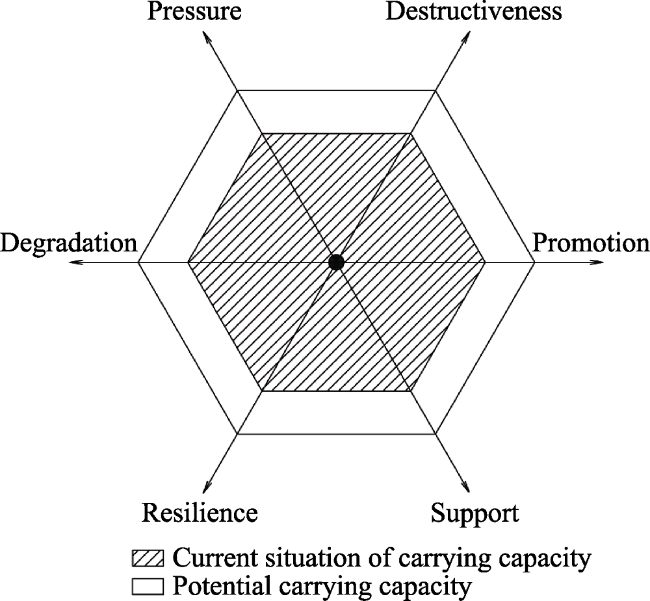
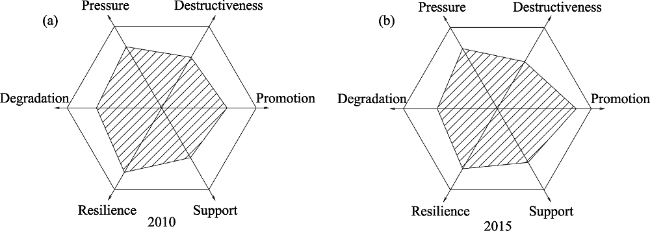
The concepts of regional resources and environmental carrying capacity are important aspects of both academic inquiry and government policy. Although notable results have been achieved in terms of evaluating both these variables, most researchers have utilized a traditional analytical method that incorporates the “pressure-state-response” model. A new approach is proposed in this study for the comprehensive evaluation of regional resources and environmental carrying capacity; applying a “pressure-support”, “destructiveness-resilience”, and “degradation-promotion” (“PS-DR-DP”) hexagon interaction theoretical model, we divided carrying capacity into these three pairs of interactive forces which correspond with resource supporting ability, environmental capacity, and risk-disaster resisting ability, respectively. Negative carrying capacity load in this context was defined to include pressure, destructiveness, and degradation, while support, resilience, and promotion comprised positive attributes. The status of regional carrying capacity was then determined via the ratio between positive and negative contribution values, expressed in terms of changes in both hexagonal shape and area that result from interactive forces. In order to test our “PS-DR-DP” theory-based model, we carried out a further empirical study on Beijing over the period between 2010 and 2015. Analytical results also revealed that the city is now close to attaining a perfect state for both resources and environmental carrying capacity; the latter state in Beijing increased from 1.0143 to 1.1411 between 2010 and 2015, an improved carrying capacity despite the fact that population increased by two million. The average contribution value also reached 0.7025 in 2015, indicating that the city approached an optimal loading threshold at this time but still had space for additional carrying capacity. The findings of our analysis provide theoretical support to enable the city of Beijing to control population levels below 23 million by 2020.
WANG Liang , LIU Hui . Comprehensive evaluation of regional resources and environmental carrying capacity using a PS-DR-DP theoretical model[J]. Journal of Geographical Sciences, 2019 , 29(3) : 363 -376 . DOI: 10.1007/s11442-019-1603-4
Figure 1 The warning model used in this analysis, comprising a fully loaded resource state and environmental carrying capacity |
Figure 2 The perfect state model used in this analysis encompassing resources and environmental carrying capacity |
Table 1 Classification of resources and environmental carrying capacity |
| Rank | Mean contribution value | Carrying capacity state |
|---|---|---|
| Ⅰ | ≤ 0.30 | Balance load at lower level with an approximate stable state |
| Ⅱ | 0.30-0.70 | Unstable state developing at high speed |
| Ⅲ | 0.70-0.85 | An ideal carrying capacity close to the stable state |
| Ⅳ | ≥ 0.85 | A fully loaded state with the system collapsing |
Note: Mean contribution value denotes the average subentry contribution sum. |
Table 2 The evaluation index system for pressure and support used in this analysis |
| Force | Influencing factor | Index | No. |
|---|---|---|---|
| Pressure | Water | Average water consumption (m3) Total water consumption (108 m3) | K11 K12 |
| Land | Requisition of cultivated area (km2) Requisition of industrial and mining land (km2) | K13 K14 | |
| Energy | Coal consumption (108 ton) Oil consumption (104 ton) Gas consumption (108 m3) Electricity consumption (108 kw·h) Energy consumption per unit of GDP (ton of standard coal/104 yuan) | K15 K16 K17 K18 K19 | |
| Population | Population density (person/km2) Total population at year-end (104) Population growth rate (‰) Urban unemployment rate (%) GDP (104 yuan) | K110 K111 K112 K113 K114 | |
| Support | Resources | Water resource per capita (m3/per capita) Total water resources (108 m3) Total land area (km2) Cultivated land increments of a year (km2) Cultivated land area (km2) Per capita food production (kg) Hydropower generation (108 kw·h) Coal reserves (108 ton) Crude oil production (104 ton) Gas production (108 m3) Electrical energy production (108 kw·h) | K115 K116 K117 K118 K119 K120 K121 K122 K123 K124 K125 |
| Socioeconomy | Whole-society productivity (104 yuan/per capita) Disposable income per capita for urban citizens (104 yuan) Rural per capita net income (104 yuan) | K126 K127 K128 |
Note: $k_{i}^{1}$ is the pressure and support variable in this evaluation index system. |
Table 3 The evaluation index system for destructiveness and resilience used in this analysis |
| Force | Influencing factor | Index | No. |
|---|---|---|---|
| Destructiveness | Atmospheric environment | Sulfur dioxide emission (104 ton) Flue dust emission (ton) | K21 K22 |
| Water environment | Wastewater discharge (104 ton) Chemical oxygen demand (104 ton) | K23 K24 | |
| Soil environment | Dangerous industrial solid waste output (104 ton) General industrial solid waste output (104 ton) | K25 K26 | |
| Major disaster | Fatality rate of class A and class B infectious diseases (1/105) Number of geological disasters Number of sudden environmental accidents | K27 K28 K29 | |
| Resilience | Pollutant treatment | Proportion of environmental pollution control costs in GDP (%) Amount of industrial sulfur dioxide removal (104 ton) Disposal of general industrial solid waste (104 ton) Disposal of dangerous industrial solid waste (104 ton) City sewage treatment rate (%) | K210 K211 K212 K213 K214 |
| Disaster prevention | Number of disease control centers Number of automatic meteorological stations Number of seismological stations Number of emergency shelters | K215 K216 K217 K218 |
Note: $k_{i}^{2}$ is the destructiveness and resilience variable in this evaluation index system. |
Table 4 The evaluation index system for degradation and promotion used in this analysis |
| Force | Influencing factor | Index | No. |
|---|---|---|---|
| Degradation | Desertification | Desertification land area (hm2) | K31 |
| Forest degradation | Area of plantation forestry (hm2) Forest disease and insect pest and rodent disaster area (hm2) | K32 K33 | |
| Water and soil erosion | Increased area of water and soil erosion (hm2) Scope of responsibility for soil erosion control (hm2) | K34 K35 | |
| Promotion | Protection and governance | Forest area (hm2) Wetland area (hm2) Afforestation area (hm2) | K36 K37 K38 |
| Small watershed management area (hm2) Control rate of forest disease and insect pest and rodent disaster (%) Control area of water and soil erosion (hm2) Natural reserve area (hm2) | K39 K310 K311 K312 |
Note: $k_{i}^{3}$ is the degradation and promotion variable in this evaluation index system. |
Table 5 Evaluation index standardization values for Beijing between 2008 and 2010 |
| Index | 2008 | 2009 | 2010 | Index | 2008 | 2009 | 2010 | Index | 2008 | 2009 | 2010 |
|---|---|---|---|---|---|---|---|---|---|---|---|
| K11 K12 K13 K14 K15 K16 K17 K18 K19 K110 K111 K112 K113 K114 K115 K116 K117 K118 K119 | 1.0000 0.1665 0.0527 0.2323 0.0130 0.0530 0.2877 0.3272 0.0031 0.0376 0.0840 0.0162 0.0863 0.0527 0.9749 0.1622 0.0778 0.0094 0.0110 | 1.0000 0.1725 0.1440 0.4116 0.0129 0.0565 0.3372 0.3592 0.0029 0.0369 0.0904 0.0170 0.0680 0.0591 0.6152 0.1059 0.0797 0.0096 0.0113 | 0.8629 0.1604 0.0679 1.0000 0.0120 0.0509 0.3407 0.3690 0.0026 0.0544 0.0894 0.0140 0.0638 0.0643 0.5658 0.1052 0.0748 0.0090 0.0106 | K120 K121 K122 K123 K124 K125 K126 K127 K128 K21 K22 K23 K24 K25 K26 K27 K28 K29 K210 | 0.3577 0.0002 0.3173 0.0000 0.0000 0.1172 0.0548 0.0124 0.0051 0.0661 0.0190 0.6089 0.0543 0.0645 0.0622 0.1115 0.0860 0.1989 0.0785 | 0.3513 0.0002 0.3401 0.0000 0.0000 0.1200 0.0597 0.0137 0.0057 0.0538 0.0165 0.6372 0.0448 0.0507 0.0562 0.0500 0.0543 0.1403 0.0778 | 0.2838 0.0020 0.1727 0.0000 0.0000 0.1230 0.0634 0.0140 0.0060 0.0542 0.0181 0.5308 0.0434 0.0538 0.0599 0.0725 0.0519 0.1415 0.0774 | K211 K212 K213 K214 K215 K216 K217 K218 K31 K32 K33 K34 K35 K36 K37 K38 K39 K310 K311 K312 | 0.0605 0.0402 0.0366 0.4243 0.1667 1.0000 0.5591 0.1774 0.1202 0.5959 0.0858 0.0706 0.0098 0.0198 0.8336 0.0757 0.0610 0.0219 1.0000 0.2991 | 0.0511 0.0341 0.0258 0.3633 0.1403 1.0000 0.4570 0.1493 0.1049 0.6849 0.0754 0.1105 0.0142 0.0346 1.0000 0.0661 0.0164 0.0191 0.9833 0.2611 | 0.0613 0.0368 0.0307 0.3873 0.1462 1.0000 0.4387 0.1557 0.0965 0.6568 0.0730 0.0571 0.0276 0.0258 0.9589 0.0634 0.0146 0.0183 1.0000 0.2504 |
Table 6 Reliability index analysis results |
| Evaluation index system | Cronbachs Alpha | Sample size | Elimination |
|---|---|---|---|
| Pressure and support | 0.949 | 28 | 0 |
| Destructiveness and resilience | 0.998 | 18 | 0 |
| Degradation and promotion | 0.999 | 12 | 0 |
Figure 3 The resources and environmental carrying capacity state of Beijing in 2010 (a) and 2015 (b) |
Table 7 The carrying capacity of Beijing between 2010 and 2015 |
| Contribution value | Pressure | Support | Destructiveness | Resilience | Degeneration | Promotion | Carrying state | Mean contribution |
|---|---|---|---|---|---|---|---|---|
| 2010 | 0.7468 | 0.6065 | 0.6191 | 0.7874 | 0.6917 | 0.6931 | 1.0143 | 0.6908 |
| 2015 | 0.7428 | 0.6627 | 0.5827 | 0.7443 | 0.6432 | 0.8394 | 1.1411 | 0.7025 |
Note: The internal data holds to four decimal places based on the original data. |
Table 8 The degree to which the energy and resources of Beijing were externally dependent between 2010 and 2015 |
| Net input | Crude oil (104 tons) | Gas (108 m3) | Water resource (108 m3) |
|---|---|---|---|
| 2010 | 1,116.29 | 74.79 | 12.1 |
| 2015 | 1,165.18 | 130 | 11.4 |
| External dependence in 2010 (%) | 100 | 100 | 34.375 |
| External dependence in 2015 (%) | 100 | 88.51 | 29.84 |
Note: External dependence is equal to the ratio of net input to total consumption in a given year. |
The authors have declared that no competing interests exist.
| [1] |
|
| [2] |
|
| [3] |
|
| [4] |
|
| [5] |
|
| [6] |
|
| [7] |
|
| [8] |
|
| [9] |
|
| [10] |
|
| [11] |
FAO, 1996. Agro-ecological Zoning; Guidelines. Fao Soil Bulletins.
|
| [12] |
|
| [13] |
|
| [14] |
|
| [15] |
|
| [16] |
|
| [17] |
|
| [18] |
|
| [19] |
|
| [20] |
|
| [21] |
|
| [22] |
|
| [23] |
|
| [24] |
|
| [25] |
|
| [26] |
|
| [27] |
|
| [28] |
|
| [29] |
|
| [30] |
|
| [31] |
|
| [32] |
|
| [33] |
|
| [34] |
|
| [35] |
|
| [36] |
|
| [37] |
|
| [38] |
|
| [39] |
|
| [40] |
|
| [41] |
|
| [42] |
|
| [43] |
|
| [44] |
|
| [45] |
|
| [46] |
|
| [47] |
|
| [48] |
|
| [49] |
|
| [50] |
|
| [51] |
|
| [52] |
|
/
| 〈 |
|
〉 |