Research Articles

Relative soil moisture in China’s farmland

  • ZHU Guofeng , 1, 2, 3 ,
  • PAN Hanxiong , 1, * ,
  • ZHANG Yu 1 ,
  • GUO Huiwen 1 ,
  • YONG Leilei 1 ,
  • WAN Qiaozhuo 1 ,
  • MA Huiying 1 ,
  • LI Sen 4
Expand
  • 1. College of Geography and Environmental Science, Northwest Normal University, Lanzhou 730070, China
  • 2. State Key Laboratory of Cryospheric Sciences, Northwest Institute of Eco-Environment and Resources, Chinese Academy of Sciences, Lanzhou 730000, China
  • 3. Gansu Engineering Research Center of Land Utilization and Comprehension Consolidation, Lanzhou 730070, China
  • 4. State Key Laboratory of Information Engineering in Surveying, Mapping and Remote Sensing, Wuhan University, Wuhan 430079, China
*Corresponding author: Pan Hanxiong (1993-), Master Student, specialized in hydrology and water resources research. E-mail:

Author: Zhu Guofeng (1983-), PhD and Associate Professor, specialized in hydrology and water resources.E-mail:

Received date: 2018-09-19

  Accepted date: 2018-11-22

  Online published: 2019-03-20

Supported by

National Natural Science Foundation of China, No.41661005, No.41867030

Chinese Postdoctoral Science Foundation, No.2016T90961

National Natural Science Foundation Innovation Research Group Science Foundation of China, No.41421061

Autonomous Project of State Key Laboratory of Cryosphere Sciences, No.SKLCS-ZZ-2017

Remote Sensing Monitoring Special Project of Rotation and Fallow System in Pilot Regions under Ministry of Agriculture and Rural Affairs of the People’s Republic of China, No.SCZG2017-ZB-2187/1-HT

Copyright

Journal of Geographical Sciences, All Rights Reserved

Abstract

Based on the data of relative soil moisture in 653 agricultural meteorological stations during the period of 1993‒2013 in China, the characteristics and regularity of spatial and temporal variation of relative soil moisture in China’s farmland were analyzed and discussed using geostatistical methods. The results showed that the relative soil moisture of China’s farmland has shown a fluctuant increasing trend since 1993. The relative soil moisture of China’s farmland is more than 60% in general, its distribution area has been expanded northward and westward with the summer monsoon since mid-April and began to shrink eastward and southward in late October. The value of relative soil moisture increases with the increase of soil depth. On an interannual scale, the relative soil moisture of farmland increased fastest in summer and autumn, and its variation range decreased with the increase of soil depth. The relative soil moisture was positively correlated with precipitation, and negatively correlated with potential evaporation and temperature. The correlation between relative soil moisture and various meteorological factors weakened as soil depth increased. The meteorological factors have a great influence on relative soil moisture of dry land in spring, summer and autumn and they also have a greater impact on relative soil moisture of paddy fields in winter.

Cite this article

ZHU Guofeng , PAN Hanxiong , ZHANG Yu , GUO Huiwen , YONG Leilei , WAN Qiaozhuo , MA Huiying , LI Sen . Relative soil moisture in China’s farmland[J]. Journal of Geographical Sciences, 2019 , 29(3) : 334 -350 . DOI: 10.1007/s11442-019-1601-6

1 Introduction

Soil supplies the water, nutrients, air and heat for the normal growth and development of crops. Its physical and chemical properties are easily affected by climate change (Zhu et al., 2010). In the field of agricultural monitoring, soil moisture is a comprehensive reflection of soil water condition and further reflect the degree of drought in farmland intuitively (Ma et al., 2000; Zhu et al., 2013; Zhang et al., 2016). And soil moisture is an important parameter for research on the land surface processes. It can affect climate change by changing the sensible heat, latent heat and long wave radiation fluxes from the surface to the atmosphere (Delworth et al., 1988; Delworth et al., 1993; Ma et al., 1999). Therefore, analyzing the spatial and temporal variations and regularity of relative soil moisture in different soil depths under different time and space backgrounds is important to grasp the changes of the soil moisture of farmland, utilize soil water resources rationally, and carry out further research on the land surface process system.
In recent years, many researchers have conducted a series of studies on the characteristics and influencing factors of relative soil moisture using measured data. Currently, researches mainly focus on the relationship between relative soil moisture and meteorological elements (Lu et al., 2011; Wang et al., 2013; Cho et al., 2014; Wang et al., 2015), soil properties (Zhang et al., 2004; Fang et al., 2005; Zuo et al., 2007; Zhou et al., 2015; Zhang et al., 2016; Zuo et al., 2018), land cover types (Zhang et al., 2003; Zhang et al., 2004; Broni et al., 2013), and soil depth (Wang et al., 2013; Zhu et al., 2014) in the research area, and explore the spatial and temporal variation characteristics and trends of relative soil moisture in specific areas. At present, research hot spots in China are mainly concentrated in the areas where hydrological and meteorological observation data are relatively abundant, such as the arid region of northwest China (Zhang et al., 2007; Wang et al., 2008; Zhang et al., 2011; Zhang et al., 2012), the eastern China monsoon region (Zuo et al., 2007; Zuo et al., 2018), the Loess Plateau (Chen et al., 2008; Lu et al., 2011), the Hengduan Mountainous (Zhu et al., 2013), and the middle-lower reaches of the Yellow River (Fang et al., 2005; Li et al., 2011; Wang et al., 2015). Due to the scarcity of observation sites on the Qinghai-Tibet Plateau, the research of point pattern is mainly carried out based on the measured data (Wan et al., 2012; Zhuo et al., 2015). In recent years, various inversion methods based on remote sensing technology have become more and more effective in researching large-scale soil moisture (Zhang et al., 2008; Younis et al., 2015). However, there are a lot of uncertainties in all kinds of inversion data, which cannot replace the measured data in the short term.
This study used geostatistical methods to research the spatial and temporal variation characteristics and regularity of relative soil moisture in China’s farmland from 1993 to 2013. The research can form basic data of relative soil moisture over China, provide comparative verification data for soil moisture monitoring based on remote sensing technology, provide input parameters for regional land surface process model, and provide scientific decision-making support for agricultural, forestry and other management departments.

2 Research area

Based on the Comprehensive Agricultural Regionalization of China, this study analyzes the spatial and temporal variations of relative soil moisture in different regions of China’s farmland (NARC, 1981). The division method of the regions is based primarily on their agriculture production and geographic features (Ju et al., 2018). The classification divides China into 10 agricultural first-grade regions. Nine of them are on land, and one is called the Marine Fishery Region. These on land regions include Northeast Region, Inner Mongolia and along the Great Wall Region, Huang-Huai-Hai Plain Region, Loess Plateau Region, Middle-Lower Yangtze River Region, Southwest Region, South China Region, Gansu-Xinjiang Region, and Qinghai-Tibet Plateau Region (Figure 1). The above 10 agricultural first-grade regions reveal the most basic regional differences of agricultural production in China. On the one hand, they reflect the different combinations of agricultural natural conditions and natural resources in China, thus providing a variety of possibilities for the development of agriculture. On the other hand, it reflects the basic characteristics of the regional differentiation of agricultural production formed in the long-term historical development. The characteristics of each agricultural first-grade region are distinct, have great stability, and have a unique position in China (Deng 1982).
Figure 1 Distribution of relative soil moisture observation station

3 Data and methods

3.1 Data source and processing

Based on the ten-day data of relative soil moisture of 778 agricultural observation stations in China from 1993 to 2013, 653 stations with good time continuity, good location representation and trend test by Mann-Kendall were selected to carry out the research. Among them, the number of stations with time series of data beginning in 1993 was 338, and that in 2002 was 315 (Figure 1). Due to the scarcity of sites on the Qinghai-Tibet Plateau Region, 14 stations with relatively poor data status were selected as supplementary stations, including Lhasa, Linzhi, Gande, Huangyuan, Menyuan, Nomhon, Qumacai, Golmud, Zedang, Shigatse, Minhe, Delingha, Guide and Henan. Data of relative soil moisture and meteorological element were from the National Meteorological Information Center (http://data.cma.cn/site/index.html), all meteorological data passed the Mann-Kendall trend test, and the spatial distribution data of farmland were from the Resource and Environment Data Cloud Platform (http://www.resdc.cn/data.aspx DATAID=99). The classification method of the agricultural first-grade regions is based on the China Comprehensive Agricultural Division (NARC, 1981).
According to the ten-day data of the relative soil moisture of the three soil depths (10 cm, 20 cm and 50 cm) during the period of 1993 to 2013 at each station, the multi-year average in each season and annual average of relative soil moisture at each soil depth from 1993 to 2013 were calculated as follows.
${{R}_{\left( hs \right)}}={\left[ \underset{i=1993}{\overset{2013}{\mathop \sum }}\,\underset{j=n}{\overset{m}{\mathop \sum }}\,{{X}_{ij}}+{{Y}_{ij}}+{{Z}_{ij}} \right]}/{\left( {{N}_{X}}+{{N}_{Y}}+{{N}_{Z}} \right)}\;$ (1)
where h is the depth of the soil depth (10 cm, 20 cm, 50 cm); s is the time scale (multi-year spring average, multi-year summer average, multi-year autumn average, multi-year winter average, multi-year average); i indicates the year of 1993 to 2013; j represents the months included in the required time scale, n is the month where j starts, and m is the month where j ends; MX, NY and NZ indicate the number of ten-days in which observational data exist in the first, middle and last ten-days of each month from 1993 to 2013, respectively. The calculation results of each station were calculated, analyzed and discussed by Kriging interpolation according to the agricultural division.
The annual average R(h, i) of relative soil moisture in the three soil depths for each season at each station were respectively established a linear regression equation with time (ti), as shown in formula (2).
${{R}_{\left( hi \right)}}=a+b{{t}_{i}}$ (2)
where i represents the year and b is the tendency rate of interannual variation of relative soil moisture in each season. The positive (b>0) tendency rate indicates that the relative soil moisture increases with time, and the negative (b<0) tendency rate indicates a downward trend.

3.2 Methods

Due to the complexity and diversity of crop type, irrigation time and type, meteorological factors, uniform crop evapotranspiration coefficient cannot be used on a large spatial scale. Therefore, the potential evaporation is selected as one of the meteorological factors for analysis. The potential evaporation of each station is based on the daily data of six meteorological elements including daily maximum temperature, daily minimum temperature, daily average temperature, average relative humidity, average wind speed and sunshine hours during the research period, and the Penman-Monteith model revised by the World Food and Agriculture Organization (FAO) in 1998 was used to calculate (Allen et al., 2006; Zhu et al., 2011).
At present, most researches on the relationship between soil moisture and environmental factors use Kring interpolation method based on geostatistics and analysis in ArcGIS, this method is based on spatial correlation model (Yamamoto, 2007), and its advantage is that it has strong applicability when the terrain and meteorology are heterogeneous, which it can not only reflect the consistency of geographical elements on a larger spatial and temporal scale, but also reflect the uniqueness of specific regions (Yamamoto, 2007; Zhu et al., 2016).

4 Results and analysis

4.1 Spatial distribution of relative soil moisture

The spatial distribution of the multi-year average relative soil moisture (Figure 2) showed that the relative soil moisture value was generally greater than 60% in China’s farmland, and there were spatial distribution differences among regions, soil depths and seasons.
Figure 2 Distribution of relative soil moisture in farmland
The relative soil moisture of 10 cm depth. In spring, the areas with relative soil moisture less than 60% were mainly distributed in the Loess Plateau Region, Inner Mongolia and along the Great Wall Region, the southwest of Southwest Region, the Pearl River Delta of the South China Region, the Hangzhou Bay coast of Middle-Lower Yangtze River Region, the north-central part of Huang-Huai-Hai Plain Region, and the Ningxia Plain of Gansu-Xinjiang Region. The relative soil moisture values of other areas were generally greater than 60%. Among them, relative soil moisture in the eastern region of Northeast Region, most of the Middle-Lower Yangtze River Region, and most of Southwest Region were greater than 80%. In summer, except for Gansu-Xinjiang Region, Loess Plateau Region and Inner Mongolia and along the Great Wall Region, the relative soil moisture in other regions were generally greater than 60%. In the central part of the Middle-Lower Yangtze River Region and the southern part of Southeast Region, the area where relative soil moisture was more than 80% in summer was smaller than that in spring. The relative soil moisture in the southeastern part of the Huang-Huai-Hai Plain Region and the vast area at the junction of Southwest Region and South China Region increased significantly in summer compared with that in spring. In autumn, the area where the relative soil moisture was less than 60% was sporadically distributed at the junction of Southwest Region and Middle-Lower Yangtze River Region, mainly distributed to the north of the Yangtze River, and showed a shrinking trend from east to west. The area where the relative soil moisture was greater than 80% was distributed in the eastern part of Northeast Region, most of Southwest Region, the southwestern and northeastern parts of Middle-Lower Yangtze River Region, and the southeastern part of the Huang-Huai-Hai Plain Region. In winter, the area where the relative soil moisture was less than 60% obviously enlarged. The relative soil moisture in the north of Tianshan Mountains of Gansu-Xinjiang Region, the northeastern part of the Qinghai-Tibet Plateau Region, most of Inner Mongolia and along the Great Wall Region is less than 45%. The area with relative soil moisture greater than 80% tended to shrink in Southwest Region, while it tended to expand at different degrees in Middle-Lower Yangtze River Region, Huang-Huai-Hai Plain Region, and Northeast Region. From the multi-year average value of the relative soil moisture at this depth, areas where the relative soil moisture was less than 60% were mainly distributed at the junction of Gansu-Xinjiang Region, Loess Plateau Region, and Inner Mongolia and along the Great Wall Region.
The relative soil moisture of 20 cm depth. In spring, the areas where the relative soil moisture was less than 60% were mainly distributed in Southwest Region, Inner Mongolia and along the Great Wall Region, and the west-central Loess Plateau Region. Among them, relative soil moisture that was less than 30 % sporadically appeared in the southwestern part of Southwest Region. The relative soil moisture in other areas is more than 60%, and that in the eastern part of Northeast Region, the southeastern part of Huang-Huai-Hai Plain Region, most of Middle-Lower Yangtze River Region, most of Southwest Region, and most of South China Region was greater than 80%. In summer, the area where the relative soil moisture was less than 60% was concentrated in most of Loess Plateau Region, southwest of the Inner Mongolia and along the Great Wall Region. In the Huang-Huai-Hai Plain Region near the Yellow River Estuary and the south Tianshan Mountains of Gansu-Xinjiang Region, there was also a sporadic distribution. The area where the relative soil moisture was greater than 80% tended to decrease in Northeast Region and Middle-Lower Yangtze River Region but expanded in the Huang-Huai-Hai Plain Region, South China Region and Southwest Region. In autumn, the area where the relative soil moisture was less than 60% further shrank in the Loess Plateau Region, Inner Mongolia and along the Great Wall Region, and the Huang-Huai-Hai Plain Region, but it expanded at the junction of the Gansu-Xinjiang Region, Southwest Region, and Middle-Lower Yangtze River Region. The area where the relative soil moisture was more than 80% showed a significant expanded trend in southern Huang-Huai-Hai Plain Region, Middle-Lower Yangtze River Region, Southwest Region, the southern Loess Plateau Region, and the eastern part of the Qinghai-Tibet Plateau Region, but shrank in South China Region and Northeast Region. In winter, the area where the relative soil moisture was less than 60% obviously enlarged, and were mainly distributed in the majority of Gansu-Xinjiang Region, most of the Qinghai-Tibet Plateau Region, most of the areas of the Inner Mongolia and along the Great Wall Region, the western part of Northeast Region, the southwestern part of Southwest Region, coastal areas of Fujian and Zhejiang in Middle-Lower Yangtze River Region, and the Pearl River Estuary in South China Region. Among them, the relative soil moisture in most of the Inner Mongolia and along the Great Wall Region, most of the Qinghai-Tibet Plateau Region, the coastal areas of Fujian and Zhejiang in Middle-Lower Yangtze River Region, the western part of the Gansu-Xinjiang Region, and the northwest of the Huang-Huai-Hai Plain Region was less than 30%. Areas with relative soil moisture greater than 80% in winter did not change much compared to that in autumn. From the multi-year average value of relative soil moisture, the areas where the relative soil moisture was less than 60% were concentrated in the northeastern part of Loess Plateau Region, the southwestern Inner Mongolia and along the Great Wall Region. Among them, most of the South China Region, most of the Middle-Lower Yangtze River Region, the eastern part of Huang-Huai-Hai Plain Region, the eastern part of Northeast Region, and the eastern part of Southwest Region have a relative soil moisture greater than 80%.
The relative soil moisture of 50 cm depth. In spring, the areas where the relative soil moisture was less than 60% were mainly distributed in the junction of Loess Plateau Region and Inner Mongolia and along the Great Wall Region, the southwestern part of Southwest Region, and the central and eastern parts of South China Region and were sporadically distributed in the north area of the Inner Mongolia and along the Great Wall Region, and Hangjiahu Plain in Middle-Lower Yangtze River Region. The relative soil moisture of other areas was greater than 60%, and it was more than 80% in Northeast Region, South China Region, Middle-Lower Yangtze River Region, Southwest Region, and the southeastern part of the Huang-Huai-Hai Plain Region. In summer, the area where the relative soil moisture was less than 60% shrank in the south of the Yangtze River, and expanded in the northern part. There was no obvious distribution in South China Region, Southwest Region, and Middle-Lower Yangtze River Region, but in the Loess Plateau Region and the Inner Mongolia along the Great Wall, the expansion trend was obvious. The relative soil moisture in other areas was greater than 60%, and the farmland area with the relative soil moisture greater than 80% was reduced in Gansu-Xinjiang Region, and in other agricultural first-grade regions it was enlarged. In autumn, the area where the relative soil moisture was less than 60% was distributed in various agricultural regions north of the Yangtze River, and the eastern part of the South China Region, the junction of which with Middle-Lower Yangtze River Region was even less than 40%. The relative soil moisture in other regions is greater than 60%, and the areas with relative soil moisture value more than 80% was concentrated in most of Northeast Region, most of the Middle-Lower Yangtze River Region, most of Southwest Region, and the southern part of the Huang-Huai-Hai Plain Region. There was also a sporadic distribution in the southern part of the Loess Plateau Region. In winter, the area with relative soil moisture less than 60% was widely distributed. In the southern part of Huang-Huai-Hai Plain Region, the central and western parts of South China Region, most of Middle-Lower Yangtze River Region, and the northeastern part of Southwest Region, the relative soil moisture was greater than 80%. From the perspective of multi-year average value of relative soil moisture, the areas where the relative soil moisture was less than 60% were mainly concentrated in the Loess Plateau Region, Inner Mongolia and along the Great Wall Region. The relative soil moisture of other areas was more than 60%.
From the perspective of the change of relative soil moisture with season, the areas with high relative soil moisture values in the different soil depths had a tendency to expand northward and westward with the transition of summer monsoon, that is, the area with high relative soil moisture value expanded, and the area with low relative soil moisture value gradually shrank. The distribution area of high relative soil moisture value reached the maximum in autumn, and the distribution area of low relative soil moisture value is the largest in winter. The area with high relative soil moisture value of each season is most widely distributed in 50 cm soil depth.

4.2 Spatial differences in interannual variations in relative soil moisture

From interannual variation of the seasonal average and the annual average of relative soil moisture (Figure 3), the tendency rate of interannual relative soil moisture during the period from 1993 to 2013 was generally between -2.9 and 5, and that belonging to positive and negative were interlaced in China, and changed with season.
Figure 3 Spatial distribution of interannual variability of relative soil moisture in farmland
In spring, the areas with negative interannual tendency rate in Qinghai-Tibet Plateau Region, Northeast Region, Southwest Region, and Gansu-Xinjiang Region expanded with the increase of the soil depth. The areas with positive interannual tendency rate in Inner Mongolia and along the Great Wall Region, Loess Plateau Region, and Middle-Lower Yangtze River Region expanded with the increase of the soil depth. The spatial distribution of positive and negative interannual tendency rate of various soil depths in South China Region showed good consistency. The interannual tendency rate in the west of the Yunnan-Guangxi border was mainly negative, and in the eastern region was mainly positive. The areas with interannual tendency rate in Southwest Region, Huang-Huai-Hai Plain Region, and Middle-Lower Yangtze River Region expanded with the increase of soil depth. The relative soil moisture to 10 cm soil depth in the Middle-Lower Yangtze River Region and that to 20 cm soil depth in the northern part of the Tianshan Mountains in Gansu-Xinjiang Region have a tendency rate ranging from ‒20%/a to ‒5%/a. In autumn, the distribution of farmland areas with interannual tendency rate being 0‒5%/a was the widest. In South China Region, there was no area with negative interannual tendency rate at each soil depth and the interannual tendency rate was within the range of 0‒5%/a. In the eastern part of South China Region, there was partial area with an interannual tendency rate being 5%/a‒20%/a. The areas with positive and negative interannual tendency rate in other agricultural first-grade regions were characterized by interlaced phase distribution. In winter, the distribution of negative interannual tendency rate was more extensive than other seasons, and concentrated in Northeast Region, Gansu-Xinjiang Region, Inner Mongolia and along the Great Wall Region, Huang-Huai-Hai Plain Region and Southwest Region, while the interannual tendency rate was negative in the west of the Pearl River Estuary in the South China Region and at the junction with Southwest Region for the first time.
Judging from the interannual variation of the annual average, there were areas with negative interannual tendency rate in different soil depths in Southwest Region and most of Qinghai-Tibet Plateau Region. At the junction of Gansu-Xinjiang Region and Inner Mongolia and along the Great Wall Region, the junction of Middle-Lower Yangtze River Region and Huang-Huai-Hai Plain Region, and the junction of Huang-Huai-Hai Plain Region, Loess Plateau Region and Inner Mongolia and along the Great Wall Region, there were areas with negative interannual tendency rate at each soil depth. With the increase of soil depth, the areas with negative interannual tendency rate in various agricultural first-grade regions show an expanded trend from southeast to northwest.
From the perspective of the trends of interannual tendency rate with different seasons, the area with a negative annual interannual tendency rate was most widely distributed in winter. In summer and autumn, the interannual tendency rate in each agricultural first-grade region was mainly positive.

4.3 Interannual variation of relative soil moisture

The interannual variation of the annual average relative soil moisture of farmland in China had strong regularity (Figure 4). The trend of annual average relative soil moisture value of different soil depths in each agricultural first-grade region had strong consistency. The change in South China Region is greater than that in other regions. The relative soil moisture values in the Middle-Lower Yangtze River Region and Southwest Region were higher than those in other regions, while the relative soil moisture values in the Loess Plateau Region, Inner Mongolia and along the Great Wall Region, and Gansu-Xinjiang Region is significantly lower than those in other regions, and there were less differences among different soil depths in Inner Mongolia and the Great Wall Region.
Figure 4 Interannual variation of relative soil moisture in different agricultural first-grade regions
In Northeast Region, the interannual tendency rates of relative soil moisture in 10 cm, 20 cm and 50 cm soil depths were 0.18%/a, 0.14%/a, and 0.011%/a, respectively. In Gansu-Xinjiang Region, they were 0.26%/a, ‒0.15%/a, and ‒0.09%/a, respectively. In South China Region, they were 1.04%/a, 0.51%/a, and 0.24%/a, respectively. In Huang-Huai-Hai Plain Region, they were ‒0.31%/a, ‒0.35%/a, and ‒0.37%/a, respectively. In Loess Plateau Region, they were 0.017%/a, 0.049%/a, and 0.028%/a, respectively. In Inner Mongolia and along the Great Wall Region, they were ‒0.020%/a, 0.079%/a, and ‒0.022%/a, respectively. In the Qinghai-Tibet Plateau Region, they were 0.21%/a, 0.20%/a, and 0.0084%/a, respectively. In Southwest Region, they were 0.0026%/a, ‒0.16%/a, and ‒0.005%/a, respectively. In the Middle-Lower Yangtze River Region, they were 0.14%/a, 0.08%/a, and 0.15%/a, respectively. Since 1993, the interannual tendency rates of relative soil moisture in Huang-Huai-Hai Plain Region were negative, while in other regions they were generally positive. The fastest increasing rate of relative soil moisture appeared in the 20 cm soil depth in South China Region, and the slowest was in the 10 cm soil depth in Southwest Region. The highest negative tendency rate of relative soil moisture was in the 50 cm depth in the Huang-Huai-Hai Region, and the lowest was in the 50 cm soil depth in Southwest Region.

4.4 Monthly changes of relative soil moisture

The relative soil moisture values increased with the increase of soil depth in each month (Figure 5). There was a regional difference in the monthly trend of relative soil moisture, but there was a strong consistency in the monthly trend of relative soil moisture in different soil depths in the same agricultural first-grade region. There were also obvious regional differences in the monthly variation of relative soil moisture. The monthly variations in Middle-Lower Yangtze River Region, Northeast Region and the Qinghai-Tibet Plateau Region was relatively small, while they were relatively large in the Gansu-Xinjiang Region, South China Region, Inner Mongolia and along the Great Wall Region. The monthly variation of relative soil moisture in different regions shows a regularity of decreasing with the increase of soil depth. The relative soil moisture values of different soil depths in each month in Inner Mongolia and along the Great Wall Region were lower than those in other regions.
Figure 5 Monthly variation of relative soil moisture in different agricultural first-grade regions

5 Discussion

5.1 Influence of main meteorological elements on relative soil moisture

In spring, except that the relative soil moisture of farmland was negatively correlated with precipitation in the western part of the Hexi Corridor in Gansu-Xinjiang Region, the relative soil moisture in other region was generally positively correlated with precipitation (Figure 6). In most of the Middle-Lower Yangtze River Region, most of the South China Region, most of the Huang-Huai-Hai Plain Region, most of the Inner Mongolia and along the Great Wall Region, the eastern part of Northeast Region, the southwestern part of the Qinghai-Tibet Plateau Region, the southern part of the Loess Plateau Region, and the eastern part of Southwest Region, there was a strong positive correlation between relative soil moisture and precipitation, and the correlation coefficient was between 0.3 and 0.7. In autumn, the areas where relative soil moisture and precipitation were strong positively correlated in Northeast Region, Middle-Lower Reaches Yangtze River Region, Huang-Huai-Hai Plain Region and the Loess Plateau Region increased, while those in Southwest Region and South China Region decreased. In winter, the areas where relative soil moisture was positively correlated with precipitation were concentrated in most of South China Region and the southwestern part of Southwest Region, and there was also a sporadic distribution at the junction of Northeast Region and Inner Mongolia and along the Great Wall Region. The area where the relative soil moisture was negatively correlated with precipitation was scattered in China's non-monsoon region, mainly because precipitation in the non-monsoon region in winter is mainly snowfall, which will not be infiltrated to the soil immediately, and the absorption ability of soil after freezing is greatly reduced.
Figure 6 Spatial distribution of correlation coefficients between main meteorological factors and relative soil moisture
The relative soil moisture and potential evaporation of farmland were generally negatively correlated in each season (Figure 6). In spring, the relative soil moisture of farmland was negatively correlated with potential evaporation, and the correlation was especially strong in the eastern part of Northeast Region, most of Huang-Huai-Hai Plain Region, most of Middle-Lower Yangtze River Region, the eastern part of South China Region, the eastern part of Southwest Region, the Loess Plateau Region and the junction of the Gansu-Xinjiang Region and Qinghai-Tibet Plateau Region. In summer, the relative soil moisture and potential evaporation in the eastern margin of the Tarim Basin of Gansu-Xinjiang Region and the southern part of Middle-Lower Yangtze River Region were positively correlated. In Southwest Region, Inner Mongolia and along the Great Wall Region, Northeast Region, and the Loess Plateau, the area where relative soil moisture and potential evaporation was negatively correlated significantly expanded, but it has shown a trend of shrinking in Middle-Lower Yangtze River Region, Gansu-Xinjiang Region, Qinghai-Tibet Plateau Region, Huang-Huai-Hai Plain Region, and South China Region. In autumn, there was a strong negative correlation between relative soil moisture and potential evaporation in farmland. The farmland areas with negative correlation from ‒0.3 to 0 were mainly distributed in most of Gansu-Xinjiang Region, the southern part of Qinghai-Tibet Plateau Region, the eastern part of South China Region, and Middle-Lower Yangtze River Region. In winter, the areas where relative soil moisture and potential evaporation are positively correlated were widely distributed in the western part of Gansu-Xinjiang Region, the southeastern part of Inner Mongolia and along the Great Wall Region.
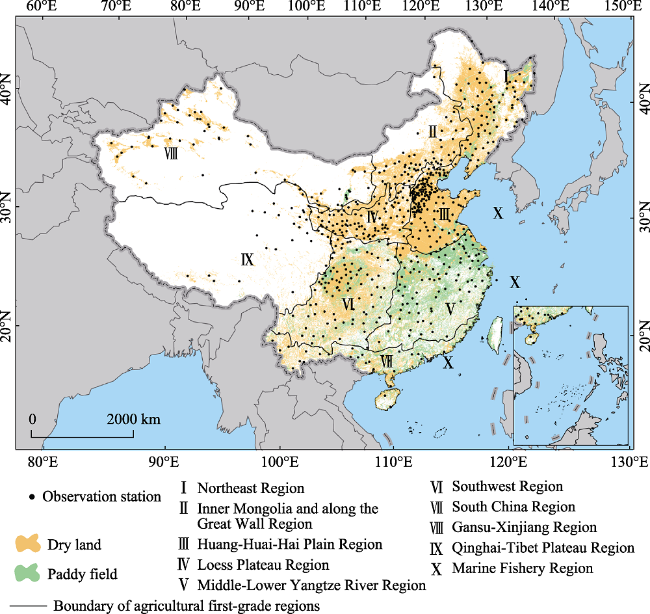
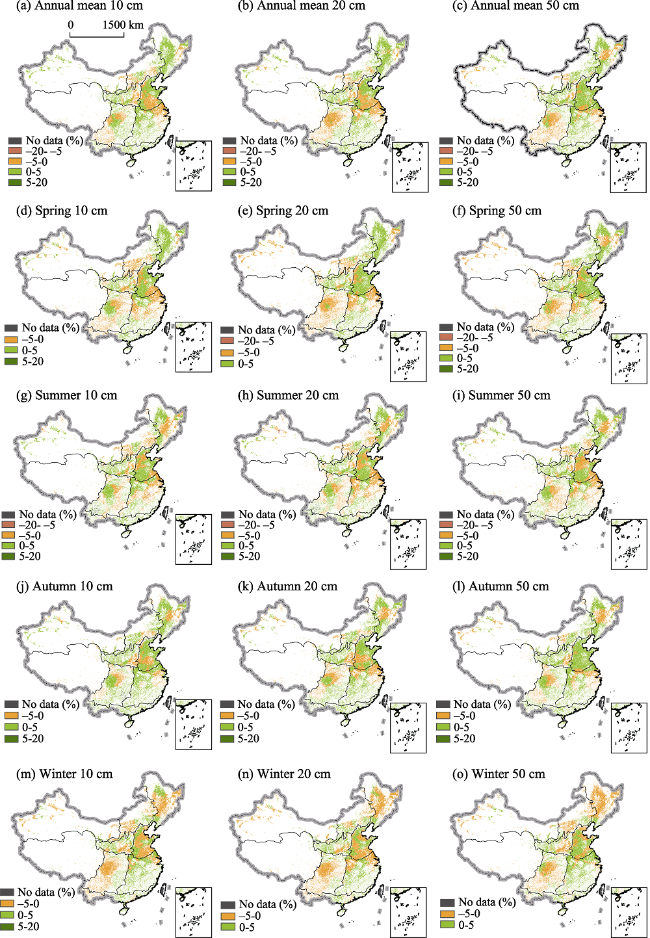
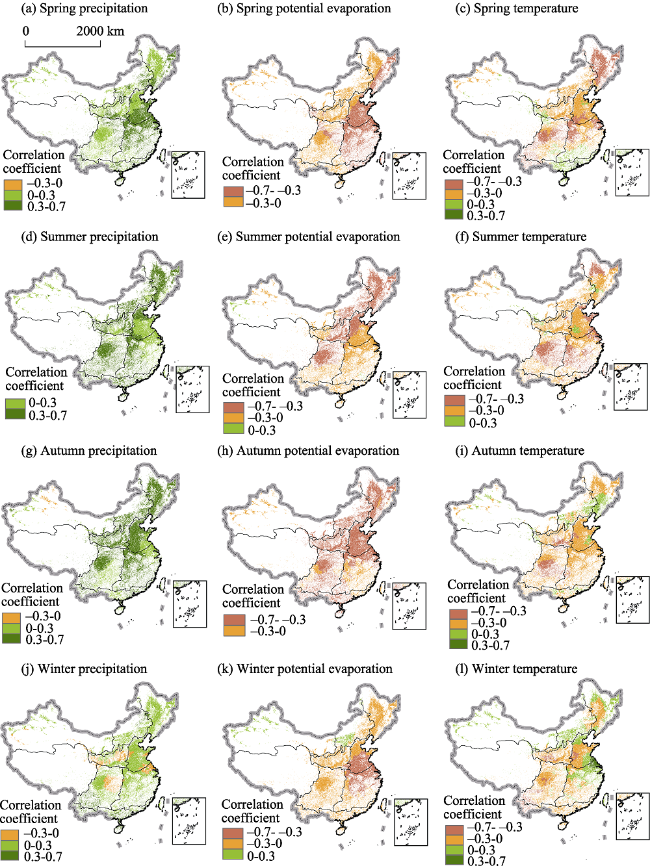
The spatial distribution of the correlation coefficient between relative soil moisture and temperature in farmland varied greatly seasonally (Figure 6). In spring, the relative soil moisture was generally negatively correlated with temperature. The areas where relative soil moisture was strongly negatively correlated were mainly distributed in most of Northeast Region, southwestern part of Huang-Huai-Hai Plain Region, northern part of Middle-Lower Yangtze River Region, most of Southwest Region, and the eastern part of South China Region. In addition, farmland with positive correlation between relative soil moisture and temperature was widely distributed in the southeastern part of Southwest Region, southern part of Middle-Lower Yangtze River Region, and the eastern part of South China Region, among these regions, the positive correlation was strong in the Pearl River Estuary. The areas where relative soil moisture and temperature was positively correlated were also found in the northeastern part of Southwest Region, the southwestern part of Loess Plateau Region, the northeastern part of Qinghai-Tibet Plateau Region, and Hexi Corridor of Gansu-Xinjiang Region, and were scattered in the eastern part of Huang-Huai-Hai Plain Region and the western part of Gansu-Xinjiang Region. In summer, the area where the relative soil moisture is positively correlated with temperature was generally shrinking, but it expanded at the junction of Northeast Region with the Inner Mongolia and along the Great Wall Region, and the Huang-Huai-Hai Plain Region. In autumn, the areas where relative soil moisture was positively correlated with temperature were mainly distributed in the southern part of Northeast Region, most of the Qinghai-Tibet Plateau Region, most of the Gansu-Xinjiang Region, the western part of the Loess Plateau Region, the Inner Mongolia and along the Great Wall Region, and the southeastern part of Huang-Huai-Hai Plain Region, and was sporadically distributed in South China Region. The areas where relative soil moisture had a strong negative correlation with temperature were located in the central part of Southwest Region, the southwestern part of Middle-Lower Yangtze River Region, the central part of the Huang-Huai-Hai Plain Region, and the southern part of the Loess Plateau Region. In winter, areas with the relative soil moisture positively correlated with temperature were found in the majority of Gansu-Xinjiang Region, most of Inner Mongolia and along the Great Wall Region, the eastern part of Northeast China Region, the northern part of Middle-Lower Yangtze River Region, and the southeastern and northern parts of the Huang-Huai-Hai Plain Region. There was a strong negative correlation between relative soil moisture and temperature in the southern part of the Loess Plateau Region, the western part of the Huang-Huai-Hai Plain Region, the western part of South China Region, and the southwestern part of Southwest Region.

5.2 Differences in relative soil moisture of paddy fields and dry land

Most of the paddy fields were in the monsoon region with sufficient precipitation and irrigation water source, and the annual average relative soil moisture in different soil depths were higher than those in the dry land (Figure 7). The relative soil moisture value in 20 cm and 50 cm depth soils of more than 85% of the paddy fields exceeded 80%, while it to 10 cm soil depth was mostly between 60% and 80%. The relative soil moisture in 10 cm and 20 cm depth of more than 50% dry land was between 60% and 80%, while it to 50 cm depth was mostly between 60% and 80% (Figure 2).
Figure 7 Interannual variation of relative soil moisture in different types of farmland
In summer, the correlations between relative soil moisture and precipitation, and potential evaporation in dry land was more significant than those in paddy fields. The correlation between relative soil moisture and temperature in paddy fields was stronger than that in dry land. In autumn, the correlations between relative soil moisture and precipitation, as well as potential evaporation in dry land were stronger than those in paddy fields, and the correlation between relative soil moisture and temperature in paddy fields was stronger than that in dry land. In winter, the correlations between relative soil moisture and precipitation in paddy fields and in dry land were relatively close. The correlation between relative soil moisture and potential evaporation in paddy field was stronger than that in dry land. The correlation between relative soil moisture and temperature in dry land was stronger than that in paddy fields. These suggested that the relative soil moisture in dry land in the northern agricultural region in summer and autumn was more affected by precipitation and evaporation. In winter, the influence of meteorological factors on relative soil moisture was weakened due to the formation of seasonal frozen soils in dry land of northern China, while relative soil moisture in Southwest Region, Middle and Lower Yangtze River Region, and South China Region was still affected by meteorological factors.

6 Conclusions

(1) Since 1993, the relative soil moisture of farmland in China has shown a fluctuant increasing trend.
(2) The relative soil moisture of farmland in China was generally greater than 60%. The distribution area has been expanding northward and westward with the summer monsoon since mid-April and has been shrinking eastward and southward since late October. The relative soil moisture increased with the increase of soil depth, and the distribution area with a high relative soil moisture also increased with the increase of soil depth.
(3) The interannual tendency rate of relative soil moisture in farmland ranged from ‒2.9%/a to 5%/a, and the areas where the interannual tendency rate was positive and negative were interlacedly distributed, and the area with positive interannual tendency rate increased with the increase of soil depth. The interannual and intermonthly variation of relative soil moisture at each soil depth showed a fluctuant increasing trend. The relative soil moisture of farmland increased fastest in summer and autumn, and the variation range decreased with the increase of soil depth.
(4) The relative soil moisture was positively correlated with precipitation, negatively correlated with potential evaporation and temperature.
(5) The annual average relative soil moisture value in paddy fields was higher than that in dry land. The difference of annual average relative soil moisture in these two types of farmland increased with the increase of soil depth. The meteorological factors had a great influence on the relative soil moisture of dry land in spring, summer and autumn, and they had a greater impact on the relative soil moisture of paddy fields in winter.

The authors have declared that no competing interests exist.

[1]
Allen R G, Pruitt W O, Wright J Let al., 2006. A recommendation on standardized surface resistance for hourly calculation of reference ETo, by the FAO56 Penman-Monteith method.Agricultural Water Management, 81(1): 1-22.https://linkinghub.elsevier.com/retrieve/pii/S037837740500154Xhttp://linkinghub.elsevier.com/retrieve/pii/S037837740500154X

DOI

[2]
Baroni G, Ortuani B, Facchi Aet al., 2013. The role of vegetation and soil properties on the spatio-temporal variability of the surface soil moisture in a maize-cropped field.Journal of Hydrology, 489(3): 148-159.https://linkinghub.elsevier.com/retrieve/pii/S0022169413002072Soil moisture dynamics are affected by complex interactions among several factors. Understanding the relative importance of these factors is still an important challenge in the study of water fluxes and solute transport in unsaturated media. In this study, the spatio-temporal variability of surface soil moisture was investigated in a 10ha flat cropped field located in northern Italy. Soil moisture was measured on a regular 50 50m grid on seven dates during the growing season. For each measurement campaign, the spatial variability of the soil moisture was compared with the spatial variability of the soil texture and crop properties. In particular, to better understand the role of the vegetation, the spatio-temporal variability of two different parameters leaf area index and crop height was monitored on eight dates at different crop development stages. Statistical and geostatistical analysis was then applied to explore the interactions between these variables. In agreement with other studies, the results show that the soil moisture variability changes according to the average value within the field, with the standard deviation reaching a maximum value under intermediate mean soil moisture conditions and the coefficient of variation decreasing exponentially with increasing mean soil moisture. The controls of soil moisture variability change according to the average soil moisture within the field. Under wet conditions, the spatial distribution of the soil moisture reflects the variability of the soil texture. Under dry conditions, the spatial distribution of the soil moisture is affected mostly by the spatial variability of the vegetation. The interaction between these two factors is more important under intermediate soil moisture conditions. These results confirm the importance of considering the average soil moisture conditions within a field when investigating the controls affecting the spatial variability of soil moisture. This study highlights the importance of considering the spatio-temporal variability of the vegetation in investigating soil moisture dynamics, especially under intermediate and dry soil moisture conditions. The results of this study have important implications in different hydrological applications, such as for sampling design, ranking stability application, indirect measurements of soil properties and model parameterisation.

DOI

[3]
Chen S Y, Guo K Z, Dong A X, 2008. Research of variety rule of soil humidity in Loess Plateau of China.Plateau Meteorology, 27(3): 530-537. (in Chinese)The distributional characteristics of climate and variety regulationof soil humidity in Loess Plateau of China are analyzed using the monthly precipitationdata of 59 weather stations from 1961 2002 and the data of water content at 29 agricultural meteorologicalobservation stations in April to Octoberfrom setting up of station to 2000.The result shows that:(1) Thesoil humidity of Loess Plateau from Aprilto Octoberis consistent well with the geographic distribution of precipitation;both the rainfall and soil humidity reduce from southeast to northwest,which is affected by Liupan Mountain and Taihang Mountain and Southeast monsoon,there is a narrow drought region extented southward in Gansu and Shanxi Provinces.(2) Thesoil humidity of Loess Plateauin China is dividedinto 5 climatic regionsby annual precipitation and vibrationparameter.They are the grassland desert sub-region which the soil severely loses moisture,the desert sub-region which soil loses moisture,the steppe region which soil loses moisture,the forest sub-region which soil periodically loses moisture and the Arden which soil periodically lacks moisture.The former threeclimatic sub-regions locates in the middle and north parts of Loess Plateau,the moisture among these regions can not be restored after rainy season and soil switches frequently in severe drought and light drought.The latter twoclimatic sub-regions arein the south of Loess Plateau,the soil moisture isrecovered during and after rainy season,meanwhile,seasonal water deficit still exists in these regions.(3) The soil humidity has dynamic state variety regulation.Generally,the soil humidity has increased from July,but each area increase range there is difference in increasing range of each area.(4) Soilhumidity is mainly influenced by precipitation.

[4]
Cho E, Choi M, 2014. Regional scale spatio-temporal variability of soil moisture and its relationship with meteorological factors over the Korean Peninsula.Journal of Hydrology, 516(17): 317-329.https://linkinghub.elsevier.com/retrieve/pii/S0022169414000055An understanding soil moisture spatio-temporal variability is essential for hydrological and meteorological research. This work aims at evaluating the spatio-temporal variability of near surface soil moisture and assessing dominant meteorological factors that influence spatial variability over the Korean peninsula from May 1 to September 29, 2011. The results of Kolmogorov mirnov tests for goodness of fit showed that all applied distributions (normal, log-normal and generalized extreme value: GEV) were appropriate for the datasets and the GEV distribution described best spatial soil moisture patterns. The relationship between the standard deviation and coefficient of variation (CV) of soil moisture with mean soil moisture contents showed an upper convex shape and an exponentially negative pattern, respectively. Skewness exhibited a decreasing pattern with increasing mean soil moisture contents and kurtosis exhibited the U-shaped relationship. In this regional scale (99,720km2), we found that precipitation indicated temporally stable features through an ANOVA test considering the meteorological (i.e. precipitation, insolation, air temperature, ground temperature and wind speed) and physical (i.e. soil texture, elevation, topography, and land use) factors. Spatial variability of soil moisture affected by the meteorological forcing is shown as result of the relationship between the meteorological factors (precipitation, insolation, air temperature and ground temperature) and the standard deviation of relative difference of soil moisture contents (SDRDt) which implied the spatial variability of soil moisture. The SDRDt showed a positive relationship with the daily mean precipitation, while a negative relationship with insolation, air temperature and ground temperature. The variation of spatial soil moisture pattern is more sensitive to change in ground temperature rather than air temperature changes. Therefore, spatial variability of soil moisture is greatly affected by meteorological factors and each of the meteorological factors has certain duration of effect on soil moisture spatial variability in regional scale. The results provide an insight into the soil moisture spatio-temporal patterns affected by meteorological and physical factors simultaneously, as well as the design criteria of regional soil moisture monitoring network at regional scale.

DOI

[5]
Delworth T L, Manabe S, 1988. The influence of potential evaporation on the variabilities of simulated soil wetness and climate.Journal of Climate, 1(5): 523-547.http://journals.ametsoc.org/doi/abs/10.1175/1520-0442(1988)001&lt;0523:TIOPEO&gt;2.0.CO;2An atmospheric general circulation model with prescribed sea surface temperature and cloudiness was integrated for 50 years in order to study atmosphere-land surface interactions. The temporal variability of model soil moisture and precipitation have been studied in an effort to understand the interactions of these variables with other components of the climate system.Temporal variability analysis has shown that the spectra of monthly mean precipitation over land are close to white at all latitudes, with total variance decreasing poleward. In contrasts, the spectra of soil moisture are red, and become more red with increasing latitude. As a measure of this redness, half of the total variance of a composite tropical soil moisture spectrum occurs at periods longer than nine months, while at high latitudes, half of the total variance of a composite soil moisture spectrum occurs at periods longer than 22 months. The spectra of soil moisture also exhibit marked longitudinal variations.These spectral results may be viewed in the light of stochastic theory. The formulation of the GFDL soil moisture parameterization is mathematically similar to a stochastic process. According to this model, forcing of a system by an input white noise variable (precipitation) will yield an output variable (soil moisture) with a red spectrum, the redness of which is controlled by a damping term (potential evaporation). Thus, the increasingly red nature of the soil moisture spectra at higher latitudes is a result of declining potential evaporation values at higher latitudes. Physically, soil moisture excesses are dissipated more slowly at high latitudes where the energy available for evaporation is small.Some of the longitudinal variations in soil moisture spectra result from longitudinal variations in potential evaporation, while others are explicable in terms of the value of the ratio of potential evaporation to precipitation. Regions where this value is less than one are characterized by frequent runoff and short time scales of soil moisture variability. By preventing excessive positive anomalies of soil moisture, the runoff process hastens the return of soil moisture values to their mean state, thereby shortening soil moisture time scales.Through the use of a second GCM integration with prescribed soil moisture, it was shown that interactive sod moisture may substantially increase summer surface air temperature variability. Soil moisture interacts with the atmosphere primarily through the surface energy balance. The degree of soil saturation strongly influences the atmosphere of outgoing energy from the surface between the latent and sensible heat fluxes. Interactive soil moisture allows larger variations of these fluxes, thereby increasing the variance of surface air temperature. Because the flux of latent heat is directly proportional to potential evaporation under conditions of sufficient moisture, the influence of soil moisture on the atmosphere is greatest when the potential evaporation value is large. This occurs most frequently in the tropics and summer hemisphere extratropics.

DOI

[6]
Delworth T L, Manabe S, Stouffer R J, 1993. Interdecadal variations of the thermohaline circulation in a coupled ocean-atmosphere model.Journal of Climate, 6(11): 1993-2011.http://journals.ametsoc.org/doi/abs/10.1175/1520-0442%281993%29006%3C1993%3AIVOTTC%3E2.0.CO%3B2A fully coupled ocean-atmosphere model is shown to have irregular oscillations of the thermohaline circulation in the North Atlantic Ocean with a time scale of approximately 50 years. The irregular oscillation appears to be driven by density anomalies in the sinking region of the thermohaline circulation (approximately 52 N to 72 N) combined with much smaller density anomalies of opposite sign in the broad, rising region. The spatial pattern of see surface temperature anomalies associated with this irregular oscillation bears an encouraging resemblance to a pattern of observed interdecadal variability in the North Atlantic. The anomalies of sea surface temperature induce model surface air temperature anomalies over the northern North Atlantic, Arctic, and northwestern Europe.

DOI

[7]
Deng J Z, 1982. Some problems on the comprehensive agricultural regionalization of China.Geographical Research, 1(1): 9-18. (in Chinese)http://en.cnki.com.cn/Article_en/CJFDTOTAL-DLYJ198201002.htmIn this paper the author states the main features and necessity of the comprehensive agricultural regionalization, intoduces a scheme of regionalization of the whole of China, and discusses some topics for further investigation.As the comprehensive agricultural reginalization represents the regional similarities and differences of the conditions, peculiarities, potentials, orientations and measures of the development of agricultral production, it plays an indispensable role as a basic scientific means in the agricultural planning and guidance in line with local conditions. The author has worked out a scheme of comprehensive agricultural regionalization of China, which was adopted in 1980 by the Nationwide Committee of Agricultural Regionalization. under the State Agricultural Commission .This paper briefly presents its criteria of demarcation, working processes and system of regionalization.Taking the orientatoin of production and development measures as the key criteria, the author demarcated the country into 10 main agricultural regions and 38 subregions.In order to provide the study of regionalization with more validity and completeness, the author suggests the following topics to be adopted for further study, such as problems on the adjustment of distribution of agricultural production, on the selection and building of commercial production bases of agriculture, the adjustment of the orientation of production in areas destroyed seriously in ecological balance, the rationalizaton of agricultural structures in various regions, field investigations of some important agro-geographical limits, possible patterns and steps to be taken to realize the areali specialization of agriculture in China, etc.

DOI

[8]
Fang W S, Deng T H, Liu R Het al., 2005. Variation regularities of soil water in vari-type soils in Henan Province.Meteorological Science and Technology, 33(2): 182-184. (in Chinese)http://en.cnki.com.cn/Article_en/CJFDTOTAL-QXKJ200502018.htmAn analysis was made of the soil water data from the Henan Provincial soil water database from July 1997 to June 2003, and the variation regularities of soils water for various types of soils are discussed. The results show that the available soil water is the greatest for loam, the second for clay and the least for sandy soil. The soil water is influenced by underground water greatly. The areas with lower underground water level are less attacked by droughts. Based on the soil water data, the correction coefficients of soil water and the distributions of field capacities for various types of soils over Henan Province were determined, which were used a the forecast model of soil water.

[9]
Ju H R, Zhang Z X, Zhao X Let al., 2018. The changing patterns of cropland conversion to built-up land in China from 1987 to 2010.Journal of Geographical Sciences, 28(11): 1595-1610.http://link.springer.com/article/10.1007/s11442-018-1531-8Over the past few decades,built-up land in China has increasingly expanded with rapid urbanization,industrialization and rural settlements construction.The expansions encroached upon a large amount of cropland,placing great challenges on national food security.Although the impacts of urban expansion on cropland have been intensively illustrated,few attentions have been paid to differentiating the effects of growing urban areas,rural settlements,and industrial/transportation land.To fill this gap and offer comprehensive implications on framing policies for cropland protection,this study investigates and compares the spatio-temporal patterns of cropland conversion to urban areas,rural settlements,and industrial/transportation land from 1987 to 2010,based on land use maps interpreted from remote sensing imagery.Five indicators were developed to analyze the impacts of built-up land expansion on cropland in China.We find that 42,822 km2 of cropland were converted into built-up land in China,accounting for 43.8% of total cropland loss during 1987 2010.Urban growth showed a greater impact on cropland loss than the expansion of rural settlements and the expansion of industrial/transportation land after 2000.The contribution of rural settlement expansion decreased;however,rural settlement saw the highest percentage of traditional cropland loss which is generally in high quality.The contribution of industrial/transportation land expansion increased dramatically and was mainly distributed in major food production regions.These changes were closely related to the economic restructuring,urban-rural transformation and government policies in China.Future cropland conservation should focus on not only finding a reasonable urbanization mode,but also solving the "hollowing village" problem and balancing the industrial transformations.

DOI

[10]
Li R C, Zhang X Z, Wang L Het al., 2011. Analysis on soil moisture content in the middle reaches of the Yellow River.Arid Zone Research, 28(1): 85-91. (in Chinese)lt;![CDATA[http://pub.chinasciencejournal.com/article/getArticleRedirect.action?doiCode=10.3724/SP.J.1148.2011.00085]]>

DOI

[11]
Lu D R, Huang B, Wang J S.2011. Change of the ten-day precipitation and its relationship with soil moisture in the rain-fed area east of the Yellow River in Gansu Province.Agricultural Research in the Arid Areas, 29(2): 230-235. (in Chinese)http://en.cnki.com.cn/Article_en/CJFDTOTAL-GHDQ201102041.htmBased on the daily precipitation and the soil moisture data from 1971 2007,analysis is made of the spatial distribution and climatic variability of ten-day precipitation,and the relationship between the change of ten-day precipitation and soil moisture.The data are from 13 meteorological stations over the rain-fed area east of Yellow River in Gansu Province.The results show that the distribution of every ten-day average precipitation presents as two styles,i.e.the southern type and the eastern type.The area with the biggest amount of precipitation is located in the southern(eastern) part of the study area and the precipitation decreases from south(east) to north(west) when the distribution of precipitation shows the southern(eastern) type.In recent 37 years,the occurrence probability of southern(eastern) type is 37(63) percent and the main occurrence period is during the first ten-day in March(last ten-day in June) and the mid ten-day in June(last ten-day in November).The tendency of precipitation change appears significant decreasing for the first ten-day in March,the mid ten-day in April,the first ten-day in September and the first ten-day in October.There exists,in a sense,a significant positive correlation between the ten-day precipitation and the corresponding ten-day soil moisture,while the time of soil thawing and the relative amount of precipitation also have influence on this correlation.

[12]
Ma Z G, Wei H L, Fu C Bet al., 1999. Progress in the research on the relationship between soil moisture and climate change.Advance in Earth Sciences, (3): 88-94. (in Chinese)

[13]
Ma Z G, Wei H L, Fu C Bet al., 2000. Relationship between regional soil moisture variation and climatic variability over east China.Acta Meteorologica Sinica, 58(3): 278-287. (in Chinese)http://en.cnki.com.cn/Article_en/CJFDTOTAL-QXXB200003002.htmBased on the data of soil moisture, precipitation and temperature every ten-day over the east of China from 1981 to 1991, their trend, interannual variability and relationship among them were analyzed. The results indicate the notable trend of soll moisture, pre-cipitation and air temperature, positive correlation between soil moisture in every layer and precipitation, and negative correlation soil moisture and air temperature can be found, the correlation coefficient reaches the testing of degree of confidence of 0. 01. Al-so the results mean the data is useful for analyzing the relationship between soil mois-ture and climate change.

[14]
National Agricultural Regionalization Commission (NARC), 1981. Comprehensive Agricultural Regionalization of China. Beijing: China Agriculture Press. (in Chinese)

[15]
Wan G N, Yang M X, Wang X Jet al., 2012. Variations in soil moisture at different time scales of BJ Site on the central Tibetan Plateau.Chinese Journal of Soil Science, 43(2): 286-293. (in Chinese)http://en.cnki.com.cn/Article_en/CJFDTOTAL-TRTB201202005.htmThe temporal and spatial variations in soil moisture play an important role in the water and energy cycle on the Tibetan Plateau.Based on the observed high resolution hourly soil moisture data(4-210 cm) obtained by GAME-Tibet at BJ site on the central Tibetan Plateau from 1 January 2001 to 31 December 2005,the diurnal,seasonal and interannual variation characteristics in soil moisture are analysed.The results are as follows.(1) The average diurnal variation in soil moisture at 4 cm soil depth is evident.However,the average diurnal variation in soil moisture at 20-210 cm soil depth is extremely weak.The average diurnal amplitude(ADA) of soil moisture decreases gradually with the increase of soil depth.But the ADA of soil moisture at 210 cm soil depth increases slightly.The ADA of soil moisture at 4,20,60,100,160 and 210 cm soil depth are 0.97,0.22,0.03,0.01,0.01 and 0.03%,respectively.(2) According to the variation characteristic in soil moisture at different time scales and vertical section,the variation in soil moisture throughout the year can be divided into three phases: accumulation phase(March to August),attenuation phase(August to December) and the relatively stable phase(December to March),respectively.(3) During the period 2001 to 2005,the soil moisture at 4,20,60,100 and 160 cm soil depth in August increases with a linear trend.Conversely,the soil moisture at 210 cm soil depth in August decreases with a linear trend.During the wet season,soil moisture has an obvious response to precipitation;however,during the dry season,soil moisture affected by soil temperature significantly.

DOI

[16]
Wang F Q, Wang L, Chen X, 2015. Analysis of relative soil moisture variation characteristics and influencing factors in Zhengzhou City.Water Saving Irrigation, (2): 8-11. (in Chinese)http://en.cnki.com.cn/Article_en/CJFDTOTAL-JSGU201502004.htmThe relative soil moisture is an important index to characterize agriculture drought.The systematic analysis of relative soil moisture variation characteristics helps to accurately forecast agriculture drought conditions.In this paper,the statistical methods are applied to analyze the relative soil moisture variation characteristics and the relationship between relative soil moisture and precipitation and temperature is preliminarily explored by using relative soil moisture,the monthly precipitation and temperature data from1994 to 2013in Zhengzhou.The results show that the relative soil moisture of past nearly 20 years is gradually decreasing,the reducing rate is 0.44% per year;the largest value of relative soil moisture in 10,20,50 cm soil layer occurred,respectively,in the year of 2006,1996 and 1996,while the smallest value occurred,respectively,in the year of 2010,2008 and 1995,the relative soil moisture is gradually decreasing,and the reducing rates are 0.29% per year,0.48% per year,0.13% per year,respectively;the relative soil moisture is positively correlated with precipitation and negatively correlated with temperature,and shows stronger correlation with precipitation;with the increase of soil levels,the correlation between relative soil moisture and precipitation increases first and then decreases,while the correlation between relative soil moisture and temperature decreases gradually;the relationship between relative soil moisture and precipitation and temperature in 0~20cm soil layer is the most closely.This research will provide a reference for regional agricultural drought resistance work.

[17]
Wang L, Wen J, Wei Z Get al., 2008. Soil moisture over the west of Northwest China and its response to climate.Plateau Meteorology, 27(6): 1257-1266. (in Chinese)

[18]
Wang S P, Zhang C J, Song L Cet al., 2013. Relationship between soil relative humidity and the multiscale meteorological drought indexes.Journal of Glaciology & Geocryology, 35(4): 865-873. (in Chinese)Based on the correlation analysis between soil relative humidity and meteorological drought indexes in 5areas of China,the impact of meteorological drought on the soil moisture is discussed.The results show that due to the differences in water and thermal conditions,the time scale of meteorological drought which causes soil drought is different in different seasons and different areas.In spring,the amount of precipitation since last year,especially in late autumn and early winter,has obviously impact on the soil relative humidity in Northeast China,while in the eastern part of Northwest China,North China,Southwest China,Huanghuai,Jianghuai and Jianghan areas,the soil relative humidity is closely depended on the atmospheric moisture in recent two months.In summer,soil relative humidity in the five areas is closely related to precipitation and temperature in recent two months.In autumn,the meteorological drought in recent two to four months will control the soil drought in the northern part of China and in other four areas;the soil relative humidity is strongly correlated with atmospheric moisture in recent two months.In addition,a soil relative humidity prediction model through multiple linear regressions based on the main indexes is developed with the data from 1992to 2007in each area in spring,summer and autumn.The efficiency of each model is also verified with data from 2008to 2011.The results show that these models have certain ability to fit the soil relative humidity with the mean absolution deviation within 10.1%to 13.9%,(11.7% in average).Among them,the deviation in the east of Northwest China and North China is larger in spring and summer,with the fitting accuracy of drought classes between 65% and 74.9%.In Northeast China,Southwest China,Huanghuai,Jianghuai and Jianghan areas,the model is more effective,with a fitting accuracy above 88%.The fitting curves of soil relative humidity on May 28th,Aug.28th,Sept.28th,2011also verify the feasibility of these models.

DOI

[19]
Yamamoto J K, 2007. On unbiased backtransform of lognormal kriging estimates.Computational Geosciences, 11(3): 219-234.http://link.springer.com/10.1007/s10596-007-9046-xLognormal kriging is an estimation technique that was devised for handling highly skewed data distributions. This technique takes advantage of a logarithmic transformation that reduces the data variance. However, backtransformed lognormal kriging estimates are biased because the nonbias term is totally dependent on a semivariogram model. This paper proposes a new approach for backtransforming lognormal kriging estimates that not only presents none of the problems reported in the literature but also reproduces the sample histogram and, consequently, the sample mean.

DOI

[20]
Younis S M Z, Iqbal J, 2015. Estimation of soil moisture using multispectral and FTIR techniques.Egyptian Journal of Remote Sensing and Space Science, 18(2): 151-161.https://linkinghub.elsevier.com/retrieve/pii/S1110982315000563Soil moisture is a key capricious in hydrological process, the accessibility of moisture content in soil reins the mechanism amid the land surface and atmospheric progression. Precise soil moisture determination is influential in the weather forecast, drought monitoring, hydrological modeling, agriculture management and policy making. The aims of the study were to estimate soil moisture through remotely sensed data (FTIR & optical) and establishment of the results with field measured soil moisture data. The ground measurements were carried out in 0 15cm depth. Permutation of normalized difference vegetation index (NDVI) and land surface temperature (LST) were taken to derive temperature vegetation dryness index (TVDI) for assessment of surface soil moisture. Correlation and regression analysis was conceded to narrate the TVDI within situcalculated soil moisture. The spatial pattern of TVDI shows that generally low moisture distribution over study area. A significant (p<0.05) negative correlation ofr=0.79 was found between TVDI andin situsoil moisture. The TVDI was also found adequate in temporal variation of surface soil moisture. The triangle method (TVDI) confers consistent appraisal of moisture situation and consequently can be used to evaluate the wet conditions. Furthermore, the appraisal of soil moisture using the triangular method (TVDI) was possible at medium spatial resolutions because the relationship of soil moisture with LST and NDVI lends an eloquent number of representative pixels for developing a triangular scatter plot.

DOI

[21]
Zhang J, Zhang W Y, Wang X Yet al., 2012. Changes characteristics of the soil moisture in semi-arid areas.Journal of Lanzhou University, 48(2): 57-61. (in Chinese)http://en.cnki.com.cn/Article_en/CJFDTOTAL-LDZK201202011.htmAnalysised the change characteristic of soil moisture in semi-arid area by using the soil moisture data 5~80 cm soil layer observed every half hour in SACOL station from May 2006 to December 2009.The results show that the seasonal changes in soil moisture in 5~40 cm soil layers are obvious,which manifest characteristic of three high and three low trend;in the 80 cm soil layer the seasonal changes are not obvious.The fluctuation of soil moisture in shallow layer is larger than that in deep layer,the average daily range of the soil moisture content of each layer 5~80 cm is 1.08%,0.57%,0.25%,0.11%and 0.04%respectively.The variance of the 10 cm layer is 5.71%,while the 80 cm layer's is only 2.69%.Soil moisture changes with the depth of the soil layer, season and weather background.With the deepening of soil layer,the soil moisture is increasing in winter, however the situation is opposite in other seasons.The time lag of soil moisture between the upper and lower soil layer is increasing when the soil layer deepens,the shortest is 3.5 hours and the longest is 35 hours;but the correlation of soil moisture between the upper and lower soil layer decreases.

DOI

[22]
Zhang J Y, Dong W J, Ye D Zet al., 2003. New evidence for effects of land cover in China on summer climate.Chinese Science Bulletin, 48(1): 91-95. (in Chinese)http://link.springer.com/10.1007/BF03183342At fertilization, repetitive transient rises of intracellular calcium concentration occur in all mammals studied so far. It has been shown that calcium rises could be induced when mouse fertilized 1-, 2-cell nuclei were trans-planted into unfertilized eggs and that the reconstituted em-bryo could be activated. However, whether the capability of inducing calcium rises occurs in all stages of mammalian embryos remains unknown. In this study, by using the nu-clear transplantation technique and measurement of intra-cellular calcium rises in living cells, we showed that only the nuclei from mouse fertilized 1-cell and 2-cell embryos, nei-ther the nuclei from 4-, 8-cell and ethanol activated parthe-nogenetic embryos nor 2 or 3 nuclei of electrofused 4-cell stage syncytium, have calcium-releasing activity when they were transferred into unfertilized mature oocytes. Our results indicate that the calcium-releasing activity in nuclei of 1-, 2-cell embryos is produced during fertilization and exists at the special stage of fertilized early embryos. These suggested that the capacity of inducing calcium release ac-tivity in fertilized early embryos is important for normal embryonic development.

DOI

[23]
Zhang L, Lü H Q, Wang L Yet al., 2016. Spatial-temporal characteristics of soil moisture in China.Acta Geographica Sinica, 71(9): 1494-1508. (in Chinese)http://www.en.cnki.com.cn/Article_en/CJFDTotal-DLXB201609004.htmUsing actual observed soil moisture data of 155 agro-meteorological stations across China, at dekadal scale from 1981 to 2010, this paper examined the spatial and temporal characteristics of soil moisture at each 10 cm depth from 0 to 50 cm, at regional and national scales. Annual trend and significant change point were detected through tendency analysis and Cram r- von Mises test methods. Since soil texture and crop types were approximately homogeneous in each climatic region, regional average variation of soil moisture could be observed in the analysis. Mean soil moisture was between 15% and 25% in most regions while it was above 25% in the northern part of Northeast China and southern part of Southwest China. At each depth, larger soil moisture was detected in Southwest China, Jianghuai,Northeast China, Jiangnan, Jianghan, Huanghuai and South China, while the smallest value was observed in Inner Mongolia. As soil deepening, except in Tibetan Plateau, increases in soil moisture were apparent, being a maximal magnitude in Southwest China. Obviously, as well as periodical characteristics, annual and seasonal difference of soil moisture emerged at each depth, corresponding well to regional precipitation, temperature, and water demand for planting crops. An obvious freezing- increasing- deceasing- increasing trend existed in Northeast China,Inner Mongolia and Xinjiang, a variation of deceasing- increasing- fluctuating in North China,Huanghuai, and eastern Northwest China, a multiple fluctuation in Jianghuai, Jianghan and Jiangnan, and a deceasing- increasing- deceasing trend in South China and Southwest China,while an increasing-deceasing trend was found in the Tibetan Plateau. Soil moisture at a greater depth was higher than that at superficial layers. Annual soil moisture varied at each depth, but the mean value decreased from 1981 to 2010. Such annual variation could be well explained by corresponding temperature and precipitation. Consequently, soil moisture tended to decrease in response to temperature increase, following climate change. Apart from climatic factors, soil texture and crop type, as well as human activity, can have influence on soil moisture, which is needed to be studied further. Soil moisture decreased in Xinjiang, South China, North China,Tibetan Plateau, Northeast China and Huanghuai among which Xinjiang was most remarkable with a velocity above-2.3%?(10a)~(-1). Except in Jianghuai, a significant change of soil moisture was detected, mainly during two periods, i.e. from the late 1980 s to early 1990 s, and late 1990 s.

DOI

[24]
Zhang Q, Wang S, 2007. Study on annual water-heat characteristics and annual variation of surface radiation balance in arid desert area. Progress in Natural Science, 17(2): 211-216. (in Chinese)

[25]
Zhang R H, Liu L, Zuo Z Y, 2016. Variations of soil moisture over China and their influences on Chinese climate.Chinese Journal of Nature, 38(5): 313-319. (in Chinese)http://www.en.cnki.com.cn/Article_en/CJFDTOTAL-ZRZZ201605002.htmSoil moisture is one of the key factors in climate system, which significantly affects the cycles of water, energy and geobiochemistry in earth system. This paper gives a review on the atmospheric influences of soil moisture as well as the variations of soil moisture over China and their impacts on Chinese climate, so as to illustrate the soil moisture's influences on atmosphere through altering the surface energy and water balances. In eastern China, the climatological distribution of spring soil moisture exhibits high values in northeastern China and middle-lower reaches of Yangtze River valley, and low values in northern China with the lowest in He Tao region. The largest interannual variation of spring soil moisture is found over the middle latitudes in eastern China, which is out of phase with that over northeastern China. The soil in eastern China shows drying trend, with deeper layers drying more significantly than upper layers and northeastern and southern China than middle latitudes. A wetter than normal spring soil moisture over the region ranging from Yangtze River valley to northern China can weaken the East Asian summer monsoon through altering the surface energy balance in late spring, resulting in less summer rainfall over southern and northern China, more over middle-lower reaches of Yangtze River valley and northeastern China. The local rainfall in monsoon marginal zone over northern China and the air temperature in northern China are influenced significantly by the local soil moisture.

[26]
Zhang W J, Zhou T J, Yu R C, 2008. Spatial distribution and temporal variation of soil moisture over China (Part I): Multi-data intercomparison.Chinese Journal of Atmospheric Sciences, 32(3): 581-597. (in Chinese)http://en.cnki.com.cn/article_en/cjfdtotal-dqxk200803014.htmSoil moisture is one of the most important factors affecting the climate.However,deficiency of data coverage has limited the progress of soil moisture studies in terms of its role in climate.In this paper,four sets of widely-used soil moisture data are collected,i.e.the European Centre for Medium Range Weather Forecasting(ECMWF) 40-year reanalysis(ERA40),the National Centers for Environmental Prediction/National Center for Atmospheric Research(NCEP/NCAR) reanalysis data,Global Soil Wetness Project product,and the output of the Community Land Model forced by observational atmospheric conditions.Qualities of these four sets of soil moisture data over mainland China are evaluated by using observational evidences.The results show that the spatial patterns of the four soil moisture data sets generally agree well with the observation.The GSWP2 data are the best one among four datasets in producing the observational pattern,i.e.,the soil moisture gradually increases from northwestern to northeastern and southeastern China,with northeastern and southern China being wet,northern and northwestern China being dry.The seasonal cycle of GSWP2 soil moisture is also better than any of the others.The ERA40 data have the highest correlation with the observation in producing the interannual variability of the soil moisture.All data show significant positive correlation between the precipitation and later time soil moisture,while no significant correlation can be found between precipitation and preceding soil moisture.The relationship between the soil moisture and air temperature is complex and the results are region-dependent.

DOI

[27]
Zhang X Z, Wu X Y, He J H, 2004. Vertical character of soil moisture in China.Acta Meteorologica Sinica, 62(1): 51-61. (in Chinese)http://en.cnki.com.cn/Article_en/CJFDTotal-QXXB200401005.htmTowards the vertical characteristics of soil moisture, a series of analyses were carried out, based on the moisture data of layer 0-100 cm soil collected at 57 meteorological stations from 1981-2000 in China. According to the distribution o f moisture alon g the vertical direction, the changes in soil moisture can be categorized into 3 types: (1) summer vertical uniformly distributed, rapid vertically changing, a nd se asonally differencing type. The main characteristics of the first type are low m oisture in summer seasons and relative uniformity in distribution, as well as ce rtain differences in vertical direction in the spring and fall seasons. This ty pe is mainly seen in Xinjiang and Ningxia Autonomous Regions, the east of Gansu and Henan provinces, where the soil is loam or sand soil; (2) The rapid vertic ally changing type locates in areas known as moisture jumping layer (defined as the l ayer where perennially existing the largest vertical difference in soil moisture ), which the moisture in the top is smaller than the bottom layer.Based on the density of vertical gradients and relative depth, there are three subgroups, whi ch are large upper vertical gradient, large middle and lower vertical gradient, as well as uniformly distributed vertical gradient. This type is mainly di stributed in Guangxi Autonomous Regions, Intersection area of Yellow River and H uai River, and some areas in the Northeast China where different upper and lower soil layer are found; (3) Seasonally differencing type, appears mai nly in northern areas where the soil is frozen during the winter seasons. Althou gh this type is characterized by larger soil moisture in middle and upper layers during the winter seasons, the depth of the high-humid layer differs from soil in different areas and with different compositions. When analyzing the depth /time sections of the soil moisture anomalies, signs of the moisture anomalies tested at most observation stations are vertically consi stent, signs are the reverse of the upper and lower layers in some stations. The changing characteristics here were represented by long-run consistent dry or hu mid, as well as 3-4a cyclical trends. When integrating the soil moisture and pre cipitation during dry and humid periods , the vertical distribution is found to remain in its original climate state at most observation stations. And there exi sts a well-defined corresponding relationship between the difference of moisture and the difference of precipitation for dry and humid periods.

DOI

[28]
Zhang Y F, Wang X P, Pan Y Xet al., 2011. The dependence of surface albedo on soil moisture in an arid desert area. Journal of Desert Research, 31(5): 1141-1148. (in Chinese)http://en.cnki.com.cn/Article_en/CJFDTotal-ZGSS201105013.htmThe surface albedo and soil moisture of sand dune and biological soil crusts were measured concurrently in field plots of a moving sand area and an artificially revegetated area established in Shapotou in southeasten edge of the Tengger Desert in 1964.We mainly aimed to study the relationships between surface albedo and solar elevation angle and surface soil moisture.The empirical formulas relating surface albedo to solar elevation angle and to surface soil moisture were proposed.The results indicated that surface albedo has an exponential function with solar elevation angle,and the normalized surface albedo decreases exponentially with the increasing of surface soil moisture in condition of removing the solar elevation angle effects.Moreover,the surface albedo of sand dune was found to be more sensitive to the response of surface soil moisture than that of biological soil crusts.The response of surface albedo to soil moisture varied with land surface types,which may be related to soil color or/and innate attributes of soils.

DOI

[29]
Zhou B, Li J, Lin J Jet al., 2015. Soil relative moisture characteristics and influencing factors in Liaoning province in spring.Chinese Journal of Ecology, 34(6): 1630-1637. (in Chinese)

[30]
Zhu G F, He Y Q, Pu Tet al., 2011. Spatial distribution and temporal trends in potential evapotranspiration over Hengduan Mountains region from 1960 to 2009.Acta Geographica Sinica, 66(7): 905-916. (in Chinese)http://link.springer.com/article/10.1007/s11442-012-0912-7Based on the meteorological data of 20 stations in the Hengduan Mountains region during 1961-2009, the annual and seasonal variation of potential evapotranspiration was analyzed in combination with the Penman-Monteith model. With the method of Spline interpolation under ArcGIS, the spatial distribution of potential evapotranspiration was presented to research the regional difference, and the correlation analysis was used to discuss the dominant factor affecting the potential evapotranspiration. The results indicated that the annual potential evapotranspiration showed a decreasing tendency since the 1960s, especially from the 1980s to 1990s, while it showed an increasing tendency since 2000. Regional potential evapotranspiration showed a rate of -0.17 mm a -1. Potential evapotranspiration in north, middle and south of the Hengduan Mountains exhibited decreasing trends over the studied period, and its regional trend was on the decline from southwest to northeast.

DOI

[31]
Zhu G F, Qin D H, Tong H Let al., 2016. Variation of Thornthwaite moisture index in Hengduan Mountains, China.Chinese Geographical Science, 26(5): 687-702.http://link.springer.com/10.1007/s11769-016-0820-3The Thornthwaite moisture index, an index of the supply of water (precipitation) in an area relative to the climatic demand for water (potential evapotranspiration), was used to examine the spatial and temporal variation of drought and to verify the influence of environmental factors on the drought in the Hengduan Mountains, China. Results indicate that the Thornthwaite moisture index in the Hengduan Mountains had been increasing since 1960 with a rate of 0.1938/yr. Annual Thornthwaite moisture index in Hengduan Mountains was between 97.47 and 67.43 and the spatial heterogeneity was obvious in different seasons. Thornthwaite moisture index was high in the north and low in the south, and the monsoon rainfall had a significant impact on its spatial distribution. The tendency rate of Thornthwaite moisture index variation varied in different seasons, and the increasing trends in spring were greater than that in summer and autumn. However, the Thornthwaite moisture index decreased in winter. Thornthwaite moisture index increased greatly in the north and there was a small growth in the south of Hengduan Mountains. The increase of precipitation and decrease of evaporation lead to the increase of Thornthwaite moisture index. Thornthwaite moisture index has strong correlation with vegetation coverage. It can be seen that the correlation between Normalized Difference Vegetation Index (NDVI) and Thornthwaite moisture index was positive in spring and summer, but negative in autumn and winter. Correlation between Thornthwaite moisture index and relative soil relative moisture content was positive in spring, summer and autumn, but negative in winter. The typical mountainous terrain affect the distribution of temperature, precipitation, wind speed and other meteorological factors in this region, and then affect the spatial distribution of Thornthwaite moisture index. The unique ridge-gorge terrain caused the continuity of water-heat distribution from the north to south, and the water-heat was stronger than that from the east to west part, and thus determined the spatial distribution of Thornthwaite moisture index. The drought in the Hengduan Mountains area is mainly due to the unstable South Asian monsoon rainfall time.

DOI

[32]
Zhu G F, Shi P J, Pu Tet al., 2013. Changes of surface soil relative moisture content in Hengduan Mountains, China, during 1992-2010.Quaternary International, 298(7): 161-170.https://linkinghub.elsevier.com/retrieve/pii/S1040618213000281The detection of soil moisture content is very valuable in the study of hydrological processes and environments. The purpose of this study was to characterize the spatial and temporal variations of soil moisture contents in 0-50 cm soil layer depths in the Hengduan Mountains, and to make inferences regarding the environmental factors that influence such variability. Soil moisture contents were measured with a drying method at ten day intervals. Based on soil relative moisture content data from 16 observation stations during 1992-2010, spatial and temporal changes of soil relative moisture content were analyzed using Kriging interpolation. Results indicated that the soil relative moisture content in the Hengduan Mountains has been increasing since 1992 with a rate of 0.51% y(-1). The soil relative moisture contents were relatively high in the southwest and the northeast, and low in the southeast and the northwest. The value of soil moisture increases with increasing soil depth. For seasonal variation, the increasing trends of soil relative moisture content in spring and summer were greater than that in autumn and winter. The main meteorological factors which lead to the increasing of soil relative moisture content were the increase of precipitation and decrease of evaporation. In addition, local topography and vegetation cover were positive influencing factors in soil moisture variations in a specific region. (C) 2013 Elsevier Ltd and INQUA. All rights reserved.

DOI

[33]
Zhu H D, Shi Z H, Fang N Fet al., 2014. Soil moisture response to environmental factors following precipitation events in a small catchment.Catena, 120(3): 73-80.https://linkinghub.elsevier.com/retrieve/pii/S034181621400101561Analysis of soil moisture following precipitation events.61Variation in soil water increased with following rainfall events.61Environmental factors effect on soil moisture varies for different periods.

DOI

[34]
Zhu H J, Chen J F, Chen S L et al., 2010. Soil Geography. Beijing: Higher Education Press. (in Chinese)

[35]
Zhuo G, Chen T, Zhou K Set al., 2015. Spatial and temporal distribution of soil moisture over the Tibetan Plateau during 2009-2010.Journal of Glaciology & Geocryology, 37(3): 625-634. (in Chinese)http://en.cnki.com.cn/Article_en/CJFDTotal-BCDT201503008.htmThe soil moisture dataset derived from China Land Data Assimilation System of China M eteorological Administration from 1 July,2009 to 30 June,2010 are used to investigate the variation characteristics of soil moisture at different depths over the Tibetan Plateau. Results show that the soil moisture has significant seasonal variation,namely the soil moisture is the maximum in spring,follow ed by summer and the minimum in autumn.The soil moisture appears the characteristics w ith low er moisture at shallow er layer and deeper layer,w hile it has higher moisture betw een the shallow er layer and deeper layer,and the variation range decreases gradually from the shallow er layer to the deeper layer. With the rise of air temperature,from M arch to August is soil moisture increasing period,and the area w ith high moisture expands not only from the southeast to the northw est of the plateau,but also from Tarim Basin to the northeast regions of Tibet. Beginning from September,the soil moisture presents w ide-ranging decreasing,w ith the area w ith high moisture moving from the south to the north of the plateau at the shallow layer,but opposite at the middle layer. The seasonal difference of soil moisture at deeper layer is quite small and the areas w ith high moisture are almost located in the south of the plateau.

[36]
Zuo Z Y, Zhang R H, 2007. The spring soil moisture and the summer rainfall in eastern China.Chinese Science Bulletin, 52(14): 1722-1724. (in Chinese)http://www.cqvip.com/QK/86894X/200723/26101408.htmlThe relation between the soil moisture in spring and the rainfall in summer in eastern China is investi-gated. Results show that the summer rainfall in eastern China is closely related to the spring soil moisture in the area from North China to the lower reaches of Yangtze River (NCYR). When spring soil moisture anomalies over NCYR are positive, the summer precipitation exhibits positive anomalies in Northeast China and the lower reaches of Yangtze River, and negative anomalies in southern China and North China. The higher soil moisture over NCYR cools land surface and reduces the land-sea tem-perature gradient, which weakens East Asian summer monsoon. The western Pacific Subtropical High (WPSH) is located to the south and shifts westward, resulting in more rainfall in the lower reaches of Yangtze River and less in southern China and North China.

DOI

[37]
Zuo Z Y, Zhang R H, 2018. Spatial and temporal variations of spring soil moisture in East China.Scientic Sinica Terrae, 38(11): 1428-1437. (in Chinese)

Outlines

/