
Journal of Geographical Sciences >
The impact of global cropland changes on terrestrial ecosystem services value, 1992-2015
Author: Li Yuanyuan (1993-), specialized in land use change. E-mail: 13511038653@126.com
Received date: 2018-01-04
Accepted date: 2018-07-25
Online published: 2019-03-20
Supported by
National Natural Science Foundation of China, No.41771116, No.41501095
National Basic Research Program of China, No.2015CB452705
National Key Research and Development Program of China, No.2016YFC0502103
Copyright
From 1992 to 2015, ecological environment has been threatened by the changes of cropland around the world. In order to evaluate the impact of cropland changes on ecosystem, we calculated the response of terrestrial ecosystem service values (TESVs) variation to cropland conversion based on land-use data from European Space Agency (ESA). The results showed that cropland changes were responsible for an absolute loss of $166.82 billion, equivalent to 1.17% of global TESVs in 1992. Among the different regions, the impact of cropland changes on TESVs was significant in South America and Africa but not obvious in Oceania, Asia and Europe. Cropland expansion from tropical forest was the main reason for decreases in TESVs globally, especially in South America, Africa and Asia. The effect of wetland converted to cropland was notable in North America and Europe while grassland converted to cropland played an important role in Oceania, Africa and Asia. In Europe, the force of urban expansion cannot be ignored as well. The conversion of cropland to tropical or temperate forest partly compensated for the loss of TESVs globally, especially in Asia.
LI Yuanyuan , TAN Minghong , HAO Haiguang . The impact of global cropland changes on terrestrial ecosystem services value, 1992-2015[J]. Journal of Geographical Sciences, 2019 , 29(3) : 323 -333 . DOI: 10.1007/s11442-019-1600-7
Table 1 TESVs per unit area ($/ha per year based on the 2016 value of the USD) (after Costanza et al., 1997) |
| Ecosystem services | Tropical forest | Temperate forest | Grassland | Cropland | Wetland |
|---|---|---|---|---|---|
| Gas regulation | 0.00 | 0.00 | 11.34 | 0.00 | 215.46 |
| Climate regulation | 361.26 | 142.56 | 0.00 | 0.00 | 0.00 |
| Disturbance regulation | 8.10 | 0.00 | 0.00 | 0.00 | 7353.18 |
| Water regulation | 9.72 | 0.00 | 4.86 | 0.00 | 24.30 |
| Water supply | 12.96 | 0.00 | 0.00 | 0.00 | 6156.00 |
| Erosion control | 396.90 | 0.00 | 46.98 | 0.00 | 0.00 |
| Soil formation | 16.20 | 16.20 | 1.62 | 0.00 | 0.00 |
| Nutrient cycling | 1493.64 | 0.00 | 0.00 | 0.00 | 0.00 |
| Waste treatment | 140.94 | 140.94 | 140.94 | 0.00 | 6766.74 |
| Pollination | 0.00 | 0.00 | 40.50 | 22.68 | 0.00 |
| Biological control | 0.00 | 6.48 | 37.26 | 38.88 | 0.00 |
| Habitat/Refugia | 0.00 | 0.00 | 0.00 | 0.00 | 492.48 |
| Food production | 51.84 | 81.00 | 108.54 | 87.48 | 414.72 |
| Raw materials | 510.30 | 40.50 | 0.00 | 0.00 | 171.72 |
| Genetic resources | 66.42 | 0.00 | 0.00 | 0.00 | 0.00 |
| Recreation | 181.44 | 58.32 | 3.24 | 0.00 | 929.88 |
| Cultural | 3.24 | 3.24 | 0.00 | 0.00 | 1427.22 |
| Total | 3251.00 | 489.00 | 376.00 | 149.00 | 23952.00 |
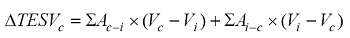 (2)
(2)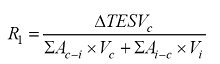 (3)
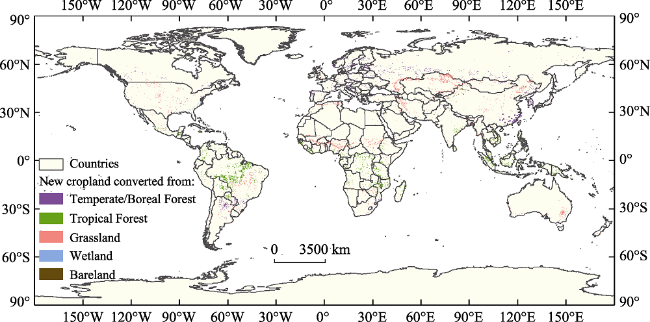
(3)Figure 1 Cropland gains between 1992 and 2015 |
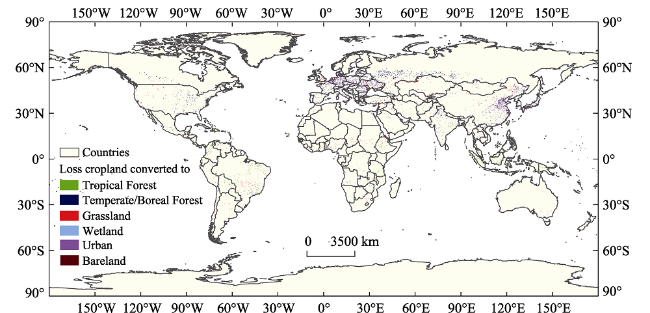
Figure 2 Cropland loss between 1992 and 2015 |
Table 2 Changes in TESVs caused by cropland changes at a global level, 1992-2015 |
| 1992 | 2015 | V ($/ha) | A (×106 ha) | TESVs (×109 $) |
|---|---|---|---|---|
| Cropland converted into | Tropical forest | 3102.00 | 17.62 | 54.67 |
| Temperate forest | 340.00 | 12.43 | 4.23 | |
| Grassland | 227.00 | 6.77 | 1.54 | |
| Wetland | 23803.00 | 0.05 | 1.12 | |
| Urban | -149.00 | 25.02 | -3.73 | |
| Bare land | -149.00 | 0.64 | -0.09 | |
| Tropical forest | Converted into cropland | -3102.00 | 60.44 | -187.47 |
| Temperate forest | -340.00 | 25.96 | -8.83 | |
| Grassland | -227.00 | 56.17 | -12.75 | |
| Wetland | -23803.00 | 0.68 | -16.12 | |
| Bare land | 149.00 | 4.07 | 0.61 |
Table 3 Changes in TESVs caused by cropland changes at regional level, 1992-2015 |
| Region | TESVs of 1992 (×109 $) | Growth rate of cropland area (%) | TESVs gains caused by cropland loss (×109 $) | TESVs loss caused by cropland gains (×109 $) | TESVs (×109 $) | R1 (%) | R2 (%) | Main Reason |
|---|---|---|---|---|---|---|---|---|
| Global | 14269.62 | 3.96 | 57.73 | 224.56 | -166.83 | -65.21 | -1.17 | A |
| North America | 1624.14 | 1.31 | 2.44 | 18.93 | -16.48 | -78.72 | -1.01 | B |
| South America | 3622.39 | 12.02 | 19.85 | 101.50 | -81.65 | -74.74 | -2.25 | A |
| Africa | 3334.06 | 7.52 | 9.04 | 51.99 | -42.95 | -73.92 | -1.29 | A |
| Europe | 548.15 | -0.67 | 0.12 | 3.33 | -3.21 | -54.57 | -0.59 | C |
| Asia | 4496.71 | 2.34 | 25.86 | 47.58 | -21.72 | -36.46 | -0.48 | A |
| Oceania | 587.69 | 4.26 | 0.38 | 1.01 | -0.63 | -36.26 | -0.11 | D |
Notes: A stands for the main reason of decreasing TESVs, which was cropland converted from tropical forest. Similarly, B stands for cropland converted from wetland; C stands for cropland converted from temperate forest and D stands for cropland converted from grassland. |
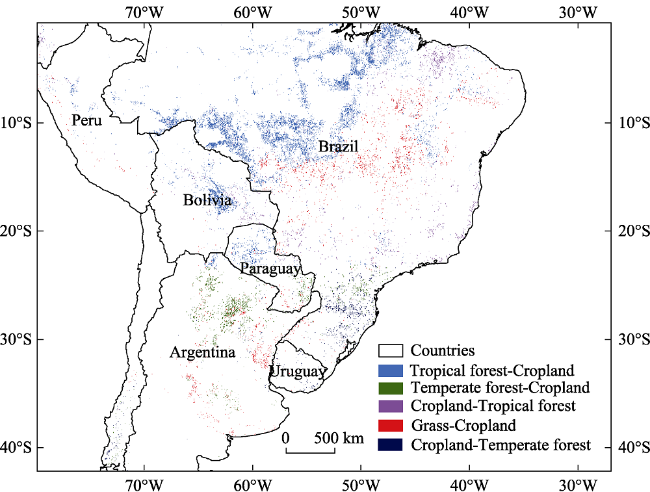
Figure 3 Cropland change in South America, 1992-2015 (Tropical forest-Cropland means that tropical forest in 1992 was converted into cropland in 2015. Other conversions are similar to this.) |
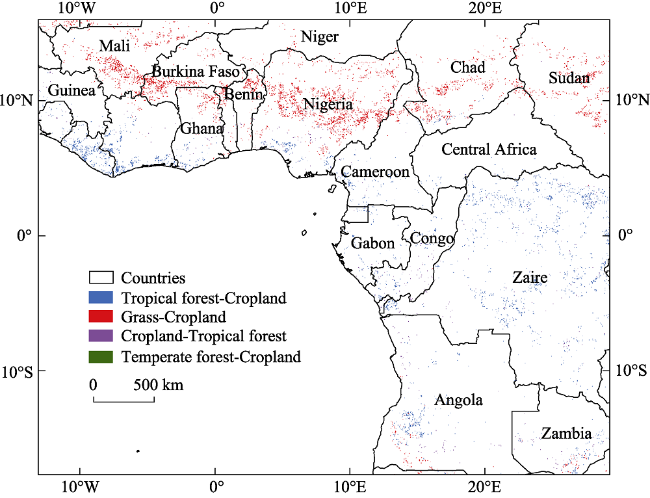
Figure 4 Cropland change in Africa, 1992-2015 |
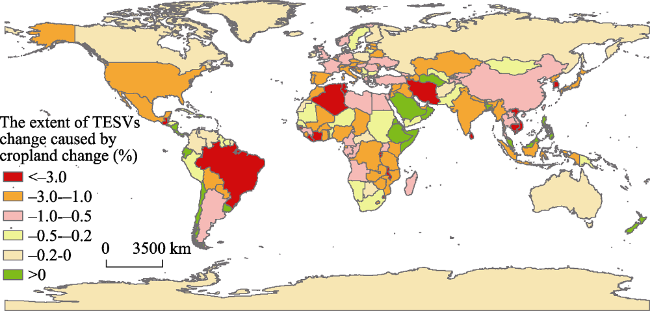
Figure 5 The extent of TESVs changes caused by cropland change (R2), 1992-2015 |
The authors have declared that no competing interests exist.
| [1] |
|
| [2] |
|
| [3] |
|
| [4] |
|
| [5] |
|
| [6] |
|
| [7] |
|
| [8] |
|
| [9] |
|
| [10] |
|
| [11] |
|
| [12] |
|
| [13] |
European Space Agency (ESA), 2017. Land cover CCI product user guide version 2.0. .
|
| [14] |
FAOSTAT, Statistics Division (ESS), Environment Statistics Team, FAO, 2017. .
|
| [15] |
|
| [16] |
|
| [17] |
|
| [18] |
|
| [19] |
|
| [20] |
|
| [21] |
|
| [22] |
|
| [23] |
|
| [24] |
|
| [25] |
|
| [26] |
|
| [27] |
|
| [28] |
|
| [29] |
|
| [30] |
|
| [31] |
|
| [32] |
|
| [33] |
|
| [34] |
|
| [35] |
|
| [36] |
|
| [37] |
|
| [38] |
|
| [39] |
|
| [40] |
|
| [41] |
|
| [42] |
|
| [43] |
|
| [44] |
|
| [45] |
|
| [46] |
|
| [47] |
|
| [48] |
|
/
| 〈 |
|
〉 |