
Journal of Geographical Sciences >
The effect of terrain factors on rice production: A case study in Hunan Province
Author: Wang Chenzhi, Master Candidate, E-mail: chenzhiwang@mail.bnu.edu.cn
Received date: 2018-03-20
Accepted date: 2018-05-10
Online published: 2019-02-25
Supported by
Creative Research Groups of National Natural Science Foundation of China, No.41621061
National Natural Science Foundation of China, No.41571493, No.31561143003
Copyright
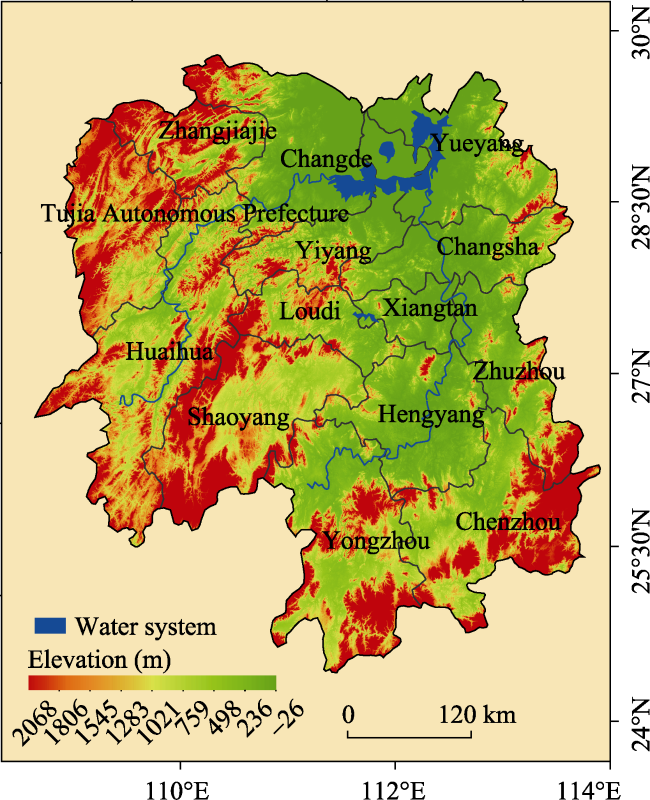
Rice (Oryza sativa L.) is the most important staple crop of China, and its production is related to both natural condition and human activities. It is fundamental to comprehensively assess the influence of terrain conditions on rice production to ensure a steady increase in rice production. Although many studies have focused on the impact of one or several specific factors on crop production, few studies have investigated the direct influence of terrain conditions on rice production. Therefore, we selected Hunan Province, one of the major rice-producing areas in China, which exhibits complex terrain conditions, as our study area. Based on remote sensing data and statistical data, we applied spatial statistical analysis to explore the effects of terrain factors on rice production in terms of the following three aspects: the spatial patterns of paddy fields, the rice production process and the final yield. We found that 1) terrain has a significant impact on the spatial distribution of paddy fields at both the regional scale and the county scale; 2) terrain controls the distribution of temperature, sunlight and soil, and these three environmental factors consequently directly impact rice growth; 3) compared with the patterns of paddy fields and the rice production process, the influences of terrain factors on the rice yield are not as evident, with the exception of elevation; and 4) the spatial distribution of paddy fields mismatched that of production resources due to terrain factors. Our results strongly suggest that managers should scientifically guide farmers to choose suitable varieties and planting systems and allocate rice production resources in the northern plain regions to ensure food security.
Key words: rice production; terrain factor; spatial distribution; rice phenology
WANG Chenzhi , ZHANG Zhao , ZHANG Jing , TAO Fulu , CHEN Yi , DING Hu . The effect of terrain factors on rice production: A case study in Hunan Province[J]. Journal of Geographical Sciences, 2019 , 29(2) : 287 -305 . DOI: 10.1007/s11442-019-1597-y
Figure 1 The location of Hunan Province in China and its terrain |
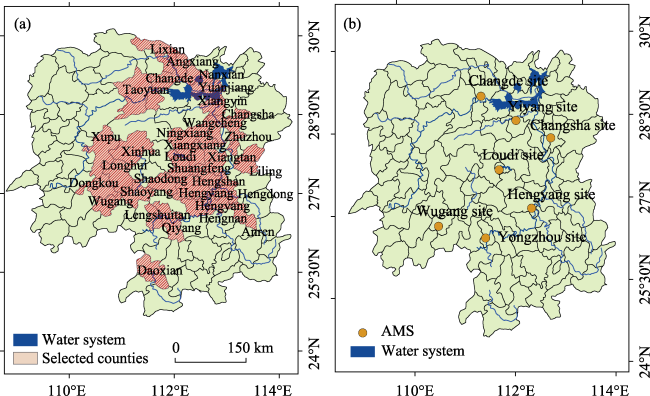
Figure 2 Spatial distribution of selected counties and agricultural meteorological stations in Hunan Province |
Table 1 Some records of double cropping rice phenological information in Hunan Province |
| Site | Cropping system | Transplant | Tillering | Heading | Mature | Tillering- transplant | Heading- tillering | Mature- heading |
|---|---|---|---|---|---|---|---|---|
| Changde | Early rice | 33 | 52 | 103 | 133 | 15 | 51 | 30 |
| Late rice | 31 | 44 | 86 | 121 | 13 | 42 | 34 | |
| Hengyang | Early rice | 32 | 44 | 85 | 116 | 12 | 41 | 31 |
| Late rice | 22 | 31 | 75 | 114 | 9 | 44 | 40 | |
| Wugang | Early rice | 28 | 53 | 93 | 112 | 17 | 40 | 29 |
| Late rice | 32 | 42 | 73 | 110 | 11 | 31 | 37 |
Table 2 Classification criterion of slope position |
| Types | Classification criterion |
|---|---|
| Ridge | TPI>1 SD |
| Up-hill | 0.5 SD<TPI≤1 SD |
| Mid-hill | ‒0.5 SD<TPI<0.5 SD,Slope> 5° |
| Flat | ‒0.5 SD<TPI<0.5 SD,Slope≤ 5° |
| Down-hill | ‒1 SD<TPI≤‒0.5 SD |
| Valley | TPI<‒1.0 SD |
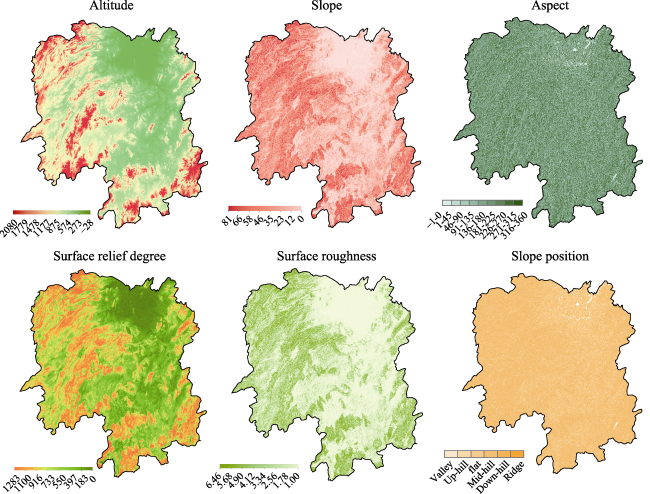
Figure 3 Terrain factors of Hunan Province |
Table 3 Effect of different resolutions of DEM on the extraction of terrain factors |
| a. Average slope extracted from DEM with different resolutions | ||||||||
|---|---|---|---|---|---|---|---|---|
| DEM resolution | Plain | Tableland | Hill | Mountain | ||||
| Xiangyin | Yuanjiang | Changsha | Zhuzhou | Changning | Yongxing | Dong’an | Shuangpai | |
| 30 | 2.14 | 1.29 | 5.83 | 7.35 | 10.15 | 11.38 | 13.85 | 22.79 |
| 50 | 2.13 | 1.29 | 5.83 | 7.34 | 10.15 | 11.37 | 13.85 | 22.79 |
| 70 | 2.13 | 1.29 | 5.82 | 7.33 | 10.16 | 11.37 | 13.86 | 22.79 |
| 90 | 2.09 | 1.27 | 5.81 | 7.33 | 10.20 | 11.38 | 13.83 | 21.09 |
| 110 | 2.03 | 1.19 | 5.76 | 7.28 | 10.24 | 11.39 | 13.82 | 18.73 |
| b. Average altitude extracted from DEM with different resolutions | ||||||||
| DEM resolution | Plain | Tableland | Hill | Mountain | ||||
| Xiangyin | Yuanjiang | Changsha | Zhuzhou | Changning | Yongxing | Dong’an | Shuangpai | |
| 30 | 32.71 | 29.14 | 77.52 | 94.25 | 195.60 | 245.63 | 549.14 | 389.59 |
| 50 | 32.70 | 29.14 | 77.51 | 94.22 | 195.01 | 245.56 | 549.09 | 389.76 |
| 70 | 32.70 | 29.14 | 77.50 | 94.13 | 195.00 | 245.46 | 548.91 | 390.20 |
| 90 | 32.70 | 29.14 | 77.52 | 94.09 | 194.26 | 245.46 | 548.74 | 390.76 |
| 110 | 32.70 | 29.14 | 77.51 | 94.10 | 194.24 | 245.50 | 548.70 | 390.53 |
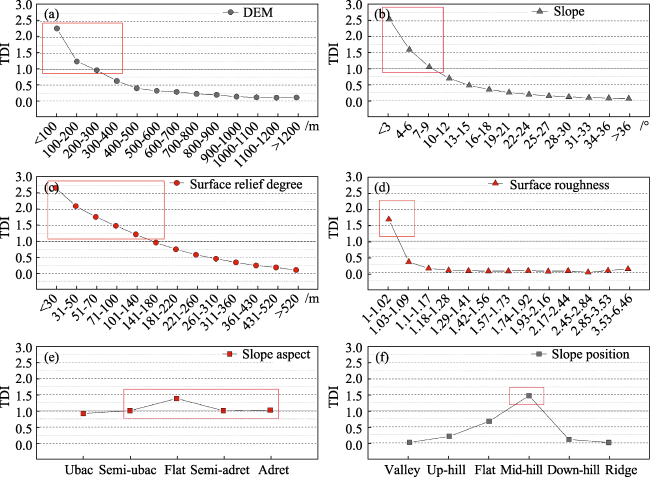
Figure 4 Terrain distribution index values of rice paddy fields in Hunan Province |
Table 4 Correlation between terrain factors and ratios of paddy field areas to entire county areas |
| Terrain factors | Altitude | Slope | Relief degree | Surface roughness | |
|---|---|---|---|---|---|
| RPF | Pearson coefficient | ‒0.782 | ‒0.85 | ‒0.811 | ‒0.783 |
| P-value | <0.01 | <0.01 | <0.01 | <0.01 | |
RPF: Ratio of paddy field areas in a county to whole county areas |
Table 5 Estimates of global Moran’s I and their tests for terrain factors and ratios of the paddy field area to total area at the county level |
| RPF | Altitude | Slope aspects | Relief degree | Surface roughness | |
|---|---|---|---|---|---|
| Moran’ I | 0.67 | 0.71 | 0.7 | 0.67 | 0.66 |
| Z-score | 10.64 | 11.27 | 10.94 | 10.47 | 10.39 |
| P-value | <0.01 | <0.01 | <0.01 | <0.01 | <0.01 |
| Z-score threshold | 2.58 | 2.58 | 2.58 | 2.58 | 2.58 |
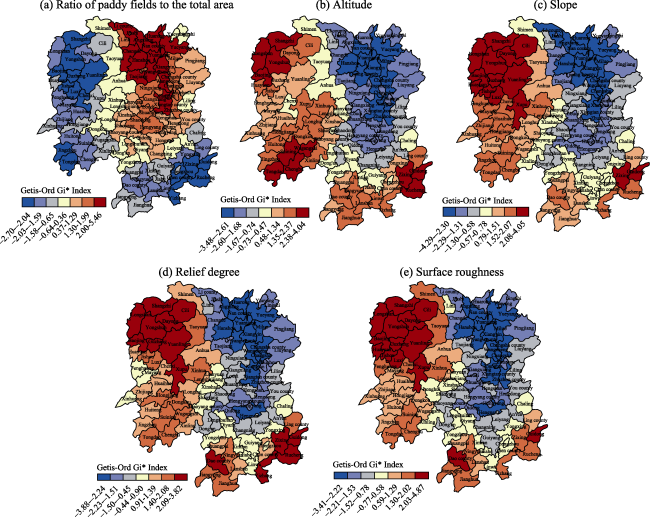
Figure 5 Hotspot map of ratio of paddy fields to total county area and of terrain factors |
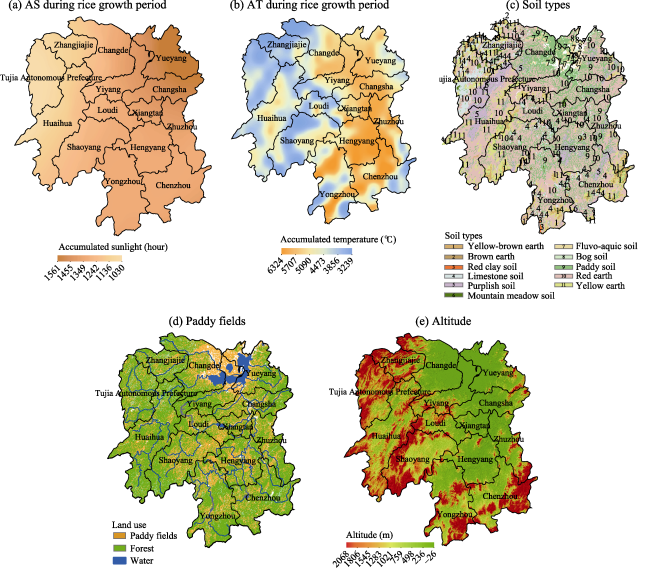
Figure 6 Spatial distribution of environmental factors of rice growth and terrain factors in Hunan Province |
Table 6 Correlation between terrain factors and early rice phenology |
| Stages of early rice phenology | Altitude | Slope | Relief degree | Surface roughness |
|---|---|---|---|---|
| Transplanting | ‒0.75** | ‒0.10 | ‒0.31 | ‒0.13 |
| Tillering | 0.00 | ‒0.69** | ‒0.33 | ‒0.64** |
| Heading | 0.42 | ‒0.67 | 0.30 | ‒0.55 |
| Mature | 0.45 | ‒0.35 | 0.43 | ‒0.18 |
| Tillering-transplanting | ‒0.05 | ‒0.38 | ‒0.25 | ‒0.42 |
| Heading-tillering | 0.43 | ‒0.08 | 0.58 | 0.00 |
| Mature-heading | 0.23 | 0.37 | 0.40 | 0.53 |
Note: In this table, symbol ‘**’ represents the correlation coefficient that passes the 95% confidence interval test; symbol ‘*’ represents the correlation coefficient that passes the 90% confidence interval test. Moreover, phenological stages such as transplanting, tillering and so on are a relative length of phenology: we used the date of this phenological stage to subtract the date of the emerge stage. The ‘Tillering-transplant’, ’Heading-tillering’ and ‘Mature-heading’ represent the length between two phenology stages. |
Table 7 Correlation between terrain factors and late rice phenology |
| Stages of late rice phenology | Altitude | Slope | Relief degree | Surface roughness |
|---|---|---|---|---|
| Transplant | ‒0.15 | 0.07 | ‒0.16 | 0.15 |
| Tillering | ‒0.21 | ‒0.04 | ‒0.19 | 0.08 |
| Heading | ‒0.64** | ‒0.09 | ‒0.54 | ‒0.13 |
| Mature | ‒0.77** | 0.05 | ‒0.37 | 0.01 |
| Tillering-transplant | ‒0.21 | ‒0.23 | ‒0.13 | ‒0.10 |
| Heading-tillering | ‒0.67** | ‒0.08 | ‒0.55 | ‒0.25 |
| Mature-heading | ‒0.67** | 0.24 | 0.03 | 0.22 |
Note: In this table, symbol ‘**’ represents the correlation coefficient that passes the 95% confidence interval test; symbol ‘*’ represents the correlation coefficient that passes the 90% confidence interval test. Moreover, phenological stages such as transplanting, tillering and so on are a relative length of phenology: we used the date of this phenological stage to subtract the date of the emerge stage. The ‘Tillering-transplanting’, ’Heading-tillering’ and ‘Mature-heading’ represent the length between two phenological stages. |
Table 8 Correlation between terrain factors and rice yield |
| Altitude | Slope | Relief degree | Surface roughness | ||
|---|---|---|---|---|---|
| Yield per unit area | Pearson coefficient | ‒0.584 | ‒0.312 | ‒0.381 | ‒0.382 |
| P-value | <0.05 | >0.1 | <0.1 | <0.1 | |
Table 9 Estimates of global Moran’s I and their tests for terrain factors and rice yield at the county level |
| Rice yield | Altitude | |
|---|---|---|
| Moran’ I | 0.54 | 0.83 |
| Z-Score | 2.27 | 3.37 |
| P-value | <0.05 | <0.01 |
| Z-score threshold | 1.96 | 2.58 |
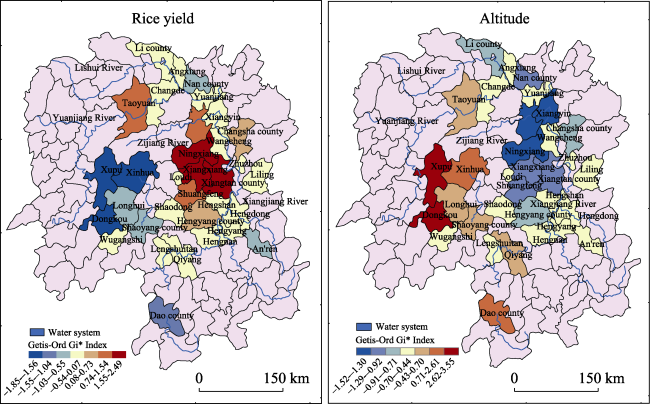
Figure 7 Hotspot map of rice yield at the county level and hotspot map of elevation |
The authors have declared that no competing interests exist.
| [1] |
|
| [2] |
|
| [3] |
|
| [4] |
Department of Rural Survey, NBS, 2011. China Rural Statistical Yearbook (2011). Beijing: China Statistics Press (in Chinese) China Statistics Press. (in Chinese)
|
| [5] |
Department of Rural Survey, NBS, 2012. China Rural Statistical Yearbook (2012). Beijing: China Statistics Press (in Chinese) China Statistics Press. (in Chinese)
|
| [6] |
Department of Rural Survey, NBS, 2013. China Rural Statistical Yearbook (2013). Beijing: China Statistics Press (in Chinese) China Statistics Press. (in Chinese)
|
| [7] |
|
| [8] |
|
| [9] |
|
| [10] |
|
| [11] |
|
| [12] |
|
| [13] |
|
| [14] |
|
| [15] |
|
| [16] |
|
| [17] |
National Soil Survey Office (NSSO), 1995. 1:1,000,000 Soil Mapping of China. Xi’an: Geological Publishing House. (in Chinese)
|
| [18] |
|
| [19] |
|
| [20] |
|
| [21] |
|
| [22] |
|
| [23] |
|
| [24] |
|
| [25] |
|
| [26] |
|
| [27] |
|
| [28] |
|
| [29] |
|
| [30] |
|
| [31] |
|
| [32] |
|
| [33] |
|
| [34] |
|
| [35] |
|
| [36] |
|
| [37] |
|
| [38] |
|
| [39] |
|
| [40] |
|
| [41] |
|
| [42] |
|
| [43] |
|
| [44] |
|
| [45] |
|
/
| 〈 |
|
〉 |