Research Articles

Quantitative attribution analysis of soil erosion in different geomorphological types in karst areas: Based on the geodetector method

  • WANG Huan , 1, 2 ,
  • GAO Jiangbo , 1, * ,
  • HOU Wenjuan 1
Expand
  • 1. Key Laboratory of Land Surface Pattern and Simulation, Institute of Geographic Sciences and Natural Resources Research, CAS, Beijing 100101, China
  • 2. University of Chinese Academy of Sciences, Beijing 100049, China
* Corresponding author: Gao Jiangbo, PhD, E-mail:

Author: Huan Wang (1993-), Master Candidate, specialized in the research of karst ecosystem services. E-mail:

Received date: 2018-08-19

  Accepted date: 2018-10-20

  Online published: 2019-02-25

Supported by

National Basic Research Program of China, No.2015CB452702

National Natural Science Foundation of China, No.41671098, No.41530749

Copyright

Journal of Geographical Sciences, All Rights Reserved

Abstract

The formation mechanism and influencing factors identification of soil erosion are the core and frontier issues of current research. However, studies on the multi-factor synthesis are still relatively lacked. In this study, the simulation of soil erosion and its quantitative attribution analysis have been conducted in different geomorphological types in a typical karst basin based on the RUSLE model and the geodetector method. The influencing factors, such as land use type, slope, rainfall, elevation, lithology and vegetation cover, have been taken into consideration. Results show that the strength of association between the six influencing factors and soil erosion was notably different in diverse geomorphological types. Land use type and slope were the dominant factors of soil erosion in the Sancha River Basin, especially for land use type whose power of determinant (q value) for soil erosion was much higher than other factors. The q value of slope declined with the increase of relief in mountainous areas, namely it was ranked as follows: middle elevation hill> small relief mountain> middle relief mountain. Multi-factors interactions were proven to significantly strengthen soil erosion, particularly for the combination of land use type with slope, which can explain 70% of soil erosion distribution. It can be found that soil erosion in the same land use type with different slopes (such as dry land with slopes of 5° and above 25°) or in the diverse land use types with the same slope (such as dry land and forest with a slope of 5°), varied much. These indicate that prohibiting steep slope cultivation and Grain for Green Project are reasonable measures to control soil erosion in karst areas. Based on statistics of soil erosion difference between diverse stratifications of each influencing factor, results of risk detector suggest that the amount of stratification combinations with significant difference accounted for 55% at least in small relief mountain and middle relief mountainous areas. Therefore, the spatial heterogeneity of soil erosion and its influencing factors in different geomorphological types should be investigated to control karst soil loss more effectively.

Cite this article

WANG Huan , GAO Jiangbo , HOU Wenjuan . Quantitative attribution analysis of soil erosion in different geomorphological types in karst areas: Based on the geodetector method[J]. Journal of Geographical Sciences, 2019 , 29(2) : 271 -286 . DOI: 10.1007/s11442-019-1596-z

1 Introduction

China is one of the countries with the most severe soil erosion problems in the world, with 37% of its land suffering from water and wind erosion (Li et al., 2008). In China, most severe water erosion occurs in its southwestern karst region, where soil erosion has become the leading factor hampering regional development (Dai et al., 2018). The unique dual aboveground/belowground hydrological structure (Yan et al., 2018), a humid climate and a carbonate basement are the internal causes for soil erosion in China’s karst region, and poorly managed human activity is the external driving force. Land reclamation from forests, grassland destruction and slope cultivation exacerbate soil erosion, and topsoil loss leads to more serious rocky desertification problems (Wang et al., 2004; Zhang et al., 2013b; Hou et al., 2016), which in turn result in land degradation, frequent droughts and floods and near ecosystem collapse (Gutierrez et al., 2014; Peng et al., 2018). A scientific understanding and quantitative assessment of the effects of geographic environmental factors, human activity and their combination on soil erosion is of vital importance for curbing soil erosion and advancing the restoration of ecosystems that have suffered from rocky desertification in China’s karst region.
Researchers in China and elsewhere have attached great importance to the high ecosystem vulnerability, unique hydrogeologic structure and rocky desertification problems in China’s karst region and have conducted a number of studies focusing on soil erosion in this region. Wang et al. (2013), for purposes of identifying the driving factors of karst soil erosion, examined the relationships between land use and vegetation coverage and soil erosion in the Wujiang River Basin in Guizhou. They noted that dry land suffered from the most severe soil erosion and that converting slope farmland to terraced farmland could effectively prevent soil erosion (Xu and Shao, 2006). Zhang et al. (2007) noted that vegetation destruction and land reclamation and cultivation tended to aggravate subsurface soil leakage loss from slopes underlain primarily by carbonate rocks. Xiong et al. (2012) concluded that the local geology and geomorphology are the factors controlling the conservation and development of vulnerable ecosystems that have suffered from rocky desertification and determine the structure and operational pattern of karst ecosystems. In a quantitative study for estimating the amount of soil erosion, Bai et al. (2013) used cesium-137 (137Cs) and excess lead-210 (210Pbex) to analyze the response of soil erosion to land-use changes in a karst basin and found that net soil erosion rates increased significantly after 1979 when deforestation occurred. Feng et al. (2016) simulated soil erosion in karst basins in Guangxi using the revised universal soil loss equation (RUSLE) model and the 137Cs tracing method. When considering changes in both land use and precipitation, they found relatively good agreement between the results obtained using the two methods. However, due to the discontinuous nature of surface runoff in the karst areas, they found that determining the slope length (L) factor in the RUSLE model requires a high resolution digital elevation model (DEM). Based on a slope runoff plot experiment, Peng and Wang (2012) found that different precipitation mechanisms and land-use patterns affected soil erosion and surface runoff considerably differently.
Although these studies focused on the effects of geographic environmental factors and human activity on soil erosion, there is still a lack of studies that comprehensively compare factors and combinations of variables. In addition, most studies used correlation or regression analysis and focused little on quantitative analysis of multi-factors and their interactions. In fact, conventional statistical or spatial analyses are poorly suited for quantifying the factors affecting soil erosion. In comparison, the geodetector method can reveal the driving force behind a geographic phenomenon by detecting its spatial stratified heterogeneity. This method has been extensively used in the social sciences (Zhan et al., 2015; Li et al., 2017) and human health research (Hu et al., 2011) and is being popularized in natural (Luo et al., 2016) and environmental (Tong et al., 2014) sciences. Its core assumption is that if a certain independent variable has a significant impact on a certain dependable variable, then there is relatively good agreement between the spatial distribution patterns of the independent and dependent variables (Wang and Xu, 2017). Therefore, in this study, we conducted a multi-factor attribution analysis of soil erosion in a karst basin using the geodetector method, with the spatial distribution of geomorphological types as the macroscopic background. The goal was to distinguish the dominant factors affecting soil erosion in areas of various geomorphological types and their interactions and thus provide a scientific basis for formulating ecological controls and environmental protection policies in karst regions.

2 Data and methods

2.1 Study area

The Sancha River Basin, a typical karst peak cluster-depression basin in northwestern Guizhou province, was selected as the study area. Situated in the southwestern Wujiang River Basin in Guizhou (Figure 1), the Sancha River Basin encompasses an area of 4,860 km2. The Sancha River, 325.6 km in length, is a primary tributary of the Wujiang River. The bedrock underlying the study area consists mainly of carbonate rocks and a small amount of insoluble rocks. Due to the dual aboveground/belowground structure formed by karstification, an aboveground river network is absent, however there is a well-developed belowground river network in the Sancha River Basin. Most of the karst landform develops vertically, resulting in large areas of steep slopes (Cai et al., 2015) and favorable conditions for soil erosion. The soil layers in the study area are thin with slow formation process, poor ecologic and physical properties, and a lack of layer of semi-weathered parent material. Adhesion between the soils and rocks is relatively weak, and there is a distinct soft/hard interface between the soils and rocks. As a result, the study area is prone to soil erosion and sliding of soil blocks (Cai et al., 2015). The Sancha River Basin has a subtropical monsoon climate with abundant precipitation (annual average of approx. 1100 mm), most of which falls between May and October and rainstorm is common. The study area lacks a variety of plant communities, and the forests perform relatively weakly in terms of ecologic functions. The local karst topography has a fragmented surface with scattered farmland on it and is densely populated. Man-land conflicts are thus prominent in karst areas. Poorly managed local land-use patterns have resulted in severe soil erosion.
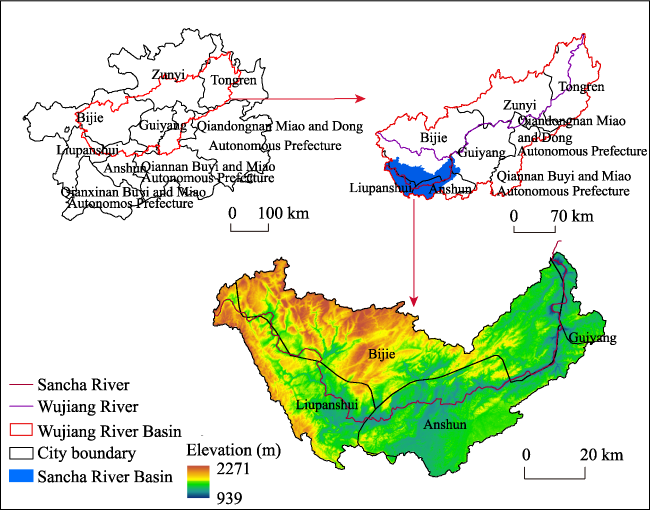
Figure 1 Location of the Sancha River Basin, Guizhou province, China

2.2 Data sources and processing

The data required for soil erosion calculation based on the RUSLE model include: high resolution (9 m) DEM data (Google Earth) due to the sensibility of topographic factor to the resolution of DEM data; two Landsat-8 images (30 m) in 2010 (https://glovis.usgs.gov) were used to interpret land use data based on field fixed collecting points (Figure 2c) and with supervision classification method under ENVI software, and the Kappa coefficient was 0.81. Soil data with physical properties (1-km resolution) was acquired from the Harmonized World Database version 1.1 established by the Food and Agriculture Organization of the United Nations and the International Institute for Applied System Analysis; precipitation data of 28 meteorological stations in the Sancha River Basin and its surrounding areas in 2010 (National Meteorological Information Center, http://data.cma.cn) were interpolated to obtain the raster date using the ANUSPLIN software (Hutchinson, 2002); according to the research of Zhou et al. (2009), there are five geomorphological types in the study area (Figure 2a), including small relief mountain, middle relief mountain, middle elevation plain, middle elevation hill and middle elevation terrace, the data were collected from Data Center for Resources and Environmental Sciences, Chinese Academy of Sciences (http://www.resdc.cn). Quantitative attribution analysis of soil erosion of the five different geomorphological types have been done to detect the dominant factors, the following factors were used in this study: lithology (http://www.resdc.cn) (Figure 2b), land use type (Figure 2c), slope (Figure 2d), rainfall (Figure 2e), vegetation coverage (250-m, https://glovis. usgs.gov) (Figure 2f), and elevation (Figure 1).
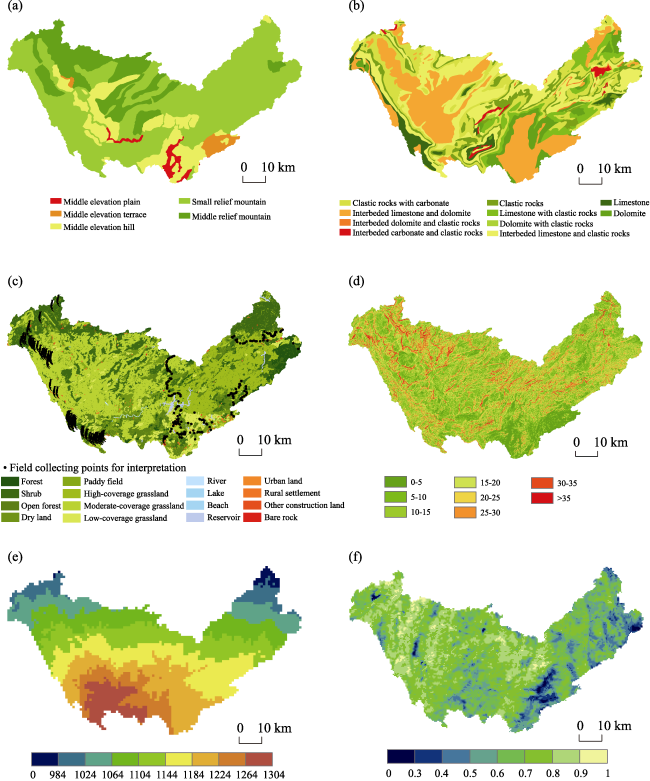
Figure 2 Geomorphological types in the Sancha River Basin (a) and influencing factors of soil erosion (b. lithology; c. land use type; d. slope; e. rainfall; f. vegetation coverage)

2.3 Methods

2.3.1 RUSLE model
Under the background of land degradation and serious soil erosion, traditional soil erosion research method, such as runoff plot method and artificial rainfall experiment, cannot obtain soil erosion data timely at a basin scale. Relying on basic research for ecological management could lead to the lag of soil and water conservation measures (Zeng et al., 2017), thus model simulation methods are gradually favored. Among them, the RUSLE model (Renard et al., 1997) is one of the most popular models in the world, which not only makes up for the limitations of field observations in large-scale applications, but also is suitable for multi-scale simulation studies (Wang et al., 2013; Feng et al., 2016). Satisfying results of different scale simulations have been obtained. The mathematical expression is as follows:
$A=R\times K\times LS\times C\times P$ (1)
where A is annual soil erosion rate (t ha-1a-1), R is rainfall erosivity factor (MJ mm ha-1h-1a-1), K is erodibility factor (t ha h MJ-1mm-1ha-1), LS is topographic factor, C is vegetation cover and management factor, and P is the conservation and supporting factor.
The R factor reflects the effect of rainfall characteristics impacting on soil erosion, such as rainfall intensity and amount. The equation proposed by Wischmeier and modified by Arnoldus (1980) was used in this study to simulate rainfall erosivity factor. The equation is as follows:
$R=\sum\limits_{i=1}^{12}{\left( 1.735\times {{10}^{1.5\times \log \frac{p{{i}^{2}}}{p}-0.8188}} \right)}$ (2)
where pi and p represent monthly mean and annual mean rainfall, respectively, i=1,2,…, 12, representing month.
K is erodibility factor, a function of soil properties. The method of the erosion-productivity impact calculator (EPIC) proposed by Williams et al. (1989) was used to calculate the K factor in this study:
$\begin{align} & K=\left\{ 0.2+0.3{{e}^{\left[ -0.0256{{W}_{d}}\left( 1-{{W}_{i}}/100 \right) \right]}} \right\}\times {{\left( \frac{{{W}_{i}}}{{{W}_{i}}+{{W}_{t}}} \right)}^{0.3}}\times \left[ 1-\frac{0.25{{W}_{c}}}{{{W}_{c}}+{{e}^{\left( 3.72-2.95{{W}_{c}} \right)}}} \right] \\ & \text{ }\times \left[ 1-\frac{0.7{{W}_{n}}}{{{W}_{n}}+{{e}^{\left( -5.51+22.9{{W}_{n}} \right)}}} \right] \\ \end{align}$ (3)
${{W}_{n}}=1-\frac{{{W}_{d}}}{100}$ (4)
where Wd is sand fraction (%), Wi is silt fraction (%), Wt is clay fraction (%), and Wc is content of soil organic carbon (%).
Due to the dual hydrological structure, the LS factor was sensitive to the RUSLE model, high resolution DEM data were used in this study. The S factor was calculated based on the equation proposed by McCool et al. (1987). The L factor was computed with the equation which was first proposed by McCool et al. (1989) and modified by Zhang et al. (2013a). The equations are as follows:
$S=10.8\times \sin \theta +0.03\text{ }\left( \theta <9\%\text{, }\lambda >4.\text{6 m} \right)$ (5)
$S=16.8\times \sin \theta -0.50\text{ }\left( \theta \ge 9\%\text{, }\lambda >4.\text{6 m} \right)$ (6)
$S=3.0\times {{(\sin \theta )}^{0.8}}+0.56\text{ }\left( \lambda \le 4.\text{6 m} \right)$ (7)
$L={{\left( \frac{\lambda }{22.13} \right)}^{\alpha }}$ (8)
$\alpha =\left( \frac{\beta }{\beta +1} \right)$ (9)
$\beta =\frac{\sin \theta }{3\times {{(\sin \theta )}^{0.8}}+0.56}$ (10)
where θ is slope, λ is slope length, α is variable length-slope exponent, and β is a factor relative to slope gradient.
The calculation of C and P factors has not formed a unified standard. Previous research (Xu and Shao, 2006; Feng et al., 2016) in karst areas has been referred in this study (Table 1).
Table 1 C and P value
Land use type Paddy field Dry land Forest Open forest Shrub Grassland Water Construction land Bare rock
C value 0.1 0.22 0.006 0.01 0.01 0.04 0 0 0
P value 0.15 0.4 1 1 1 1 0 0 0
The factors in the RUSLE model differed in terms of data source and resolution. Therefore, data normalization was needed. In ArcGIS 10.2, the spatial resolution and projected coordinates of the factors in the RUSLE model were normalized to 30 m and to the Albers_conic equal-area projection, respectively. The spatial resolution of the land-use data used in this study was 30 m, which was used as a reference resolution. The 9-m slope length and steepness (LS) factor was upscaled to 30 m. Because the local precipitation varies insignificantly within a range of 1 km, particularly on annual and monthly scales, downscaling the interpolated 1-km precipitation data to 30 m was appropriate. Since the soil types varied a little within a range of 1 km and the value of soil erodibility (K) factor was relatively low, we downscaled the soil type data to 30 m, which did not affect the accuracy.
2.3.2 Geodetector method
The geodetector is a method to reveal the driving force of an event by detecting the spatial stratified heterogeneity of the variables which means that the sum of the variance in each layer is smaller than the total variance of the whole region, the heterogeneity was measured by the q value (Wang and Xu, 2017). The method is mainly applied to the identification and mechanism of the influencing factors of spatial heterogeneity (Li et al., 2017). The influencing factor needs to be categorical variables, which was important for the detection of influencing factors for soil erosion. The geodetector contains four modules: factor detector, risk detector, interaction detector and ecological detector.
Factor detector detects the spatial heterogeneity of dependent variable and the power of determinant of the independent variables on the dependent variable, the value is measured by the q value (Wang et al., 2010).
$q=1-\frac{\sum\limits_{h=1}^{L}{{{N}_{h}}{{\sigma }_{h}}^{2}}}{N{{\sigma }^{2}}}=1-\frac{SSW}{SST}$ (11)
$SSW=\sum\limits_{h=1}^{L}{{{N}_{h}}}{{\sigma }_{h}}^{2}\ \ \ SST=N{{\sigma }^{2}}$ (12)
where h=1, ..., L is the layer of independent variable X, Nh and N are the number of sample units in layer h and the total region, respectively. ${{\sigma }_{h}}^{2}$ and ${{\sigma }^{2}}$ are the variance in the h layer and the variance in the region. SSW means the sum of spatial variance of each layer, SST means total variance of Y in the region, L means the layer number of factor X. The q value lies in [0, 1]. If factor X completely controls the soil erosion, the q value equals to 1; if the factor X is completely unrelated to Y, the q value equals to 0.
Ecological detector compares whether the influence of factors impacting on soil erosion is significantly different or not by using the F-test (Wang and Xu, 2017); the interaction detector is the preponderance of geodetector method compared to other statistical methods, which can identify the interacting form by comparing the q values of single factor and the interaction q values. The assumption for interaction detector was different from the traditional statistical methods, such as the multiplication of logistic regression hypotheses, but as long as interaction exists, it can be detected, the interaction types can be seen in Table 2; the risk detector can determine whether there is a significant difference in soil erosion between the layers of the impact factor and identify the areas of high risk of soil erosion.
Table 2 Types of interaction between two covariates
Description Interaction
q(X1∩X2)<Min(q(X1), q(X2)) Weakened, nonlinear
Min(q(X1), q(X2))<q(X1∩X2)<Max(q(X1), q(X2)) Weakened, single factor nonlinear
q(X1∩X2)>Max(q(X1), q(X2)) Enhanced, double factors
q(X1∩X2)=q(X1) + q(X2) Independent
q(X1∩X2)>q(X1) + q(X2) Enhanced, nonlinear
The input variables for the geodetector model needed to be converted to categorical variable. Thus, continuous variables needed to be discretized. The land use type, lithological type and geomorphological data were classified according to their original categories. Based on the data discretization method proposed by Wang and Xu (2017) and priori knowledge, the vegetation coverage was assigned to eight ranges: <0.3, 0.3-0.4, 0.4-0.5, 0.5-0.6, 0.6-0.7, 0.7-0.8, 0.8-0.9, and 0.9-1. Precipitation and elevation data were divided into nine equal intervals. Slope gradients were assigned to eight categories: <5°, 5°-10°, 10°-15°, 15°-20°, 20°-25°, 25°-30°, 30°-35°, and >35°. The Fishnet tool in ArcGIS 10.2 was used to extract the raster data to points. The sampling interval was set to 500 m. A total of 19,686 points were extracted and used as the operating data for the geodetector. For areas of different geomorphological types, a uniform method was used to stratify the factors affecting soil erosion to ensure that their effects on erosion were examined under the same spatial stratification conditions, thereby ensuring the comparability of results for areas of different geomorphological types.

3 Results and analysis

3.1 Statistics of soil erosion and geographic environmental factors for various geomorphological types

In 2010, the soil erosion rates in the Sancha River Basin ranged from 0 to 124.44 t ha‒1a‒1, with an average of 11.37 t ha‒1a‒1. These rates were in relatively good agreement with those in karst peak cluster-depression areas in Guangxi determined by Feng et al. (2016) using the 137Cs method. In addition, Zeng et al. (2017) simulated soil erosion in Yinjiang County, Guizhou Province, using the RUSLE model and reported a soil erosion rate in 2013 of 18.84 t ha‒1a‒1. Febles-Gonzalez et al. (2012) simulated soil erosion in the karst regions of Havana, Cuba, and reported erosion rates of 12.3 to 13.7 t ha‒1a‒1, which were relatively close to the soil erosion simulation results obtained in this study. Soil erosion in the Sancha River Basin displayed spatial heterogeneity (Figure 3) and was more severe in the upper and middle reaches than the lower reaches. As shown in Table 3, the geographic environmental factors in various geomorphology distribution areas were also spatially heterogeneous. Mountainous and hilly areas had a relatively high average slope gradient, whereas plain and terrace areas had a relatively low slope gradient. The average elevation of middle relief mountainous areas was significantly higher than that of other areas, whereas the opposite relationship was observed for precipitation. Farmland was mainly concentrated in small- and middle-relief mountainous areas and middle elevation hilly areas. Slope farmland was mainly distributed in small- and middle-relief mountainous and middle elevation hilly areas. The average amount of soil erosion varied significantly between areas of different geomorphological types. Due to the influence of slope gradients, precipitation and human activities, middle elevation hill had the highest average soil erosion rate, followed by small relief mountainous and middle elevation terrace had the lowest soil erosion rate.
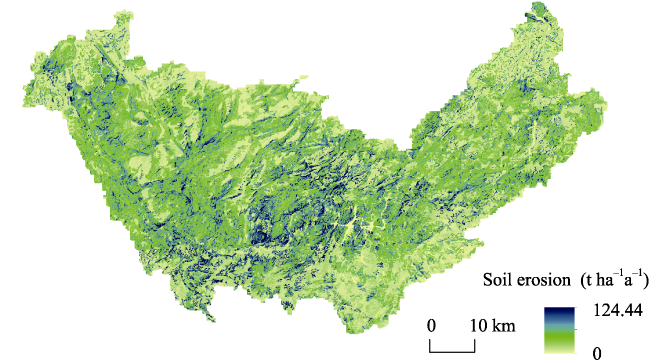
Figure 3 The spatial distribution of soil erosion in the Sancha River Basin in 2010
Table 3 Soil erosion and geographic environmental factors in different geomorphological types
Soil erosion
(t ha-1 a-1)
Slope
(°)
Rainfall
(mm)
Elevation
(m)
Area of dry land (km2) Area of steep slopes (km2) Total area (km2)
Middle elevation plain 8.32 4.80 1233.82 1256.51 17.54 0.06 98.30
Middle elevation terrace 6.49 3.97 1172.98 1445.74 19.92 0.02 99.64
Middle elevation hill 12.62 11.00 1199.28 1383.46 159.60 3.41 717.72
Small relief mountain 11.87 14.91 1136.88 1482.15 656.15 51.67 3016.14
Middle relief mountain 10.22 16.34 1096.33 1775.38 189.62 23.70 928.89

3.2 Geodetector-based quantitative attribution analysis of soil erosion in different geomorphological types

3.2.1 Significance analysis of factors affecting soil erosion
The results of the factor detector show that the dominant factor affecting soil erosion and its power of determinant varied significantly between areas of different geomorphological types (Table 4). The significance of the effects of influencing factors was affected by the internal characteristics of different geomorphological types. For example, elevation had an insignificant explanatory power for soil erosion in middle elevation terrace but had an explanatory power regarding soil erosion as high as 19.3% in middle relief mountain. Land use type had a significantly higher explanatory power for the spatial distribution of soil erosion (over 51% in areas of various geomorphological types and as high as 68.5% in middle elevation terrace areas) than other influencing factors. The following patterns were observed for the explanatory power of slope for soil erosion. The explanatory power of slope gradient for soil erosion decreased as the relief increased in mountainous and hilly areas, whereas an opposite pattern was observed for relatively flat areas. Specifically, for mountainous and hilly areas, the value of the q-statistic for middle elevation hilly areas was the highest, followed by that for small relief mountainous areas and that for middle relief mountainous areas; for relatively flat areas (plain and terrace areas), the value of the q-statistic for middle elevation terrace areas was higher than that for middle elevation plain areas. The explanatory power of precipitation for soil erosion differed considerably between areas of different geomorphological types. The ecological detector shows that the effects of land use on the spatial distribution of soil erosion in middle elevation plain and terrace areas differed significantly from those of other factors. The effects of land use and slope gradient on soil erosion in middle elevation hilly areas and small relief mountainous areas differed significantly from those of other factors. The effects of land use and elevation on soil erosion in middle relief mountainous areas differed considerably from those of other factors.
Table 4 The q values of influencing factors in different geomorphological types
Land use Slope Rainfall Lithology VC Elevation
Middle elevation plain 0.622 0.082 0.091 - - 0.028
Middle elevation terrace 0.685 0.086 0.037 - - -
Middle elevation hill 0.513 0.126 0.010 0.031 0.059 0.010
Small relief mountain 0.567 0.071 0.051 0.01 0.005 0.013
Middle relief mountain 0.620 0.062 0.089 0.037 0.005 0.193

Note: “-” means the q value did not pass the significance test; “VC” means vegetation coverage.

3.2.2 Analysis of interactions between factors affecting soil erosion
The interaction detector results show that the interaction between any two influencing factors enhanced their explanatory powers of soil erosion in the five geomorphological types. The dominant interaction differed between areas of different geomorphological types. Table 5 summarized the interactions with the three highest explanatory powers. The interaction between land use type and slope gradient has the highest explanatory power (>70%) and is a significant factor controlling soil erosion in areas of all the geomorphological types, except for middle elevation plain areas. This means that soil erosion varied significantly between areas of the same land use type but different slope gradients or areas of the same slope gradient but different land use types. For example, the soil erosion rate differed significantly between a 25° slope farmland area and a 5° slope farmland area or between a 25° slope farmland area and a 25° slope forestland area. Due to relatively low intensity slope cultivation and reasonable land-use patterns (Table 3), the explanatory power of the combination of land use type and slope gradient for soil erosion in middle elevation plain areas was slightly lower but was still as high as 67.1%. In comparison, the combination of land use type and precipitation can explain 71% of the spatial distribution of soil erosion in middle elevation plain areas. The interactions involving the second and third highest explanatory powers for soil erosion in areas of different geomorphological types were those between land use type and other influencing factors, but these interactions varied between areas of different geomorphological types (Table 5). Moreover, the combination of slope gradient and precipitation can significantly nonlinearly increase the explanatory power of each single factor. The explanatory power of the combination of slope gradient and precipitation ranged from 13.8% to 21.3% in the five geomorphological types.
Table 5 The dominant interactions between two covariates in different geomorphological types
Geomorphology Middle elevation plain Middle elevation terrace Middle elevation hill Small relief mountain Middle relief mountain
Interaction 1 Land use∩rainfall Land use∩slope Land use∩slope Land use∩slope Land use∩slope
q 0.710 0.764 0.726 0.707 0.742
Interaction 2 Land use∩VC Land use∩VC Land use∩
elevation
Land use∩
rainfall
Land use∩
rainfall
q 0.695 0.720 0.567 0.648 0.679
Interaction 3 Land use∩
lithology
Land use∩
rainfall
Land use∩
rainfall
Land use∩
lithology
Land use∩elevation
q 0.682 0.708 0.566 0.586 0.665

“VC” means vegetation coverage.

3.2.3 Identification of areas at high risk of soil erosion and determination of the difference in soil erosion between strata of each influencing factor
The factor and interaction detectors show that influencing factors and their combinations had different explanatory powers regarding the spatial distribution of soil erosion. By running the risk detector module, the spatial distribution of soil erosion can be detected, areas at high risk of soil erosion (confidence level: 95%) (Table 6) can be identified, and whether the difference in soil erosion rate between strata of each influencing factor is significant can be determined. On this basis, the percentage of the number of stratified combinations that differed significantly can be determined (Table 7). Areas at high risk of soil erosion varied significantly between areas of different geomorphological types (Table 6). In small relief mountainous areas, the soil erosion rate increased as the slope gradient increased. In areas of the other four geomorphological types, there was an inflection point in the relationship between slope gradient and soil erosion rate (i.e., the high-risk slope areas shown in Table 6). Dry land suffered from the most severe soil erosion; however, the average soil erosion rate varied between different geomorphological types. The variation in the soil erosion rate in the Sancha River Basin as a function of vegetation coverage differed from that in other regions, and there was a critical value of vegetation coverage. When the vegetation coverage was lower than this critical value, the soil erosion rate increased as the vegetation coverage increased; when the vegetation coverage was higher than this critical value, the soil erosion rate decreased as the vegetation coverage increased. Geologic conditions provided the background conditions for soil erosion to occur. Soil erosion rates of different lithological types are related to the climate, terrain and anthropogenic factors. The lithology with most serious soil erosion varied between different geomorphological types. There was no significant positive or negative correlation between elevation and the spatial distribution of soil erosion. In addition, the elevation ranged in which the highest soil erosion rate occurred also varied. The percentage of the number of combinations with significant differences in soil erosion rates between strata of each influencing factor varied considerably between different geomorphological types (Table 7). The difference between strata of land use was the largest (significant difference accounted for over 90%) between areas of different geomorphological types. The difference between strata of slope gradient in areas with a relatively high average slope gradient (e.g., small- and middle-relief mountainous areas and middle elevation hilly areas) was larger than that in areas with a relatively low average slope gradient (e.g., middle elevation plain and terrace areas). The difference between strata of precipitation and elevation reached 100% in middle elevation plain areas and was larger in small- and middle-relief mountainous areas than middle elevation hilly and terrace areas. The difference between strata of lithology and vegetation coverage was relatively low.
Table 6 High risk areas of soil erosion and its mean value (t ha‒1 a‒1) in different geomorphological types
Middle elevation plain Middle elevation terrace Middle elevation hill Small relief mountain Middle relief mountain
Slope (°) 20-25 15-20 30-35 >35 25-30
Mean value 19.9 19.02 24.38 22.28 14.41
Land use Dry land Dry land Dry land Dry land Dry land
Mean value 22.6 15.36 23.43 24.36 21.9
VC 0.5-0.6 <0.3 0.8-0.9 0.9-1 0.5-0.6
Mean value 9.35 10.02 14.5 14.17 10.7
Lithology Interbedded limestone and clastic rocks Limestone with clastic rocks Clastic rocks Dolomite with
clastic rocks
Dolomite
Mean value 13.93 9.49 19.52 15.59 20.07
Elevation (m) 1087-1235 1531-1679 1383-1531 1383-1531 1235-1383
Mean value 11.1 13.13 12.15 12.44 15.84

“VC” means vegetation coverage

Table 7 The percentage of stratification combinations with significant difference in each influencing factor (%)
Middle elevation plain Middle elevation terrace Middle elevation hill Small relief mountain Middle relief mountain
Land use 90.91 100.00 92.86 100.00 93.33
Slope 40.00 16.67 78.57 92.86 85.71
Rainfall 100.00 33.33 33.33 91.67 78.57
Elevation 100.00 0.00 42.86 69.44 75.00
Lithology 0.00 0.00 60.00 64.44 55.56
VC 33.33 35.71 75.00 60.71 60.71

“VC” means vegetation coverage

4 Discussion

The geomorphological types macroscopically control the occurrence and development of surface processes. As a type of surface process, soil erosion displays significantly different characteristics in different geomorphological types. Land use type was the most significant factor. The explanatory power of the slope gradient regarding soil erosion was significantly higher in relatively flat areas (e.g., middle elevation plain, hilly and terrace areas) than in areas of higher relief (e.g., small- and middle-relief mountainous areas). This pattern caused by that relatively steep areas have complex terrain and large climate variations and are ecologically vulnerable, and factors affecting soil erosion in these areas are more complex. Consequently, the slope gradient had a lower spatial explanatory power regarding soil erosion in these areas. Compared to the other four geomorphological types, elevation has the highest explanatory power regarding soil erosion in middle relief mountainous areas. This pattern existed because middle relief mountainous areas were characterized by large internal height differences and notable vertical variations of vegetation, and consequently, elevation stratification can reflect the comprehensive difference in vegetation, climate and terrain. The effects of lithology and vegetation coverage on soil erosion were insignificant in middle elevation plain and terrace areas. Although these factors significantly affected the occurrence of soil erosion on a slope scale, their controlling effects on soil erosion in areas of specific geomorphological types were insignificant.
Due to the complexity of geographic processes, controlling factors often do not act independently but instead act collectively. The extent to which the effects of controlling factors combined remains an unresolved issue. This study examined the interaction between any two of the factors affecting soil erosion using the geodetector method to determine its pattern. The results show that the interaction between slope gradient and land use type had an explanatory power regarding soil erosion as high as over 67% in areas of each geomorphological type. Wang et al. (2013) once noted that the effects of various land use types on soil erosion in the Wujiang River Basin differed significantly and the soil erosion rate increased significantly as the slope gradient increased. This finding agreed with the finding of this study: the interaction between slope gradient and land use type can significantly enhance their controlling effects on soil erosion. The results also demonstrated the necessity of returning farmland to forestland and prohibiting steep slope land farming. In addition, the combination of slope gradient and precipitation enhanced their explanatory powers regarding soil erosion. Slope gradient and precipitation are the necessary conditions and dynamic basis for soil erosion to occur. When falling on steep slopes, precipitation can easily lead to water erosion. The combination of slope gradient and lithology can also enhance their explanatory powers regarding soil erosion. Rock is the basic material of soil. Different lithologic backgrounds determined the characteristics of subsurface rock layers and topsoil. In a karst region, rocks were very slowly transformed to soil by weathering, soils were shallow and lacked a layer of parent material, and there was a notable soft/hard interface between soil masses and rocks (Cai et al., 2015). Thus, areas with a relatively high slope gradient were extremely prone to soil erosion due to gravity or other external forces.
Chen et al. (2014) noted that soil erosion rates in soil-rock hilly areas in southern China first increased and then decreased as the slope gradient increased and that the critical slope gradient at the inflection point was 15°-25°. A similar conclusion is derived from this study. The critical slope gradient was 20°-25° in middle elevation plain areas, 30°-35° in middle elevation hilly areas, 15°-20° in middle elevation terrace areas and 25°-30° in middle relief mountainous areas. Earlier work has indicated that the effects of vegetation coverage on soil erosion in the Wujiang River Basin involved a critical value (Wang et al., 2013). The results obtained in this study show that the critical vegetation coverage in middle relief mountainous and middle elevation plain areas was 0.5-0.6, caused by that areas with dense vegetation coverage often have a high slope gradient. In addition, the precipitation, lithology and slope gradient in areas at high risk of soil erosion varied significantly between areas of different geomorphological types. The difference in soil erosion rates between strata of each influencing factor varied significantly between areas of different geomorphological types. The difference between strata of land use type was the largest. The difference between strata of each of the other factors (e.g., slope gradient, precipitation, elevation, lithology, and vegetation coverage) varied. Therefore, it is necessary to formulate policies and select key soil erosion control areas based on local conditions and comprehensive consideration of the spatial distribution of soil erosion and the difference between strata of each influencing factor in areas of different geomorphological types.
Researchers in China and elsewhere have studied soil erosion on various scales using various methods. The poor comparability of their results was unfavorable for result validation. Of the numerous methods, the capability of the RUSLE model, the most popular empirical equation used in China and elsewhere, for large-scale erosion simulation has been generally recognized. In this study, considering factors (e.g., outcropping bedrocks and effective slope length) unique to karst regions, a 9-m DEM was selected for the RUSLE model, which significantly improved the simulation accuracy of the LS factor. However, there are still some limitations. The soil layers in some areas of the karst region are shallow. In areas that have suffered from severe rocky desertification, there is less erodible soil. The RUSLE model, to some extent, overestimated soil erosion in the Sancha River Basin. The RUSLE model correction based on soil thickness will be a focus of future research.

5 Conclusions

This study analyzed the dominant factors affecting the spatial distribution of soil erosion in areas of various geomorphological types and the degree of interaction between any two of these factors using the geodetector method, and identified areas at high risk of soil erosion and the difference in soil erosion rates between strata of each factor. The following conclusions were derived from the findings and can be used as a reference for soil erosion control.
(1) The six influencing factors selected in this study have different explanatory powers regarding soil erosion. Land use type has the highest explanatory power in areas of the five geomorphological types. The effects of influencing factors and their interactions on soil erosion varied between different geomorphological types.
(2) The interaction effect between two influencing factors can enhance their explanatory powers regarding soil erosion. The combination of land use type and slope gradient was most significant. Measures such as prohibiting slope farming and returning farmland to forestland can effectively prevent local soil erosion. The combination of slope gradient and precipitation significantly improved their explanatory powers regarding soil erosion. Therefore, necessary prevention and control measures should be implemented in steep areas where heavy precipitation may occur to reduce economic losses caused by disasters.
(3) To control soil erosion, it is necessary to comprehensively consider the macroscopic controlling effects of geomorphological types. According to the results of quantitative attribution analysis in this study, key soil erosion control areas were determined in areas of different geomorphological types. The followings were the key soil erosion control areas in small relief mountainous areas: steep slopes with a gradient steeper than 35°, areas between elevations of 1383 and 1531 m, dry land, and areas where dolomite with clastic rocks distributed. In middle relief mountainous areas: slopes with a gradient of 25°-30°, areas between elevations of 1235 and 1383 m, dry land, and areas where dolomite is distributed. In middle elevation plain areas: slopes with a gradient of 20°-25°, areas between elevations of 1087 m and 1235 m, dry land, and areas where interbedded limestone and clastic rocks are distributed. In middle elevation hilly areas: slopes with a gradient of 30°-35°, areas between elevations of 1383 and 1531 m, dry land, and areas where clastic rocks are distributed. In middle elevation terrace areas: slopes with a gradient of 15°-20°, areas between elevations of 1531 and 1679 m, dry land, and areas where limestone with clastic rocks is distributed.

The authors have declared that no competing interests exist.

[1]
Arnoldus H M J, 1980. An approximation of the rainfall factor in the universal soil loss equation. In: De Boodt M, Gabriels D. Assessment of Erosion. Chichester UK: Wiley, 127-132.The SIGMA 12p2/p-index, in which p is monthly rainfall and P is annual rainfall, provides a rapid way of approximating the rainfall factor value, although a minimum number of stations still need to be treated in greater detail.

[2]
Bai X, Zhang X, Long Y et al., 2013. Use of 137Cs and 210Pbex measurements on deposits in a karst depression to study the erosional response of a small karst catchment in southwest China to land-use change.Hydrological Processes, 27(6): 822-829.

DOI

[3]
Cai Y, Wan J, Wang Y et al., 2015. Study on Land Change in Guizhou Karst Plateau Mountain Area. Beijing: Science Press, 61-62. (in Chinese)

[4]
Chen S, Yang X, Xiao L et al., 2014. Study of soil erosion in the southern hillside area of China based on RUSLE model.Resources Science, 36(6): 1288-1297. (in Chinese)Soil erosion is a major ecological and environmental issue globally. As an important content of soil and water conservation, soil erosion by water is a primary cause of soil degradation and is significantly threatening the environment. Based on GIS and RUSLE models, we conducted quantitative research on the quantity and spatial distribution of soil erosion in four provinces(Hunan, Jiangxi, Zhejiang and Fujian) comprising the Southern Hillside Area. In addition,relationships between the distribution characteristics of soil erosion and influencing factors(e.g.slope and elevation) were analyzed. We found that the annual amount of soil erosion was 246million tons and the mean soil erosive modulus is 421.81t/km2. Soil and water conservation good across the study area, and only 13.41% of the soil erosion area has a higher degree of erosion.Spatially, soil erosion in Hunan and Jiangxi were characterized by a block distribution; soil erosion in Zhejiang and Fujian were characterized by a point distribution. Soil and water conservation in Hunan were worse than the other provinces. The degree of soil erosion in the study area was closely related to slope and elevation. At different levels of slope and elevation, the slight erosion had the largest area(more than 75% of the area of soil erosion). Otherwise, the area of intense erosion and higher degree erosion was small compared to the slight soil erosion degree(less than1.5% of the total). The slope 15~25 and elevation from 20~500m suffered the most intensive erosion.

[5]
Dai Q, Peng X, Wang P et al., 2018. Surface erosion and underground leakage of yellow soil on slopes in karst regions of southwest China.Land Degradation & Development, 29(8): 2438-2448.

[6]
Febles-Gonzalez J M, Vega-Carreno M B, Tolon-Becerra Aet al., 2012. Assessment of soil erosion in karst regions of Havana, Cuba.Land Degradation & Development, 23(5): 465-474.ABSTRACT Only recently have erosion models begun to be used in research work in Cuba, specifically the USLE and the thematic cartography of factors in a GIS framework without using a specific model. It therefore becomes necessary to include simulation models for karst regions that make possible an integral assessment of the specific types of soil erosion in those environments and take into consideration the effects of climate change in soil management systems. Morphometric analysis of karst doline absorption forms in regions of La Habana Province in 1986, 1997, and 2009 allowed the characterisation and application of the Morgan Morgan Finney (MMF) conceptual empirical erosion model in the Country for the first time. The results showed previously unreported losses of 12·3–13·765t of soil ha65 611 65y 611 , which surpasses the permissible erosion threshold. Furthermore, it clearly shows the unsustainable trend of Red Ferralitic and Ferrasol Rhodic (World Reference Base) soils use. The model applied considered the effects of extreme rainfall events associated with climate change in recent years. The results found have led to strategies for coping with future climate change in each scenario and have made it possible to evaluate the consequences. Copyright 08 2011 John Wiley & Sons, Ltd.

DOI

[7]
Feng T, Chen H, Polyakov V O et al., 2016. Soil erosion rates in two karst peak-cluster depression basins of northwest Guangxi, China: Comparison of the RUSLE model with 137Cs measurements.Geomorphology, 253: 217-224.Reliable estimation of erosion in karst areas is difficult because of the heterogeneous nature of infiltration and subsurface drainage. Understanding the processes involved is a key requirement for managing against karst rock desertification. This study used the revised Universal Soil Loss Equation (RUSLE) to estimate the annual soil erosion rates on hillslopes and compared them with Cs-137 budget in the depressions at two typical karst peak-cluster depression basins in northwest Guangxi, southwestern China. Runoff plots data were used to calibrate the slope length factor (L) of the RUSLE model by adjusting the accumulated area threshold. The RUSLE model was sensitive to the value of the threshold and required DEMs with 1 m resolution, due to the discontinuous nature of the overland flow. The average annual soil erosion rates on hillslopes simulated by the RUSLE were 0.22 and 0.10 Mg ha(-1) y(-1) 2006 through 2011 in the partially cultivated GZ1 and the undisturbed GZ2 basins, respectively. The corresponding deposition rates in the depressions agreed well with the Cs-137 records when recent changes in precipitation and land use were taken into consideration. The study suggests that attention should be given to the RUSLE-L factor when applying the RUSLE on karst hillslopes because of the discontinuous nature of runoff and significant underground seepage during storm events that effectively reduces the effects of slope length. (C) 2015 Elsevier B.V. All rights reserved.

DOI

[8]
Gutierrez F, Parise M, De Waele J et al., 2014. A review on natural and human-induced geohazards and impacts in karst.Earth-Science Reviews, 138: 61-88.Karst environments are characterized by distinctive landforms related to dissolution and a dominant subsurface drainage. The direct connection between the surface and the underlying high permeability aquifers makes karst aquifers extremely vulnerable to pollution. A high percentage of the world population depends on these water resources. Moreover, karst terrains, frequently underlain by cavernous carbonate and/or evaporite rocks, may be affected by severe ground instability problems. Impacts and hazards associated with karst are rapidly increasing as development expands upon these areas without proper planning taking into account the peculiarities of these environments. This has led to an escalation of karst-related environmental and engineering problems such as sinkholes, floods involving highly transmissive aquifers, and landslides developed on rocks weakened by karstification. The environmental fragility of karst settings, together with their endemic hazardous processes, have received an increasing attention from the scientific community in the last decades. Concurrently, the interest of planners and decision-makers on a safe and sustainable management of karst lands is also growing. This work reviews the main natural and human-induced hazards characteristic of karst environments, with specific focus on sinkholes, floods and slope movements, and summarizes the main outcomes reached by karst scientists regarding the assessment of environmental impacts and their mitigation.

DOI

[9]
Hou W, Gao J, Peng T et al., 2016. Review of ecosystem vulnerability studies in the karst region of southwest China based on a structure-function-habitat framework.Progress in Geography, 35(3): 320-330. (in Chinese)特殊的地质背景与生态环境叠加强烈的人类活动,导致中国西南喀斯特地区生态系统呈现显著的脆弱性特征.从生态系统敏感性和适应性角度出发,喀斯特生态系统结构、功能和生境对外界扰动响应的脆弱性特征研究已取得一定进展,尤其是借助物种多样性、生态系统生产力、土壤水分/养分等指标揭示了喀斯特生态系统对土地利用/覆被变化、石漠化等过程的敏感性等方面,但综合野外试验、数值模拟、数理统计等手段的生态系统敏感性定量化研究仍较薄弱.在生态系统适应性方面,虽然具有喜钙、耐旱以及石生等特性的植物种群通过形态结构和生理功能的自我调节能够呈现出对岩溶环境的适应性,但喀斯特生态系统对人类干扰和气候变化等环境胁迫响应的适应机制仍缺乏长期的生物及理化过程研究.今后,应针对生态系统结构、功能、生境间的正反馈机制,增强系统组分的耦合分析,加强喀斯特生态系统脆弱性驱动机制研究与定量评估,突出系统脆弱性在石漠化遏制和生态恢复重建中的关键地位.

DOI

[10]
Hu Y, Wang J, Li X et al., 2011. Geographical detector-based risk assessment of the under-five mortality in the 2008 Wenchuan earthquake, China. Plos One, 6(6): e21427.On 12 May, 2008, a devastating earthquake registering 8.0 on the Richter scale occurred in Sichuan Province, China, taking tens of thousands of lives and destroying the homes of millions of people. Many of the deceased were children, particular children less than five years old who were more vulnerable to such a huge disaster than the adult. In order to obtain information specifically relevant to further researches and future preventive measures, potential risk factors associated with earthquake-related child mortality need to be identified. We used four geographical detectors (risk detector, factor detector, ecological detector, and interaction detector) based on spatial variation analysis of some potential factors to assess their effects on the under-five mortality. It was found that three factors are responsible for child mortality: earthquake intensity, collapsed house, and slope. The study, despite some limitations, has important implications for both researchers and policy makers.

DOI PMID

[11]
Hutchinson M F, 2002. Anusplin Version 4.2 User Guide. Centre for resource and environment studies. Canberra: Austrilian National University.

[12]
Li J, Lu D, Xu C et al., 2017. Spatial heterogeneity and its changes of population on the two sides of Hu Line.Acta Geographica Sinica, 72(1): 148-160. (in Chinese)Hu Line uncovers one of China's most important characteristics of population paper distribution: East is dense, while west is sparse. Different from most previous research, this paper examined the differentiation and changes of population distribution on both sides of Hu Line from a perspective of spatial stratified heterogeneity instead. Geodetector was employed based on the spatial database of China's census data of 1953, 1982, 1990, 2000 and 2010 to reconfirm spatial position of Hu Line and analyzed changes of spatial stratified heterogeneity of population between southeast and northwest sides of Hu Line in different periods. Changes of population distribution since the founding of New China were found and the reasons for these changes were discussed. Major findings include:(1) From the spatial stratified heterogeneity perspective, Hu Line could be improved and optimized, at least, in some periods.Although the ratio of total population on both sides of Hu Line has roughly been kept at 94:6since 1953, spatial stratified heterogeneity of population between the two sides(the southeastern side: the northwestern side) increased when Hu Line moves to south slightly in1953, 2000 and 2010, which means population distribution was more homogeneous within either southeastern or northwestern region and heterogeneity was more remarkable between the two regions.(2) Heterogeneity decreased gradually since the reform and opening up. We found characteristics of population distribution converged on the two sides, especially since the 1990 s when convergence between the two sides became apparent. This finding is significantly different from the conclusion of "remain unchanged" from most literatures. The reasons why heterogeneity reduced were: pattern of population distribution on the southeastern side changed from relatively even distribution among cities before 1990 to agglomeration in a few huge cities after 2000, while the degree of spatial agglomeration of population decreased slightly after the reform on the northwestern side. These changes have been confirmed by the analysis from cumulative distribution function and Gini coefficient.(3) On the whole, the effect of economic factors on population distribution has become more and more important, while the effect of natural environment and institution reduced. Combined effect from economic development, natural environment and institution resulted in two opposite directions of changes of population spatial distribution on the two sides. It should be emphasized that although general effect of natural environment has decreased, some natural factors, such as Three Gradient Terrains, still have significantly influence on population distribution in China.

DOI

[13]
Li Z, Cao W, Liu B et al., 2008. Current status and developing trend of soil erosion in China.Science of Soil & Water Conservation, 6(1): 57-62. (in Chinese)Based on the third soil erosion survey data,this paper analyzes the present status of soil erosion,the status of water erosion,wind erosion and freeze-thaw erosion,and the soil erosion status in Eastern,Northeast,Middle and Western area,and the erosion risk situation in water erosion area was evaluated.Simultaneously,this paper analyzes the dynamic changes of soil erosion during 15 years,comparing with the first and second soil erosion survey data which were promulgated by Ministry of Water Resources,and the change of soil erosion amount in some river basins was analyzed.

[14]
Luo W, Jasiewicz J, Stepinski T et al., 2016. Spatial association between dissection density and environmental factors over the entire conterminous United States. Geophysical Research Letters, 43(2): 692-700.Previous studies of land dissection density (D) often find contradictory results regarding factors controlling its spatial variation. We hypothesize that the dominant controlling factors (and the interactions between them) vary from region to region due to differences in each region's local characteristics and geologic history. We test this hypothesis by applying a geographical detector method to eight physiographic divisions of the conterminous United States and identify the dominant factor(s) in each. The geographical detector method computes the power of determinant (q) that quantitatively measures the affinity between the factor considered and D. Results show that the factor (or factor combination) with the largest q value is different for physiographic regions with different characteristics and geologic histories. For example, lithology dominates in mountainous regions, curvature dominates in plains, and glaciation dominates in previously glaciated areas. The geographical detector method offers an objective framework for revealing factors controlling Earth surface processes.

DOI

[15]
McCool D K, Brown L C, Foster G Ret al., 1987. Revised slope steepness factor for the universal soil loss equation.Transactions of the Asae, 30(5): 1387-1396.ABSTRACT Areanalysis of historical and recent data from both natural and simulated rainfall soil erosion plots has resulted in new slope steepness relationships for the Universal Soil Loss Equation. For long slopes on which both interrill and rill erosion occur, the relationships consist of two linear segments with a breakpoint at 9% slope. These relationships predict less erosion than current relationships on slopes steeper than 9% and slopes flatter than about 1%. A separate equation is proposed for the slope effect on short slopes where only interrill erosion is present. For conditions where surface flow over thaw-weakened soil dominates the erosion process, two relationships with a breakpoint at 9% slope are presented.

DOI

[16]
McCool D K, Foster G R, Mutchler C Ket al., 1989. Revised slope length factor for the universal soil loss equation.Transactions of the ASAE, 32(5): 1571-1576.ABSTRACT An analysis based on theoretical considerations and data interpretation was used in developing revised relationships for the slope length exponent for the Universal Soil Loss Equation. The analysis was based on the ratio of rill to interrill erosion and resulted in a general relationship between the slope length exponent and slope steepness. Parameters in the relationship are changed depending upon whether the ratio of rill to interrill erosion is expected to be low, moderate or high. Such conditions might be representative of rangeland or no-till seeding, normal seedbed conditions or highly disturbed conditions, respectively. For thawing soil conditions where rill erosion is dominant, an exponent value of 0.5 is recommended..

DOI

[17]
Peng T, Wang S, 2012. Effects of land use, land cover and rainfall regimes on the surface runoff and soil loss on karst slopes in southwest China. Catena, 90(1): 53-62.78 Surface runoff and soil loss on the karst hill slopes were very small. 78 Runoff and soil loss were affected by land use, land cover and rainfall regimes. 78 Antecedent precipitation could promote runoff and soil loss on limestone slopes. 78 Due to the low soil formation rates, soil erosion risk was quite high.

DOI

[18]
Peng X, Dai Q, Li C et al., 2018. Role of underground fissure flow in near-surface rainfall-runoff process on a rock mantled slope in the karst rocky desertification area.Engineering Geology, 243: 10-17.Because of the complex near-surface double-layer geologic structure (i.e., surface and underground fissures) of slopes in karst regions, it is difficult to collect data on all flows, especially the flows generated in underground fissures. This lack of information leads to a poor understanding of the rainfall-runoff process associated with soil loss in karst landscapes. The goal of this study was to determine the output characteristics of surface, subsurface and underground fissure flows and their conversion relationships, as well as the role of underground fissure flow in the near-surface rainfall-runoff process, using rainfall experiments. The results revealed the following findings. ( ) Light rainfall intensities (15 and 30 m/h) generated subsurface lateral flow and underground fissure flow, whereas greater rainfall intensities generated surface runoff in addition to subsurface and underground flows. (ii) The runoff/drainage depths of all the above flows increased with increasing rainfall intensity, while the runoff/drainage coefficient exhibited no obvious regular change, except for the surface runoff. Moreover, the distribution ratio of surface runoff to total flow also increased with increasing rainfall intensity but decreased with increasing underground fissure degree, while the distribution ratio of underground fissure flow exhibited the opposite trend. (iii) Underground fissure flow, with distribution ratios of 27.8 78.0%, dominated the total flow yield. This study has significance for controlling soil erosion and water shortage in the karst rocky desertification region and also improves the understanding of the near-surface rainfall-runoff process in this region

DOI

[19]
Renard K G, Foster G R, Weesies G A et al., 1997. Predicting soil erosion by water: A guide to conservation planning with the revised universal soil loss equation (RUSLE). Agriculture handbook. USDA, Washington, DC.The book provides guidelines for the selection of the best control methods for farms, ranches and other erosion-prone areas throughout USA. The prediction of soil loss founded on the Universal Soil Loss Equation (USLE) is revised using information available on monthly precipitation and temperature, front-free period, annual rain erosivity, below ground biomass, canopy cover and height at 15 days intervals, and soil cover disturbances associated with farming operations. The information is available on CITY, CROP and OPERATION...

[20]
Tong L, Xu X, Fu Y et al., 2014. Impact of environmental factors on snail distribution using geographical detector model.Progress in Geography, 33(5): 625-635. (in Chinese)Schistosomiasis japonica is a parasitic disease that debilitates human bodies and greatly impedes socioeconomic progress in endemic areas.It was widespread in southern China several decades ago and the disease prevention effort of the Chinese government and researchers achieved remarkable results in reducing infections.However,in recent year,the epidemic situation has worsened due to a series of changes in the natural environment and socioeconomic conditions.As the only intermediate host of Schistosome,Oncomelania hupensis plays an important role in the spread of this disease and its control is critical for the prevention and control of Schistosome.Therefore,identifying the environmental factors that determine the distribution of the snail could help predict the distribution and extent of snail breeding sites,obtain a macroscopic view on snail spreading trend,and take effective measures to eliminate the snails.In this paper,we aim to determine key indictors that could be used in remote sensing monitoring of Oncomelania hupensis breeding extent and density.Hubei Province is one of the serious epidemic areas in China.Oncomelania hupensis here can be classified into three subtypes:the subtype inside embankments,subtype outside embankments,and subtype in hilly areas,according to the geographical environment of snail habitats.We take into account several environmental factors including elevation,nearest distance to river(water),land use,soil and vegetation to analyze their influence on snail distribution.Geographical Detector Model used in this research is based on spatial variation analysis of the geographical strata to assess the health risks in different environment.It contains four geographical detectors:factor detector identifies which factors are responsible for the risk;ecological detector compares the relative importance of risk factors;risk detector discloses where the high risk areas are;and interaction detector reveals whether the risk factors interact or lead to disease independently.The main procedures of our analysis are as follows:first,both snail statistics and environmental data are collected and preprocessed with ArcGIS Desktop software;then the environmental indicators that are strongly related to snail distribution are identified by the factor detector and ecological detector;finally,favorable(suitable) type or range of each indicator as well as the reference factors that indirectly influence the snails can be computed from the risk detector and interaction detector.It is found that for the subtype inside embankments,vegetation coverage of epidemic season(March to October),especially July to September,determines the extent of distribution,while high density areas are characterized by moderate silt content in soil texture,yellowish red soil and submerged paddy soil,high vegetation coverage in the first quarter of the year.The subtype outsider embankments distributed mainly at lake beaches with high vegetation coverage,while high vegetation coverage in the first quarter,reed and amur silver grass vegetation contributes to its abundance.In hilly areas,there is no clear indicator for the extent of distribution of the subtype due to the relatively complex environment,yet woodland and farmland close to river,waterlogged paddy soil as well as submerged paddy soil are strongly related to high dense of the snails.This result is consistent with previous studies.The result and method of this research could provide scientific reference for policy makers and researchers to take efficient measures to control snail prevalence.

DOI

[21]
Wang J, Li X, Christakos G et al., 2010. Geographical detectors-based health risk assessment and its application in the neural tube defects study of the Heshun region, China.International Journal of Geographical Information Science, 24(1): 107-127.Physical environment, man‐made pollution, nutrition and their mutual interactions can be major causes of human diseases. These disease determinants have distinct spatial distributions across geographical units, so that their adequate study involves the investigation of the associated geographical strata. We propose four geographical detectors based on spatial variation analysis of the geographical strata to assess the environmental risks of health: the risk detector indicates where the risk areas are; the factor detector identifies factors that are responsible for the risk; the ecological detector discloses relative importance between the factors; and the interaction detector reveals whether the risk factors interact or lead to disease independently. In a real‐world study, the primary physical environment (watershed, lithozone and soil) was found to strongly control the neural tube defects (NTD) occurrences in the Heshun region (China). Basic nutrition (food) was found to be more important than man‐made pollution (chemical fertilizer) in the control of the spatial NTD pattern. Ancient materials released from geological faults and subsequently spread along slopes dramatically increase the NTD risk. These findings constitute valuable input to disease intervention strategies in the region of interest.

DOI

[22]
Wang J, Xu C, 2017. Geodetector: Principle and prospective.Acta Geographica Sinica, 72(1): 116-134. (in Chinese)Spatial stratified heterogeneity is the spatial expression of natural and socioeconomic process, which is an important approach for human to recognize nature since Aristotle. Geodetector is a new statistical method to detect spatial stratified heterogeneity and reveal the driving factors behind it. This method with no linear hypothesis has elegant form and definite physical meaning. Here is the basic idea behind Geodetector: assuming that the study area is divided into several subareas. The study area is characterized by spatial stratified heterogeneity if the sum of the variance of subareas is less than the regional total variance; and if the spatial distribution of the two variables tends to be consistent, there is statistical correlation between them. Q-statistic in Geodetector has already been applied in many fields of natural and social sciences which can be used to measure spatial stratified heterogeneity, detect explanatory factors and analyze the interactive relationship between variables. In this paper, the authors will illustrate the principle of Geodetector and summarize the characteristics and applications in order to facilitate the using of Geodetector and help readers to recognize, mine and utilize spatial stratified heterogeneity.

DOI

[23]
Wang S, Liu Q, Zhang D, 2004. Karst rocky desertification in southwestern China: Geomorphology, landuse, impact and rehabilitation.Land Degradation & Development, 15(2): 115-121.

[24]
Wang Y, Cai Y, Pan M, 2013. Analysis on the relationship between soil erosion and land use in Wujiang River Basin in Guizhou province.Research of Soil and Water Conservation, 20(3): 11-18. (in Chinese)Based on 15 remote sensing images and relevant image processing techniques,and statistic methods,the spatial-temporal characteristics of land use change in Wujiang River Basin,Guizhou Province during the period of 1980 2000 was analyzed.The images involved the Multispectral Scanner(MSS) data acquired around 1980,Landsat-ETM data around 2000,soil erosion data acquired in 2000,GIMMS/AVHRR NDVI data acquired in 2000.The results show that forest land,farm land and grassland were the main land use types in WRB.There was an obvious good change in land use in the study area during 1980 2000.Analysis on the relationship between soil erosion and land use suggests that different land use types had different degrees of soil erosion,i.e.barren landother landonstruction landforest landwater areapaddy fieldgrassland with low coverageshrub landgrassland with high coverageopen forest landgrassland with medium coveragedry land.Among these land use types,dry land,grassland with medium coverage and open forest land were mostly frequently accompanied with soil erosion.All types of soil erosion concentrate on areas with vegetation coverage of 50%~60%.When the vegetation coverage fell to 50%~60%,the most serious soil erosion happened,which was different with the situation in non-karst areas where soil erosion intensified along with the degradation of vegetation.

[25]
Williams J, Jones C A, Kiniry J R et al., 1989. The EPIC crop growth-model. Transactions of the ASAE, 32(2): 497-511.

DOI

[26]
Xiong K, Li J, Long M, 2012. Features of soil and water loss and key issues in demonstration areas for combating karst rocky desertification.Acta Geographica Sinica, 67(7): 878-888. (in Chinese)Very little information on water and soil loss in karst areas is available. Moreover, traditional methods of assessing soil loss are difficult to apply to this area. In this paper the authors analyze the features of water and soil loss based on location monitoring during the five years (2006-2010), in demonstration areas for combating karst rocky desertification (KRD). The following conclusions are obtained. (1) Soil erosion showed a decreasing trend after a series of comprehensive treatments in the three study regions, and erosion was macroscopically mitigated in terms of landform types. (2) The slope cropland is distributed extensively in Yachi mountain region and erosion is thus serious. With better natural conditions and ecological economy development, erosion in Hongfenghu basin is relatively weak. Due to the severely poor soil cover, the amount of soil erosion is extremely low in Huajiang gorge. (3) Ecologic rehabilitation is the key to combat KRD. Closing hillsides to facilitate afforestation and water conservation are effective measures for the mitigation of soil and water loss. Grassland and economic forests bring both economic and ecological benefits. (4) KRD degrees differ greatly in slope gradient and soil layer. Further classification for soil erosion in karst areas should be proposed based on KRD degrees. (5) Hazard evaluation of subterranean soil loss is one of the tough tasks at present. However, control of key parts such as sinkholes is the efficient way to prevent subterranean loss.

DOI

[27]
Xu Y, Shao X, 2006. Estimation of soil erosion supported by GIS and RUSLE: A case study of Maotiaohe watershed, Guizhou province.Journal of Beijing Forestry University, 28(4): 67-71. (in Chinese)Soil erosion in karst mountainous areas of southwest China is one of the determining factors for land degradation and productivity reduction. To explain the spatial characteristics of soil erosion in karst mountainous areas in southwest China, the authors used the Maotiaohe Watershed in Guizhou Province as study area. Geographic Information System(GIS) technology and the Revised Universal Soil Loss Equation (RUSLE) were applied to estimate the potential and actual amount of soil erosion in Maotiaohe Watershed of Guizhou Province, present the spatial distribution characteristics of soil erosion in the watershed, calculate the soil conservation capacity by land use and then discuss the soil and water conservation countermeasures. Results showed that the soil erosion modulus and the actual amount of soil erosion were 28.70 t/(hm2·a) and 875.65×10⁴ t/a, respectively, and the annual soil conservation amount was 25 095.73×10⁴ t/a. Among land use types, the soil conservation capacity of dry land is the smallest. Apart from the option of returning all the farmland with a slope grade above 25° to woodland or grassland and afforestation in bare mountains, it is imperative to enforce proper management of farmlands with a slope grade of 6°--25°,such as terracing,in order to decrease soil loss.

[28]
Yan Y, Dai Q, Yuan Y et al., 2018. Effects of rainfall intensity on runoff and sediment yields on bare slopes in a karst area, SW China. Geoderma, 330: 30-40.Due to the impacts of global warming, extreme precipitation events are increasing in frequency and are accelerating the process of rocky desertification in the karst area in southwestern China. In this study, the dual structure of a karst system was simulated in a steel tank, and a rainfall simulation was employed to determine the intensity threshold of erosive rainfall at the surface and the effects of extreme rainfall on runoff generation and sediment yield on karst hillslopes. The results showed the following. i) In order of importance, the factors contributing to runoff were rainfall intensity, slope angle and underground pore fissure degree (UPD), and the factors contributing to sediment yield were rainfall intensity, UPD and slope angle. To cause surface soil erosion, the rainfall intensity had to be >0.862mm/min. ii) Under light (0.562mm/min) and moderate rainfall (0.8 and 1.262mm/min), underground pore fissures are the main pathway for runoff and sediment loss. iii) Under extreme rainfall (1.562mm/min), surface runoff (and the associated sediment yield) represents the main part of soil erosion on the slope. During such events, the underground erosion proportion is lower, but the underground sediment yield is greater. Because underground pore fissures are the main pathway for underground soil loss, reducing the UPD is an immediate way to prevent and control underground leakage. Engineering measures have the fastest effect, but plant-based measures are more effective and worth popularizing to prevent and control underground soil loss in karst areas. These results provide information significant for controlling rocky desertification and preventing soil erosion in the karst area of southwestern China.

DOI

[29]
Zeng C, Wang S, Bai X et al., 2017. Soil erosion evolution and spatial correlation analysis in a typical karst geomorphology using RUSLE with GIS.Solid Earth, 8(4): 1-26.

DOI

[30]
Zhan D, Zhang W, Yu J et al., 2015. Analysis of influencing mechanism of residents’ livability satisfaction in Beijing using geographical detector.Progress in Geography, 34(8): 966-975. (in Chinese)城市宜居性是与居民生活质量密切相关的科学议题,深入探讨宜居满意度影响机理对把握转型期北京市居民居住环境需求、促进宜居城市建设等具有重要的现实意义。以北京市为案例,基于2013年宜居城市大规模问卷调查数据,运用因子分析方法提取了北京市居民宜居满意度主要感知因素,并分别从居民宜居感知因素、个体与家庭属性因素两个视角,借助地理探测器方法揭示了北京市居民宜居满意度特征与影响机理。研究发现:1北京市居民宜居满意度主要由污染噪声因子、生活设施因子、人文环境因子、出行便捷因子、自然环境因子、安全环境因子和休闲活动因子等7个维度构成。2宜居满意度受到宜居感知因素和个体与家庭属性共同影响,但宜居感知因素的解释力明显要强,其中污染噪声因子、自然环境因子和出行便捷因子等因素是关键因子。3宜居满意度与宜居感知因素具有相对一致性,且存在个体与家庭属性差异。通常宜居感知因素得分低居民,其宜居满意度也相对较低;另外,远郊区、租赁房、有迁居经历、男性、30~39岁、高中学历、家庭月收入5000元以下和外地户口等社会群体的宜居满意度明显要低。

DOI

[31]
Zhang H, Yang Q, Li R et al., 2013a. Extension of a GIS procedure for calculating the RUSLE equationLS factor. Computers & Geosciences, 52: 177-188.78 We presented an improved algorithm that can automatically calculate LS factors. 78 Using slope steepness and channel networks breaks in calculating slope length. 78 Calculate L factor under consideration of convergence flow. 78 Our method corresponds more closely with the reality of the example catchment. 78 We developed LS-TOOL application using C73 with a user-friendly interface.

DOI

[32]
Zhang X, Wang S, Bai X et al., 2013b. Relationships between the spatial distribution of karst land desertification and geomorphology, lithology, precipitation, and population density in Guizhou province.Earth & Environment, 41(1): 1-6. (in Chinese)

[33]
Zhang X, Wang S, He Xet al., 2007. Soil creeping in weathering crusts of carbonate rocks and underground soil losses on karst slopes. Earth & Environment, 35(3): 202-206. (in Chinese)Evidence of soil creeping occurring in weathering crusts of carbonate rocks is developed,and functions of soil creeping in the formation and evolution of the weathering crusts are described in this paper.The soil creeping mechanism is used to interpret the abrupt Earth-rock contact at the interfaces and the smoothness of the bedrock surfaces underneath the crust.Soil erosion on karst slopes is integrated of chemical dissolution,gravitational erosion and water erosion,and land lithfication caused by underground soil loss is illustrated.Finally,the paper deals with the impacts of human activities,such as deforestation and land reclamation,on underground soil losses and land lithfication of karst slopes underlain by pure carbonate rocks,because of damage of plant root nets, increase of runoff infiltration and promotion of underground pipe erosion and sinking of the overlying crust soils.

DOI

[34]
Zhou C, Cheng W, Qian Jet al., 2009. Research on the classification system of digital land geomorphology of 1:1000000 in China.Journal of Geo-information Science, 11(6): 707-724. (in Chinese)Geomorphologic classification system is essential to geomorphologic research and mapping.Using the compiling methodology and standard of geomorphologic maps with a scale of 1 1 000 000 in 1980's in China,based on the summarization of geomorphology,classification research at home and abroad,and the technology such as remote sensing image,digital elevation model(DEM) and computer automated cartography and so on,this research concludes and summarizes the principles followed in the classification process of digital geomorphology;analyzes the mutual relations hips among them;discusses various indexes of digital land geomorphologic classification: including morphology,genesis,material composition,age etc.The classification system puts forward numerical classification methodology of 3 classes,6 grades and 7 layers of digital Land geomorphology in China;presents data organization method of digital geomorphology,that is: morphology and genesis types represented by polygon map spot,morphology and structure type represented by point,line and polygon map spot together.Moreover,the article specifically presents the geomorphologic types of different layer and different level of various genesis types.The research of classification system of digital geomorphology provides a basis for the interpretation and cartography of Land geomorphology based on multi-source data such as remote sensing etc.

DOI

Outlines

/