
Journal of Geographical Sciences >
Spatio-temporal evolution and the influencing factors of PM2.5 in China between 2000 and 2015
Author: Zhou Liang, PhD and Associate Professor, specialized in environmental geography, urban geography and regional development. E-mail: zhougeo@126.com
Received date: 2018-05-10
Accepted date: 2018-10-22
Online published: 2019-02-25
Supported by
The Strategic Priority Research Program of the Chinese Academy of Sciences, No.XDA19040401
China Postdoctoral Science Foundation, No.2016M600121
National Natural Science Foundation of China, No.41701173, No.41501137
The State Key Laboratory of Resources and Environmental Information System
Copyright
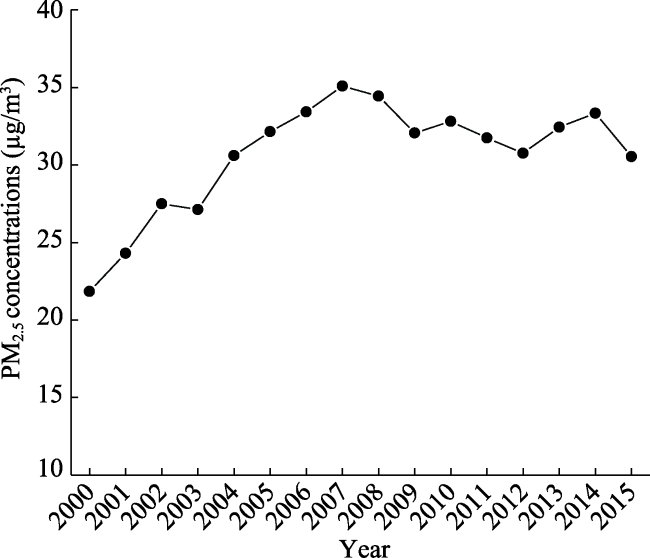
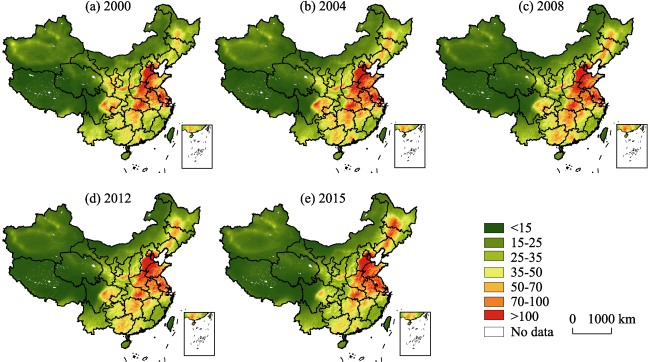
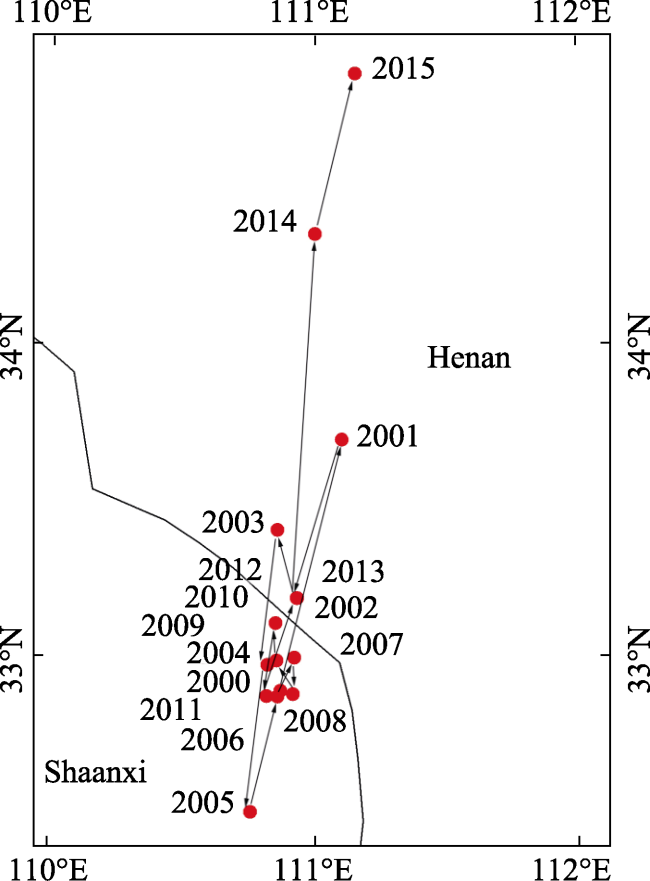
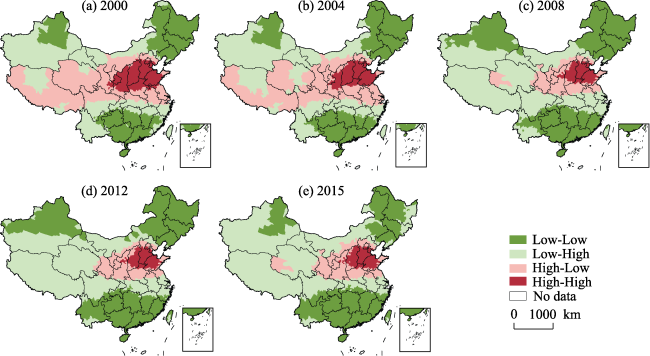
High concentrations of PM2.5 are universally considered as a main cause for haze formation. Therefore, it is important to identify the spatial heterogeneity and influencing factors of PM2.5 concentrations for regional air quality control and management. In this study, PM2.5 data from 2000 to 2015 was determined from an inversion of NASA atmospheric remote sensing images. Using geo-statistics, geographic detectors, and geo-spatial analysis methods, the spatio-temporal evolution patterns and driving factors of PM2.5 concentration in China were evaluated. The main results are as follows. (1) In general, the average concentration of PM2.5 in China increased quickly and reached its peak value in 2006; subsequently, concentrations remained between 21.84 and 35.08 μg/m3. (2) PM2.5 is strikingly heterogeneous in China, with higher concentrations in the north and east than in the south and west. In particular, areas with relatively high PM2.5 concentrations are primarily in four regions, the Huang-Huai-Hai Plain, Lower Yangtze River Delta Plain, Sichuan Basin, and Taklimakan Desert. Among them, Beijing-Tianjin-Hebei Region has the highest concentration of PM2.5. (3) The center of gravity of PM2.5 has generally moved northeastward, which indicates an increasingly serious haze in eastern China. High-value PM2.5 concentrations have moved eastward, while low-value PM2.5 has moved westward. (4) Spatial autocorrelation analysis indicates a significantly positive spatial correlation. The “High-High” PM2.5 agglomeration areas are distributed in the Huang-Huai-Hai Plain, Fenhe-Weihe River Basin, Sichuan Basin, and Jianghan Plain regions. The “Low-Low” PM2.5 agglomeration areas include Inner Mongolia and Heilongjiang, north of the Great Wall, Qinghai-Tibet Plateau, and Taiwan, Hainan, and Fujian and other southeast coastal cities and islands. (5) Geographic detection analysis indicates that both natural and anthropogenic factors account for spatial variations in PM2.5 concentration. Geographical location, population density, automobile quantity, industrial discharge, and straw burning are the main driving forces of PM2.5 concentration in China.
Key words: air pollution; PM2.5; haze; spatio-temporal evolution; environmental influence; China
ZHOU Liang , ZHOU Chenghu , YANG Fan , CHE Lei , WANG Bo , SUN Dongqi . Spatio-temporal evolution and the influencing factors of PM2.5 in China between 2000 and 2015[J]. Journal of Geographical Sciences, 2019 , 29(2) : 253 -270 . DOI: 10.1007/s11442-019-1595-0
Figure 1 Overall PM2.5 concentration trend in China from 2000 to 2015 |
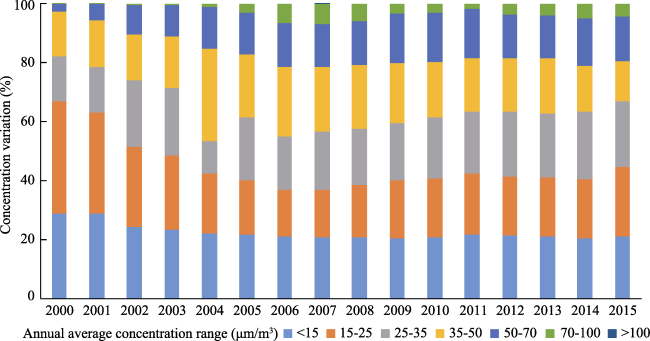
Figure 2 Variations in PM2.5 concentration by range in China from 2000 to 2015 |
Figure 3 PM2.5 spatial characteristics in China in specific years from 2000 to 2015 |
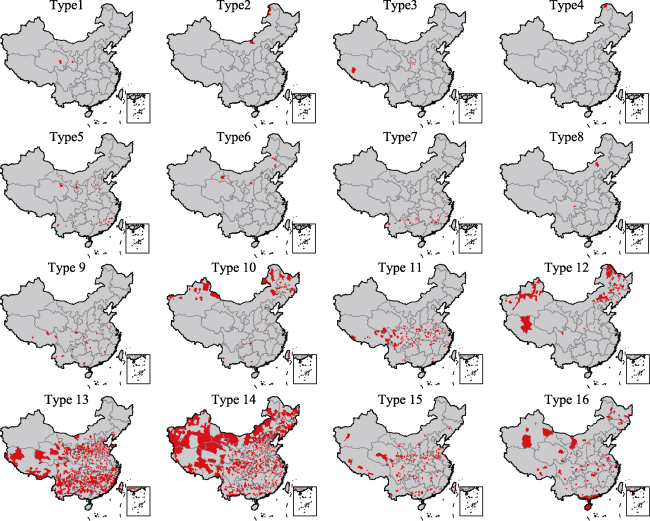
Table 1 Distribution chart of 16 types of time sequences of PM2.5 concentration evolution in China |
| No. | Change type | Quantity | % | No. | Change type | Quantity | % |
|---|---|---|---|---|---|---|---|
| 1 | D—D—D—D | 4 | 0.17 | 9 | R—D—D—D | 38 | 1.59 |
| 2 | D—D—D—R | 5 | 0.21 | 10 | R—D—D—R | 71 | 2.97 |
| 3 | D—D—R—D | 11 | 0.46 | 11 | R—D—R—D | 120 | 5.02 |
| 4 | D—D—R—R | 1 | 0.04 | 12 | R—D—R—R | 68 | 2.85 |
| 5 | D—R—D—D | 45 | 1.88 | 13 | R—R—D—D | 811 | 33.93 |
| 6 | D—R—D—R | 13 | 0.54 | 14 | R—R—D—R | 801 | 33.51 |
| 7 | D—R—R—D | 36 | 1.51 | 15 | R—R—R—D | 190 | 7.95 |
| 8 | D—R—R—R | 5 | 0.21 | 16 | R—R—R—R | 171 | 7.15 |
Note: R indicates rise, and D indicates decline. |
Figure 4 The evolution of PM2.5 concentrations for the 16 time sequences in China (see Table 1 for time sequence definitions) |
Figure 5 Changes in PM2.5 concentration center of gravity in China from 2000 to 2015 |
Figure 6 Local spatial autocorrelation analysis results for PM2.5 in China from 2000 to 2015 |
Table 2 Geographical detection results for PM2.5 in China for 2000, 2006, and 2011 |
| Detection indices | 2000 | 2006 | 2011 | |||
|---|---|---|---|---|---|---|
| P | Q | P | Q | P | Q | |
| Natural geographical regionalization (X1) | 0.7047 | 0.0000 | 0.7447 | 0.0000 | 0.7196 | 0.0000 |
| Per capita GDP (X2) | 0.0077 | 0.9191 | 0.0062 | 0.9079 | 0.0068 | 0.8659 |
| Population density (X3) | 0.4320 | 0.0000 | 0.4372 | 0.0000 | 0.4120 | 0.0000 |
| Proportion of the secondary industry (X4) | 0.0984 | 0.0000 | 0.0665 | 0.0031 | 0.0917 | 0.0000 |
| Proportion of built-up areas (X5) | 0.0853 | 0.0030 | 0.0753 | 0.1033 | 0.1025 | 0.0282 |
| Urban greening ratio (X6) | 0.0280 | 0.1503 | 0.0625 | 0.0319 | 0.0359 | 0.1083 |
| Urban residents’ car ownership (X7) | 0.0259 | 0.8637 | 0.0913 | 0.0226 | 0.1074 | 0.0080 |
| Sown area (X8) | 0.1396 | 0.0557 | 0.1487 | 0.0000 | 0.1046 | 0.0000 |
| Industrial flue dust discharge (X9) | 0.0709 | 0.1537 | 0.0936 | 0.0000 | 0.0531 | 0.2766 |
| Energy consumption intensity of lands (X10) | 0.3109 | 0.0000 | 0.4124 | 0.0000 | 0.4143 | 0.0000 |
| Average iron and steel output of lands (X11) | 0.2869 | 0.0000 | 0.3373 | 0.0000 | 0.3217 | 0.0000 |
The authors have declared that no competing interests exist.
| [1] |
|
| [2] |
|
| [3] |
|
| [4] |
|
| [5] |
|
| [6] |
|
| [7] |
|
| [8] |
|
| [9] |
|
| [10] |
|
| [11] |
|
| [12] |
|
| [13] |
|
| [14] |
|
| [15] |
|
| [16] |
|
| [17] |
|
| [18] |
Huang, Y,
|
| [19] |
|
| [20] |
|
| [21] |
|
| [22] |
|
| [23] |
|
| [24] |
|
| [25] |
|
| [26] |
|
| [27] |
|
| [28] |
|
| [29] |
|
| [30] |
|
| [31] |
|
| [32] |
|
| [33] |
|
| [34] |
|
| [35] |
|
| [36] |
|
| [37] |
|
| [38] |
|
| [39] |
|
| [40] |
|
| [41] |
|
| [42] |
|
| [43] |
|
| [44] |
|
| [45] |
|
| [46] |
|
| [47] |
|
/
| 〈 |
|
〉 |