
Journal of Geographical Sciences >
Spatial spillover effect and driving forces of carbon emission intensity at the city level in China
Author: Wang Shaojian (1986-), Associate Professor, specialized in urban geography and regional development. E-mail: 1987wangshaojian@163.com
Received date: 2018-04-07
Accepted date: 2018-06-01
Online published: 2019-02-25
Supported by
National Natural Science Foundation of China, No.41601151
Natural Science Foundation of Guangdong Province, No.2016A030310149
Pearl River S&T Nova Program of Guangzhou (201806010187)
Copyright
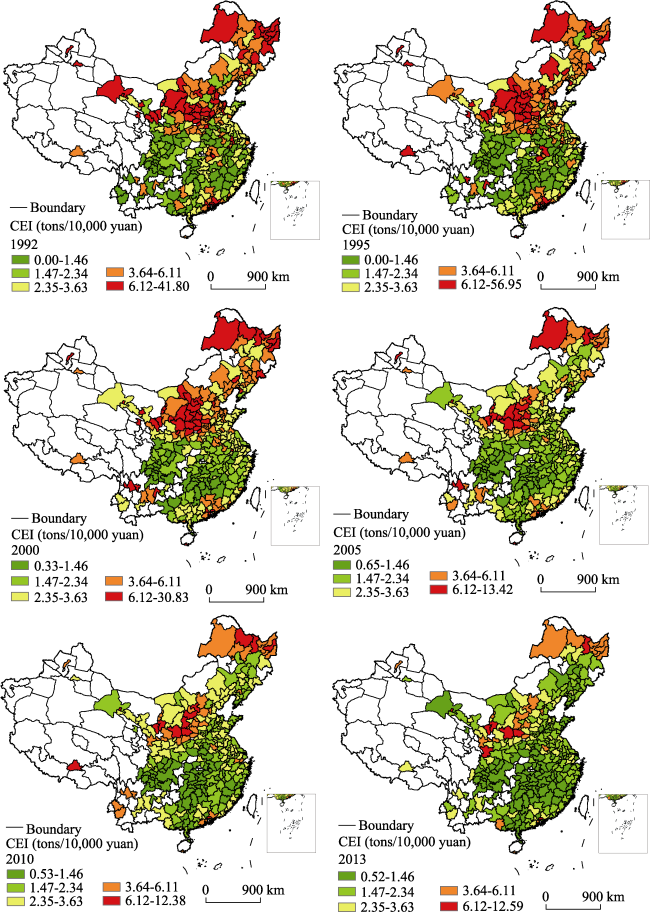
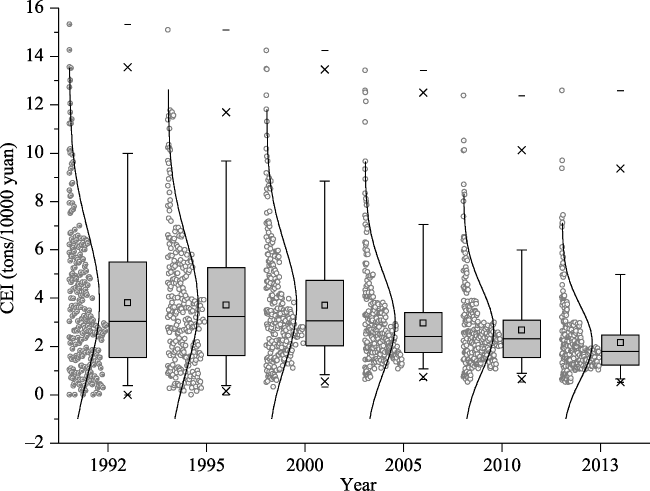
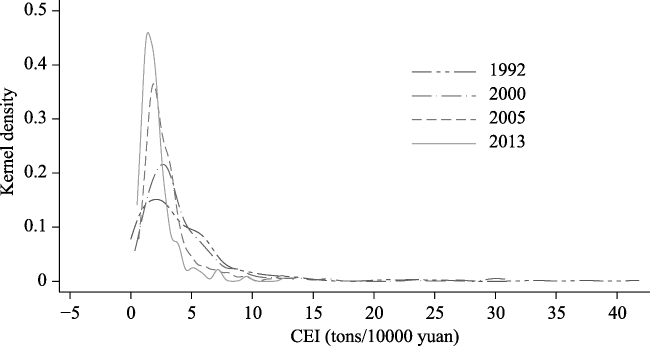
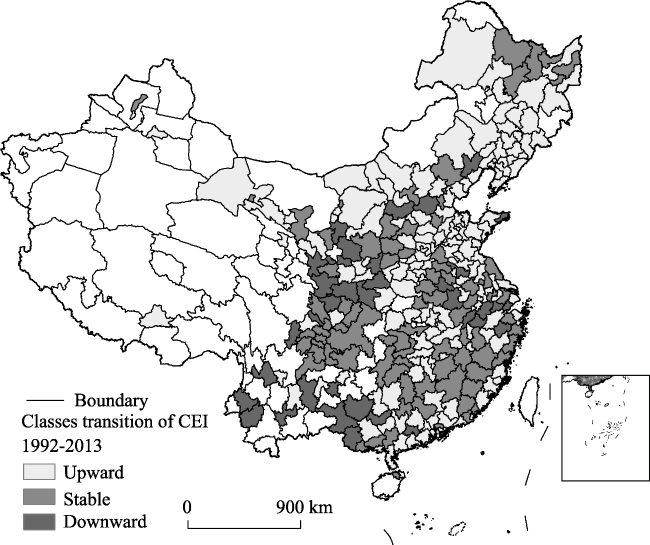
In this study, we adopt kernel density estimation, spatial autocorrelation, spatial Markov chain, and panel quantile regression methods to analyze spatial spillover effects and driving factors of carbon emission intensity in 283 Chinese cities from 1992 to 2013. The following results were obtained. (1) Nuclear density estimation shows that the overall average carbon intensity of cities in China has decreased, with differences gradually narrowing. (2) The spatial autocorrelation Moran’s I index indicates significant spatial agglomeration of carbon emission intensity is gradually increasing; however, differences between regions have remained stable. (3) Spatial Markov chain analysis shows a Matthew effect in China’s urban carbon emission intensity. In addition, low-intensity and high-intensity cities characteristically maintain their initial state during the transition period. Furthermore, there is a clear “Spatial Spillover” effect in urban carbon emission intensity and there is heterogeneity in the spillover effect in different regional contexts; that is, if a city is near a city with low carbon emission intensity, the carbon emission intensity of the first city has a higher probability of upward transfer, and vice versa. (4) Panel quantile results indicate that in cities with low carbon emission intensity, economic growth, technological progress, and appropriate population density play an important role in reducing emissions. In addition, foreign investment intensity and traffic emissions are the main factors that increase carbon emission intensity. In cities with high carbon intensity, population density is an important emission reduction factor, and technological progress has no significant effect. In contrast, industrial emissions, extensive capital investment, and urban land expansion are the main factors driving the increase in carbon intensity.
WANG Shaojian , HUANG Yongyuan , ZHOU Yuquan . Spatial spillover effect and driving forces of carbon emission intensity at the city level in China[J]. Journal of Geographical Sciences, 2019 , 29(2) : 231 -252 . DOI: 10.1007/s11442-019-1594-1
Table 1 Main variables used in the applied model |
| Type | Name | Units | Explanation |
|---|---|---|---|
| Explained variable | Carbon Emission Intensity (CEI) | Tons / 10,000 yuan | Total urban carbon emissions / GDP |
| Explanatory variables | Affluence (A) | yuan | Per capita GDP |
| Population (P) | (person/km2) | Total population / city area | |
| Industry Structure (IS) | % | Second industry added value / GDP | |
| Investment Intensity (CI) | % | Total fixed assets investment / GDP | |
| Foreign Direct Investment (FDI) | 10,000 dollars / 10,000 yuan | Actual use of foreign capital / GDP | |
| Technology progress (T) | 10,000 yuan / ton of standard coal | Reciprocal of energy intensity (Total energy consumption / GDP) | |
| Land urbanization (UB) | % | Road 500 m buffer area / city area | |
| Road Density (RD) | km/100 km2 | Kilometer mileage / city area |
Figure 1 CEI spatial patterns at the city level in China (1992-2013) |
Figure 2 Box-plot of CEI at the city level in China |
Figure 3 Kernel density estimates of CEI at the city level in China |
Table 2 Moran’s I for CEI at the city level in China (1992-2013) |
| Year | Moran’s I | Z value | Year | Moran’s I | Z value |
|---|---|---|---|---|---|
| 1992 | 0.359 | 8.717 ** | 2003 | 0.434 | 11.018 ** |
| 1993 | 0.416 | 10.459** | 2004 | 0.435 | 11.903 ** |
| 1994 | 0.336 | 8.807 ** | 2005 | 0.498 | 11.564 ** |
| 1995 | 0.325 | 8.653 ** | 2006 | 0.478 | 11.003 ** |
| 1996 | 0.292 | 7.565 ** | 2007 | 0.464 | 12.150 ** |
| 1997 | 0.460 | 11.741 ** | 2008 | 0.443 | 11.124 ** |
| 1998 | 0.316 | 8.143 ** | 2009 | 0.489 | 10.880 ** |
| 1999 | 0.431 | 11.005 ** | 2010 | 0.448 | 10.599 ** |
| 2000 | 0.411 | 10.504 ** | 2011 | 0.435 | 9.534 ** |
| 2001 | 0.414 | 10.453 ** | 2012 | 0.428 | 11.903 ** |
| 2002 | 0.417 | 10.516 ** | 2013 | 0.380 | 11.564 ** |
Note: * indicates significant at the 5% level, and ** indicates significant at the 1% level |
Figure 4 Spatial patterns of CEI changes in intensity types at the city level in China (1992-2013) |
Table 3 Markov matrix for CEI classes at the city level in China (1992-2013) |
| t/t+1 | n | 1 | 2 | 3 | 4 |
|---|---|---|---|---|---|
| 1 | 1439 | 0.896 5 | 0.098 0 | 0.005 6 | 0 |
| 2 | 1457 | 0.129 0 | 0.771 4 | 0.095 4 | 0.004 1 |
| 3 | 1512 | 0.001 3 | 0.171 3 | 0.779 8 | 0.047 6 |
| 4 | 1535 | 0.002 0 | 0.000 7 | 0.109 4 | 0.887 9 |
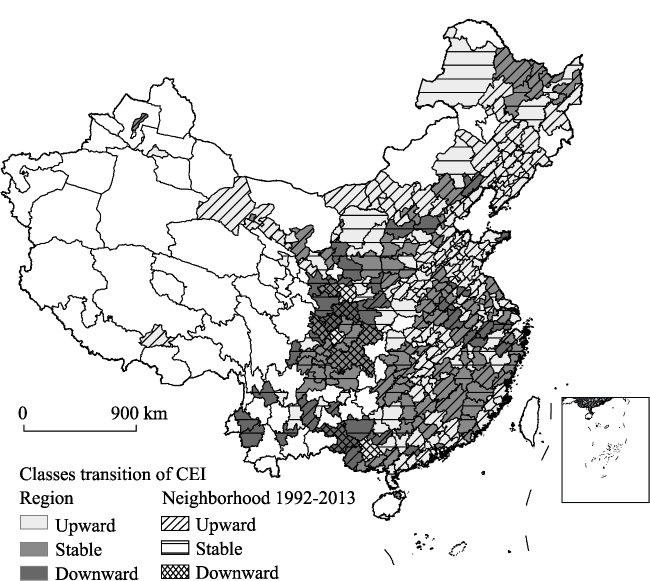
Figure 5 Spatial patterns of CEI class transition for city units also showing neighborhood transitions in China (1992-2013) |
Table 4 Spatial Markov matrix for CEI classes at the city level in China (1992-2013) |
| Spatial Lag | t/t+1 | n | 1 | 2 | 3 | 4 |
|---|---|---|---|---|---|---|
| 1 | 1 | 659 | 0.9408 | 0.0561 | 0.0030 | 0 |
| 2 | 357 | 0.1345 | 0.7703 | 0.0924 | 0.0028 | |
| 3 | 257 | 0.0039 | 0.2257 | 0.7237 | 0.0467 | |
| 4 | 176 | 0 | 0 | 0.1364 | 0.8636 | |
| 2 | 1 | 478 | 0.8766 | 0.1192 | 0.0042 | 0 |
| 2 | 467 | 0.1370 | 0.7687 | 0.0878 | 0.0064 | |
| 3 | 314 | 0 | 0.2070 | 0.7516 | 0.0414 | |
| 4 | 204 | 0.0098 | 0.0049 | 0.1422 | 0.8431 | |
| 3 | 1 | 244 | 0.8361 | 0.1516 | 0.0123 | 0 |
| 2 | 462 | 0.1364 | 0.7727 | 0.0887 | 0.0022 | |
| 3 | 483 | 0.0021 | 0.1843 | 0.7723 | 0.0414 | |
| 4 | 313 | 0.0032 | 0 | 0.1374 | 0.8594 | |
| 4 | 1 | 58 | 0.8103 | 0.1724 | 0.0172 | 0 |
| 2 | 171 | 0.0760 | 0.7778 | 0.1404 | 0.0058 | |
| 3 | 458 | 0 | 0.1026 | 0.8384 | 0.0590 | |
| 4 | 842 | 0 | 0 | 0.0855 | 0.9145 |
Table 5 Fixed effect and quantile regression estimates |
| Variables | (1) | (2) | (3) | (4) | (5) | (6) |
|---|---|---|---|---|---|---|
| FE | q10 | q25 | q50 | q75 | q90 | |
| A | 2.138*** | 1.5515*** | 1.6227*** | 1.6329*** | 1.4469*** | 1.2669*** |
| (8.85) | (4.97) | (5.58) | (5.97) | (5.16) | (5.08) | |
| SA | -0.140*** | -0.1018*** | -0.1066*** | -0.1102*** | -0.1071*** | -0.1023*** |
| (-10.60) | (-5.69) | (-6.14) | (-6.49) | (-6.15) | (-7.07) | |
| P | -0.210*** | -0.0665** | -0.0747*** | -0.0792*** | -0.0813*** | -0.0771*** |
| (-2.76) | (-2.42) | (-2.65) | (-2.89) | (-2.97) | (-2.81) | |
| IS | 0.369*** | 0.1758** | 0.1963** | 0.3458*** | 0.4681*** | 0.4350*** |
| (3.21) | (2.25) | (2.16) | (2.85) | (4.88) | (5.22) | |
| CI | 0.159 | 0.0982** | 0.0954 | 0.1408 | 0.2881** | 0.4066*** |
| (1.65) | (2.42) | (1.36) | (1.46) | (2.53) | (3.34) | |
| FDI | 5.427** | 8.6024*** | 7.7062*** | 6.3488*** | 4.9094*** | 3.3846*** |
| (1.99) | (5.15) | (4.85) | (4.09) | (3.84) | (3.03) | |
| T | -0.0221*** | -0.2610*** | -0.2528*** | -0.2087*** | -0.0922 | -0.0182 |
| (-4.80) | (-4.48) | (-3.68) | (-2.71) | (-1.12) | (-0.41) | |
| UB | 0.0426*** | 0.0347*** | 0.0377*** | 0.0474*** | 0.0672*** | 0.0836*** |
| (4.79) | (4.77) | (4.9) | (5.4) | (5.98) | (6.77) | |
| ROD | 0.0435*** | 0.0301*** | 0.0248*** | 0.0187*** | 0.0092 | 0.00349 |
| (6.04) | (3.17) | (3.06) | (2.64) | (1.42) | (0.65) | |
| Cons | -6.114*** | -4.4682*** | -4.5841*** | -4.3932*** | -3.0907** | -1.9161* |
| (-4.91) | (-3.14) | (-3.58) | (-3.76) | (-2.54) | (-1.71) | |
| N | 6226 | 6226 | 6226 | 6226 | 6226 | 6226 |
Note: The t statistic is represented in parentheses, * p < 0.1, ** p < 0.05, *** p < 0.01 |
The authors have declared that no competing interests exist.
| [1] |
|
| [2] |
|
| [3] |
|
| [4] |
|
| [5] |
|
| [6] |
|
| [7] |
|
| [8] |
|
| [9] |
|
| [10] |
|
| [11] |
|
| [12] |
|
| [13] |
|
| [14] |
|
| [15] |
|
| [16] |
|
| [17] |
|
| [18] |
|
| [19] |
|
| [20] |
|
| [21] |
|
| [22] |
|
| [23] |
|
| [24] |
|
| [25] |
|
| [26] |
|
| [27] |
|
| [28] |
|
| [29] |
|
| [30] |
|
| [31] |
|
| [32] |
|
| [33] |
|
| [34] |
|
| [35] |
|
| [36] |
|
| [37] |
|
| [38] |
|
| [39] |
|
| [40] |
|
| [41] |
|
| [42] |
|
| [43] |
|
| [44] |
|
| [45] |
|
| [46] |
|
| [47] |
|
| [48] |
|
| [49] |
|
| [50] |
|
| [51] |
|
| [52] |
|
| [53] |
|
| [54] |
|
| [55] |
|
| [56] |
|
| [57] |
|
| [58] |
|
| [59] |
|
| [60] |
|
| [61] |
|
| [62] |
|
| [63] |
|
| [64] |
|
| [65] |
|
| [66] |
|
| [67] |
|
| [68] |
|
/
| 〈 |
|
〉 |