
Journal of Geographical Sciences >
Spatio-temporal distribution and transformation of cropland in geomorphologic regions of China during 1990-2015
Author: Gao Xiaoyu (1994-), Master, specialized in cropland use and agricultural resources management. E-mail: gaoxy.16s@igsnrr.ac.cn
Received date: 2018-09-06
Accepted date: 2018-11-07
Online published: 2019-02-25
Supported by
National Natural Science Foundation of China, No.41421001, No.41590845, No.41571388
National Key Basic Research Program, No.2015CB954101
Copyright
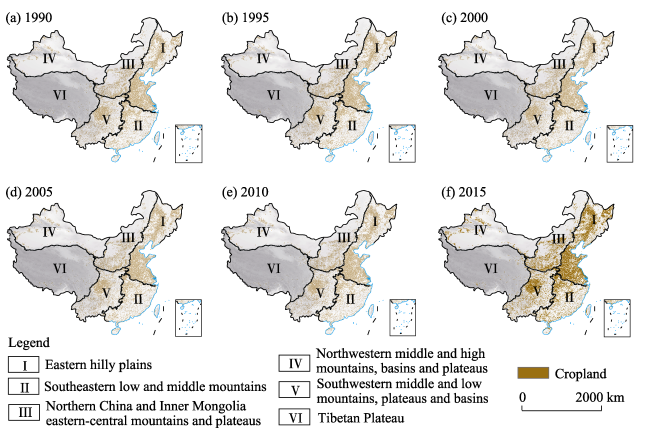
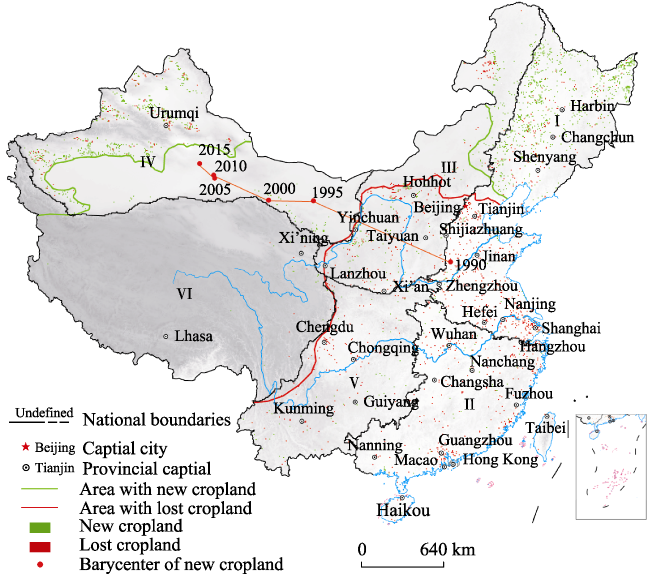
Landforms are an important factor determining the spatial pattern of cropland through allocation of surface water and heat. Therefore, it is of great importance to study the change in cropland distribution from the perspective of geomorphologic divisions. Based on China’s multi-year land cover data (1990, 1995, 2000, 2005, 2010 and 2015) and geomorphologic regionalization data, we analyzed the change in cropland area and its distribution pattern in six geomorphologic regions of China over the period of 1990-2015 with the aid of GIS techniques. Our results showed that the total cropland area increased from 177.1 to 178.5 million ha with an average increase rate of 0.03%. Cropland area decreased in southern China and increased in northern China. Region I (Eastern hilly plains) had the highest cropland increase rate, while the cropland dynamic degree of Region IV (Northwestern middle and high mountains, basins and plateaus) was significantly higher than that of other regions. The barycenter of China’s cropland shifted from northern China to the northwest over the 25-year period. Regions IV and I were the two regions with the greatest increase of cropland. Region II (Southeastern low and middle mountains) and Region V (Southwestern middle and low mountains, plateaus and basins) were the main decreasing cropland regions. The area of cropland remained almost unchanged in Region III (Northern China and Inner Mongolia eastern-central mountains and plateaus) and Region VI (Tibetan Plateau). The loss of cropland occurred mostly in Regions I and II as a result of growing industrialization and urbanization, while the increase of cropland occurred mainly in Region IV because of reclamation of grassland and other wasteland. These analyzing results would provide fundamental information for further studies of urban planning, ecosystem management, and natural resources conservation in China.
GAO Xiaoyu , CHENG Weiming , WANG Nan , LIU Qiangyi , MA Ting , CHEN Yinjun , ZHOU Chenghu . Spatio-temporal distribution and transformation of cropland in geomorphologic regions of China during 1990-2015[J]. Journal of Geographical Sciences, 2019 , 29(2) : 180 -196 . DOI: 10.1007/s11442-019-1591-4
Figure 1 Distribution of China’s cropland in different years |
Figure 2 Distribution of the reclaimed and lost cropland in China during 1990-2015 |
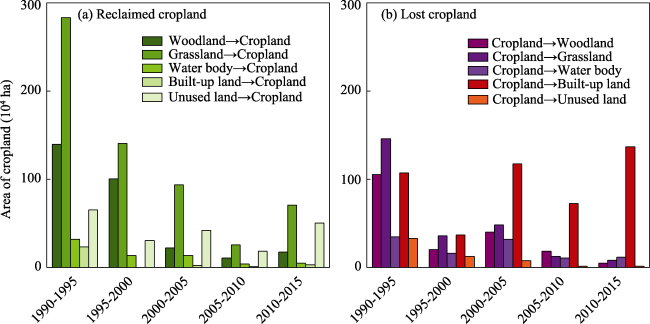
Figure 3 Land use and land cover change of reclaimed and lost cropland in China during 1990-2015 |
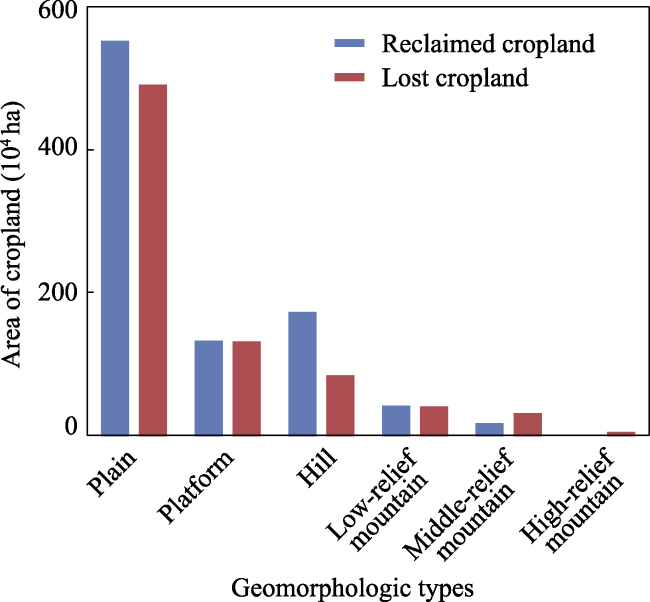
Figure 4 Change of cropland area in different geomorphologic regions in China during 1990-2015 |
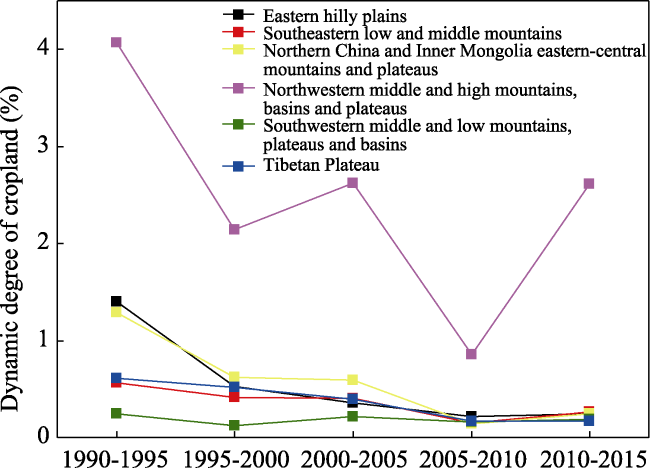
Table 1 Dynamic degree of cropland (DDC) in different geomorphologic regions |
| Region I | Region II | Region III | ||||
|---|---|---|---|---|---|---|
| Change ranges (ha) | DDC (%) | Change ranges (ha) | DDC (%) | Change ranges (ha) | DDC (%) | |
| 1990-1995 | 5,125,436 | 1.40 | 940,063 | 0.56 | 1,733,440 | 1.29 |
| 1995-2000 | 1,981,791 | 0.53 | 692,366 | 0.42 | 840,587 | 0.62 |
| 2000-2005 | 1,345,601 | 0.36 | 671,039 | 0.40 | 815,059 | 0.59 |
| 2005-2010 | 797,084 | 0.21 | 246,073 | 0.15 | 196,102 | 0.14 |
| 2010-2015 | 914,676 | 0.24 | 427,295 | 0.26 | 325,892 | 0.24 |
| Region IV | Region V | Region VI | ||||
| Change ranges (ha) | DDC (%) | Change ranges (ha) | DDC (%) | Change ranges (ha) | DDC (%) | |
| 1990-1995 | 1,380,978 | 4.06 | 423,537 | 0.25 | 64,006 | 0.61 |
| 1995-2000 | 720,985 | 2.15 | 215,656 | 0.13 | 54,301 | 0.51 |
| 2000-2005 | 930,895 | 2.62 | 373,304 | 0.22 | 41,949 | 0.39 |
| 2005-2010 | 335,846 | 0.85 | 276,716 | 0.16 | 18,363 | 0.17 |
| 2010-2015 | 1,065,573 | 2.61 | 324,831 | 0.19 | 17,915 | 0.17 |
Figure 5 Change in dynamic degree of cropland (DDC) in different geomorphologic regions during 1990-2015 |
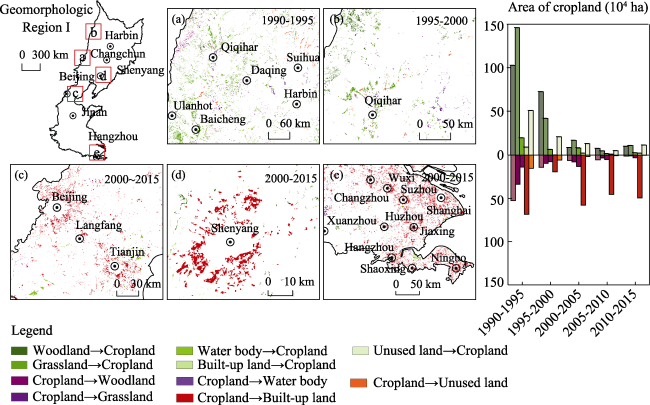
Figure 6 Change in reclaimed and lost cropland in Geomorphologic Region I during 1990-2015 |
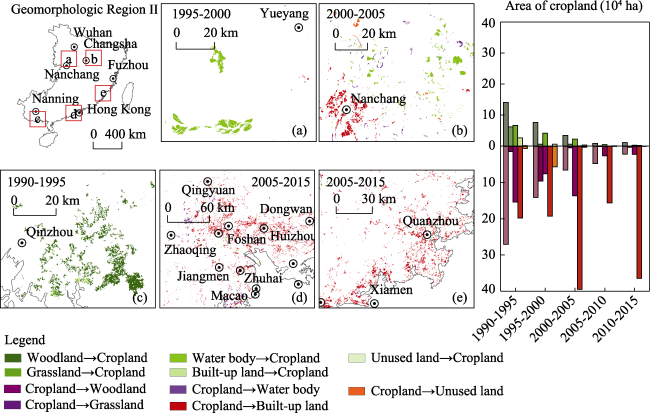
Figure 7 Change in reclaimed and lost cropland in Geomorphologic Region II during 1990-2015 |
Table 2 Temporal and spatial change characteristics of cropland in different geomorphologic regions |
| Geomorphological regions | Changes in cropland area (104 ha/a) | Characteristics of newly reclaimed cropland | Characteristics of lost cropland |
|---|---|---|---|
| Region I (Eastern hilly plains) | +5.40 | It was mainly converted from grassland and unused land, concentrating on Songnen Plain, Liaohe Plain, and Sanjiang Plain | It was mainly reclaimed to built-up land, and occurred in the vicinity of northeastern provincial capital cities and eastern coastal areas (especially Yangtze River Delta). The proportion of converting built-up land to cropland continued to increase. |
| Region II (Southeastern low middle mountains) | -5.92 | The increased reclaimed cropland occurred mainly during 1990-2000. And it concentrated on southern Guangxi by the conversion of woodland, Dongting Lake and Poyang Lake by the conversion of water body. | Its area was far more than the reclaimed cropland. Most of the decreased cropland was changed to woodland (low-middle mountains, hills and valleys of Zhejiang and Fujian provinces) and built-up land (the Pearl River Delta and southeastern coastal areas) during 1990-2000. |
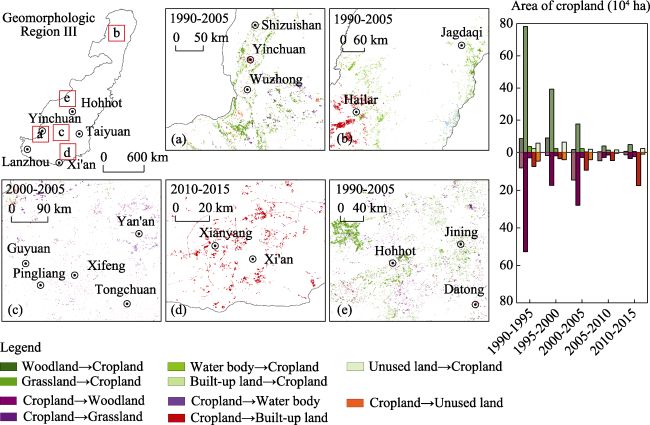
| Region III (Northern China and Inner Mongolia eastern-central mountains and plateaus) | -0.15 | It mainly occurred in 1990-2005, with grassland reclamation in domination. It was primarily distributed in upland plains of northeastern Inner Mongolia, Hetao Plain and western Loess Plateau. And the proportion of grassland to reclaimed cropland was gradually reducing. | Most serious loss occurred in 1990-2005, with the conversion from cropland to grassland, especially in 1990-1995. The effect of returning farmland to forests and pastures was significant in the central part of the Hetao Plain and at bend of the Yellow River. |
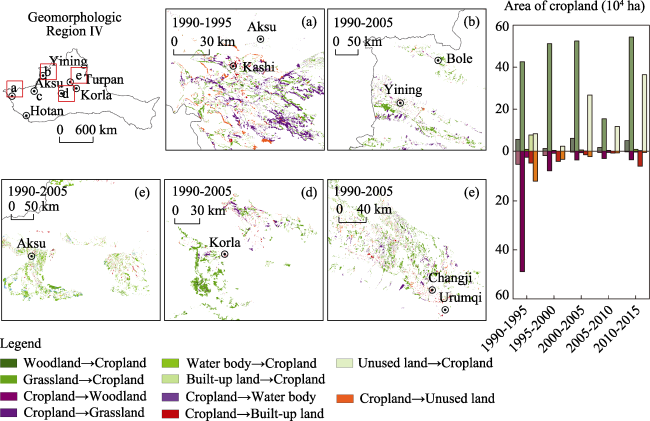
| Region IV (Northwestern middle and high mountains, basins and plateaus) | +8.93 | The reclaimed cropland mostly came from the conversion of grassland, scattering on oasis areas with better conditions of water and land resources, including northern Tarim Basin (Aksu and Korla), Junggar Basin and so on. | The cropland loss was not apparent in Region IV with most serious loss occurring in 1990-1995, and 67.2% of them converted to grassland. This happened mainly on the fringes of cropland or peripheries of cities and towns because of serious cropland abandonment. |
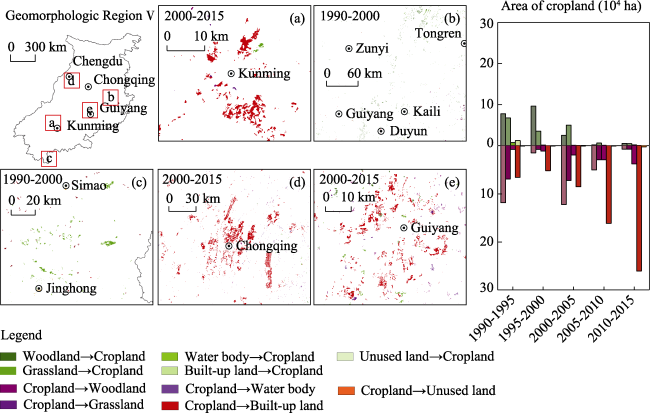
| Region V (Southwestern middle and low mountains, plateaus and basins) | -2.83 | The change of cropland was much smaller than regions I and IV. The reclaimed cropland emerged in 1990-2000, by the conversion from woodland and grassland (above 88.2%). There were plenty of forests and shrub lands to be re-cultivated in hills, mountains valleys of Hubei, Guizhou, and Yunnan provinces. | With the accelerated industrialization and urbanization, a great deal of cropland was exploited to built-up land, and the proportion of cropland converted to built-up land was gradually increasing. |
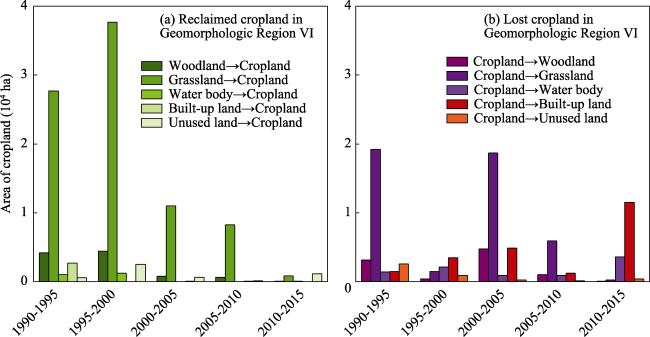
| Region VI (Tibetan Plateau) | +0.06 | Almost unchanged. | Almost unchanged. |
Figure 8 Change in reclaimed and lost cropland in Geomorphologic Region III during 1990-2015 |
Figure 9 Change in reclaimed and lost cropland in Region IV during 1990-2015 |
Figure 10 Change of reclaimed and lost cropland in Geomorphologic Region V during 1990-2015 |
Figure 11 Change in the reclaimed and lost cropland in Geomorphologic Region VI during 1990-2015 |
The authors have declared that no competing interests exist.
| [1] |
|
| [2] |
|
| [3] |
|
| [4] |
|
| [5] |
|
| [6] |
|
| [7] |
|
| [8] |
|
| [9] |
|
| [10] |
|
| [11] |
|
| [12] |
|
| [13] |
|
| [14] |
|
| [15] |
|
| [16] |
|
| [17] |
|
| [18] |
|
| [19] |
|
| [20] |
|
| [21] |
|
| [22] |
|
| [23] |
|
| [24] |
|
| [25] |
|
| [26] |
|
| [27] |
|
| [28] |
|
| [29] |
|
| [30] |
|
| [31] |
|
| [32] |
|
| [33] |
|
| [34] |
|
| [35] |
|
| [36] |
|
/
| 〈 |
|
〉 |