
Journal of Geographical Sciences >
Agricultural labor changes and agricultural economic development in China and their implications for rural vitalization
Author: Ma Li (1991-), PhD, specialized in urban-rural development and land use. E-mail: mal.17b@igsnrr.ac.cn.
Received date: 2018-08-18
Accepted date: 2018-09-25
Online published: 2019-02-25
Supported by
Key Program of National Natural Science Foundation of China, No.41731286
The Postdoctoral Science Foundation of China, No.2018M630197
Copyright
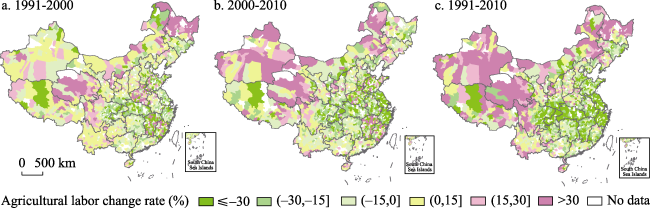
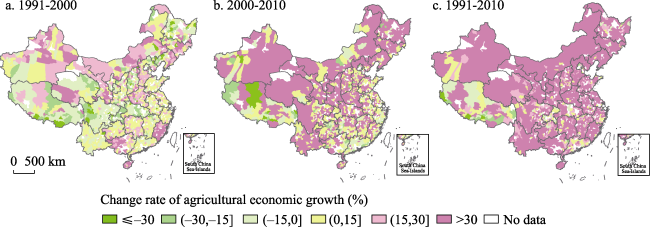
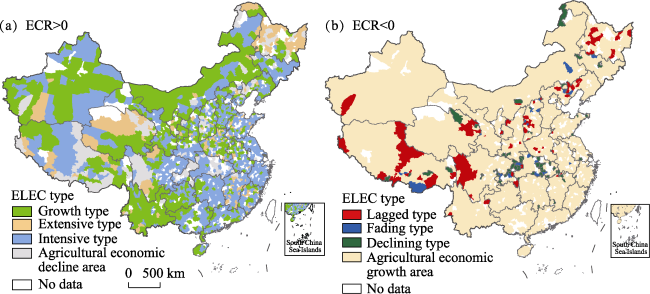
Based on panel data from 1991, 2000 and 2010 at the county level in China, this study analyzed the coupling characteristics and spatio-temporal patterns of agricultural labor changes and economic development under rapid urbanization using quantitative and GIS spatial analysis methods. Three primary conclusions were obtained. (1) During 1991-2010, China’s agricultural labor at the county level showed a decreasing trend, down 4.91% from 1991 to 2000 and 15.50% from 2000 to 2010. In spatial distribution, agricultural labor force has evolved by decreasing eastward and increasing westward. (2) During 1991-2010, China’s agricultural economy at the county level showed a sustained growth trend, with a total increase of 140.13%, but with clear regional differences. The proportion of agricultural output in national GDP gradually decreased, characterized by decreases in eastern China and increases in western China. (3) The coupling types of economic-labor elasticity coefficient are mainly growth in northwest China, for both the agricultural economy and labor, and are intensive in southeast China, with growth of the agricultural economy and reduction of agricultural labor. Regions with lagged, fading, and declining coupling types are generally coincident with the high incidence of poverty in China. However, different coupling types had a positive developing trend for 1991-2010. Finally, based on the coupling types and spatial distribution characteristics of economic-labor elasticity coefficients, some policy suggestions are proposed to promote the integration of the primary, secondary, and tertiary industries and the vitalization of rural economies.
MA Li , LONG Hualou , ZHANG Yingnan , TU Shuangshuang , GE Dazhuan , TU Xiaosong . Agricultural labor changes and agricultural economic development in China and their implications for rural vitalization[J]. Journal of Geographical Sciences, 2019 , 29(2) : 163 -179 . DOI: 10.1007/s11442-019-1590-5
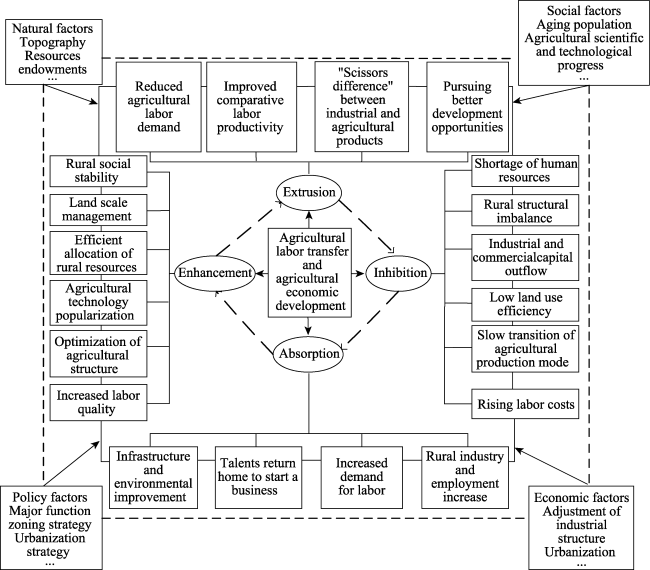
Figure 1 The mechanisms driving agricultural labor changes and economic development |
Table 1 The coupling relationship types between agricultural labor change and economic development |
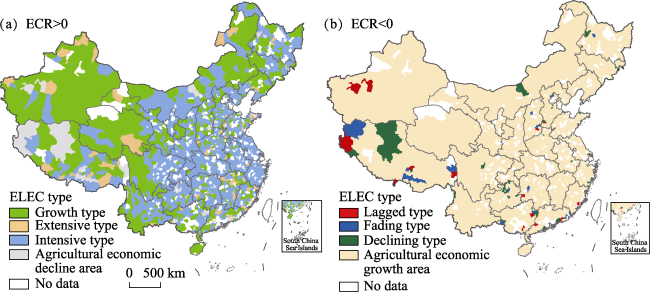
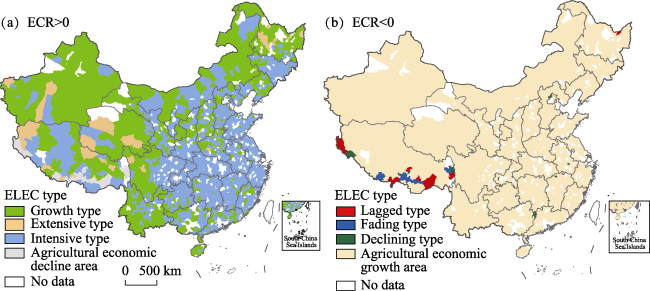
| Type | ECRmn | LCRmn | ELECmn | ELEC characteristics |
|---|---|---|---|---|
| Growth | ECRmn > 0 | LCRmn > 0 | ELECmn > 1 | The agricultural economy grows faster than the agricultural labor population |
| Extensive | ECRmn > 0 | LCRmn > 0 | 0 < ELECmn < 1 | The agricultural economy grows slower than the agricultural labor population |
| Intensive | ECRmn > 0 | LCRmn < 0 | ELECmn < 0 | The agricultural economy grows, but the agricultural labor population decreases |
| Lagged | ECRmn < 0 | LCRmn > 0 | ELECmn < 0 | The agricultural economy declines, but the agricultural labor population increases |
| Fading | ECRmn < 0 | LCRmn < 0 | ELECmn > 1 | The agricultural economy declines faster than the agricultural labor population |
| Declining | ECRmn < 0 | LCRmn < 0 | 0 < ELECmn < 1 | The agricultural labor population declines faster than the agricultural economy |
Figure 2 Spatio-temporal patterns of agricultural labor change at the county level in China for 1991-2010 |
Figure 3 Spatio-temporal patterns of agricultural economic growth at the county level in China for 1991-2010 |
Table 2 Changes in the ELEC and corresponding coupling types at the county level in China for 1991-2010 |
| ECR | Coupling type | LCR | ELEC | 1991-2000 | 2000-2010 | 1991-2010 |
|---|---|---|---|---|---|---|
| ECR > 0 | Growth | LCR > 0 | ELEC > 1 | 701 (34.63%) | 607 (29.99%) | 669 (33.05%) |
| Extensive | LCR > 0 | 0 < ELEC < 1 | 160 (7.91%) | 83 (4.1%) | 34 (1.68%) | |
| Intensive | LCR < 0 | ELEC < 0 | 980 (48.42%) | 1257 (62.1%) | 1292 (63.83%) | |
| ECR < 0 | Lagged | LCR > 0 | ELEC < 0 | 99 (4.89%) | 18 (0.89%) | 9 (0.44%) |
| Fading | LCR < 0 | ELEC > 1 | 23 (1.14%) | 22 (1.09%) | 8 (0.4%) | |
| Declining | LCR < 0 | 0 < ELEC < 1 | 61 (3.01%) | 37 (1.83%) | 12 (0.59%) |
Note: Data outside the parentheses refers to the number of counties belonging to a certain type; data inside the parentheses refers to the proportion of counties belonging to a certain type relative to the total number of counties. |
Figure 4 ELEC spatio-temporal patterns at the county level in China for 1991-2000 (a. ECR>0; b. ECR<0) |
Figure 5 ELEC spatio-temporal pattern at the county level in China for 2000-2010 |
Figure 6 ELEC spatio-temporal patterns at the county level in China for 1991-2010 |
Table 3 The transfer matrix of the ELEC types at the county level in China for 1991-2010 (%) |
| 2000-2010 (T2) | P1 | Decrease | ||||||
|---|---|---|---|---|---|---|---|---|
| Growth | Extensive | Intensive | Lagged | Fading | Declining | |||
| 1991-2000 (T1) | ||||||||
| Growth | 13.59 | 0.64 | 19.12 | 0.25 | 0.40 | 0.64 | 34.63 | 21.05 |
| Extensive | 1.88 | 0.20 | 5.58 | 0.05 | 0.10 | 0.10 | 7.91 | 7.71 |
| Intensive | 12.15 | 3.01 | 31.23 | 0.44 | 0.54 | 1.04 | 48.42 | 17.19 |
| Lagged | 1.63 | 0.10 | 2.96 | 0.1 | 0.00 | 0.05 | 4.89 | 4.74 |
| Fading | 0.15 | 0.05 | 0.94 | 0.00 | 0.00 | 0.00 | 1.14 | 1.14 |
| Declining | 0.59 | 0.10 | 2.27 | 0.00 | 0.05 | 0.00 | 3.01 | 3.01 |
| P2 | 29.99 | 4.10 | 62.10 | 0.89 | 1.09 | 1.83 | 100 | |
| Increase | 16.40 | 3.90 | 30.88 | 0.74 | 1.09 | 1.83 | ||
Note: The number in the transfer matrix indicates that the proportion of counties transformed from one coupling type to the other in the total counties belonging to the former type. |
Table 4 ELEC coupling characteristics and rural vitalization paths |
| Type of economic development | Coupling type | Spatial distribution | Basic feature | Vitalization path |
|---|---|---|---|---|
| Agricultural economic growth area | Growth | Mainly distributed in western Sichuan, Qinghai-Tibet, Xinjiang, Gansu, most of Inner Mongolia, and northeast China | Physical and geographical location conditions are relatively poor; lacking substantial progress in industrial adjustment; heavily dependent on resources | Accelerating transformation of the industrial structure; moderately guiding land scale management; actively cultivating new management types; strengthening the construction of rural professional talent |
| Extensive | Mainly distributed in western Sichuan, Qinghai-Tibet, Xinjiang, and some counties in Heilongjiang | Physical and geographical location conditions are relatively poor; deep poverty; unclear industrial development orientation | Strengthening policy guidance and support; determining regional functions and highlighting comparative advantages; cultivating new types of rural industries; encouraging diversified economy | |
| Intensive | Mainly distributed in the Huang-Huai-Hai Plain, Yangtze River Delta, Pearl River Delta, middle and lower reaches of the Yangtze River, parts of Sichuan and Chongqing and the Loess Plateau | Rapid economic development, high levels of urbanization and agricultural modernization; core areas for economic growth and high population density | Improving the quality of agricultural development; constructing special towns; promoting the integrated development of rural industries; strengthening grassroots governance and institutional innovation | |
| Agricultural economic decline area | Lagged | Centrally distributed on the edge of the Tibet Autonomous Region | Poor physical and geographical location, infertile soil unfavorable for agricultural production; deep poverty; backward ideas, low labor quality and poor labor skills | Reinforcing infrastructure construction and capital investment; cultivating new agricultural management types; emphasizing rural education; attracting talent to return and restructure their hometowns |
| Fading | ||||
| Declining |
The authors have declared that no competing interests exist.
| [1] |
|
| [2] |
|
| [3] |
|
| [4] |
|
| [5] |
|
| [6] |
|
| [7] |
|
| [8] |
|
| [9] |
|
| [10] |
|
| [11] |
|
| [12] |
|
| [13] |
|
| [14] |
|
| [15] |
|
| [16] |
|
| [17] |
|
| [18] |
|
| [19] |
|
| [20] |
|
| [21] |
|
| [22] |
|
| [23] |
|
| [24] |
|
| [25] |
|
| [26] |
|
| [27] |
|
| [28] |
|
| [29] |
|
| [30] |
|
| [31] |
|
| [32] |
|
| [33] |
|
| [34] |
|
| [35] |
|
| [36] |
|
| [37] |
|
| [38] |
|
/
| 〈 |
|
〉 |