Research Articles

Glacier and snow variations and their impacts on regional water resources in mountains

  • DENG Haijun , 1, 2, 3, 4 ,
  • CHEN Yaning 3 ,
  • LI Yang 5
Expand
  • 1. Fujian Provincial Engineering Research Center for Monitoring and Assessing Terrestrial Disasters, Fuzhou 350007, China
  • 2. State Key Laboratory Breeding Base of Humid Subtropical Mountaisn Ecology, Fuzhou 350007, China
  • 3. State Key Laboratory of Desert and Oasis Ecology, Xinjiang Institute of Ecology and Geography, CAS, Urumqi 830011, China
  • 4. College of Geographical Sciences, Fujian Normal University, Fuzhou 350007, China
  • 5. Nuclear and Radiation Safety Center, Beijing 100082, China

Author: Deng Haijun (1987-), PhD, specialized in climate and hydrological processes in mountains.E-mail:

Received date: 2018-05-05

  Accepted date: 2018-06-08

  Online published: 2019-01-25

Supported by

National Natural Science Foundation of China, No.41807159

Copyright

Journal of Geographical Sciences, All Rights Reserved

Abstract

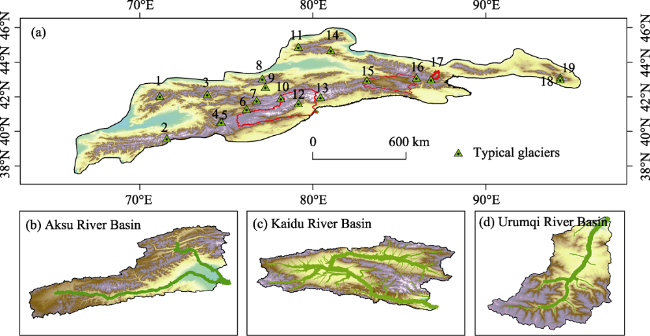
Glaciers and snow are major constituents of solid water bodies in mountains; they can regulate the stability of local water sources. However, they are strongly affected by climate change. This study focused on the Tianshan Mountains, using glacier and snow datasets to analyse variations in glaciers, snow, water storage, and runoff. Three typical river basins (Aksu, Kaidou, and Urumqi Rivers) were selected to interpret the impacts of glacier and snow changes on regional water resources in the Tianshan Mountains. The results exhibited a nonlinear functional relationship between glacial retreat rate and area, demonstrating that small glacial retreat is more sensitive under climate change. Further, the glacial retreat rate at the low-middle elevation zone was seen to be faster than that at the high elevation zone. The regional average terrestrial water storage (TWS) decrease rate in the Tianshan Mountains was -0.7±1.53 cm/a during 2003-2015. The highest TWS deficit region was located in the central part of the Tianshan Mountains, which was closely related to sharp glacial retreats. The increases in glacier and snow meltwater led to an increase in runoff in the three typical river basins, especially that of the Aksu River (0.4×10⁸ m3/a). The decreasing and thinning of areas, and increasing equilibrium line altitude (ELV) of glaciers have been the major causes for the decrease in runoff in the three river basins since the mid-1990s. Therefore, the results reveal the mechanisms causing the impacts of glaciers and snow reduction in mountains on regional water resources under climate change, and provide a reference for water resources management in the mountainous river basins.

Cite this article

DENG Haijun , CHEN Yaning , LI Yang . Glacier and snow variations and their impacts on regional water resources in mountains[J]. Journal of Geographical Sciences, 2019 , 29(1) : 84 -100 . DOI: 10.1007/s11442-019-1585-2

1 Introduction

Global warming has driven and will continue to drive glacial retreat and influence regional water resources in mountains (Hansen et al., 2006; Immerzeel et al., 2010; Jacob et al., 2012; Lutz et al., 2014; MRI, 2015), and it is also a great concern to society. Glacial retreat and snowmelt in mountains will limit water resources utilization (Immerzeel et al., 2010; Chen et al., 2017) due to both glacial retreat (Shen et al., 2009; Gao et al., 2010) and the terrestrial water storage deficit (Deng and Chen, 2017); and more solar radiation will be absorbed due to the reduction in surface albedo caused by the decrease in glacier and snow coverage. This will then cause rapid cryosphere warming, further intensifying ablation and snowmelt (MRI, 2015).
Calculating terrestrial water storage (TWS) in mountains is a challenge because observation stations are sparse and records are short, therefore, most mountain regions have no data. The traditional method of estimating TWS uses the water balance equation (ΔS=P-E-R, where ΔS is water storage, P is precipitation, E is evapotranspiration, and R is runoff), however, this is limited by observation data. Therefore, using this method to estimate TWS in basins with no data increases uncertainty. In March 2002, the United States and Germany collaborated to develop and launch the gravity recovery and climate experiment (GRACE) satellite mission (http://www.csr.utexas.edu/grace/) to provide all-weather, continuous, and high resolution datasets for calculating TWS. Since GRACE’s launch, the data it has produced has been widely used in hydrological research, for example, for analyzing variations in TWS (Schmidt et al., 2006; Xavier et al., 2010; Lee et al., 2011), monitoring glacier mass balance (Matsuo and Heki, 2010), estimating evapotranspiration (Rodell et al., 2004), determining changes in groundwater (Rodell et al., 2009), and monitoring droughts (Chen et al., 2005).
The Tianshan Mountains are located in the innermost part of the Eurasian continent, stretching for roughly 2500 km from east to west, and spanning averagely from 250 km to 350 km in a north-south direction (Chen et al., 2016). It endures more precipitation than the surrounding desert area due to westerly water vapour (Yao et al., 2013). Glaciers are widespread in this region, constituting one of the main glacial areas in the mid-latitude zone. It also protects water resources for socio-economy, oasis agriculture, and the eco-environment in Central Asia (Chen et al., 2016). The glaciers are mainly distributed between 2800 m and 7400 m, covering a total area of roughly 13,566.6 km2 with a volume of approximately 1840 km3 (Aizen et al., 2008). Glaciers have been retreating due to warming over the past 50 years (Farinotti et al., 2015). Since the 1970s, the glacial area of the Tianshan Mountains has decreased by 8.5% (Aizen et al., 2011), but there are significant regional differences (Chen et al., 2016). Glacial retreat has affected the hydrological characteristics of rivers, water resources, the eco-environment, and socio-economic development in Central Asia.
In this study, we focus on climate change in mountains and its impact on their hydrologic process. First, we describe the spatio-temporal variations of glaciers and snow in the Tianshan Mountains (see sections 4.1 and 4.2). We then analyse the influence of glaciers and snow melt on regional water resources. Section 2 describes the study area, data, and methods. Section 3 describes the theory of this study. Section 4 focuses on variations in glacier and snow cover and their impact on water resources, and section 5 presents our conclusions.

2 Methods

2.1 Study area

The Tianshan Mountains lie in the heartland of Eurasia within 37°N-46°N and 66°E-96°E (Figure 1). The mountains cover numerous climatic vertical zones with a large glacier area. The types of glaciers in the Tianshan Mountains range from large valley and dendritic glaciers to small lobes and niche glaciers (Aizen et al., 2011). Large valley glaciers form 82% of the total glacial area. According to the latest World Catalogue of Glaciers (RGI 5.0) (Pfeffer et al., 2014), there are 10,778 glaciers in the Tianshan Mountains, covering a total area of ​​approximately 13,566.6 km2, of which the largest single glacial area is 373.92 km2, and the smallest single glacial area is only 0.079 km2. The single longest glacier is 61445 m, and the single shortest glacier is only 230 m. There are 8264 glaciers covering ​​less than 1 km2, accounting for 76.67% of the total number of glaciers; 2397 with an area of ​​1-10 km2, accounting for 22.23% of the total number of glaciers; 110 with an area of ​​10-100 km2; and only seven covering an area larger than 100 km2. Therefore, small glaciers predominate the Tianshan Mountains. In this study, we selected the Aksu, Kaidu, and Urumqi river basins as typical examples (Figure 1). The common feature of these basins is that they all originate from glaciers and snow-covered regions, and glacier and snowmelt accounts for a large proportion of river runoff. There are also large areas of cultivated land in the downstreams of these rivers (Xu et al., 2013). The studied basins are representative of the arid region of northwest China.
Figure 1 The Tianshan Mountains

2.2 Data

2.2.1 Glaciers and snow data
The glacial area data were obtained from the latest Randolph Glacier Inventory dataset RGI 5.0 (Pfeffer et al., 2014), and the glacial mass balance data from 1961 to 2010 were obtained from the literature (Farinotti et al., 2015). In addition, the glacial area change data of 19 typical watersheds (or glaciers) were gathered from literature (Narama et al., 2010; Zemp et al., 2012; Hagg et al., 2013; Kriegel et al., 2013; Wang et al., 2013; Zemp et al., 2013; Barandun et al., 2014; Xie and Jiang, 2014; He et al., 2015; Huai et al., 2015; Kaldybayev et al., 2016). The glacier area change data in the Aksu, Kaidu, and Urumqi river basins were derived from the China Glacier Inventory (CGI) of the West Data Central (Guo et al., 2014; Liu et al., 2015) (availableat http://westdc.westgis.ac.cn/).
2.2.2 GRACE data
The GRACE data were provided by the Jet Propulsion Laboratory (JPL, available at https://grace.jpl.nasa.gov/data/get-data/jpl_global_mascons/) of the California Institute of Technology. In this study, the datasets are gridded at 0.5º×0.5º, and they cover a time range from January 2003 to December 2015. Data for 13 months were missing (June 2003; January and June 2011; May and October 2012; March, August, and September 2013; February and December 2014; June, October, and November 2015), which were interpolated based on the multi-year cumulative averages of the missing months and adjacent months (Long et al., 2015).
2.2.3 Runoff data
The monthly runoff data from 1960-2010 used here were provided by the hydrological stations in the three river basins (Figure 1), specifically, the Sharikilank and Xiehera stations in the Aksu River Basin, the Dashankou station in the Kaidu River Basin, and the Yingxiongqiao station in the Urumqi River Basin.

2.3 Analytical methods

2.3.1 Mann-Kendal nonparametric tests
In this study, Mann-Kendal (M-K) nonparametric tests were applied to assess the significance of air temperature, precipitation, snow cover, and terrestrial water storage (TWS) trends in the Tianshan Mountains (Hirsch and Slack, 1984). The slope of a trend was estimated using Sen’s nonparametric trend estimator (Sen, 1968).
2.3.2 Terrestrial water storage calculation
The method of retrieving variations in TWS from the GRACE data can be divided into two stages: the first stage is 2002-2013, and the standard spherical harmonic method (Wahr and Molenarr, 1998) is the most commonly used method. This method inputs the global observation data from gravity satellites into a gravity model (Zou et al., 2016), and then calculates variations in TWS. After this, a new method, the Mascons (mass concentration blocks) approach (for details see Watkins et al., 2015), was followed to calculate the variations in TWS based on the variability in the inter-satellite distance (Watkins et al., 2015). The characteristics of this method are helpful for eliminating noise originating outside of the region of interest (ROI) (Guo et al., 2014; Zou et al., 2016).
The Mascons approach was also used to calculate the changes in TWS in the Tianshan Mountians during 2003-2015. The Earth’s oblateness scales (C20) coefficients were replaced to reduce uncertainty from the native GRACE-C20 values (Chen et al., 2005; Cheng et al., 2013), and the degree-1 coefficients were estimated using the method presented by Swenson (2008). A glacial isostatic adjustment (GIA) correction was then applied to the model (Geruo et al., 2013) to remove glacial rebound effects, especially in mountainous regions and high-latitude areas. The data anomalies’ base period is from January 2004 to December 2009, because there are no missing values in this period. Finally, the scaling factors were applied to the data covering the study area, and the scale-corrected time series was calculated as follows:
g'(x,y,t) = g(x,y,t) * s(x,y) (1)
where x is longitude, y is latitude, t is time (months), g(x,y,t) is the grid surface mass change value, and s(x,y) is the scaling grid. The scaling factors are provided by the JPL’s website (https://grace.jpl.nasa.gov/data/get-data/jpl_global_mascons/).
The uncertainty estimates approach used in this study is described in Wahr et al. (2006).
2.3.3 CV value
The coefficient of variation (CV value) for runoff volumeis an important indicator when evaluating the inter-annual variability of runoff (Li, 1982). The CV value is closely related to the variability of precipitation. In general, small CV values occur in humid areas, and larger CV values occur in arid and semi-arid areas.

3 Theoretical framework

Mountainous areas are unique geographical units that play an important role in natural regional environmental change. Modern glaciers are well-established and act as “water towers”, providing water resources protection for the eco-environmental and socio-economic development in mountainous and downstream areas (Immerzeel et al., 2010). Glaciers and snow buffer the hydrological processes in mountain basins (Deng et al., 2017), regulating the instability of runoff caused by variability in precipitation. The main characteristic of global climate change is the significant increase in temperature since the mid-20th century, which has accelerated the melting of snow and ice in mountainous areas (Liu et al., 2003; Aizen, 2011; Jacob et al., 2012; Farinotti et al., 2015; Paul et al., 2015). Thus, mountain regions have received worldwide attention.
The theoretical framework of this paper is based on the relationship of the “Atmosphere-Cryosphere-Hydrosphere” to explore the mechanisms causing the impact of climate change on regional water resources in mountainous areas. As shown in Figure 2, the process can be divided as follows:
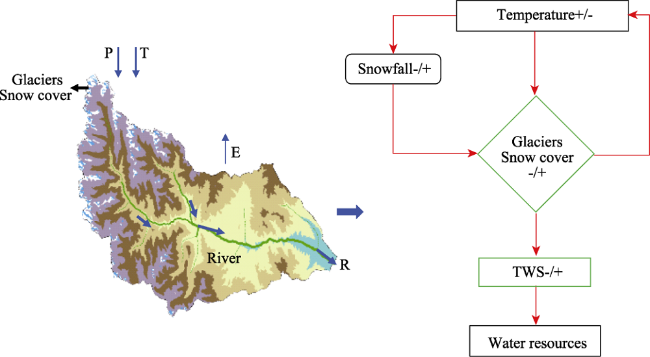
Figure 2 Sketch map of the theoretical framework in this study (P: precipitation, T: temperature, E: evapotranspiration, R: runoff, and TWS: terrestrial water storage)
(1) If the mountainous areas are dominated by warming, the form of precipitation will change from snowfall to rainfall (Berghuijs et al., 2014; Deng et al., 2017), so snowfall will decrease, leading to a decrease in material sources for the accumulation of glaciers and snowpack. At the same time, the increasing temperatures have also directly accelerated glacial and snow melting in mountains. These results cause glacier and snow ablation in the mountainous areas to increase beyond the accumulation rate, causing mountain water storage to decrease, further affecting the water resources in the river basin. In addition, the melting of glaciers and snow will reduce the albedo in the original glaciers and snow-covered areas, thereby increasing the absorption of solar radiation and accelerating the increase in temperature and melting of glaciers and snow in the mountains. Therefore, this process amplifies warming in the mountainous areas.
(2) If the mountainous areas are dominated by cooling, snowfall will increase, and suppress glacier and snow ablation, causing the accumulation of solid water bodies in mountainous areas to increase beyond the ablation. Meanwhile, the albedo will also increases as the ​​glaciers and snow-covered areas increases, which would decrease the amount of solar radiation absorbed by the cryosphere, slow the rate of temperature increase in the mountainous areas, and suppress glacier and snow melting in the mountains. Therefore, this process suppresses warming in the mountains.

4 Results and discussion

4.1 Glacier changes

Glacial retreat differs significantly at different elevations. Figure 3a shows that the glacial retreat rate decreased as elevation increased owing to the lower temperature at higher elevations. The highest glacial retreat rate is -2.3×10³ kg/(m2•a),which occurred below 3000 m (Figure 3a). The glacial retreat rate at 3000-4000 m is approximately -0.6103 kg/(m2•a). The glacier retreat rate at 4000-5000 m is approximately -0.3×10³ kg/(m2•a), and that above 5000 m is very small (Figure 3a). Therefore, the area between 3000 m and 4000 m should be a key monitoring region for the glacial mass balance, because most glaciers are distributed in this region in the Tianshan Mountains (Chen et al., 2016).
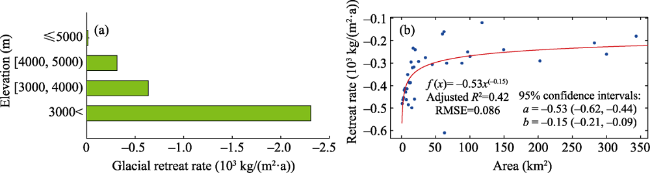
Figure 3 Glacier variations in the Tianshan Mountains during 1961-2012 (datasets provided by Farinotti et al., 2015), (a) the glacial retreat rate at different elevation bands; (b) the glacial retreat rate in different areas fitted with the function f(x)=a×xb.
Different glaciers exhibit different response levels to climate change. To understand the relationship between glacier area and retreat rate, the glacier area was divided into different grades. These grades are as follows: glaciers smaller than 10 km2 had 1 km2 per grade, because most glaciers were within this range; glaciers between 10 km2 and 50 km2 had 10 km2 per grade, and glaciers larger than 50 km2 were not classified. The average rate of glacial retreat for each grade was then calculated, and the relationship between glacier area and retreat rate was fitted by exponential function f(x)=a×xb (where x is the glacier area, and a and b are fitting parameters). The function fitting result is f(x) = -0.53×x-0.15, the 95% confidence intervals for a and b are -0.53 (-0.62, -0.44) and -0.15 (-0.21, -0.09), respectively, the adjusted R2 is 0.42, and the RMSE is 0.086. This indicates that the function fitting result is good, and the functional relationship demonstrates that the glacial retreat rate is inversely related to glacier area (Figure 3b). That is, small glaciers are more sensitive to climate change, while large glaciers are relatively stable. For glaciers larger than 50 km2, the retreat rate is stable at -0.3×10³ kg/(m2•a) (Figure 3b). However, 98% of the glaciers in the Tianshan Mountains are smaller than 10 km2, so glacial ablation will significantly impact regional water resources.
To elucidate the characteristics of glacial retreat in the Tianshan Mountains, the glacial retreat of 19 typical basins (or glaciers) was analysed (Figure 1). The results indicated that the annual average glacial retreat rate in the west is faster than that in the east during the 1960s/70s-2000 (Table 1), but the rate was faster in the east than that in the west during 2000-2010. Interestingly, likely bounded by the longitude of 79°E, of the ten glaciers in the west, six glaciers were retreating faster during the 1960s/70s-2000 than they were in the 2000-2010 period, but the nine glaciers in the east were all retreating faster during 2000-2010 than they were in the 1960s/70s-2000 (Figure 1 and Table 1).
Table 1 Variations in glacier area in the typical river basins (or glaciers) of the Tianshan Mountains during the 1960s/70s-2010; the glacial serial number in this table is consistent with that in Figure 1
ID Basins
(or glaciers)
1960s/70s-2000 (km2/a) 2000-2010 (km2/a) 1960s/70s-2000 (%/a) 2000-2010 (%/a) Reference sources
1 Pskem -1.08 -1.11 -0.52 -0.63 Narama et al., 2010
2 Abramov -0.02 -0.01 -0.08 -0.04 Barandun et al., 2015
3 Lower Nargn -0.29 -0.23 -0.35 -0.30 Kriegel et al., 2013
4 At-BashiKirkasi -1.06 -0.13 -0.70 -0.10 Kriegel et al., 2013
5 SE-Fergana -0.66 0.00 -0.27 0.00 Narama et al., 2010
6 At-Bashy -0.39 -0.51 -0.35 -0.50 Narama et al., 2010
7 Dzhetim -6.12 -4.51 -1.15 -1.10 Hagg et al., 2013
8 Tuyuksuyskiy -0.02 -0.02 -0.56 -0.82 Zemp et al., 2012, 2013
9 Lli-Kungoy -2.19 -2.83 -0.35 -0.50 Narama et al., 2010
10 Akshiirak -1.22 -0.18 -0.60 -0.10 Hagg et al., 2013
11 Karatal river -1.71 -1.17 -0.86 -0.96 Kaldybayev et al., 2016
12 Tomr -0.32 -0.47 -0.08 -0.11 Huai et al., 2015
ID Basins
(or glaciers)
1960s/70s-2000 (km2/a) 2000-2010 (km2/a) 1960s/70s-2000 (%/a) 2000-2010 (%/a) Reference sources
13 West -11.24 -13.85 -0.50 -0.65 He et al., 2015; Wang et al., 2013
14 North -1.47 -3.52 -0.44 -1.10
15 West-central -0.73 -0.72 -1.33 -1.51
16 East-central -4.87 -8.61 -0.88 -1.71
17 Urumqi
glacier No.1
-0.004 -0.01 -0.29 -0.59 Zemp et al., 2012, 2013; He et al., 2015; Wang et al., 2013
18 East -0.38 -0.80 -0.31 -0.68 He et al., 2015; Wang et al., 2013
19 Miaoergou -0.01 -0.03 -0.34 -0.80 Xie and Jiang, 2014
The glacier mass balance is strongly negative in the Tianshan Mountains. The Tuyuksuyskiy Glacier in the western region was analysed from 1957 to 2012, and the Urumqi River’s No. 1 Glacier in the eastern region was analysed from 1980 to 2012. The two glaciers are numbered 17 and 8 in Figure 1, respectively. The results show that the Tuyuksuyskiy Glacier exhibited a negative mass balance during 1957-2012, with an annual average mass balance of -13.44 mm/a (Figure 4a). The Urumqi River's No. 1 glacier also exhibited a negative mass balance, with an average annual mass balance of -17.18 mm/a (Figure 4b). The cumulative mass balance results show that the Tuyuksuyskiy Glacier was thinned by approximately 25 m during 1957-2012 (Figure 4a), and the Urumqi River’s No.1 glacier was thinned by approximately 15 m during 1980-2012 (Figure 4b).
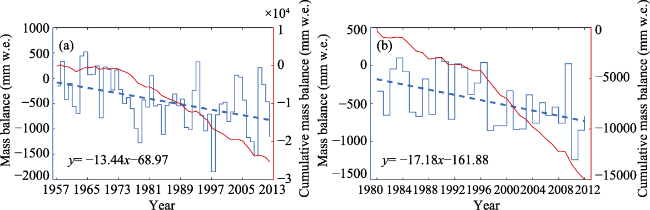
Figure 4 Analysis of glaciers mass balances, a) mass balance change of the Tuyuksuyskiy Glacier during 1957-2012; b) mass balance in the Urumqi Glacier No.1 during 1980-2012

4.2 Snow cover changes

Snow is an important part of the global cryosphere, and plays an important role in global climate change and the water and energy cycles. Snow coverage has a significant impact on the regional climate due to various factors, such as the energy exchange during the snow phase transition process, the adiabatic effect of the snow layer, and seasonal ablation and accumulation. There are large areas of seasonal and permanent snow cover in the Tianshan Mountains (Li et al., 2012). Therefore, a detailed analysis of snow coverage changes in the Tianshan Mountains is vital for understanding regional water resources changes.
Changes in snow cover are mainly caused by solar radiation in mountainous areas. According to the MODIS snow cover data, the largest extent of snow cover in the Tianshan Mountains generally occurs in January, and the smallest occurs in July. The maximum snow cover in 2004 was 84.9%, while the minimum snow cover was 2.59% in 2009 (Figure 5). The maximum snow decreased at a rate of 0.44%/a from 2002 to 2013, and the minimum snow cover also decreased at a rate of 0.01%/a (equal to -47 km2/a) (Figure 5). The rapid decline of the maximum snow cover in the Tianshan Mountains is caused by the acceleration of snowpack melt and decrease in snowfall in low-elevation regions due to climate change.
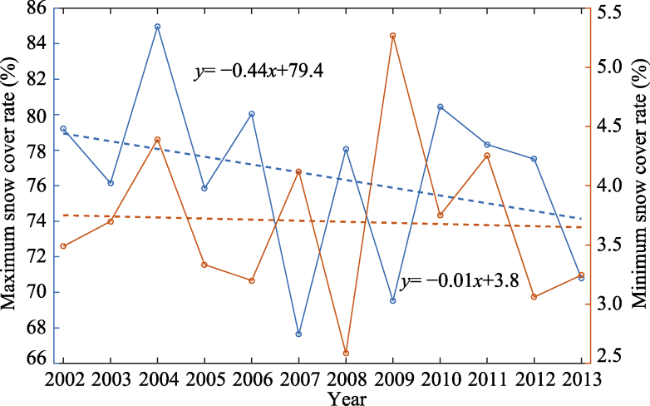
Figure 5 Variations in the maximum and minimum snow cover rates in Tianshan Mountains during 2002-2013
The duration of snow cover in the Tianshan Mountains, which is the length of time from the maximum snow cover to the minimum snow cover, i.e., the residence time of snow on the ground throughout the year, shortened. Snow cover acts as a buffer in the hydrological system and can mitigate the effects of climate change on hydrology. If the snow cover duration is long, then snow exerts a greater effect on the regulation of the hydrological system, while the opposite is also true. The results show that snow cover duration decreased by eight days, from 216 in 2002 to 208 in 2013 (Table 2). A shorter of snow cover duration weakens the buffering effect of snow on the hydrological system, increasing the variability of water resources in the Tianshan Mountains, which will have adverse effects on the utilisation of water resources in oasis regions.
Table 2 Days of snow cover in the Tianshan Mountains during 2002-2013. Max is the date of maximum snow cover in the year, Min is the date of minimum snow cover in the year, and days is the days between the maximum and minimum snow cover
Year Max Min Days Year Max Min Days
2002 2002017 2002233 216 2008 2008049 2008209 160
2003 2003065 2003249 184 2009 2009001 2009201 200
2004 2004017 2001193 176 2010 2010041 2010225 184
2005 2005001 2005209 208 2011 2011041 2011209 168
2006 2006017 2006209 192 2012 2012017 2012225 208
2007 2007001 2007201 200 2013 2013009 2013217 208

4.3 TWS variations

4.3.1 Spatiotemporal analysis
There are significant spatial differences in the inter-annual changes in TWS in the Tianshan Mountains (Figure 6a). The decrease in TWS for most areas in the Tianshan Mountains is smaller than -1 cm/a, but the central area exhibits a sharp decrease in TWS, reaching -8 to -6 cm/a. This rate is alarming, and may be related to the sharp retreat of glaciers in this region (Deng and Chen, 2017).
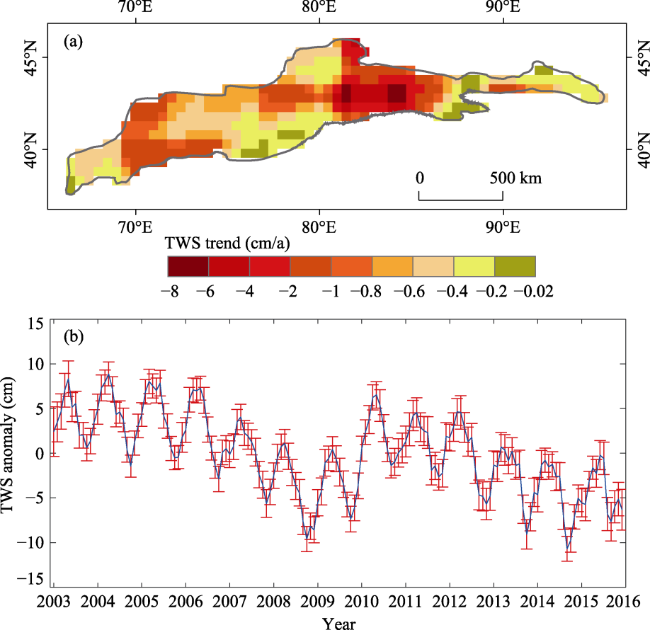
Figure 6 Variations in TWS in the Tianshan Mountains during 2003-2015 (a is the spatial variation of TWS, b is the time series of TWS, the blue line is the TWS-Mascons value, and the red line represents the uncertainty.)
The average rate of TWS decrease in the Tianshan Mountains during 2003-2015 was approximately -0.7 ± 1.53 cm/a (Figure 6b), with an uncertainty of approximately 1-2 cm. The main sources of uncertainty are measurement and leakage errors, and the effects of atmospheric quality disturbances and glacial mass rebound.
Seasonal differences in the accumulation and ablation of glaciers and snow in mountainous areas have led to seasonal variations in TWS. The results of TWS in Figures 7a1 and 7a2 show positive anomalies in the spring and negative anomalies in the autumn. The positive anomaly of TWS in the spring is caused by the accumulation of the solid water body (i.e., glaciers and snow) during the winter; the maximum accumulation is reached in the spring, thus, this season exhibited a positive TWS anomaly. Similarly, ablation progressed in the summer and reached its maximum accumulation in the autumn, so TWS exhibited a negative anomaly in autumn. The winter and summer are in the transitional stages of positive and negative anomalies owing to the inter-annual differences in temperature and precipitation. Meanwhile, TWS decreased in all seasons due to the melting of glaciers and snow under global warming. Figure 7b indicates that TWS in Tianshan Mountains mainly exhibited positive anomalies before 2007, but after 2013, the anomalies were mostly negative. Based on the inter-annual monthly changes, the TWS exhibits positive anomalies in the winter and negative anomalies in the summer. In addition, Figure 7b shows that the inter-annual monthly trends of TWS anomalies are also decreasing.
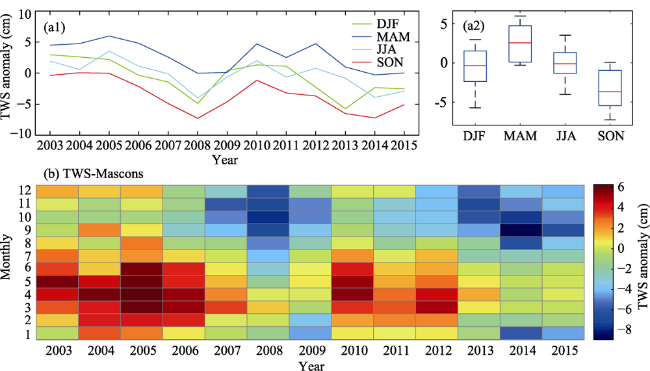
Figure 7 The TWS variations in the Tianshan Mountains at seasonal and monthly scales during 2003-2015 (a1 and a2 show the seasonal scale, and b shows the monthly scale.)
4.3.2 Cause diagnosis
There are many observation stations in low-elevation regions, but few in the mountains. Therefore, we used the APHRO-Temperature dataset (Yatagai et al., 2012) to analyse temperature trends in the Tianshan Mountains. Figure 8a shows that the temperature is increasing in the east, at a rate of 0.02-0.04°C/a, while it is decreasing at a rate of -0.016-0 °C/a in the west.
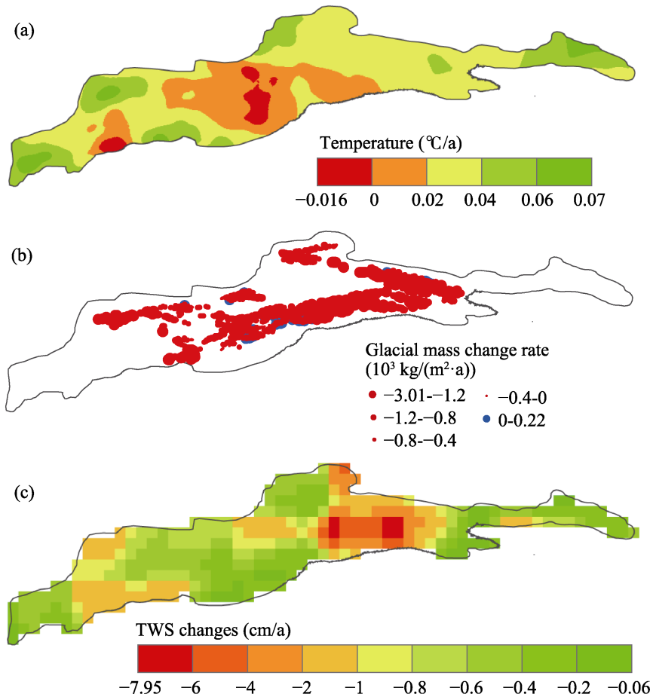
Figure 8 Variations in annual mean temperature, glaciers, and TWS in the Tianshan Mountains (a is the variation in annual mean temperature during 1961-2010, b is the glacier mass balance change rate during 1961-2012, and c is the variations in TWS during 2003-2015.)
The spatial differences in glaciers and snow changes are caused by spatial differences in temperature changes in the Tianshan Mountains (Figure 8). Glacier changes are more sensitive to temperature than precipitation in mountains (Liu et al., 1999; Sheng et al., 2009). The glacial retreat rate in the central area was -3.01 to -1.2×10³ kg/(m2•a), while that in the western area was -1.2 to -0.4×10³ kg/(m2•a). Some glaciers in the western part are increasing in size at a rate of 0 to 0.22×10³ kg/(m2•a). Glaciers are the most important component of TWS in the Tianshan Mountains (Chen et al., 2016). Therefore, TWS decreased as the glaciers retreated, for example, the sharp glacial retreat in the central region (Figure 8b) caused the TWS change rate reach -7.95 to -4 cm/a (Figure 8c). Although warming is more rapid in the east (Figure 8a), the declining rate of TWS is relatively small (Figure 8c) as the glaciers cover a small area while the others exist at higher elevations (Li et al., 2014). Therefore, even if the temperature is increasing, glacial retreat is relatively slow under warming, the decline in TWS is also slow.

4.4 Variations in runoff

The CV values in Table 3 for all three basins are between 0.1-0.2, which is in accordance with the range of CV values for rivers supplied by glaciers and snowmelt (Yang, 1981). The glaciers and snow meltwater regulate variations in runoff in mountainous basins. The larger the proportion of glaciers in the whole basin, the more stable the inter-annual change in runoff. The results in Table 3 show that the glacier area accounted for 3.8% of the total Aksu River Basin, 2.2% of the total Kaidu River Basin, and 2.75% of the total Urumqi River Basin. The corresponding Cv value of the Kaidu River is large, while those of the Aksu and Urumqi rivers are relatively small.
Table 3 Characteristics of runoff in the three typical river basins
Basins Area
(104 km2)
(Glacier area/basin area)*100% Annual average runoff (108 m3) Runoff sd (108 m3) Cv value
Aksu River 4.1932 3.8% 76.15 11.61 0.15
Kaidu River 1.8631 2.2% 35.53 6.78 0.19
Urumqi River 0.1114 2.75% 7.93 1.09 0.14
The runoff volume in the three basins increased from 1960 to 2010. Among them, the Aksu River Basin exhibited the largest increase rate of 0.4×10⁸ m3/a (p<0.01, Figure 9a1), followed by the Kaidu (Figure 9b1) and Urumqi river basins, which exhibited the smallest increase rate of 0.04×10⁸ m3/a (p<0.01, Figure 9c1). This is because the Urumqi River has the smallest basin area of these three sites. The first and second glacier cataloging datasets of China can be used to analyse the glacial area changes in the Aksu (the Chinese part), Kaidu, and Urumqi river basins over the past 50 years. The results show that the glacial area decreased by 29.7% in the Aksu River Basin, while those of the Kaidu and Urumqi river basins decreased by almost 64% and 57.7%, respectively. Therefore, the increase in the runoff volume of the three river basins was caused by the increase in glacier meltwater. However, runoff volume has been decreasing in the three river basins since the mid-1990s (Figures 9a1, 9b1, and 9c1).
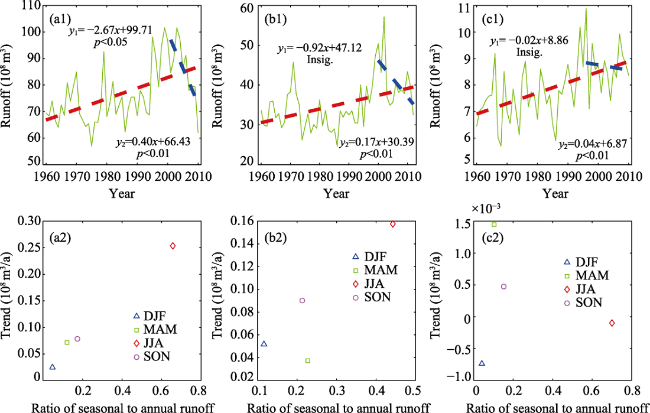
Figure 9 Runoff changes in the Aksu (a1, a2), Kaidu (b1, b2), and Urumqi (c1, c2) river basins during 1960-2010. a1, b1, and c1 refer to the annual runoff changes; a2, b2, and c2 refer to the seasonal runoff changes and the ratio of seasonal to annual runoff
Summer runoff is the largest component of annual runoff in the three river basins. The Aksu (Figure 9a2) and Urumqi (Figure 9c2) river basins exhibit the ratio of seasonal to annual runoff are all above 0.6, while that of the Kaidu River Basin is below 0.5 (Figure 9b2) because both of the greater and smaller Youledousi basins in the headwaters of the Kaidu River Basin regulate runoff. The increase in the summer runoff of the Aksu (Figure 9a2) and the Kaidu (Figure 9b2) river basins are mainly caused by the increase in glacial meltwater, however, summer runoff in the Urumqi River Basin is slightly decreasing (Figure 9c2). By comparing the first and second glacial catalogue data, the area covered by ​​glaciers in the Urumqi River Basin decreased by 57.7% (Figure 10a), and small glaciers almost disappeared. We also analysed the equilibrium line altitude (ELV) and mass balance of the Urumqi Glacier No. 1; the results show that the elevation of ELV increased from 1980 to 2012 at a rate of 3.8 m/a (Figure 10b), and the mass balance was strongly negative (Figure 10c). The Urumqi Glacier No.1 thinned by 15 m from 1980 to 2012 (Figure 4b). Therefore, the decrease in summer runoff in the Urumqi River Basin is due to the decrease in glacier meltwater caused by the reduction in the area (Figure 10a), increase in the ELV (Figure 10b), and thinning of the glacier (Figure 10c).
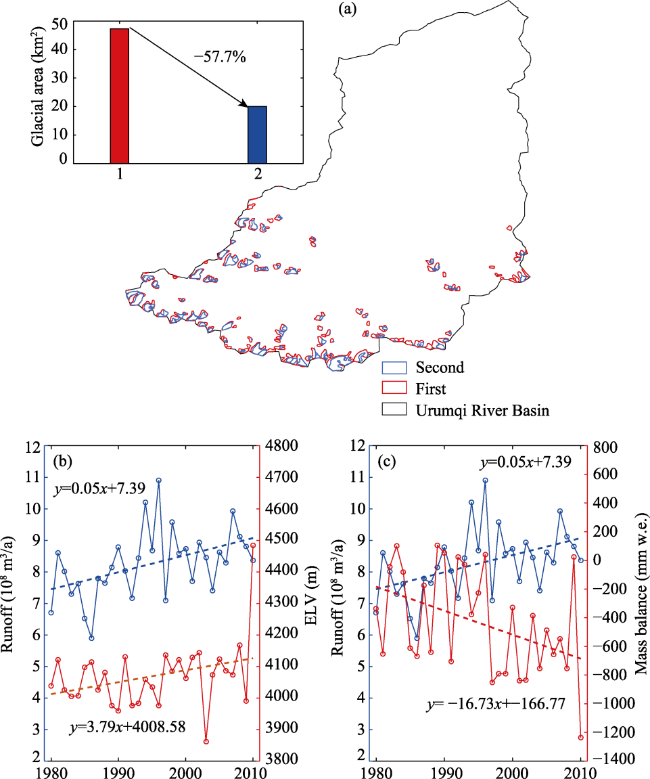
Figure 10 Relationship between glacier characteristic variations and runoff changes in the Urumqi River Basin. (a. glacial variation based on the first and second glacier inventories of China; b. comparison of changes in runoff and the ELV of the Urumqi Glacier No.1; c. comparison of the changes in runoff and mass balance of the Urumqi Glacier No.1)

5 Conclusions

Glaciers and snow are the main constituents of the solid water body in the Tianshan Mountains, and they are continuously declining. Our results indicated that small glaciers are more sensitive to climate change. The highest glacial retreat rate of -2.3×10³ kg/(m2•a) occurred at elevations below 3000 m. Snow cover also exhibited a decreasing trend, and the snow cover duration was shortened.
The rapid retreat of glaciers has accelerated the reduction in the TWS of the Tianshan Mountains, which decreased from 2003 to 2015 at 0.7±1.53 cm/a. The maximum rate of the TWS decrease is -8 to -6 cm/a in the central area of the Tianshan Mountains, which is consistent with the sharp retreat of glaciers in this region.
There is a close relationship between variations in runoff characteristics and glacial changes in the basins. Runoff increased in the three typical river basins from 1960 to 2010 due to the increase in glacial meltwater. However, runoff has decreased in the three typical river basins since the mid- 1990s due to the significant retreat of glaciers.

The authors have declared that no competing interests exist.

[1]
Aizen V, Aizen E, Surazakov A et al., 2008. Is Central Asia really exsiccated? In: Proceedings of AGU Fall Meeting, San Francisco, GC53C-07.

[2]
Aizen V, 2011. Tien Shan Glaciers. In: Singh V P, Singh P, Haritashya U K. Encyclopedia of Snow, Ice and Glaciers. Dordrecht and Netherlands: Springer, pp.1179.

[3]
Barandun M, Huss M, Sold L et al., 2015. Re-analysis of seasonal mass balance at Abramov Glacier 1968-2014. Journal of Glaciology, 61(230): 1103-1117.Abramov glacier, located in the Pamir Alay, Kyrgyzstan, is a reference glacier within the Global Terrestrial Network for Glaciers. Long-term glaciological measurements exist from 1968 to 1998 and a mass-balance monitoring programme was re-established in 2011. In this study we re-analyse existing mass-balance data and use a spatially distributed mass-balance model to provide continuous seasonal time series of glacier mass balance covering the period 1968 2014. The model is calibrated to seasonal mass-balance surveys and then applied to the period with no measurements. Validation and recalibration is carried out using snowline observations derived from satellite imagery and, after 2011, also from automatic terrestrial camera images. We combine direct measurements, remote observations and modelling. The results are compared to geodetic glacier volume change over the past decade and to a ground-penetrating radar survey in the accumulation zone resolving several layers of accumulation. Previously published geodetic mass budget estimates for Abramov glacier suggest a close-to-zero mass balance for the past decade, which contradicts our results. We find a low plausibility for equilibrium conditions over the past 15 years. Instead, we suggest that the glacier sensitivity to increased summer air temperature is decisive for the substantial mass loss during the past decade.

DOI

[4]
Berghuijs W, Woods R, Hrachowitz M et al., 2014. A precipitation shift from snow towards rain leads to a decrease in streamflow.Nature Climate Change, 4(7): 583-586.In a warming climate, precipitation is less likely to occur as snowfall. A shift from a snow- towards a rain-dominated regime is currently assumed not to influence the mean streamflow significantly. Contradicting the current paradigm, we argue that mean streamflow is likely to reduce for catchments that experience significant reductions in the fraction of precipitation falling as snow. With more than one-sixth of the Earth's population depending on meltwater for their water supply and ecosystems that can be sensitive to streamflow alterations, the socio-economic consequences of a reduction in streamflow can be substantial. By applying the Budyko water balance framework to catchments located throughout the contiguous United States we demonstrate that a higher fraction of precipitation falling as snow is associated with higher mean streamflow, compared to catchments with marginal or no snowfall. Furthermore, we show that the fraction of each year's precipitation falling as snowfall has a significant influence on the annual streamflow within individual catchments. This study is limited to introducing these observations; process-based understanding at the catchment scale is not yet provided. Given the importance of streamflow for society, further studies are required to respond to the consequences of a temperature-induced precipitation shift from snow to rain.

DOI

[5]
Chen J, Wilson C R, Tapley B D et al., 2009. 2005 drought event in the Amazon River basin as measured by GRACE and estimated by climate models.Journal of Geophysical Research: Solid Earth, 114(B5): B05404.1] Satellite gravity measurements from the Gravity Recovery and Climate Experiment (GRACE) provide new quantitative measures of the 2005 extreme drought event in the Amazon river basin, regarded as the worst in over a century. GRACE measures a significant decrease in terrestrial water storage (TWS) in the central Amazon basin in the summer of 2005, relative to the average of the 5 other summer periods in the GRACE era. In contrast, data-assimilating climate and land surface models significantly underestimate the drought intensity. GRACE measurements are consistent with accumulated precipitation data from satellite remote sensing and are also supported by in situ water-level data from river gauge stations. This study demonstrates the unique potential of satellite gravity measurements in monitoring large-scale severe drought and flooding events and in evaluating advanced climate and land surface models.

DOI

[6]
Chen J L, Rodell M, Wilson C R et al., 2005. Low degree spherical harmonic influences on Gravity Recovery and Climate Experiment (GRACE) water storage estimates.Geophysical Research Letters, 32: L14405.Author(s): Chen, J. L; Rodell, Matt; Wilson, C. R; Famiglietti, J. S | Abstract: We estimate terrestrial water storage variations using time variable gravity changes observed by the Gravity Recovery and Climate Experiment (GRACE) satellites during the first 2 years of the mission. We examine how treatment of low-degree gravitational changes and geocenter variations affect GRACE based estimates of basin-scale water storage changes, using independently derived low-degree harmonics from Earth rotation (EOP) and satellite laser ranging (SLR) observations. GRACE based water storage changes are compared with estimates from NASA's Global Land Data Assimilation System (GLDAS). Results from the 22 GRACE monthly gravity solutions, covering the period April 2002 to July 2004, show remarkably good agreement with GLDAS in the Mississippi, Amazon, Ganges, Ob, Zambezi, and Victoria basins. Combining GRACE observations with EOP and SLR degree-2 spherical harmonic coefficient changes and SLR observed geocenter variations significantly affects and apparently improves the estimates, especially in the Mississippi, Ob, and Victoria basins.

DOI

[7]
Chen Y N, Li W H, Deng H J et al., 2016. Changes in Central Asia’s Water Tower: Past, present and future.Scientific Reports, 6: 35458.

DOI

[8]
Chen Y N, Li Z, Fang G H et al., 2017. Impact of climate change on water resources in the Tianshan Mountains, Central Asia.Acta Geographica Sinica, 72(1): 18-26. (in Chinese)Changes in hydrological processes and water resources under climate change in the Tianshan Mountains of Central Asia have been investigated based on data analysis and paper review. Under the context of global warming hiatus, temperature of the Tianshan Mountains in Central Asia has been in a state of high variability, which has accelerated the melting of glacier and snow. Warming has resulted in a series of changes in water resources. Snowfall fraction decreased from 11%- 24% in 1960- 1998 to 9%- 21% in 2000- 2014, 97.25% of the glaciers retreated in the last 50 years; and water storage decreased at a rate of-3.72 mm/a during 2003-2014. Warming has led to changes in mountainous hydrological processes and water resources.The runoff in the Tianshan Mountains has increased due to the accelerated glacier/snow melt,however, the runoff will decrease in the long term under continuous warming and current precipitation conditions.

DOI

[9]
Cheng M, Tapley B D, Ries J C, 2013. Deceleration in the Earth’s oblateness.Journal of Geophysical Research: Solid Earth, 118: 740-747.1] For over three decades, satellite laser ranging (SLR) has recorded the global nature of the long-wavelength mass change within the Earth system. Analysis of the most recent time series of 30 day SLR-based estimates of Earth's dynamical oblateness, characterized by the gravitational degree-2 zonal spherical harmonic J2, indicates that the long-term variation of J2 appears to be more quadratic than linear in nature. The superposition of a quadratic and an 18.6 year variation leads to the 090008unknown decadal variation090009 reported by Cheng and Tapley (2004). Although the primary trend is expected to be linear due to global isostatic adjustment, there is an evident deceleration () in the rate of the decrease in J2 during the last few decades, likely due to changes in the rate of the global mass redistribution from melting of the glaciers and ice sheets as well as mass changes in the atmosphere and ocean.

DOI

[10]
Deng H J, Chen Y N, 2017. Influences of recent climate change and human activities on water storage variations in Central Asia. Journal of Hydrology, 544: 46-57.Monitoring glacier mass balance is crucial to managing water resources and also to understanding climate change for the arid and semi-arid regions of Central Asia. This study extracted the inter-annual oscillations of glacier mass over Central Asia from the first ten principal components (S-PCs) of filtered variability via multichannel singular spectral analysis (MSSA), based on gridded data... [Show full abstract]

DOI

[11]
Deng H J, Pepin N, Chen Y N, 2017. Changes of snowfall under warming in the Tibetan Plateau.Journal of Geophysical Research: Atmospheres, 122(14): 7323-7341.Abstract Snowfall is a critical part of the hydrological system in high-altitude regions and strongly impacted by climate change. This study uses a threshold temperature method to estimate spatial and temporal variations of snowfall at 71 stations across the Tibetan Plateau from 1960-2014. Regional air temperature and precipitation have increased by 0.039 C/yr, and 1.43 mm/yr, respectively. While warming rates have been fairly uniform across the plateau, spatial variations in snowfall trends are large, with decreases in the eastern and north-eastern areas but increases at higher elevations in the centre and west. Region wide snowfall increased during 1961-1990 and 1971-2000, but decreased in 1981-2010 and 1991-2014. Wintertime snowfall has increased but summer snowfall has decreased. These divergent trends can be explained because maximum snowfall is recorded at temperatures between 1 and 2 C. Above/below this threshold snowfall usually decreases/increases with increased warming. Although maximum snowfall temperature is a key factor to understand future snowfall changes, concurrent influences such as changing moisture sources and atmospheric circulation patterns require further research.

DOI

[12]
Farinotti D, Longuevergne L, Moholdt G et al., 2015. Substantial glacier mass loss in the Tien Shan over the past 50 years.Nature Geoscience, 8(9): 716-722.Populations in Central Asia are heavily dependent on snow and glacier melt for their water supplies. Changes to the glaciers in the main mountain range in this region, the Tien Shan, have been reported over the past decade. However, reconstructions over longer, multi-decadal timescales and the mechanisms underlying these variations-both required for reliable future projections-are not well constrained. Here we use three ensembles of independent approaches based on satellite gravimetry, laser altimetry, and glaciological modelling to estimate the total glacier mass change in the Tien Shan. Results from the three approaches agree well, and allow us to reconstruct a consistent time series of annual mass changes for the past 50 years at the resolution of individual glaciers. We detect marked spatial and temporal variability in mass changes. We estimate the overall decrease in total glacier area and mass from 1961 to 2012 to be 18 00± 6% and 27 00± 15%, respectively. These values correspond to a total area loss of 2,960 00± 1,030 km2, and an average glacier mass-change rate of 0903’5.4 00± 2.8 Gt yr0903’1. We suggest that the decline is driven primarily by summer melt and, possibly, linked to the combined effects of general climatic warming and circulation variability over the north Atlantic and north Pacific.

DOI

[13]
Gao X, Ye B S, Zhang S Q et al., 2010. Glacier runoff variation and its influence on river runoff during 1961-2006 in the Tarim River Basin, China.Science China: Earth Science, 40(5): 654-665. (in Chinese)Using monthly precipitation and temperature data from national meteorological stations, 90 m resolution DEM and a digital vector map of modern glaciers from the Chinese Glacier Inventory, the glacier mass balance and glacier runoff in the Tarim River Basin (TRB), China, were estimated based on a monthly degree-day model for 1961–2006. The results suggest that the modified monthly degree-day model can simulate the long-term changes in glacier mass balance and glacier runoff, which have been confirmed by short-term observation data and other results in literatures. The characteristics and trends of mass balance and glacier runoff variation were analyzed. It was found that the mean annual glacier mass balance during 1961–2006 was 61139.2 mm per year and the cumulative mass balance over the 46 year period was 616.4 m in the TRB. The glacier mass balance displayed a clear decreasing trend over the entire TRB during 1961–2006. The average annual glacier runoff in the TRB was 144.16×10 8 m 3 for 1961–2006. The results also show that glacier runoff has increased in the last 46 years, especially since the 1990s with 85.7% of the increased river flow being derived from the increased glacier runoff caused by loss of ice mass. Over the entire TRB, glacier runoff accounts for 41.5% of the total river flow during 1961–2006. The impact of glacier runoff on river flow has increased in the TRB as a result of glacier shrinkage.

DOI

[14]
Geruo A, Wahr J, Zhong S, 2013. Computations of the viscoelastic response of a 3-D compressible Earth to surface loading: An application to glacial isostatic adjustment in Antarctica and Canada.Geophysical Journal International, 192(2): 557-572.We develop a 3-D finite-element model to study the viscoelastic response of a compressible Earth to surface loads. The effects of centre of mass motion, polar wander feedback, and self-consistent ocean loading are implemented. To assess the model's accuracy, we benchmark the numerical results against a semi-analytic solution for spherically symmetric structure. We force our model with the ICE-5G global ice loading history to study the effects of laterally varying viscosity structure on several glacial isostatic adjustment (GIA) observables, including relative sea-level (RSL) measurements in Canada, and present-day time-variable gravity and uplift rates in Antarctica. Canadian RSL observations have been used to determine the Earth's globally averaged viscosity profile. Antarctic GPS uplift rates have been used to constrain Antarctic GIA models. And GIA time-variable gravity and uplift signals are error sources for GRACE and altimeter estimates of present-day Antarctic ice mass loss, and must be modelled and removed from those estimates. Computing GIA results for a 3-D viscosity profile derived from a realistic seismic tomography model, and comparing with results computed for 1-D averages of that 3-D profile, we conclude that: (1) a GIA viscosity model based on Canadian relative sea-level data is more likely to represent a Canadian average than a true global average; (2) the effects of 3-D viscosity structure on GRACE estimates of present-day Antarctic mass loss are probably smaller than the difference between GIA models based on different Antarctic deglaciation histories and (3) the effects of 3-D viscosity structure on Antarctic GPS observations of present-day uplift rate can be significant, and can complicate efforts to use GPS observations to constrain 1-D GIA models.

DOI

[15]
Guo F X, Xiao Y, Wang F F, 2014. Mascon inversion method of earth surface mass anomaly using GRACE range rate data.Progress in Geophysics, 29(6): 2494-2497. (in Chinese)The Mascon inversion method of Earth surface mass anomaly using GRACE rang rate data is studied in detail.Mathematical model of Mascon method is deduced and its calculating processing steps is summarized. The deduce procedure shows that because of the separated influence of different region mass anomaly on gravity field and using intersatellite range rate observation only when satellites flying over study area,the spatial and temporal resolutions can be improved.By adding the spatial and temporal constraint equation,the process result is more consistent with actual.

[16]
Guo W Q, Xu J L, Liu S Y et al., 2014. The Second Glacier Inventory Dataset of China (Version 1.0). Cold and Arid Regions Science Data Center at Lanzhou. doi: 10.3972/glacier.001.2013.db.

[17]
Hagg W, Mayer C, Lambrecht A et al., 2013. Glacier changes in the Big Naryn basin, Central Tian Shan. Global and Planetary Change, 110, Part A, 40-50.A glacier inventory referring to the year 2007 was created for the Big Naryn basin based on satellite imagery. The 507 glaciers had a total area of 471 km(2). Compared to the Soviet glacier inventory based on data from the mid 20th century, the total glacier area decreased by 23.4%. The shrinkage varies from 14% to 42% between individual mountain ranges. We discuss the possible causes for this considerable variation by analyzing and interpreting topographic parameters and differences between seven sub-regions.On three glaciers, ice thickness was derived by ground penetrating radar (GPR) measurements on the glacier tongues and by surface slope using a simplified ice mechanical approach on the upper parts. We estimate the total ice volume of the basin for both inventories using volume-area scaling. Our results show a current glacier volume of 26.0-33.3 km(3). A total of 6.6-8.4 km(3) (20%) have been lost since the mid 20th century. The water equivalent of 5.9-7.6 km(3) was transformed into excess discharge and contributed to at least 7.3-9.2% of total runoff in the considered period. (C) 2012 Elsevier B.V. All rights reserved.

DOI

[18]
Hansen J, Makiko S, Reto R et al., 2006. Global temperature change.Proceedings of the National Academy of Sciences, 103(39): 14288-14293.

DOI

[19]
He Y, Yang T B, Ji Q et al., 2015. Glacier variation in response to climate change in Chinese Tianshan Mountains from 1989 to 2012. Journal of Mountain Science, 12(5): 1189-1202.Based on the 1990, 2000 and 2011 Landsat TM/ETM+ remote sensing data, glacier information of three periods in the Chinese Tianshan Mountains were extracted by using ratio threshold method (TM3/TM5) and visual interpretation, combined with digital processing of satellite images and analysis in GIS. The climate data in the surrounding area were analyzed by using linear regression, Mann-Kendall abrupt test, and Morlet wavelet analysis. Study results showed that: over the 23 years investigation, the glacier areas have markedly decreased. In the last 12 years (2000 to 2011), the rate of retreat has begun to accelerate. The most dramatic glacier shrinkage occurred in the central region, the lowest in the eastern region. The mean summer temperature and warm precipitation in Chinese Tianshan Mountains had an increasing trend, with rates of 0.22 C /10a and 5.1mm/10a from 1960 to 2011, respectively. Mean summer temperature have experienced a strong increase in 1998. The analysis of the results showed that the rise of mean summer temperature was the main factor that contributed to glacier shrinkage. Regional differences of glacier area changes were investigated by analyzing glacier behavior in five study sub-regions; regional differences are related to local climate, to the relative proportion of glaciers in different size classes, altitudinal and aspect distribution of glaciated areas. In addition, the lag theory indicated that glaciers may accelerate the retreat in the next decade, considering climate trends recognized for the period 2000 2011.

DOI

[20]
Hirsch R, Slack J, 1984. A nonparametric trend test for seasonal data with serial dependence.Water Resources Research, 20(60): 727-732.Statistical tests for monotonic trend in seasonal (eg monthly) hydrologic time series are commonly confounded by some of the following problems: nonnormal data, missing values, seasonality, censoring and serial dependence. An extension of the Mann-Kendall test for trend (designed for such data) is presented here. Because the test is based entirely on tanks, it is robust against nonnormality and censoring.-from Authors

DOI

[21]
Huai B, Li Z, Sun M et al., 2015. Change in glacier area and thickness in the Tomur Peak, western Chinese Tien Shan over the past four decades.Journal of Earth System Science, 124(2): 353-363.This paper looks at glacier area change in the Tomur Peak for the 1964/71–2000 and 2000–2011 periods. The results show that the total area of the selected 78 glaciers has decreased from 555.45 km 2 in 1964/71 to 530.39 km 2 in 2000, and further reduced to 521.89 km 2 in 2011. Overall, the selected glaciers have lost 4.50% of their surface area between 1964/71 and 2000, and have lost 1.60% more between 2000 and 2011. The area reduction rate of the 78 glaciers increased from 0.12%/a during 1964/71–2000 to 0.13%/a during 2000–2011. In addition, this paper describes a method for estimating the ice surface elevation change using the SRTM (2000) and elevation data generated from topographic maps (1964/71) to quantify the ice thickness change for the 1964/71–2000 period. The surface elevation for about 73.50% of grid area decreased, mostly in the glacier ablation zone. The overall average thickness loss is 22.35 m which yields an annual loss of 0.60 m/a.

DOI

[22]
Immerzeel W, Beek L, Bierkens P, 2010. Climate change will affect the Asian water towers. Science, 328(5984): 1382-1385.More than 1.4 billion people depend on water from the Indus, Ganges, Brahmaputra, Yangtze, and Yellow rivers. Upstream snow and ice reserves of these basins, important in sustaining seasonal water availability, are likely to be affected substantially by climate change, but to what extent is yet unclear. Here, we show that meltwater is extremely important in the Indus basin and important for the Brahmaputra basin, but plays only a modest role for the Ganges, Yangtze, and Yellow rivers. A huge difference also exists between basins in the extent to which climate change is predicted to affect water availability and food security. The Brahmaputra and Indus basins are most susceptible to reductions of flow, threatening the food security of an estimated 60 million people.

DOI PMID

[23]
Jacob T, Wahr J, Pfeffer T et al., 2012. Recent contributions of glaciers and ice caps to sea level rise.Nature, 482(7386): 514-518.

DOI

[24]
Kaldybayev A, Chen Y, Vilesov E, 2016. Glacier change in the Karatal river basin, Zhetysu (Dzhungar) Alatau, Kazakhstan.Annals of Glaciology, 57(71): 11-19.We investigated glacier changes in the Karatal river basin, the largest basin in Zhetysu (Dzhungar) Alatau, Kazakhstan, for the periods 1956u201389, 1989u20132001 and 2001u201312, based on Landsat TM/ETM+ data analysis. In 1989, we found 243 glaciers with a total area of 142.8 km2; by 2012 these had shrunk to 214 glaciers with a total area of 109.3 km2, a decrease of 33.5 km2 over 23 years (1.02%a-1). This very high shrinkage rate is likely connected with a general trend of increasing temperatures, and small glaciers being situated at the relatively low altitude of the outer Zhetysu Alatau ranges. We also analyzed the shrinkage rate of glaciers based on their differences in size, altitude and aspect of slopes, as well as other topographic parameters, in four sub-basins where glacier shrinkage varied between 18% and 39%. Weather-station climate data showed a significant temperature increase and stable precipitation trends over the study period. We conclude that glacierized areas of the Karatal river basin are located in the most unfavorable conditions for glaciation, and as a result showed a higher shrinkage rate than other glacierized areas of the Tien Shan from 1956 to 2012.

DOI

[25]
Kriegel D, Mayer D, Hagg W et al., 2013. Changes in glacierisation, climate and runo in the second half of the 20th century in the Naryn basin, Central Asia.Global Planetary Change, 110: 1-61.

DOI

[26]
Lee H, Beighley R E, Alsdorf D et al., 2011. Characterization of terrestrial water dynamics in the Congo Basin using GRACE and satellite radar altimetry.Remote Sensing of Environment, 115(12): 3530-3538.78 We provide the first-ever measurements of the Congo wetlands water volume change. 78 Wetland water is dominated by local upland runoff and much less from mainstem. 78 Differences between the Congo wetland and the Amazon floodplain are highlighted.

DOI

[27]
Li B F, Chen Y N, Chen Z S et al., 2012. The effect of climate change during snowmelt period on streamflow in the mountains areas of Northwest China.Acta Geographica Sinica, 67(11): 1461-1470. (in Chinese)This paper,using daily mean temperature and precipitation from 8 mountainous weather stations over the period 1960-2010 in the arid region of Northwest China,analyzes snowmelt period tendency and its spatial variations and explores the sensitivity of runoff to length,temperature and precipitation of snowmelt period.The results show that mean onset of snowmelt period has a shift of 15.33 days earlier while mean ending date has moved 9.19 days later.Onset of snowmelt period in southern Tianshan Mountains moved 20.01 days earlier while that in northern Qilian Mountains moved only 10.16 days earlier.Mean precipitation and air temperature increases by 47.3 mm and 0.857 oC in the mountainous areas of Northwest China,respectively.The precipitation of snowmelt period with the largest increase was observed in southern Tianshan Mountains,reaching 65 mm,the precipitation and temperature in the northern Kunlun Mountains with the smallest increment increased by 25 mm and 0.617 oC,respectively,while the temperature in northern Qilian Mountains rose the highest,an increase of 1.05 oC.The annual streamflow is also sensitive to the variations of precipitation and temperature of snowmelt period,because variation of snowmelt period precipitation induce annual streamflow to change by 7.69% while change of snowmelt period temperature results in annual streamflow change by 14.15%.

DOI

[28]
Li J, Yang T B, He Y et al., 2014. Response of glacier retreat to climate in Eastern Tianshan from 1990-2011.Research of Soil and Water Conservation, 21(3): 212-216. (in Chinese)In the background of warming in recent decades,mountain glaciers in China had also changed dramatically.Glacier changes in the eastern part of Tianshan have obvious indication to glacier changes on the Tianshan Mountains and the China western region.The Bogurda,Balikun and Hal Rick mountains were selected as the regions to search a method for delineating glacier extent by Landsat TM,ETM+images of1990,2001and 2011.The changes of glaciers were analyzed under the support of the geographic information system technology.The results indicate that glacier whole range is larger in eastern Tianshan.The total areas have reduced by 26.80%in the past 21years.However,Bogurda,Balikun,Hal Rick mountains have retreated 33.58%,25.67%,16.08%,respectively.The glaciers mainly distributed in the northwestern slope,northern slope and northeastern slope,but retreat rate of eastern slope was the largest,reaching to30.68%.Glaciers in the study area mainly distributed at the altitude of 3 600~4 600m,glacier retreat in the3 300~3 400mwas the fastest.The results from the studies show that rising temperatures and fluctuation rainfall are the main causes of glacier retreat in eastern Tianshan.In addition,topographic condition is a key factor for glacier changes as well.

[29]
Li X Y, 1982. Regularity of perennial variations in annual runoff for northeastern China and its prognosis.Scientia Geographica Sinica, 2(3): 238-246. (in Chinese)

[30]
Liu S Y, Sun W X, Shen Y P et al., 2003. Glacier changes since the Little Ice Age maximum in the western Qilian Shan, Northwest China, and consequences of glacier runoff for water supply.Journal of Glaciology, 49(164): 117-124.Based on aerial photographs, topographical maps and the Landsat-5 image data, we have analyzed fluctuations of glaciers in the western Qilian Shan, northwest China, from the Little Ice Age (LIA) to 1990. The areas and volumes of glaciers in the whole considered region decreased 15% and 18%, respectively, from the LIA maximum to 1956.This trend of glacier shrinkage continued and accelerated between 1956 and 1990. These latest decreases in area and volume were about 10% in 34 years. The recent shrinkage may be due either to a combination of higher temperatures and lower precipitation during the period 1956-66, or to continuous warming in the high glacierized mountains from 1956 to 1990. As a consequence, glacier runoff from ice wastage between 1956 and 1990 has increased river runoff by 6.2 km3 in the four river basins under consideration. Besides, the equilibrium-line altitude (ELA) rise estimated from the mean terminus retreat of small glaciers <1km long is 46 m, which corresponds to a 0.3 C increase of mean temperatures in warm seasons from the LIA to the 1950s.

DOI

[31]
Liu S Y, Wang N L, Ding Y J et al., 1999. On the characteristics of glacier fluctuations during the last 30 years in Urumqi River Basin and the estimation of temperature rise in the high mountain area.Advance in Earth Sciences, 14(3): 279-285. (in Chinese)Based on field observations and repeated photogrammetry, representative glacier and all the other glaciers in the Urumqi River basin have experienced definite shrinkage since the end of 1950s and the beginning of 1960s. It's found that the decreases in length, area and ice volume of glaciers show a close relationship with their dimensions, that is, the larger the glaciers, the bigger their retreats and vise versa. Analysis indicates that statistical relations can be established for the absolute and relative changes in length, area and volume of glaciers against with their lengths, which can be adapted to glaciers in other mountainous regions, if we conduct some supplementary measurements of glacier fluctuations. With this concept, an evaluation can be made for glacier fluctuations in a regional scale. Further calculation demonstrates that glacier shrinkage in the last 30 years corresponded to an air temperature rise of about 0.35 0.27 in the high mountain region of the Urumqi River.

DOI

[32]
Liu S Y, Yao X J, Guo W Q et al., 2015. The contemporary glaciers in China based on the Second Chinese Glacier Inventory.Acta Geographica Sinica, 70(1): 3-16. (in Chinese)The Second Chinese Glacier Inventory(SCGI) was compiled based on remote sensing images after 2004 including Landsat TM/ETM + and ASTER images,and the digital elevation models(DEMs) from SRTM.The SCGI shows that there are 48,571 glaciers with a total area of 5.18 104km2and ice volume of 4.3 103-4.7 103km3in China(including glaciers measured from 1:50,000 or 1:100,000 topographic maps made from the 1960 s to the 1980 s because of no high quality remote sensing images for the contemporary glacier inventories).The number of glaciers with the area below 0.5 km2 reaches 33,061 and accounts for the majority part(66.07%) of glaciers in China.Glaciers with areas between 1.0 km2 and 50.0 km2 are totaled as ~3.40 104km2(~2.65 103km3 in ice volume) and constitute the main part of glaciers in China.The Yengisogat Glacier(359.05 km2),located in the Shaksgam Valley,north slope of the Karakoram Mountain,is the largest glacier in China.The glaciers are spatially distributed in 14 mountains and plateaus in western China.The Kunlun Mountains has the largest number of glaciers in China,followed by Tianshan Mountains,Nyainq ntanglha Range,the Himalayas and Karakoram.Glaciers in the above five mountains account for 72.26% of the total glacier number in China,however,over 55% of the total area of glaciers and 59% of the total ice storage in China are concentrated in the Kunlun Mountains,Nyainq ntanglha Range and Tianshan Mountains.The number and area of glaciers in Karakoram Mountains are less than those in the Himalayas,but the volume of the former is more than that of the latter because the glaciers in the Karakoram are generally larger.Some 4/5 of the total area of glaciers in China is mainly distributed in an altitudinal band between 4500-6500 m a.s.l.with regional differences depending on the general elevations of various mountains.Analogously,there is an obvious difference of glaciers in basins.The first level basin having the most glaciers is the East Asia interior drainage area(5Y) which occupies ~40% of glaciers in China.The Yellow River basin(5J) has the fewest glaciers where only 164 with an area of 126.72 km2 are distributed.Xinjiang and Xizang autonomous regions are the two provincial units rich in glaciers,with ~9/10 of the total area and ice storage of glaciers in China.

[33]
Long D, Yang Y T, Wada Y et al., 2015. Deriving scaling factors using a global hydrological model to restore GRACE total water storage changes for China’s Yangtze River Basin.Remote Sensing of Environment, 168: 177-193.61PCR-GLOBWB is used to generate scaling factors to restore GRACE signals.61PCR-GLOBWB scaling factors show reasonable spatial variability for the study basin.61GRACE total water storage changes (TWSC) are evaluated using water balance.61GRACE TWSC applied with PCR-GLOBWB scaling factors are improved.

DOI

[34]
Lutz A, Immerzeel W, Shrestha A et al., 2014. Consistent increase in High Asia’s runoff due to increasing glacier melt and precipitation. Nature Climate Change, 4: 587-592.Rivers originating in the high mountains of Asia are among the most meltwater-dependent river systems on Earth, yet large human populations depend on their resources downstream1. Across High Asias river basins, there is large variation in the contribution of glacier and snow melt to total runoff 2, which is poorly quantified.The lack of understanding of the hydrological regimes of High Asias rivers is one of the main sources of uncertainty in assessing the regional hydrological impacts of climate change3. Here we use a large-scale, high-resolution cryospheric-hydrological model to quantify the upstream hydrological regimes of the Indus, Ganges, Brahmaputra, Salween and Mekong rivers. Subsequently, we analyse the impacts of climate change on future water availability in these basins using the latest climate model ensemble. Despite large differences in runoff composition and regimes between basins and between tributaries within basins, we project an increase in runoff at least until 2050 caused primarily by an increase in precipitation in the upper Ganges, Brahmaputra, Salween and Mekong basins and from accelerated melt in the upper Indus Basin. These findings have immediate consequences for climate change policies where a transition towards coping with intra-annual shifts in water availability is desirable. 2014 Macmillan Publishers Limited. All rights reserved.

DOI

[35]
Matsuo K, Heki K, 2010. Time-variable ice loss in Asian high mountains from satellite gravimetry.Earth and Planetary Science Letters, 290(1/2): 30-36.Substantial amount of glacial ice is considered to be melting in the Asian high mountains. Gravimetry by GRACE satellite during 2003–2009 suggests the average ice loss rate in this region of 47 ± 12 Gigaton (Gt) yr 61 1, equivalent to 65 0.13 ± 0.04 mm yr 61 1 sea level rise. This is twice as fast as the average rate over 65 40 years before the studied period, and agrees with the global tendency of accelerating glacial loss. Such ice loss rate varies both in time and space; mass loss in Himalaya is slightly decelerating while those in northwestern glaciers show clear acceleration. Uncertainty still remains in the groundwater decline in northern India, and proportion of almost isostatic (e.g. tectonic uplift) and non-isostatic (e.g. glacial isostatic adjustment) portions in the current uplift rate of the Tibetan Plateau. If gravity increase associated with ongoing glacial isostatic adjustment partially canceled the negative gravity trend, the corrected ice loss rate could reach 61 Gt yr 61 1.

DOI

[36]
Mountain Research Initiative (MRI), 2015. Elevation-dependent warming in mountain regions of the world.Nature Climate Change, 5(5): 424-430.There is growing evidence that the rate of warming is amplified with elevation, such that high-mountain environments experience more rapid changes in temperature than environments at lower elevations. Elevation-dependent warming (EDW) can accelerate the rate of change in mountain ecosystems, cryospheric systems, hydrological regimes and biodiversity. Here we review important mechanisms that contribute towards EDW: snow albedo and surface-based feedbacks; water vapour changes and latent heat release; surface water vapour and radiative flux changes; surface heat loss and temperature change; and aerosols. All lead to enhanced warming with elevation (or at a critical elevation), and it is believed that combinations of these mechanisms may account for contrasting regional patterns of EDW. We discuss future needs to increase knowledge of mountain temperature trends and their controlling mechanisms through improved observations, satellite-based remote sensing and model simulations.

DOI

[37]
Narama C, Kääb A, Duishonakunov M et al., 2010. Spatial variability of recent glacier area changes in the Tien Shan Mountains, Central Asia, using Corona (~1970), Landsat (~2000), and ALOS (~2007) satellite data.Global Planetary Change, 71(1/2): 42-54.Geographic variability of the recent changes of glacier coverage in the Tien Shan Mountains, Central Asia, is assessed using Corona KH-4B satellite photographs for 1968–1971, Landsat 7 ETM+data for 1999–2002, and ALOS/PRISM and AVNIR data for 2006–2008. The four mountain regions investigated (Pskem, Ili-Kung02y, At-Bashy, and SE-Fergana) cover several distributed glacierized areas in the Tien Shan Mountain system, a region that is affected by highly variable local precipitation regimes. Over the 30 years investigated between ~ 1970 and ~ 2000, glacier area decreased by 19% in the Pskem region, 12% in the Ili-Kung02y region, 12% in the At-Bashy region, and 9% in the SE-Fergana region. In the last 7 years (~ 2000 to ~ 2007), glacier area shrank by 5% in the Pskem region, 4% in the Ili-Kung02y region, 4% in the At-Bashy region, and 0% in the SE-Fergana region. Glacier behavior has varied markedly in these regions. The most dramatic glacier shrinkage has occurred in the outer ranges of the Tien Shan Mountains. Recent glacier area loss has resulted from rising summer temperatures. Regional differences of glacier-area changes related to local climate conditions, to the altitudinal distribution of glacier areas, and to the relative proportion of glaciers in different size classes. The observed accelerated glacier shrinkage is expected to have two impacts on the more populated outer ranges: 1) water shortages during summer and 2) increased threat from glacier hazards such as glacier lake outburst floods (GLOFs) and ice avalanches.

DOI

[38]
Paul F, Bolch T, Kaab A et al., 2015. The glaciers climate change initiative: Methods for creating glacier area, elevation change and velocity products.Remote Sensing of Environment, 162: 408-426.61We compare algorithms to create glacier area, elevation change and velocity products.61Round robin experiments were used for each product to select the best one.61The accuracy of glacier area depends on the correct interpretation of debris cover.61For elevation change accurate co-registration of the two DEMs is most important.61Velocity is best obtained by feature/offset tracking for optical/microwave data.

DOI

[39]
Pfeffer W, Arendt A, Bliss A et al., 2014. The Randolph Glacier Inventory: A globally complete inventory of glaciers.Journal of Glaciology, 60(221): 537-552.

DOI

[40]
Rodell M, Famiglietti J, Chen J et al., 2004. Basin scale estimates of evapotranspiration using GRACE and other observations.Geophysical Research Letters, 31(20): L20504.Evapotranspiration is integral to studies of the Earth system, yet it is difficult to measure on regional scales. One estimation technique is a terrestrial water budget, i.e., total precipitation minus the sum of evapotranspiration and net runoff equals the change in water storage. Gravity Recovery and Climate Experiment (GRACE) satellite gravity observations are now enabling closure of this equation by providing the terrestrial water storage change. Equations are presented here for estimating evapotranspiration using observation based information, taking into account the unique nature of GRACE observations. GRACE water storage changes are first substantiated by comparing with results from a land surface model and a combined atmospheric-terrestrial water budget approach. Evapotranspiration is then estimated for 14 time periods over the Mississippi River basin and compared with output from three modeling systems. The GRACE estimates generally lay in the middle of the models and may provide skill in evaluating modeled evapotranspiration.

DOI

[41]
Rodell M, Velicogna I, Famiglietti J, 2009. Satellite-based estimates of groundwater depletion in India.Nature, 460(7258): 999-1002.Groundwater is a primary source of fresh water in many parts of the world. Some regions are becoming overly dependent on it, consuming groundwater faster than it is naturally replenished and causing water tables to decline unremittingly. Indirect evidence suggests that this is the case in northwest India, but there has been no regional assessment of the rate of groundwater depletion. Here we use terrestrial water storage-change observations from the NASA Gravity Recovery and Climate Experiment satellites and simulated soil-water variations from a data-integrating hydrological modelling system to show that groundwater is being depleted at a mean rate of 4.0 +/- 1.0 cm yr(-1) equivalent height of water (17.7 +/- 4.5 km(3) yr(-1)) over the Indian states of Rajasthan, Punjab and Haryana (including Delhi). During our study period of August 2002 to October 2008, groundwater depletion was equivalent to a net loss of 109 km(3) of water, which is double the capacity of India's largest surface-water reservoir. Annual rainfall was close to normal throughout the period and we demonstrate that the other terrestrial water storage components (soil moisture, surface waters, snow, glaciers and biomass) did not contribute significantly to the observed decline in total water levels. Although our observational record is brief, the available evidence suggests that unsustainable consumption of groundwater for irrigation and other anthropogenic uses is likely to be the cause. If measures are not taken soon to ensure sustainable groundwater usage, the consequences for the 114,000,000 residents of the region may include a reduction of agricultural output and shortages of potable water, leading to extensive socioeconomic stresses.

DOI PMID

[42]
Schmidt R, Schwintzer P, Flechtner F et al., 2006. GRACE observations of changes in continental TWS.Global Planetary Change, 50(1/2): 112-126.Signatures between monthly global Earth gravity field solutions obtained from GRACE satellite mission data are analyzed with respect to continental water storage variability. GRACE gravity field models are derived in terms of Stokes' coefficients of a spherical harmonic expansion of the gravitational potential from the analysis of gravitational orbit perturbations of the two GRACE satellites using GPS high–low and K-band low–low intersatellite tracking and on-board accelerometry. Comparing the GRACE observations, i.e., the mass variability extracted from temporal gravity variations, with the water mass redistribution predicted by hydrological models, it is found that, when filtering with an averaging radius of 750 km, the hydrological signals generated by the world's major river basins are clearly recovered by GRACE. The analyses are based on differences in gravity and continental water mass distribution over 3- and 6-month intervals during the period April 2002 to May 2003. A background model uncertainty of some 35 mm in equivalent water column height from one month to another is estimated to be inherent in the present GRACE solutions at the selected filter length. The differences over 3 and 6 months between the GRACE monthly solutions reveal a signal of some 75 mm scattering with peak values of 400 mm in equivalent water column height changes over the continents, which is far above the uncertainty level and about 50% larger than predicted by global hydrological models. The inversion method, combining GRACE results with the signal and stochastic properties of a hydrological model as ‘a priori’ in a statistical least squares adjustment, significantly reduces the overall power in the obtained water mass estimates due to error reduction, but also reflects the current limitations in the hydrological models to represent total continental water storage change in particular for the major river basins.

DOI

[43]
Sen P, 1968. Estimates of the regression coefficient based on Kendall’s Tau.Journal of the American Statistical Association, 63(324): 1379-1389.The least squares estimator of a regression coefficient 0205 is vulnerable to gross errors and the associated confidence interval is, in addition, sensitive to non-normality of the parent distribution. In this paper, a simple and robust (point as well as interval) estimator of 0205 based on Kendall''s [6] rank correlation tau is studied. The point estimator is the median of the set of slopes (Yj - Yi)/(tj-ti) joining pairs of points with ti 090902 ti, and is unbiased. The confidence interval is also determined by two order statistics of this set of slopes. Various properties of these estimators are studied and compared with those of the least squares and some other nonparametric estimators.

DOI

[44]
Shen Y P, Wang G Y, Ding Y J et al., 2009. Changes in glacier mass balance in watershed of Sary Jaz-Kumarik rivers of Tianshan Mountains in 1957-2006 and their impact on water resources and trend to end of the 21st century. Journal of Glaciology and Geocryology, 31(5): 792-800. (in Chinese)

[45]
Swenson S, Chambers D, Wahr J, 2008. Estimating geocenter variations from a combination of GRACE and ocean model output.Journal of Geophysical Research, 113: B08410.1] In this study, we estimate a time series of geocenter anomalies from a combination of data from the Gravity Recovery and Climate Experiment (GRACE) satellite mission and the output from ocean models. A matrix equation is derived relating total geocenter variations to the GRACE coefficients of degrees two and higher and to the oceanic component of the degree one coefficients. We estimate the oceanic component from two state-of-the-art ocean models. Results are compared to independent estimates of geocenter derived from other satellite data, such as satellite laser ranging and GPS. Finally, we compute degree one coefficients that are consistent with the processing applied to the GRACE Level-2 gravity field coefficients. The estimated degree one coefficients can be used to improve estimates of mass variability from GRACE, which alone cannot provide them directly.

DOI

[46]
Wahr J, Molenarr M, 1998. Time variability of the earth’s gravity field: Hydrological and oceanic effects and their possible detection using GRACE.Journal of Geophysical Research: Solid Earth, 103(B12): 30205-30229.The GRACE satellite mission, scheduled for launch in 2001, is designed to map out the Earth's gravity field to high accuracy every 2 4 weeks over a nominal lifetime of 5 years. Changes in the gravity field are caused by the redistribution of mass within the Earth and on or above its surface. GRACE will thus be able to constrain processes that involve mass redistribution. In this paper we use output from hydrological, oceanographic, and atmospheric models to estimate the variability in the gravity field (i.e., in the geoid) due to those sources. We develop a method for constructing surface mass estimates from the GRACE gravity coefficients. We show the results of simulations, where we use synthetic GRACE gravity data, constructed by combining estimated geophysical signals and simulated GRACE measurement errors, to attempt to recover hydrological and oceanographic signals. We show that GRACE may be able to recover changes in continental water storage and in seafloor pressure, at scales of a few hundred kilometers and larger and at timescales of a few weeks and longer, with accuracies approaching 2 mm in water thickness over land, and 0.1 mbar or better in seafloor pressure.

DOI

[47]
Wahr J, Swenson S, Velicogna I, 2006. Accuracy of GRACE mass estimates.Geophysical Research Letters, 33(6): L06401.

[48]
Wang P Y, Li Z Q, Wang W B et al., 2013. Changes of six selected glaciers in the Tomor region, Tian Shan, Central Asia, over the past ~50 years, using high-resolution remote sensing images and field surveying.Quaternary International, 311: 123-131.As the major water resource of the Tarim River, glaciers in the Tomor region have suffered major losses of ice in the last several decades. Based on topographic maps, high-resolution remote sensing image, field survey data and previous studies, changes of the six selected glaciers in the Tomor region (Qingbingtan Glacier No.72, Qingbingtan Glacier No.74, Keqikekuzibayi Glacier, Tomor Glacier, Keqikar Glacier and Qiongtailan Glacier) over the past 6550 years were analyzed in this study. Analysis shows that all of the02six glaciers showed continuous shrinkage. The reduction rate of Glacier No.72 (terminus retreat of 4102m02a611 and area loss of 21.5% during 1964–2009) was higher than the others, with a dramatically increased rate. This dramatic ice thinning, related glacier front retreat and area loss of the six glaciers, suggests that glaciers in the Tomor region might currently be suffering negative mass balance in response to the ongoing temperature rise. Differences in changes of the six glaciers are influenced by debris cover and other topographical factors.

DOI

[49]
Watkins M, Wiese D N, Yuan D N et al., 2015. Improved methods for observing Earth’s time variable mass distribution with GRACE using spherical cap mascons.Journal of Geophysical Research: Solid Earth, 120: 2648-2671.Abstract We discuss several classes of improvements to gravity solutions from the Gravity Recovery and Climate Experiment (GRACE) mission. These include both improvements in background geophysical models and orbital parameterization leading to the unconstrained spherical harmonic solution JPL RL05, and an alternate JPL RL05M mass concentration (mascon) solution benefitting from those same improvements but derived in surface spherical cap mascons. The mascon basis functions allow for convenient application of a priori information derived from near-global geophysical models to prevent striping in the solutions. The resulting mass flux solutions are shown to suffer less from leakage errors than harmonic solutions, and do not necessitate empirical filters to remove north-south stripes, lowering the dependence on using scale factors (the global mean scale factor decreases by 0.17) to gain accurate mass estimates. Ocean bottom pressure (OBP) time series derived from the mascon solutions are shown to have greater correlation with in situ data than do spherical harmonic solutions (increase in correlation coefficient of 0.08 globally), particularly in low-latitude regions with small signal power (increase in correlation coefficient of 0.35 regionally), in addition to reducing the error RMS with respect to the in situ data (reduction of 0.37 cm globally, and as much as 1 cm regionally). Greenland and Antarctica mass balance estimates derived from the mascon solutions agree within formal uncertainties with previously published results. Computing basin averages for hydrology applications shows general agreement between harmonic and mascon solutions for large basins; however, mascon solutions typically have greater resolution for smaller spatial regions, in particular when studying secular signals.

DOI

[50]
Xavier L, Becker M, Cazenave A et al., 2010. Interannual variability in water storage over 2003-2008 in the Amazon Basin from GRACE space gravimetry, in situ river level and precipitation data.Remote Sensing of Environment, 114(8): 1629-1637.We investigate the interannual variability over 2003–2008 of different hydrological parameters in the Amazon river basin: (1) vertically-integrated water storage from the GRACE space gravimetry mission, (2) surface water level of the Amazon River and its tributaries from in situ gauge stations, and (3) precipitation. We analyze the spatio-temporal evolution of total water storage from GRACE and in situ river level along the Amazon River and its main tributaries and note significant differences between the various parts of the basin. We also perform an Empirical Orthogonal Decomposition of total water storage, river level and precipitation over the whole basin. We find that the 2003–2008 period, is characterized by two major hydrological events: a temporary drought in late 2005 that affected the western and central parts of the basin and very wet conditions peaking in mid-2006, in the eastern, northern and southern regions of the basin. Derivative of basin-average water storage from GRACE is shown to be highly correlated with the Southern Oscillation Index (a proxy of ENSO — El Ni09o-Southern Oscillation), confirming that the spatio-temporal change in hydrology of the Amazon basin is at least partly driven by the ENSO phenomenon, as noticed in previous studies.

DOI

[51]
Xie W, Jiang F Q, 2014. Change trend of glaciers in the Hami region. Arid Zone Research, 31(1): 27-31. (in Chinese)Glacier-snow melt water in the main form of surface runoff in the Hami region,Xinjiang,China. Affected by global climate warming,the glaciers in the Hami region are currently at the accelerating melt stage,and the shortage of water resources is the main restriction factor for social and economic development in the Hami region. In this study,the values of material balance,area and thickness of glaciers and the hydrological and meteorological data in the Hami region were measured and observed so as to predict the change trend of glacial hydrology and water resources,provide the references for further utilizing limited water resources,and work out the measures for the local sustainable development. The results revealed that the area and thickness of the glaciers in both Yushugou and Miaoergou valleys were in a slow reduction,a violent change of fluvial recharge will not occur in next decades,and such change trend will continue in the future.

[52]
Xu C C, Chen Y N, Chen Y P et al., 2013. Responses of surface runoff to climate change and human activities in the arid region of Central Asia: A case study in the Tarim River Basin, China.Environmental Management, 51(4): 926-938.Based on hydrological and climatic data and land use/cover change data covering the period from 1957 to 2009, this paper investigates the hydrological responses to climate change and to human activities in the arid Tarim River basin (TRB). The results show that the surface runoff of three headstreams (Aksu River, Yarkant River and Hotan River) of the Tarim River exhibited a significant increasing trend since 1960s and entered an even higher-runoff stage in 1994. In the contrary, the surface runoff of Tarim mainstream displayed a persistent decreasing trend since 1960s. The increasing trend of surface runoff in the headstreams can be attributed to the combined effects of both temperature and precipitation changes during the past five decades. But, the decreasing trend of surface runoff in the mainstream and the observed alterations of the temporal and spatial distribution patterns were mainly due to the adverse impacts of human activities. Specifically, increasingly intensified water consumption for irrigation and the associated massive constructions of water conservancy projects were responsible for the decreasing trend of runoff in the mainstream. And, the decreasing trend has been severely jeopardizing the ecological security in the lower reaches. It is now unequivocally clear that water-use conflicts among different sectors and water-use competitions between upper and lower reaches are approaching to dangerous levels in TRB that is thus crying for implementing an integrated river basin management scheme.

DOI PMID

[53]
Yang Z N, 1981. Mountain stream types in Northwest China. Journal of Glaciology and Geocryology, 3(2): 14-31. (in Chinese)The mountain streams in the northwestern part of China are supplied by various water sources. According to both their sources and the basic hydrogical characteristics, they may be divided into five types of streams, namely the type of ice and snow meltwater, the type of rain water and ice and snow meltwater, the type of underground water and ice and snow meltwater, the type of snow meltwater, and the type of rain water. In the type of ice and snow meltwater, the ice and snow meltwater is the main supply and the discharge is extremely steady. In the type of rainwater and ice and snow meltwater,the rain water maybe the main supply mixed with ice and snow meltwater and the discharge is quite stable, most streams in the Northwest China belong to this type. The type of underground water and ice and snow meltwater is mainly supplied by under ground water with other mixed sources and the change of the discharge is comparatively big. Both the types of snow meltwater and of the rainfall belong to streams of precipitation supply. However, at present the former is mainly supplied by snow meltwater in spring and the stream discharge is affected directly by precipitation and has the greatest change.

[54]
Yao J Q, Yang Q, Hu W F et al.Hu W F , 2013. Characteristics analysis of water vapor contents around Tianshan Mountains and the relationships with climate factors.Scientia Geographica Sinica, 33(7): 859-864. (in Chinese)Relation formula was established between water vapor content and ground water vapor pressure,and the water vapor content of the Tianshan Mountains was calculated,the spatial and temporal distribution of the water vapor content characteristics and the relationship with the climate factors change was analyzed(i.e.temperature,precipitation,NAO/AO index).The following conclusion was drawn: the high value of the water vapor content area for Tianshan Mountains mainly distributed in the north Tianshan Plain region and the river valley in Turpan Basin,the water vapor content is in 12-20 mm.The east and middle area of Tianshan Mountains is a minimum part,the value is in 4-8 mm.In the past 50 years,the water vapor content in Tianshan Mountains exhibited an increasing trend with the rate of 0.26 mm per decade.However,the different seasons are different in the rates of water vapor content increase.Specifically,it increased most obviously in summer at a slope of 0.16 mm per decade and in autumn increased trend at a slope of 0.32 per decade.EOF decomposition of water vapor content showed the water vapor content distribution of has two types: consistency change in entire area under the background of regional climate change and the reverse change in north and south slope.It was showed that the regional climate change factors have impact on water vapor content.Specifically,precipitation in Tianshan Mountains was correlated significantly with water vapor content,especially atmospheric moisture and precipitation in summer,water vapor content is one of the factors that affect precipitation.The EOF decomposition of precipitation and water vapor content showed that the first two vector field of similarity high between the distribution of spatial and temporal distribution.Water vapor has negative feedback effect to regional temperature under the global change and climate change,through it is a major cause of greenhouse gas and also a cause of climate change in terms of global change.NAO or AO in winter has relevant relations with water vapor,and winter AO has the most significant correlation to summer water vapor.These works are important for discussing the regional water cycling process and regional response of climate change under the background of global change.The results lay scientific foundation for rational develop and utilize water vapor sources in Tianshan Mountains.

[55]
Yatagai A, Kamiguchi K, Arakawa O et al., 2012. APHRODITE: Constructing a long-term daily gridded precipitation dataset for Asia based on a dense network of rain gauges.Bulletin of the American Meteorological Society, 93(9): 1401-1415.

DOI

[56]
Zemp M, Frey M, Gartne-Roer H et al., 2012. WGMS: Fluctuations of Glaciers 2005-2010 (Vol.X).

[57]
Zemp M, Nussbaumer M, Naegeli K et al., 2013. WGMS: Glacier Mass Balance Bulletin No.12 (2010-2011).

[58]
Zou X C, Jin T Y, Zhu G B, 2016. Research on the MASCON method for the determination of local surface mass flux with satellite-satellite tracking technique.Chinese Journal of Geophysics, 59(12): 4623-4632. (in Chinese)The MASCON(Mass Concentration)method is an effective technique to study the mass flux of the shallow earth surface by using the GRACE satellite-satellite tracking(SST)technique directly.Compared with the Stokes spherical harmonic coefficient method,it can overcome the uncertainty problem of the filtering of time variable signals and effectively solve theproblem of the North-South stripes in the solution of the GRACE earth gravity models.In this paper,the existing local MASCON method is improved,and the satellite precise orbit is introduced as the observations to solve for the parameters of MASCON and the relating dynamic models by combining the high-low SST and low-low SST measurements.To ensure the time variable signals be mainly derived from the inter-satellite range-rates,the variance component estimation method is used to determine a reasonable weight.By using the precise orbit as the absolute reference,a modified way to realize the MASCON is studied in this paper.Using the GRACE satellite gravity data in 2008,the water storage change in terms of equivalent water height(EWH)of Amazon basin is achieved.Compared with those computed from the GLDAS model,the time variable gravity models of the CSR Release 05 version and the MASCON solution by JPL,our results are confirmed to have good consistence,supporting the ideas on the method recommended in this article,which may provide a feasible way to study the local surface mass flux.

DOI

Outlines

/