Research Articles

Spatio-temporal variations in extreme drought in China during 1961-2015

  • ZHANG Jing , 1, 2, 3, 4 ,
  • SHEN Yanjun , 1, *
Expand
  • 1. Key Laboratory of Agricultural Water Resources, Hebei Laboratory of Agricultural Water-Saving, Center for Agricultural Resources Research, Institute of Genetics and Developmental Biology, CAS, Shijiazhuang 050021, China
  • 2. University of Chinese Academy of Sciences, Beijing 100049, China
  • 3. Hebei Provincial Climate Centre, Shijiazhuang 050021, China
  • 4.Hebei Province Meteorological and Ecological Environment Laboratory, Shijiazhuang 050021, China
*Corresponding author: ShenYanjun, Professor, E-mail:

Author: Zhang Jing, PhD Candidate and Senior Engineer, specialized in climate change and hydrology and water resources. E-mail:

Received date: 2018-02-01

  Accepted date: 2018-05-21

  Online published: 2019-01-25

Supported by

National Key R&D Program of China, No.2016YFC0401403

Climate Change Project of China Meteorological Administration, No.CCSF201851

Copyright

Journal of Geographical Sciences, All Rights Reserved

Abstract

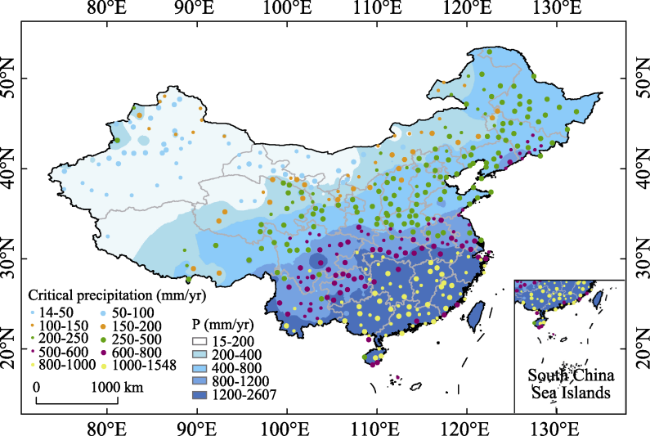
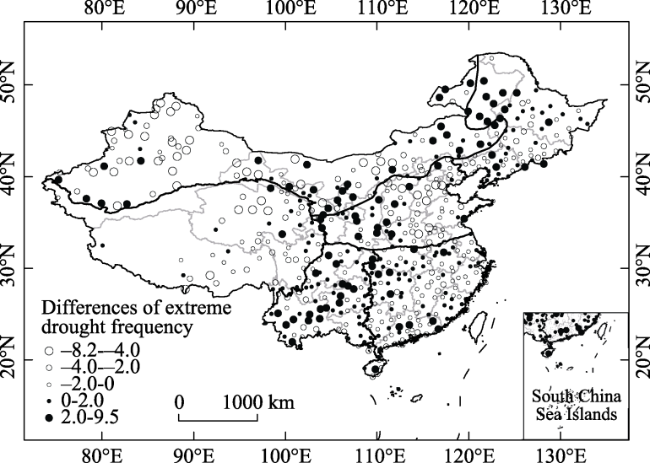
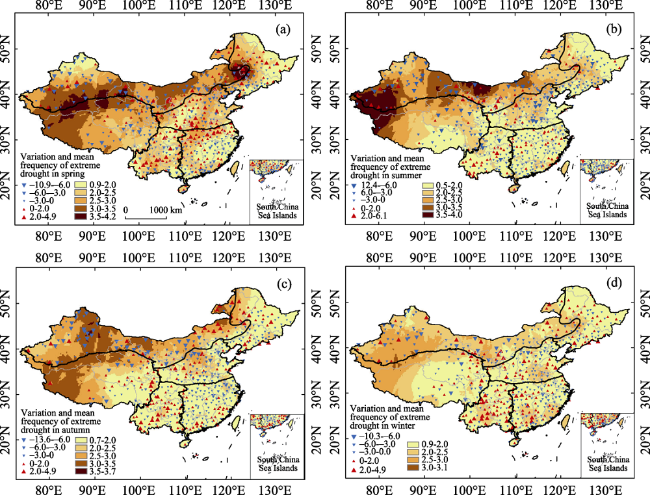
Understanding the past variations in extreme drought is especially beneficial to the improvementof drought resistance planning and drought risk management in China. Based on the monitoring data of meteorological stations from 1961 to 2015 and a meteorological drought index, the Standardized Precipitation Evapotranspiration Index (SPEI), the spatio-temporal variations in extreme drought at inter-decadal, inter-annual and seasonal scales in China were analyzed. The results revealed that 12 months cumulative precipitation with 1/2 to 5/8 of average annual precipitation will trigger extreme drought. From the period 1961-1987 to the period 1988-2015, the mean annual frequency of extreme drought (FED) increased along a strip extending from southwest China (SWC) to the western part of northeast China (NEC). The increased FED showed the highest value in spring, followed by winter, autumn and summer. There was a continuous increase in the decadal-FED from the 1990s to the 2010s on the Tibetan Plateau (TP), the southeast China (SEC) and the SW. During the period 1961-2015, the number of continuous drought stations was almost the same among 4 to 6 months and among 10 to 12 months of continuous drought, respectively. It can be inferred that drought lasting 6 or 12 months may lead to more severe drought disasters due to longer duration. The range of the longest continuous drought occurred in the 21st century had widely increased compared with that in the 1980s and the 1990s. Our findings may be helpful for water resources management and reducing the risk of drought disasters in China.

Cite this article

ZHANG Jing , SHEN Yanjun . Spatio-temporal variations in extreme drought in China during 1961-2015[J]. Journal of Geographical Sciences, 2019 , 29(1) : 67 -83 . DOI: 10.1007/s11442-019-1584-3

1 Introduction

Extreme weather and climate events are one of the most significant and increasingly attractive topicsunder the global climate warming background over the past few years (Easterling et al., 2000;Cook et al., 2014). Drought, especially extreme drought, can cause considerable damage to crop yield, human economies, people’s livelihood and property, and even influence the social stability of nations (Cook et al., 2014; Kelley et al., 2015; Lesk et al., 2016). According to the hydro-meteorological disaster reports, the global drought-induced grain output dropped by an average of 10.1% from 1964 to 2007(Lesket al., 2016). A significant change in extreme droughts in the second half of the 20th century had affected many parts of the world (Frich et al., 2002). The southern U.S., northern Mexico and the Central Great Plains experienced extreme drought in the summers of 2011 and 2012 (Wang et al., 2014a). The crop yield of the U.S. in 2012 fell 26% below the expected yield, which was the largest crop failure since 1866(Hoerlinget al., 2014). The drought in Syria between 2007 and 2010 was the most serious drought in history, resulting in a large crop failure and a large-scale migration of farmers into urban centers (Kelley et al., 2015). Moreover, previous studies predicted the risk of drought could increase in the 21st century by using climate model simulations on soil moisture (Sheffield, 2008) and drought indices (Dai, 2013).
China is one of the countries that experience the most frequent and serious drought in the world. Extreme drought often causes serious natural disasters, imposing a great threat on agricultural production and people’s livelihood in China (Li et al., 2012). Drought caused direct economic losses accounting for 21.2% of the total losses caused by all types of weather and climate disasters, which is only second to floods losses (Qin, 2015). About 17% of the grain total output (70-80 billion kg) was lost caused by drought per year on average in China (Liu et al., 2013a). During 1991 to 2009, the frequency of drought was about 79.21% recorded by national wheat meteorological stations of China, which was higher than other nine types of agro-meteorological disasters (Zhang et al., 2014). The winter drought in 2008-2009 led to a loss of nearly 16 billion Chinese yuan in northeast China and more than 10 million people faced water shortages (Wang et al., 2011). In recent decades, drought has also occurred in southern China, especially in southwest China (Qiu, 2010; Xu et al., 2015). Extreme drought is getting more and more attention given that the pressures on resources, environment and ecology increase along with the global climate change and the rapid economic development of China. Moreover, the inter-decadal variations in the frequency of extreme drought (FED) events are more uneven than that of moderate drought events in China (Li et al., 2012). However, few studies have focused on quantifying and explicitly analyzing the spatio-temporalvariations and trends of extreme drought, which are prerequisites for drought risk management and China’s planning of drought disaster resistance. Extreme drought is a small probability event that occurs when water deficit is severe. Compared to all levels of droughts, extreme drought often suffers severe drought disasters. Moreover, all levels of droughts do not necessarily result in disasters, which affect the accuracy of drought assessment. Therefore, analysis of the variations in extreme droughts can improve understanding of major drought events and drought management.
Various drought indices have been developed for drought monitoring and drought assessment. However, there is as yet no unique and universally accepted droughts indicator that we can identify its impacts on different systems, such as agriculture, water resources and ecosystems (Heim, 2002). Some studies compared the differences between the Standardized Precipitation Index (SPI) and the Palmer Drought Severity Index (PDSI), which are commonly used for analyzing the spatio-temporal patterns and variations in meteorological droughts (Jain et al., 2014; Ren et al., 2014). To some extent, the SPI is better and more sensitive than the PDSI in reflecting meteorological droughts, soil moisture variations and extreme droughts events (Keyantash and Dracup, 2002; Lloyd-Hughes and Saunders, 2002). The Standardized Precipitation Evapotranspiration Index (SPEI), which is based on precipitation and evaporation demand, combines the multi-scalar characteristic and simple calculation of the SPI with the sensitivity of the PDSI to temperature changes (Vicente-Serrano et al., 2010; Yu et al., 2014). Moreover, the SPEI is more sensitive to potential evapotranspiration (PET), especially in arid regions (Cook, 2014). Based on the hypothesis of log-logistic distribution of samples, Wang and Chen (2014) confirmed the reliability of the SPEI with Thornthwaite equation (Thornthwaite, 1948) in most of China, except in western and boreal China of less than 3-month time scale in winter. Moreover, by comparing the distribution of the SPEI with the Historical Dataset in China (MICMB, 1981) in typical years, the SPEI can accurately describes the geographic center, extent and intensity of several major drought events in China (Wang and Chen, 2014). As the Thornthwaite potential evapotranspiration methodis mainly applicable to wetland limitations, Zhao et al. (2015) used the calculation of evaporation from the Penman-Monteith equation proposed by the Food and Agriculture Organization (FAO) (Allen et al., 1998) to assess the applicability of SPEI in China.The modified method was also presented in the modified SPEI poposed by Begueríaet al. (2014). The SPEI based on Penman-Monteith equation applied to national drought assessment performed well at both yearly and monthly time scales, making up the shortcomings in the applicability of the original SPEI in winter at a short time scale level in arid region (Liu and Jiang, 2015;Zhao et al., 2015). In addition to reflecting the meteorological droughts, the SPEI is also a reasonable index for assessing droughts conditions in agriculture, water resources and vegetation etc. (Potop et al., 2012; Stagge et al., 2015).
Numerous studies have pointed out changes in the frequency and intensity of extreme climate events, but most of these studies have been focused on extreme precipitation or temperature. Variations in extreme drought in China have received less attention, and most studies on extreme drought have concentrated on the regional analysis (Lu et al., 1962; Yang et al., 2013; Zhang et al., 2015). From the autumn of 2009 to the spring of 2010, extreme drought was encountered in southwest China due to abnormally low precipitation and high temperature anomalies (Lu et al., 1962).The inter-annual and inter-decadal trend of extreme drought events had gradually decreased from 1960-2013 in the Huaihe River Basin (Zhang et al., 2015). Yang (2013) detected that the extreme severe drought events had a tendency of gradual increase in China, mainly due to the obvious aridity in northern Chinain the second half of the 20th century. Since almost all severe drought disasters are associated with long-term continuous or extreme drought, the evolutionary process of extreme drought in space and time is an important aspect in the field of drought research. With global warming, increased attention to the hydrological cycle raises the question as to whether extreme drought is truly increasing in China and how extreme drought has changed in different regions.
In this study, we analyzed the spatio-temporal patterns and variations in extreme drought at inter-decadal, inter-annual and seasonal scales in China by using the monitoring data of meteorological stations from the period of 1961-2015 with the SPEI based on Penman-Monteith equation. The objectives of the study are: 1) to understand the spatial distribution of critical annual precipitation when extreme drought happened as well as the spatial differences of average annual and seasonal variations in the FED between the period of 1988-2015 and 1961-1987; 2) to exhibit temporal variations in the inter-decadal and inter-annual changes in the FED for different subareas during 1961-2015; 3) to explore the annual changes in the number of meteorological stations under different duration of extreme drought from 2 to 12 months respectively, and the decade of each station when the longest extreme drought duration occurred during 1961-2015. The conclusions of the study will help to further understand the evolution of extreme drought in China. It can also provide scientific basis for the research of extreme drought mechanism and the risk management of extreme climate events.

2 Data and methods

2.1 Study areas and data sources

Due to the impact of the East Asian monsoon climate and vast territory with complicated terrain, the climate in China varies from region to region significantly. Therefore, it is relatively difficult to estimate the characteristics of climatic hazards for such a wide territory as a whole unit. In this study, considering the climate division and administrative zones, the Chinese mainland was partitioned to six subareas (Figure 1): northeast China (NEC), northwest China (NWC), northern China (NC), southeast China (SEC), southwest China (SWC) and the Tibetan Plateau (the TP). We first divided China into the NWC, the TP and eastern monsoon region according to the 400 mm contour line of mean annual precipitation which is an important climate demarcation line between semi-arid and semi-humid areas. The boundary of the Tibetan Plateau was adopted from the scope in Zhang et al. (2002). The other four eastern monsoon regions were divided in terms of the Qinling Mountains-Huaihe River line and administrative boundaries.
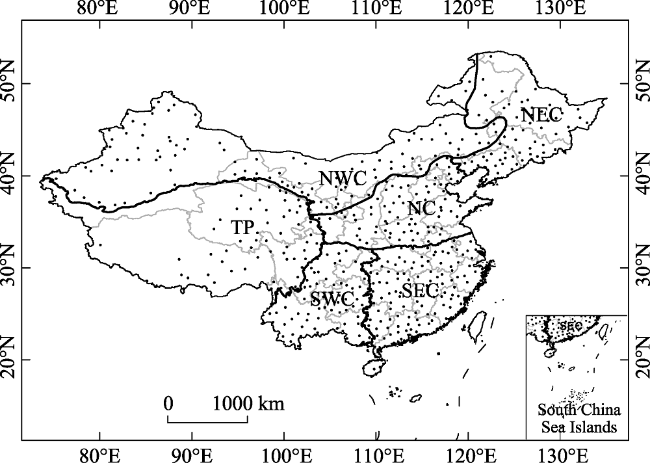
Figure 1 Locations of the 547 stations and different subareas in China: northeast China (NEC), northern China (NC), southeast China (SEC), southwest China (SWC), northwest China (NWC) and the Tibetan Plateau (the TP). The first four subareas are often regarded as the eastern monsoon regions of China.
This study used the quality-proven data on daily sunshine hours, temperature (maximum and minimum temperature), wind speed, relative humidity from 824 meteorological stations, and monthly precipitation data from 756 meteorological stations from the National Meteorological Information Center of the China Meteorological Administration (CMA) (http://cdc.nmic.cn/home.do)over China during 1961-2015. Many meteorological stations in China have observational records going back to the early 1950s. However, most data from the 1950s contains large amounts of gaps due to instrument malfunctions. Considering the length, quality, continuity, homogeneity of the records and the applicability of the assumed distribution of the SPEI, 547 stations were chosen for further calculations, as shown in Figure 1. Missing data of the selected meteorological stations is inevitable for long-term monitoring.The missing data from several stations is replaced by the average of the same date or same month in other years without missing data.The fill charts were drawn with the method of kriginginterpolation by using the software of ArcGIS10.

2.2 Calculation of Standardized Precipitation Evapotranspiration Index (SPEI)

The Standardized Precipitation Evapotranspiration Index (SPEI) based on the SPI (McKee et al., 1993) is a standardized meteorological drought index to quantify the severity of droughts conditions with consideration of water balance and spatial comparison at different time scales (Vicente-Serrano et al., 2010). The difference Di between precipitation Pi and PETi for the month iis calculated using:
${{D}_{i}}={{P}_{i}}-PE{{T}_{i}}$ (1)
The calculated Diis aggregated at different time scales. It is recommended to use a three-parameter log-logistic distribution for standardizing the accumulative series Di to obtain the SPEI at a given timescale. It calculates drought indices by standardizing the series Di at different time scales. The SPEI can characterize the degree of dryness/wetness deviation from normal conditions. To capture the spatio-temporal variations in drought more typically, we defined extreme drought as SPEI≤ -2 (Table 1) which is more closely related to drought disaster (Kelley et al., 2015). Drought duration (in months) was defined as a continuous period that SPEI is less than -1.0. By comparing the average annual SPEI and the areas of China’s crops affected by drought disasters from 1961 to 2015, the correlation coefficient of the SPEI at the 6-month time scale was higher than at other time scales. So, we selected 6-month time scale in all parts of the study except the analysis of critical precipitation as annual precipitation with 12 months scales of SPEI.
Table 1 Dryness/wetness categories according to the SPEI and the corresponding cumulative probabilities relative to the reference period (McKee et al,. 1993; Zhao et al., 2015)
Categories SPEI classifications Cumulative probability (%)
Extremely dry ≤-2.0 2.28
Severely dry -1.99 to -1.5 6.68
Moderately dry -1.49 to -1.0 15.87
Near normal -0.99 to 0.99 50.00
Moderately wet 1.0 to 1.49 84.13
Severely wet 1.5 to 1.99 93.32
Extremely wet ≥2.0 97.72
Not only PDSI with different parameters (e.g. the Thornthwaite and Penman-Monteith equations) leads to discrepant results in assessing droughts(Zhang et al., 2016), the SPEI also faces the similar outcomes. In this study, we used the SPEI index with PET recommended by FAO, which was considered to be better monitored for the observed variations in soil moisture and stream flow in China than the SPEI based on Thornthwaite equation (Chen and Sun, 2015; Thornthwaite, 1948; Zhao et al., 2015). Considering the capability of the selected distribution over China (Wang and Chen, 2014; Zhao et al., 2015), the log-logistic distribution was tested by Kolmogorov-Smirnov test, and all the data of D series passed the significance level test of 0.05. The reference period was the whole analysis period (1961-2015). The specific program on the website (http://digital.csic.es/handle/10261/10002) was used in this study. The critical precipitation of each station is the maximum 12 months cumulative precipitation when extreme drought (the SPEI≤-2) occurs at time scales of 12 months during 1961-2015.The frequency of extreme drought (FED) in this study is defined as the ratio of the number of extreme drought months with SPEI≤-2 to the total number of samples.

3 Results

3.1 Spatial patterns of critical precipitation

We first analyzed the spatial distribution of critical annual precipitation when extreme drought happened at 12-month time scale in the period 1961 to 2015 for 547 stations (Figure 2). It reflected the spatial differences of 12 months cumulative precipitation when extreme drought occurred under the background of local climate. The spatial distribution of critical annual precipitation presents an obvious zonal distribution. It is very similar to the spatial pattern of annual precipitation which is decreasing from southeast to northwest China. By comparing with average annual precipitation,extreme drought often happened when the cumulative precipitation was around half of local mean annual precipitation in the areas where the mean annual precipitation is less than 800 mm. The critical precipitation is 15 to 100 mm in northwest China where the average annual precipitation is less than 200 mm. Similarly, the critical precipitation is 100-200 mm and 200-500 mm respectively in the regionswhere the mean annual precipitationis 200-400 mm and 400-800 mm. In areas with annual precipitation over 800 mm (the SWC and the SEC), the critical precipitation is above half (around 5/8) of the average annual precipitation due to the relatively high temperature. Zhang et al. (2010) discovered that decreased precipitation was the key factor in drought formation in eastern China. Our results further suggest that when water and heat are both considered, precipitation plays a major role in the occurrence of extreme drought over China. The spatial distribution of critical precipitation can be used as reference information for early warning and drought mitigation measures.
Figure 2 The critical precipitation of extreme drought (points) and the average annual precipitation (P) during 1961-2015 (the filled areas)

3.2 Spatialvariations in the FED

3.2.1 Spatial variations in extreme drought frequency
To investigate the changes of extreme drought frequency in different areas during 1961 to 2015, the differences of extreme drought frequency between the two periods of 1988-2015 and 1961-1987 were shown in Figure 3. The time segmentation method referred to the idea of Zouet al. (2005), and there was a turning point in the FED around 1987 in China as shown in Figure 5g. The regions with theincreased FED by more than 2.0% were mainly in the northwest of the NEC, the northern agriculture-pasture transitional zone, the western part of the NC, the SWC and the western SEC. Yan and Yang (2000) reasoned that the aridification in northern China may come down to a decrease in the frequency of drizzles during 1951-1997. Most of the western part of China (the TP and the western part of the NWC), the eastern NEC, the NC and the SEC experienced the decreased FED. The FED had decreased by 4.0% - 8.2% in the mid-western NWC, the northern TP and the eastern NC.
Figure 3 The differencesin FED betweentwo periods: 1988-2015minus 1961-1987 (%)
The increased FED mainly occurred in a strip oriented from the SWC to the western NEC, whereas a large regional decrease in FED occurred in western China (most parts of the TP and the NWC) and eastern China (eastern part of the NEC, the NC and the SEC) from 1961 to 2015.This might be related to the changes in the sea surface temperature of the tropical Pacific and the tropical Indian Ocean, leading to frequent serious drought events in the central and southwest China (Zhaiet al., 2017). Zhang et al. (2015) also found that extreme drought events had gradually decreased in the Huaihe River Basin by using the Surface Humid Index. The increase in precipitation and relative humidity significantly reduced the FED in the North China Plain (the eastern NC) from 1962 to 2011 (Liu et al., 2013b). In conclusion, areas with the increased FED were mainly concentrated in central China and the western part of northeast China. The extent of the decreased FED was larger than that of the increased FED.
3.2.2 Spatialvariations in the seasonal FED
Figure 4 shows the average annual FED during 1961-2015 and the drought frequency variations in each station from 1961-1987 to 1988-2015 in four seasons. Generally, the FED occurred most frequently in spring. Nearly half of China suffered from spring droughts with an average annual FED of more than 2.5%. There are obvious differences in the spatial distribution of the FED between 1988-2015 and 1961-1987. Extreme drought frequency decreased by more than 6.0% in most parts of the NWC and the TP, the southeast part of the NEC and the SEC. Meanwhile, the FED increased by more than 2.0% mainly in the northern NEC, the central part of the NWC, the Huaihe River Basin (the southern NC and the northern SEC) and the southwestern and central parts of the SWC.
Figure 4 The average annual FED during 1961 to 2015 (shading) and the differences of extreme drought frequency between 1988-2015 and 1961-1987 (triangles) in spring (a), summer (b), autumn (c) and winter (d) (%)
The FED in summer was generally lower than that in spring. However, the scope and severity of extreme drought frequency showed little reduction in the western NWC and the TP. It may be due to the barrier effect of the Tibetan Plateau to the warm and humid air from the southeast monsoon and southwest monsoon, leading to little precipitation in the northwest of China. Moreover, the high temperature of summer increased the evapotranspiration, which increased extreme drought frequency in NWC. The decreased FED appeared in most parts of China, especially in the TP, the western NWC and the eastern NC. The regions where the FED increased by more than 2.0% were mainly located in the middle of NWC and the southwestern SWC.
A gradually increased FED was presented obviously from southeast to northwest in both summer and autumn over China. Located in the mid-latitude and the east coast of Eurasia, the East Asian monsoon brings more precipitation to the eastern regions of China in summer and autumn. The regions of decreased frequency with more than 6.0% in autumn mainly occurred in the central-western NWC, the northern TP and most parts of eastern China for the period of 1988-2015 relative to 1961-1987. The intensity and extent of the extreme drought frequency had increased obviously in autumn, including the eastern NWC, the western NEC and NC, the eastern TP and the southwestern SWC.
The FED in winter was generally the lowest in most parts of China, within 2.5%, from 1961 to 2015. A significant reduction in evapotranspiration for the lowest temperature might be the major reason for the lower FED. The general decreased FED occurred in most parts of the NWC, the western TP and eastern China. The increased frequency mainly appeared in central China from the central NWC, the western NC, the SWC to the western SEC. Generally, the seasonal order of the increased FED from more to less was spring, winter, autumn and summer.

3.3 Temporal variations in the FED

3.3.1 Inter-annual variations in the FED
The average annual FED among different subareas presented commonality as well as differences from 1961 to 2015 in China (Figure 5). Most subareas and the whole of China experienced the lowest FED from the mid-1980s to the mid-1990s. Most of China had experienced a widespread extreme drought from the mid-1960s to the early 1970s. An increase in the FED occurred in the NWC, the TP, the NC, the SEC and the whole of China in the 1960sand the early 1970s. An obvious increase of the FED has occurred in the NWC, the NEC and the NC since the late 1990s and the SWC since the late 2010s. Although the highest FEDs appeared in the early 1960s in the SEC, the drought of a single year did not seem to have had serious impact. In contrast, the relatively high FED in the 1960s had a strong impact in the NC, where serious drought disasters were recorded in 1962, 1965, 1966 and 1968 in HaiheRiver Basin (HPFFR, 1985).
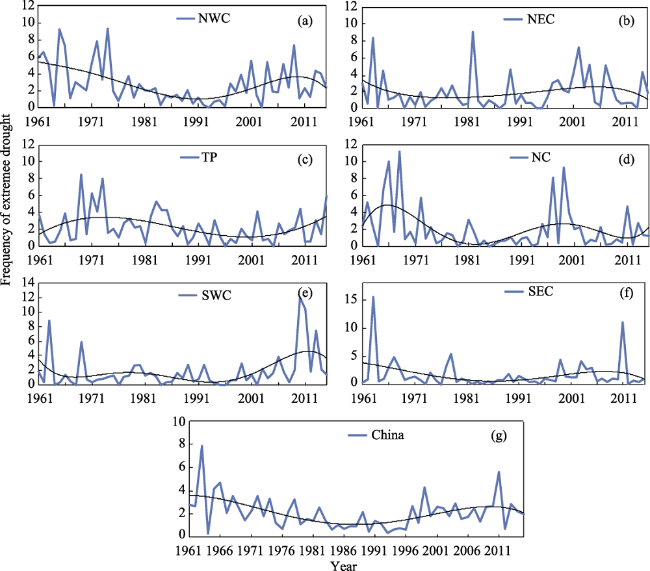
Figure 5 Time series of the average annual FED (broken lines) and 5-order polynomial fitting curves (curves) in different subareas (a-f) and China (g) during 1961-2015 (%)
Although there has not been a substantial change in the FED in recent decades, most subareas of China experienced a decrease before around 1997. Then, a wide range of extreme drought occurred in most parts of China since the 21st century. Compared to 17 extreme drought events in China, it is consistent with the extreme drought frequency above 6% in the corresponding subareas (Renet al., 2015). The decrease and concentration of precipitation in recent years contributed to a significant increase in the incidence of extreme drought events (Li et al., 2012).
3.3.2 Inter-decadalvariationsinfrequency of extreme drought
The inter-decadal variations in severe drought disasters are closely related to the summer Asian
Monsoon, which caused significant changes in summer precipitation patterns in both East and South Asia (Ding et al., 2013). Table 2 illustrates that the highest FED for the NWC, the NC and the SEC are concentrated in the 1960s. This was probably due to the two weakened summer monsoon in the middle of 1960s and the late of 1970s (Huang et al., 2004). There was a continuous increase in the decadal FED from the 1990s to 2015 in the TP, the SEC, the SWC and the whole of China. This might be related to the significant decreaseof winter and spring snow over the TP since the late 1990s (Si and Ding, 2013), which led to the high summer precipitation region shifting northward from the Yangtze River Basin to the HuaiheRiver Basin. The maximum variations between the maximal and minimal FED is more than five times in the NC, SEC and SWC, where there is a risk of high droughts and floods.The increased frequency of droughts since 2000 affecting agricultural production and frequency of drought-related disasters have been increasing and have led to growing economic losses in China (Qin et al., 2015).
Table 2 Inter-decadal FED in different subareas during 1961-2015(The upward arrow indicates changes in frequency relative to the past decade.)
Regions Frequency of extreme drought (%)
1960s 1970s 1980s 1990s 2000s 2010-2015
NEC 2.2 1.3 1.8 1.5 3.0↑ 1.3
NWC 4.3 3.8 1.4 1.3 3.2↑ 2.6
TP 2.4 3.4 2.5 1.3 1.9↑ 2.7↑
NC 4.3 1.4 0.8 2.8 1.0 1.8↑
SEC 3.2 1.5 0.6 1.2 1.7↑ 2.4↑
SWC 2.0 1.2 1.1 0.9 2.6↑ 5.9↑
China 3.2 2.1 1.2 1.5 2.2↑ 2.7↑

3.4 Variations in drought duration

3.4.1 Variations in inter-annual scope of different drought duration
Different duration of continuous drought may result in different degrees of influence onvarious departments and industries. The analysis of the characteristics of different continuous periods is beneficial for the research of the laws, causes and mechanisms of extreme drought. The temporal variations in the number of meteorological stations under different duration of continuous drought from 2 months to 12 months are shown in Figure 6. There was an obviousdecrease of meteorological stations from the early 1980s to the mid-1990s under the total cumulative continuous periods of 2 to 12 months. The similar characteristics of continuous drought also appeared in 3 and 7 to 12 months, respectively. There were 50 to 100 stations for 2 months of continuous drought and 25 to 50 stations for 3 months of continuous droughtduring 1961 to 2015.From 2 months to 3 monthsof continuous drought, the number of stations of continuous drought had reduced by half. The double decreasing also occurred from 7 to 9 months. However, the differences in the station number of continuous drought were relatively small among 4 to 6 months with 0 to 50 stations. A similar situation also occurred from 10 to 12 months with 0 to 5 stations. It can be inferred that continuous drought of 6 or 12 months may probably lead to more severe drought disasters due to longer duration.
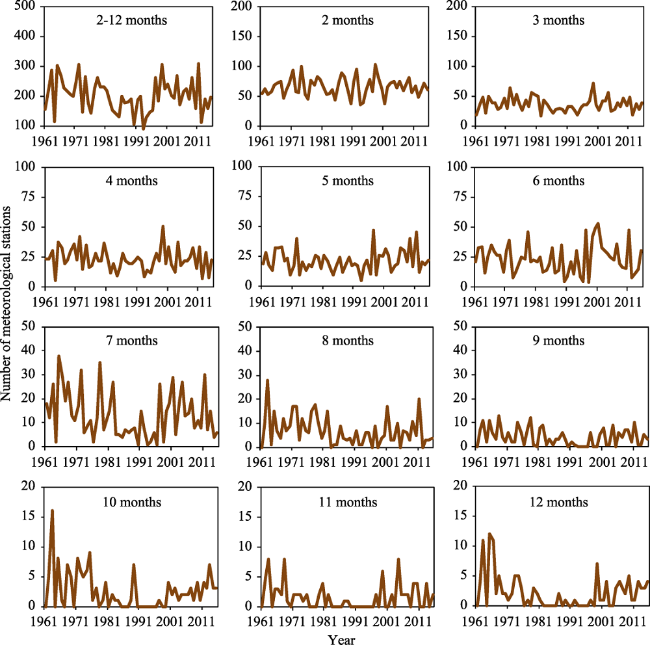
Figure 6 Time series of annual number of meteorological stations under the specific drought duration (consecutive months with SPEI ≤ -1.0) in China during 1961-2015
3.4.2 The decades of the longest continuous drought
In Figure 7, 385 stations were detected the sole decade of the longest continuous drought during 1961-2015 over China. The number of meteorological stations in each decade was 112, 80, 35, 31, 84 and 43 from the 1960s to 2010s, respectively. The most extensive continuous drought in China occurred in the 1960s. There was no obvious regional distribution of the longest continuous drought in both the 1960s and the 1970s. The longest continuous drought in the 1980s and 1990s mainly appeared in the southern and central parts of the NEC, the Hetao area (the junction of the southern part of the NWC and the northwest NC) and the western SEC. There was a significant increase in the scope of the longest continuous drought in the 2000s, which mainly occurred in the NEC, the SWC and the eastern SEC. It is noteworthy that more than 30% of stations detected the longest continuous drought since the 2000s, and about 50% of them occurred from 2011 to 2015, which far exceeded the number in the 1980s or the 1990s.Compared with the extent in the 1980s and the 1990s, the areas of the longest continuous drought showed a national increase except the TP and the NC since the 21st century.
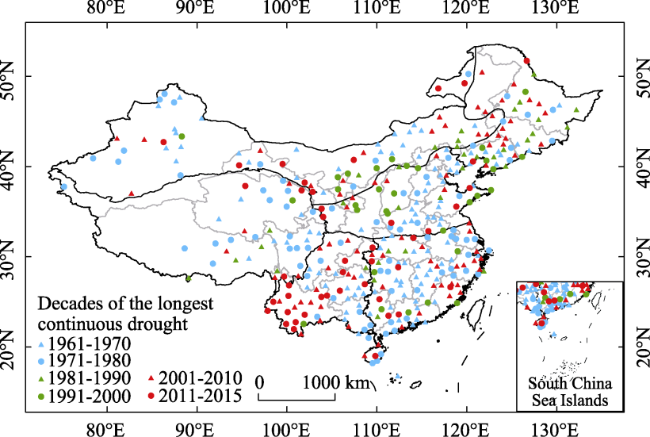
Figure 7 Decades when the longest continuous drought (SPEI≤-1) occurred during 1961-2015

4 Discussion

Under the background of global climate warming, the frequency and intensity of drought events may probably increase in the 21st century.Drought disasters caused by different intensity of drought events varied greatly. Droughts that caused severe drought disasters often occurred in droughts with long duration and high drought intensity (i.e. the level of extreme drought). The analysis of the spatio-temporal variations in extreme droughts will be conductive to improve the understanding of the occurrence, development, and possible causes of extreme droughts. It will also provide an important prerequisite for effective drought prevention and drought resistance. However, the existing studies had less research on the variations in extreme drought in China. This paper focuses on the occurrence and variations in extreme drought based on meteorological observation data in China.
It is worth mentioning that different conclusions are likely to be reached using different drought definitions, methods, datasets and application areas (Potopet al., 2012; Sheffield et al., 2012; Yu et al., 2014; Chen and Sun, 2015). The drying trends using the drought indices based on temperature or potential evapotranspiration calculated by Thornthwait’s formula were more severe than those of methods based on FAO Penman-Monteith equation, especially in northern China (Ma and Fu, 2006; Zhang et al., 2015). Vicente-Serrano et al. (2012) also found that drought indices based on temperature data (such as the PDSI) were preferable for identifying drought impact on vegetation activity and growth. Drought responses were more sensitive to elevated temperature in northern China, especially in the arid regions, while relatively large responses to precipitation were found mainly in southern China (Chen and Sun, 2015). Changes in extreme climate events are often more sensitive to various climate change monitoring activities, making it more difficult to assess changes in extreme climate events than to assess changes in the mean (Cook et al., 2014). Therefore, it is a more difficult and more important problem to estimate the long-term climate change of the low probability of extreme drought than the mean state of the climate (Katz and Brown 1992; Plummer et al., 1999). An accurate method and higher-quality homogenized temperature data are important pre-conditions to detect the change and trend of extreme events accurately. By contrasting records (NBSPRC, 1995; HPFFR, 1985) of drought disaster with the FED in this study, the latter is consistent with severe drought disaster events, especially in Haihe Basin and northern China in 1962, 1965, 1966, 1968, 1972 and 1978, with extreme drought in the SPEI occurring more than 3-6 times per decade per station.
The frequency of extreme drought had changed obviously in most parts of China during the period 1961-2015. The regions where the FED increased were mainly distributed in a strip from the western part of northeast China to southwest China.The increase in the FED occurred in the western part of northeast China mainly in spring and autumn, and the increase in the northern agricultural and pastoral areas was mainly in spring. In most parts of the SWC, the FED increased significantly in spring, autumn and winter. In all, the FED of China has been the most widely distributed in spring since 1961. The FED of the NC mainly increased in the 1990s, while the FED of other subareas increased significantly since the 2000s. Moreover, it showed persistent increase in the FED in the TP, the SWC and the SEC in the 21st century.Although the widest range of the longest continuous drought occurred in the 1960s, the fact that the markedly increase in the 21st century are also worth noting, especially since 2011 in most parts of the SWC and the SEC.
In this paper, the analysis of spatial and temporal changes of the extreme drought was based on the changes of the occurrence probability (2.28%) of cumulative water deficit anomaly. The direct causes of extreme drought are the exceptionally low precipitation and the increase in potential evapotranspiration caused by a significant increase in temperature.Although drought disasters are a regional phenomenon, their occurrence is often affected by continuous large-scale circulation anomalies.The weakened trend of summer monsoons may probably lead to a long-term and widespread drought in the Yellow River basin and northern China (Zhang and Zhou, 2015). The western Pacific subtropical high to the north often leads to drought in the Yangtze River basin. In addition, the Yangtze River basin often experienced dry years when the position of the Tibetan Plateau high pressure is more easterly than the Tibetan Plateau. The FED in the TP, the SWC and the SEC exhibited a consistent persistent trend of increase in the 21st century.It is speculated that there are certain links on droughts and floods in the three regions. The development stage of ENSO has a significant impact on the low rainfall and drought in the middle and upper reaches of the Yangtze River basin and in northern China (Ye et al., 1996). For example, the ENSO development year in 1963, 1965, 1968, 1972 and 1982 showed a high FED of extreme drought in Figure 5g. The results of this study will enhance our understanding of the variations in extreme drought in China, and the mechanism and reasons of extreme drought as well as the applicability of different time scales to various types of drought should be studied further.

5 Conclusions

Spatio-temporal distributions and variations in frequency of extreme drought (FED) and the longest continuous drought in China were examined during the period of 1961-2015 from inter-decadal, inter-annual and seasonal time scales in China and its six subareas. The conclusions showed that:
(1) The critical precipitation of extreme drought decreased from southeast China (more than 1500 mm) to northwest China (less than 50 mm) during 1961-2015. The extreme drought began to occur when the 12 months cumulative precipitation in the NWC, the NEC and the NC was around 1/2 of the annual average precipitation, and extreme drought in the SWC and the SEC usually occurred when the cumulative precipitation was less than 5/8 of the mean annual precipitation. Therefore, the annual precipitation was considered to be the main determinant of extreme drought occurrence in China.
(2) A drying strip stretching from the SWC to the western NEC had experienced significantly increased FED from 1961-1987 to 1988-2015. The decreased FED mainly occurred in eastern China (most areas of the TP and the NWC) and western China (western regions of the NEC, the NC and the SEC). The extent of the decreased frequency in western and eastern China was larger than that of the increased frequency which was mainly concentrated in central China and the western part of northeast China. The seasons of the increased FED from more to less were spring, winter, autumn and summer.
(3) The FED experienced a decrease before 1997, followed by a wide range of droughts sincethe 21st century. The maximum frequency mainly occurred from the 1960s to the early 1970s in the NWC, the NC, the TPC and the SEC. There was a continuous increase in the decadal FED from the 1990s to 2015 in the TP, the SEC, the SWC and the whole of China.
(4) The differences in the station number that documented continuous drought were relatively small between 4 and 6 months and from 10 to 12 months of continuous drought. The number of stations that documented the longest continuous drought in each decade was 114, 78, 33, 29, 83 and 42 from the 1960s to the 2010s. Compared with the 1980s and 1990s, the number of meteorological stations of the longest continuous drought had an increased distribution since the 21st century.

The authors have declared that no competing interests exist.

[1]
Allen R G, Pereira L S, Raes D et al., 1998. Crop Evapotranspiration: Guidelines for Computing Crop Water Requirements. FAO Irrigation and Drainage Paper 56, 300.

[2]
Beguería S, Vicente-Serrano S M, Reig F et al., 2014. Standardized precipitation evapotranspiration index (SPEI) revisited: parameter fitting, evapotranspiration models, tools, datasets and drought monitoring.International Journal of Climatology, 34(10): 3001-3023.ABSTRACTThe standardized precipitation evapotranspiration index (SPEI) was developed in 2010 and has been used in an increasing number of climatology and hydrology studies. The objective of this article is to describe computing options that provide flexible and robust use of the SPEI. In particular, we present methods for estimating the parameters of the log-logistic distribution for obtaining standardized values, methods for computing reference evapotranspiration (ET0), and weighting kernels used for calculation of the SPEI at different time scales. We discuss the use of alternative ET0 and actual evapotranspiration (ETa) methods and different options on the resulting SPEI series by use of observational and global gridded data. The results indicate that the equation used to calculate ET0 can have a significant effect on the SPEI in some regions of the world. Although the original formulation of the SPEI was based on plotting-positions Probability Weighted Moment (PWM), we now recommend use of unbiased PWM for model fitting. Finally, we present new software tools for computation and analysis of SPEI series, an updated global gridded database, and a real-time drought-monitoring system.

DOI

[3]
Chen H P, Sun J Q, 2015. Changes in drought characteristics over China using the standardized precipitation evapotranspiration index.Journal of Climate, 28: 5430-5447.ABSTRACT The standardized precipitation evapotranspiration index (SPEI) is computed and compared in China using reference evapotranspiration calculated using the Thornthwaite (TH) approach and the Penman-Monteith (PM) equation. The analysis reveals that SPEI_PM outperforms the SPEI_TH with regard to drought monitoring during the period 1961-2012 over China, especially in arid regions of China. Furthermore, the SPEI_PM also performs better with regard to observed variations in soil moisture and streamflow in China. Thus, changes in drought characteristics over China are detected on the basis of variations in the SPEI_PM. The results indicate that droughts over China exhibit pronounced decadal variations over the past 50 yr, with more frequent and severe droughts occurring before the 1980s and in the 2000s compared with the 1980s and 1990s. Since the late 1990s, droughts have become more frequent and severe across China, especially in some regions of northern China. Concurrently, consecutive drought events have also increased across China. This suggests that dry conditions in China have been enhanced in recent years. Further analyses illustrate that the temperature and precipitation anomalies exhibit different roles in detecting droughts across China, which is primarily due to the magnitude of their variations and different climate variability. Considering temperature and precipitation perturbations, droughts exhibit relatively larger responses to temperature fluctuations in northern China and relatively larger responses to precipitation anomalies in southern China.

DOI

[4]
Cook B I, Smerdon J E, Seager R et al., 2014. Global warming and 21st century drying.Climate Dynamics, 43: 2607-2627.Global warming is expected to increase the frequency and intensity of droughts in the twenty-first century, but the relative contributions from changes in moisture supply (precipitation) versus evaporative demand (potential evapotranspiration; PET) have not been comprehensively assessed. Using output from a suite of general circulation model (GCM) simulations from phase 5 of the Coupled Model Intercomparison Project, projected twenty-first century drying and wetting trends are investigated using two offline indices of surface moisture balance: the Palmer Drought Severity Index (PDSI) and the Standardized Precipitation Evapotranspiration Index (SPEI). PDSI and SPEI projections using precipitation and Penman-Monteith based PET changes from the GCMs generally agree, showing robust cross-model drying in western North America, Central America, the Mediterranean, southern Africa, and the Amazon and robust wetting occurring in the Northern Hemisphere high latitudes and east Africa (PDSI only). The SPEI is more sensitive to PET changes than the PDSI, especially in arid regions such as the Sahara and Middle East. Regional drying and wetting patterns largely mirror the spatially heterogeneous response of precipitation in the models, although drying in the PDSI and SPEI calculations extends beyond the regions of reduced precipitation. This expansion of drying areas is attributed to globally widespread increases in PET, caused by increases in surface net radiation and the vapor pressure deficit. Increased PET not only intensifies drying in areas where precipitation is already reduced, it also drives areas into drought that would otherwise experience little drying or even wetting from precipitation trends alone. This PET amplification effect is largest in the Northern Hemisphere mid-latitudes, and is especially pronounced in western North America, Europe, and southeast China. Compared to PDSI projections using precipitation changes only, the projections incorporating both precipitation and PET changes increase the percentage of global land area projected to experience at least moderate drying (PDSI standard deviation of も 1) by the end of the twenty-first century from 12 to 30 %. PET induced moderate drying is even more severe in the SPEI projections (SPEI standard deviation of も 1; 11 to 44 %), although this is likely less meaningful because much of the PET induced drying in the SPEI occurs in the aforementioned arid regions. Integrated accounting of both the supply and demand sides of the surface moisture balance is therefore critical for characterizing the full range of projected drought risks tied to increasing greenhouse gases and associated warming of the climate system.

DOI

[5]
Dai A G, 2013. Increasing drought under global warming in observations and models.Nature Climate Change, 3(1): 52-58.Historical records of precipitation, streamflow and drought indices all show increased aridity since 1950 over many land areas(1,2). Analyses of model-simulated soil moisture(3,4), drought indices(1,5,6) and precipitation-minus-evaporation(7) suggest increased risk of drought in the twenty-first century. There are, however, large differences in the observed and model-simulated drying patterns(1,2,6). Reconciling these differences is necessary before the model predictions can be trusted. Previous studies(8-12) show that changes in sea surface temperatures have large influences on land precipitation and the inability of the coupled models to reproduce many observed regional precipitation changes is linked to the lack of the observed, largely natural change patterns in sea surface temperatures in coupled model simulations(13). Here I show that the models reproduce not only the influence of El Nino-Southern Oscillation on drought over land, but also the observed global mean aridity trend from 1923 to 2010. Regional differences in observed and model-simulated aridity changes result mainly from natural variations in tropical sea surface temperatures that are often not captured by the coupled models. The unforced natural variations vary among model runs owing to different initial conditions and thus are irreproducible. I conclude that the observed global aridity changes up to 2010 are consistent with model predictions, which suggest severe and widespread droughts in the next 30-90 years over many land areas resulting from either decreased precipitation and/or increased evaporation.

DOI

[6]
Ding Y L, Sun Y, Liu Y Y et al., 2013. Interdecadal and interannual variabilities of the Asian summer monsoon and its projection of future change.Chinese Journal of Atmospheric Sciences, 37(2): 253-280.

[7]
Easterling D R, Evans J L, Groisman P Y et al., 2000. Observed variability and trends in extreme climate events: A brief review.Bulletin of the American Meterological Society, 81: 417-425.

DOI

[8]
Frich P, Alexander L V, Dellamarta P et al., 2002. Observed coherent changes in climatic extremes during the second half of the twentieth century.Climate Research, 19: 193-212.

DOI

[9]
Hebei Province Drought and Flood Forecasting Project Group (HPFFR), 1985. Natural Disasters of Haihe Basin in History. Beijing: China Meteorological Press, 65-226. (in Chinese)

[10]
Heim R R Jr, 2002. A review of twentieth-century drought indices used in the United States. Bulletin of the American Meterological Society, 83: 1149-1165.Drought is a recurring phenomena that has plagued civilization throughout history. It affects natural habitats, ecosystems, and many economic and social sectors, from the foundation of civilization--agriculture--to transportation, urban water supply,%and the modern complex industries. The wide variety of sectors affected by drought, its diverse geographical and temporal distribution, and the demand placed on water supply by human-use systems make it difficult to develop a single definition of drought. The American Meteorological Society (1997) groups drought definitions and types into four categories: meteorological or climatological, agricultural, hydrological, and socioeconomic. A prolonged (e.g., of several months or years duration) meteorological drought--the atmospheric conditions resulting in the absence or reduction of precipitation--can develop quickly and end abruptly (in some cases, the transition can occur almost literally overnight). Short-term (i.e., a few weeks duration)dryness inthe surface layers (root zone), which occurs at a critical time during the growing season, can result in an agricultural drought that severely reduces crop yields, even though deeper soil levels may be saturated. Hot temperatures, low relative humidity,and desiccating winds often add to the impact of the lack of rainfall (Condra 1944). The onset of an agricultural drought may lag that of a meteorological drought, depending on the prior moisture status of the surface soil layers.

DOI

[11]
Hoerling M, Eischeid J, Kumar A et al., 2014. Causes and predictability of the 2012 Great Plains drought.Bulletin of the American Meteorological Society, 95(2): 269-282.Central Great Plains precipitation deficits during May-August 2012 were the most severe since at least 1895, eclipsing the Dust Bowl summers of 1934 and 1936. Drought developed suddenly in May, following near-normal precipitation during winter and early spring. Its proximate causes were a reduction in atmospheric moisture transport into the Great Plains from the Gulf of Mexico. Processes that generally provide air mass lift and condensation were mostly absent, including a lack of frontal cyclones in late spring followed by suppressed deep convection in the summer owing to large-scale subsidence and atmospheric stabilization. Seasonal forecasts did not predict the summer 2012 central Great Plains drought development, which therefore arrived without early warning. Climate simulations and empirical analysis suggest that ocean surface temperatures together with changes in greenhouse gases did not induce a substantial reduction in summertime precipitation over the central Great Plains during 2012. Yet, diagnosis of the retrospective climate simulations also reveals a regime shift toward warmer and drier summertime Great Plains conditions during the recent decade, most probably due to natural decadal variability. As a consequence, the probability of the severe summer Great Plains drought occurring may have increased in the last decade compared to the 1980s and 1990s, and the so-called tail risk for severe drought may have been heightened in summer 2012. Such an extreme drought event was nonetheless still found to be a rare occurrence within the spread of 2012 climate model simulations. The implications of this study's findings for U.S. seasonal drought forecasting are discussed. [FIGURE 1 OMITTED] Central Great Plains' rains, occurring mostly during May-August, failed in 2012. Absent was the usual abundance of slow-soaking precipitation-bearing systems and evening thunderstorms that characterize the Great Plains climate, and as a result surface moisture conditions greatly deteriorated. The U.S. Drought Monitor estimated that over three-quarters of the contiguous United States experienced at least abnormally dry conditions by the summer's end with nearly half of the region, especially the Great Plains, experiencing severe drought. Conditions were comparable to those of a quarter-century earlier during 1988, and the combination of rainfall deficits and high temperatures even rivaled those observed during the Dust Bowl era of the 1930s. Daily rainfall time series from observations taken at weather stations across the Great Plains (Fig. 1) illustrate the timing of drought on set. After a period of near to above normal winter and early spring precipitation at most stations over the central Great Plains, rains abruptly halted in May. For instance, there were virtually no rainy days at Cedar Rapids, Iowa, during May, a signature of the paucity in migratory cyclones and frontal systems that have been previously identified as drought-causing mechanisms for spring and some summer droughts (e.g., Dole 2000). Neighboring stations also experienced prolonged stretches of rain-free days, with no measurable precipitation at Omaha, Nebraska, during July consistent with an absence of rain-producing thunderstorms that typically account for the bulk of midsummer rainfall in the U.S. heartland (e.g., Dai 2001). Likewise, the western plains stations of Goodland, Kansas,...

DOI

[12]
Huang R, Huang G, Wei Z, 2004. Climate Variations of the Summer Monsoon over China. Singapore: World Scientific Press, 213-268.

[13]
Jain V K, Pandey R P, Jain M K, 2015. Spatio-temporal assessment of vulnerability to drought.Natual Hazards, 76: 443-469.This paper proposes a methodology for assessment of drought vulnerability at spatial and temporal scales using physiographic, climatic and hydrologic factors by integrating relative influence of different factors at the scale of hydrologic response units (HRUs). In the proposed methodology, an index termed as ntegrated Drought Vulnerability Index (IDVI) is devised as an indicator of vulnerability to drought. The SWAT model has been applied to demarcate HRUs and estimation of soil moisture in the study basin. Spatial information of different influencing factors is categorized into various sub-classes, and maps have been prepared using ArcGIS. In this analysis, monthly rainfall departure is considered as climatic factor and Soil Moisture Deficit Index as hydrologic factor. The applicability of the proposed methodology is demonstrated on the Ken River basin, located in the Bundelkhand region in central India. Using the proposed methodology, maps showing spatial distribution of relative vulnerability to drought have been obtained at the level of HRU. The HRUs with higher value of IDVI represent the areas with relatively high degree of vulnerability to drought and vice versa. The maps thus obtained have been validated using the documented information. The present methodology provides better insight for drought mitigation actions.

DOI

[14]
Katz R W, Brown B G, 1992. Extreme events in a changing climate: Variability is more important than averages.Climatic Change, 21: 289-302.Extreme events act as a catalyst for concern about whether the climate is changing. Statistical theory for extremes is used to demonstrate that the frequency of such events is relatively more dependent on any changes in the variability (more generally, the scale parameter) than in the mean (more generally, the location parameter) of climate. Moreover, this sensitivity is relatively greater the more extreme the event. These results provide additional support for the conclusions that experiments using climate models need to be designed to detect changes in climate variability, and that policy analysis should not rely on scenarios of future climate involving only changes in means.

DOI

[15]
Kelley C P, Mohtadi S, Cane M A et al.,2015. Climate change in the fertile crescent and implications of the recent Syrian drought.Proceedings of the National Academy of Sciences, 112: 3241-3246.Abstract Before the Syrian uprising that began in 2011, the greater Fertile Crescent experienced the most severe drought in the instrumental record. For Syria, a country marked by poor governance and unsustainable agricultural and environmental policies, the drought had a catalytic effect, contributing to political unrest. We show that the recent decrease in Syrian precipitation is a combination of natural variability and a long-term drying trend, and the unusual severity of the observed drought is here shown to be highly unlikely without this trend. Precipitation changes in Syria are linked to rising mean sea-level pressure in the Eastern Mediterranean, which also shows a long-term trend. There has been also a long-term warming trend in the Eastern Mediterranean, adding to the drawdown of soil moisture. No natural cause is apparent for these trends, whereas the observed drying and warming are consistent with model studies of the response to increases in greenhouse gases. Furthermore, model studies show an increasingly drier and hotter future mean climate for the Eastern Mediterranean. Analyses of observations and model simulations indicate that a drought of the severity and duration of the recent Syrian drought, which is implicated in the current conflict, has become more than twice as likely as a consequence of human interference in the climate system.

DOI PMID

[16]
Keyantash J, Dracup J A, 2002. The quantification of drought: An evaluation of drought indices.Bulletin of the American Meteorological Society, 83: 1167-1180.Indices for objectively quantifying the severity of meteorological, agricultural, and hydrological forms of drought are discussed. Indices for each drought form are judged according to six weighted evaluation criteria: robustness, tractability, transparency, sophistication, extendability, and dimensionality. The indices considered most promising for succinctly summarizing drought severity are computed for two climate divisions in Oregon for 24 water years, 1976-99. The assessment determined that the most valuable indices for characterizing meteorological, hydrological, and agricultural droughts are rainfall deciles, total water deficit, and computed soil moisture, respectively.

DOI

[17]
Lesk C, Rowhani P, Ramankutty N, 2016. Influence of extreme weather disasters on global crop production.Nature, 529: 84-87.

DOI

[18]
Liu K, Jiang D B, 2014. Interdecadal change and cause analysis of extreme summer and winterdroughts over China.Chinese Journal of Atmospheric Sciences, 38(2): 309-321. (in Chinese)Temperature and precipitation data from 540 meteorological stations in China from 1961 to 2009, and the piecewise-linear fitting model(PLFIM) was used to analyze the changes in summer and winter temperature and precipitation at the interdecadal timescale. The Palmer drought severity index(PDSI) was chosen to examine the frequency of extreme droughts. Consequently, the interdecadal changes and spatial distribution characteristics of extreme droughts were analyzed for summer and winter. Furthermore, we considered the effect of temperature and precipitation on the occurrence probability of extreme droughts. The results suggest that from 1961 to 2009, extreme droughts were more frequent in northern China than in southern China during summer, whereas they were more frequent in eastern China than in western China during winter. After the last trend change, the occurrence probabilities of extreme summer and winter droughts increased. At the regional scale, the probability of extreme summer droughts increased in Northeast China, North China, and Northwest China, whereas the probability of extreme winter droughts significantly increased in Northeast China, North China, South China, and Southwest China. The analysis of the causes of the variations in the occurrence probabilities of extreme droughts showed that the precipitation change controlled the trend in the occurrence probability of extreme droughts before the 1990s. Subsequently, climate warming led to an increasing trend in the occurrence probability of extreme droughts, whereas the temperature and precipitation changes controlled the occurrence probability of extreme droughts over China.

[19]
Liu X J, Zhang J Q, Ma D L et al., 2013a. Dynamic risk assessment of drought disaster for maize based on integrating multi-sources data in the region of the northwest of Liaoning Province, China.Natural Hazards, 65: 1393-1409.The traditional studies on drought disaster risk were based on the ground point data, which were unable to realize the continuity of space and the timeliness. It is shown that the monitoring and evaluation precision on drought were reduced significantly. However, remote sensing data in adequate spatial and temporal resolution can overcome these limitations. It can better monitor the crop in large area dynamically. This study presents a methodology for dynamic risk analysis and assessment of drought disaster to maize production in the northwest of Liaoning Province based on remote sensing data and GIS from the viewpoints of climatology, geography and disaster science. The model of dynamic risk assessment of drought disaster was established based on risk formation theory of natural disaster, and the expression of risk by integrating data came from sky, ground and space. The risk indexes were divided into four classes by data mining method, and the grade maps of drought disaster risk were drawn by GIS. It is shown that the spatial and temporal risk distributions of maize at each growth stage changed over time. The model has been verified against reduction in maize yield caused by drought. It demonstrated the reasonability, feasibility and reliability of the model and the methodology. The dynamic risk assessment of regional drought disaster for maize can be used as a tool, which can timely monitor the status (the possibility and extent of drought) and trends of regional drought disaster. The results obtained in this study can provide the latest information of regional drought disaster and the decision-making basis of disaster prevention and mitigation for government management and farmers.

DOI

[20]
Liu W L, Zhang M J, Wang S J, 2013b. Temporal-spatial variation characteristics of extreme drought events in North China Plain during recent 50 years.Bulletin of Soil and Water Cnservation, 33(4): 90-95. (in Chinese)

[21]
Li W G, Yi X, Hou M T et al., 2012. Standardized precipitation evapotranspiration index shows drought trends in China.Chinese Journal of Eco-Agriculture, 20(5): 643-649. (in Chinese)Standardized precipitation evapotranspiration index(SPEI),calculated from the difference between potential evapotranspiration and precipitation,showed dry and wet deviations from normal conditions.This is generally used as an indicator for drought evolution trends in drought assessments,water resources management and other fields of hydrology.Using monthly mean surface air temperature and precipitation collected from 160 meteorological stations across China for 1951-2009,spatial distributions of seasonal drought trends and frequencies of extreme drought events were analyzed via SPEI.The results showed drying trends across the whole of China.The most significant drought was in the west,north and northeast of China.It was,however,wet in some regions of northern Xinjiang and the border regions of Sichuan and Yunnan.Drying trends existed for all four seasons,and were more obvious in spring and autumn.Summer was always dry in the last 15 years,although with a drying trend insignificant at the 0.05 level.Furthermore,the frequency of extreme drought increased significantly.Significant trends in temperature increase along with moderate trends in precipi-tation decline were noted for many stations in the northeast and north of China.The combined effects of precipitation and temperature caused significant droughts in the country.In the Sichuan Basin,precipitation significantly decreased with no significant change in temperature.Drought in Sichuan Basin was largely attributed to decreasing precipitation.In recent years,extreme drought events in-creased with decreasing frequencies of precipitation events in many areas of China.Widespread drought trends and significant in-creases in extreme drought events probably hindered China's economic development.SPEI-detected drought trends were mostly con-sistent with observed droughts in China,indicating that SPEI was an ideal index for monitoring drying trends.

DOI

[22]
Lloyd-Hughes B, Saunders M A, 2002. A drought climatology for Europe.International Journal of Climatology, 22: 1571-1592.Abstract We present a high spatial resolution, multi-temporal climatology for the incidence of 20th century European drought. The climatology provides, for a given location or region, the time series of drought strength, the number, the mean duration, and the maximum duration of droughts of a given intensity, and the trend in drought incidence. The drought climatology is based on monthly standardized precipitation indices (SPIs) calculated on a 0.5° grid over the European region 35–70 °N and 35 °E–10 °W at time scales of 3, 6, 9, 12, 18, and 24 months for the period 1901–99. The standardized property facilitates the quantitative comparison of drought incidence at different locations and over different time scales. The standardization procedure (probability transformation) has been tested rigorously assuming normal, log–normal, and gamma statistics for precipitation. Near equivalence is demonstrated between the Palmer drought severity index (PDSI) and SPIs on time scales of 9 to 12 months. The mean number and duration by grid cell of extreme European drought events (SPI ≤ 612) on a time scale of 12 months is 6 ± 2 months and 27 ± 8 months respectively. The mean maximum drought duration is 48 ± 17 months. Trends in SPI and PDSI values indicate that the proportion of Europe experiencing extreme and/or moderate drought conditions has changed insignificantly during the 20th century. We hope the climatology will provide a useful resource for assessing both the regional vulnerability to drought and the seasonal predictability of the phenomenon. Copyright 08 2002 Royal Meteorological Society.

DOI

[23]
Lu E, Luo Y L, Zhang R H, 2011. Regional atmospheric anomalies responsible for the 2009-2010 severe drought in China. Journal of Geophysical Research, 116(D21114). doi: 10.1029/2011JD015706.The severe drought that emerged in summer 2009 and maintained in the subsequent fall and winter in Southwest China caused a significant shortage of drinking and drainage water.Precipitation during the drought is much less than normal, and the meteorological drought extent exceeds the climatic mean in almost all the days during the period.The warmer-than-normal surface temperature facilitates the hydrological and agricultural drought through enhancing surface evaporation.The less-than-normal water vapor in the atmosphere and warmer-than-normal air temperature both contribute to the lower-than-normal relative humidity and thus the less-than-normal precipitation.The water vapor transport during the drought has no significant change in track, but is much weaker in strength across the Southwest.The weaker-than-normal water vapor transport and convergence in the fall and winter make the air hard to form heavy rains.The warmer-than-normal temperature corresponds to positive anomalies of geopotential thickness, with negative anomalies of geopotential height at lower levels but strong positive anomalies at middle and upper levels.The warmer-than-normal air temperature is important to the maintenance of the drought at this time of the year under the dry atmospheric condition.The persistent warm temperature makes the air hard to become saturated, and thus hard to form even light rains, which are efficient in mitigating drought.The inherent mechanism in the atmosphere, namely the positive feedback between less precipitation and warm temperature, helps maintain the drought.

DOI

[24]
Ma Z G, Fu C F, 2006. The basic fact of drying in northern China during 1951 to 2004.Chinese Science Bulletin, 51(20): 2429-2439. (in Chinese)

[25]
McKee T B, Doesken N J, Kleist J, 1993. The relationship of drought frequency and duration to time scales.Eighth Conference on Appiled Climatology, 17-22.

[26]
Meteorological Institute of the Central Meteorological Bureau(MICMB), 1981. The Drought and Flood Distribution Atlas over China in the Recent Five Hundred Years. Beijing: China Meteorological Press, 11-116. (in Chinese)

[27]
National Bureau of Statistics of People’s Republic of China (NBSPRC), 1995. Report of the Damage Caused by Disaster in China (1949-1995). Beijing: China Statistics Press, 25-260.(in Chinese)

[28]
Plummer N, Salinger M J, Nicholls N et al., 1999. Changes in climate extremes over the Australian region and New Zealand during the twentieth century.Climatic Change, 42: 183-202.Analyses of high quality data show that there have been some interesting recent changes in the incidence of some climate extremes in the Australian region and New Zealand.

DOI

[29]
Potop V, Možný M, Soukup J, 2012. Drought evolution at various time scales in the lowland regions and their impact on vegetable crops in the Czech Republic.Agricultural and Forest Meteorology, 156: 121-133.http://linkinghub.elsevier.com/retrieve/pii/S0168192312000044

DOI

[30]
Qin D H, Zhang J Y, Shan C C et al., 2015. China National Assessment Report on Risk Management and Adaptation of Climate Extremes and Disasters. Beijing: Science Press, 154. (in Chinese)

[31]
Qiu J, 2010. China drought highlights future climate threats.Nature, 465: 142.Nature - the world's best science and medicine on your desktop

DOI PMID

[32]
Ren F M, Gao H, Liu L L et al., 2014. Research progresses on extreme weather and climate events and their operational applications in climate monitoring and prediction.Meteorological Monthly, 40: 860-876. (in Chinese)Weather and climate extreme events can be divided into individual extreme events and regional extreme events.This paper reviews the progress of the studies on extreme events.Firstly,the paper pays attentions to observation study on temperature extremes,precipitation extremes,droughts and the related indices at individual station,and then reviews the study about the increasing regional extreme events in recent years and also reviews the study progress in predicting climatic extreme events.Meanwhile,a summary of the current climate monitoring and prediction operations of extreme events in China and in the world has been preliminarily carried out.The results show that the operational products in extreme event monitoring are very rich in China with a leading position in the field of regional extreme event monitoring,but in the form of products there is not a unified organization,especially in products in English.Regarding the climatic prediction of extreme events National Climate Centre has developed two methods:One is a BPCCA and OSR drought prediction method based on physical statistics,and the other is high temperature prediction method based on the National Climate Centre Monthly Dynamic Extended Range Forecast(DERF) model.Finally,an outlook of climate monitoring and prediction operations of extreme events and related scientific issues is given,and a stress is made on continuing to strengthen the frontier researches and operational capacity-building of extreme events in the future.

[33]
Ren F, Gong Z Q, Wang Y J, 2015. China’s Regional Extreme Events: Droughts, Intense Precipitations, Heatwaves and Low Temperatures. Beijing: China Meteorological Press, 41. (in Chinese)

[34]
Sheffield J, Wood E F, 2008. Projected changes in drought occurrence under future global warming from multi-model, multi-scenario, IPCC AR4 simulations.Climate Dynamics, 31(1): 79-105.

DOI

[35]
Sheffield J, Wood E F, Roderick M L, 2012. Little change in global drought over the past 60 years. Nature, 491(7424): 435-438.Abstract Drought is expected to increase in frequency and severity in the future as a result of climate change, mainly as a consequence of decreases in regional precipitation but also because of increasing evaporation driven by global warming. Previous assessments of historic changes in drought over the late twentieth and early twenty-first centuries indicate that this may already be happening globally. In particular, calculations of the Palmer Drought Severity Index (PDSI) show a decrease in moisture globally since the 1970s with a commensurate increase in the area in drought that is attributed, in part, to global warming. The simplicity of the PDSI, which is calculated from a simple water-balance model forced by monthly precipitation and temperature data, makes it an attractive tool in large-scale drought assessments, but may give biased results in the context of climate change. Here we show that the previously reported increase in global drought is overestimated because the PDSI uses a simplified model of potential evaporation that responds only to changes in temperature and thus responds incorrectly to global warming in recent decades. More realistic calculations, based on the underlying physical principles that take into account changes in available energy, humidity and wind speed, suggest that there has been little change in drought over the past 60 years. The results have implications for how we interpret the impact of global warming on the hydrological cycle and its extremes, and may help to explain why palaeoclimate drought reconstructions based on tree-ring data diverge from the PDSI-based drought record in recent years.

DOI PMID

[36]
Si D, Ding Y, 2013. Decadal change in the correlation pattern between the Tibetan Plateau winter snow and the East Asian summer precipitation during 1979-2011.Journal of Climate, 26: 7622-7634.Observational evidence indicates that the correlation between Tibetan Plateau (TP) winter snow and East Asian (EA) summer precipitation changed in the late 1990s. During the period 1979-99, the positive correlation between the TP winter snow and the summer precipitation along the Yangtze River valley (YRV) and southern Japan was disrupted by the decadal climate shift. In contrast, the summer precipitation over the Huaihe River valley (HRV) and the Korean Peninsula showed a strong positive correlation with the preceding winter snow over the TP during the period 2000-11.The radiosonde temperature measurements over the TP show a pronounced warming since the late 1990s. This warming is associated with the significant increase in surface sensible heat flux and longwave radiation into atmosphere. The latter is closely related to the decrease of surface albedo and the soil hydrological effect of melting snow due to the decadal decrease in the preceding winter and spring snow over the TP. The TP warming induced by the decrease in winter snow, together with the cooling of the sea surface temperature in the tropical central and eastern Pacific, intensifies the land-sea thermal contrast in the subsequent spring and summer over EA, thus causing a northward advance of the EA summer monsoon. Accompanying the northward migration of the summer monsoon, the summer precipitation belt over EA shifts northward. Consequently, the high summer precipitation region over EA correlating with the preceding winter snow over the TP has shifted northward from the YRV and southern Japan to the HRV and the Korean Peninsula since the late 1990s.

DOI

[37]
Stagge J H, Kohn I, Tallaksen M et al., 2015. Modeling drought impact occurrence based on meteorological drought indices in Europe. Journal of Hydrology, 530: 37-50.This report presents the structure and status of the online European Drought Reference (EDR) database. This website provides detailed historical information regarding major historical European drought events. Each drought event is summarized using climatological drought indices, hydrological drought indices, and user-generated drought impacts. The database currently highlights 11 drought... [Show full abstract]

DOI

[38]
Thornthwaite C W, 1948. An approach toward a rational classification of climate.Geography Review, 38: 55-89.CONTENTS: THE ROLE OF EVAPORATION AND TRANSPIRATION POTENTIAL EVAPOTRANSPIRATION AS A CLIMATIC FACTOR TEMPERATURE AND GROWTH DETERMINATION OF POTENTIAL EVAPOTRANSPIRATION WATER SURPLUS AND WATER DEFICIENCY RELIABILITY OF COMPUTED POTENTIAL EVAPOTRANSPIRATION ESSENTIALS OF CLIMATIC CLASSIFICATION THE MOISTURE FACTOR A MOISTURE INDEX AN INDEX OF THERMAL EFFICIENCY SUMMER CONCENTRATION OF THERMAL EFFICIENCY ELEMENTS OF THE CLASSIFICATION APPENDIX - THE DETERMINATION OF POTENTIAL EVAPOTRANSPIRATION.

DOI

[39]
Vicente-Serrano S M, Beguería S, López-Moreno J I, 2010. A multiscalar drought index sensitive to global warming: The standardized precipitation evapotranspiration index.Journal of Climate, 23: 1696-1718.The authors propose a new climatic drought index: the standardized precipitation evapotranspiration index (SPEI). The SPEI is based on precipitation and temperature data, and it has the advantage of combining multiscalar character with the capacity to include the effects of temperature variability on drought assessment. The procedure to calculate the index is detailed and involves a climatic water balance, the accumulation of deficit/surplus at different time scales, and adjustment to a log-logistic probability distribution. Mathematically, the SPEI is similar to the standardized precipitation index (SPI), but it includes the role of temperature. Because the SPEI is based on a water balance, it can be compared to the self-calibrated Palmer drought severity index (sc-PDSI). Time series of the three indices were compared for a set of observatories with different climate characteristics, located in different parts of the world. Under global warming conditions, only the sc-PDSI and SPEI identified an increase in drought severity associated with higher water demand as a result of evapotranspiration. Relative to the sc-PDSI, the SPEI has the advantage of being multiscalar, which is crucial for drought analysis and monitoring.

DOI

[40]
Wang A, Lettenmaier D P, Sheffield J, 2011. Soil moisture drought in China, 1950-2006.Journal of Climate, 24: 3257-3271.Four physically based land surface hydrology models driven by a common observation-based 3-hourly meteorological dataset were used to simulate soil moisture over China for the period 1950–2006. Monthly values of total column soil moisture from the simulations were converted to percentiles and an ensemble method was applied to combine all model simulations into a multimodel ensemble from which agricultural drought severities and durations were estimated. A cluster analysis method and severity–area–duration (SAD) algorithm were applied to the soil moisture data to characterize drought spatial and temporal variability. For drought areas greater than 150 000 km2 and durations longer than 3 months, a total of 76 droughts were identified during the 1950–2006 period. The duration of 50 of these droughts was less than 6 months. The five most prominent droughts, in terms of spatial extent and then duration, were identified. Of these, the drought of 1997–2003 was the most severe, accounting for the majority of the severity–area–duration envelope of events with areas smaller than 5 million km2. The 1997–2003 drought was also pervasive in terms of both severity and spatial extent. It was also found that soil moisture in north central and northeastern China had significant downward trends, whereas most of Xinjiang, the Tibetan Plateau, and small areas of Yunnan province had significant upward trends. Regions with downward trends were larger than those with upward trends (37% versus 26% of the land area), implying that over the period of analysis, the country has become slightly drier in terms of soil moisture. Trends in drought severity, duration, and frequency suggest that soil moisture droughts have become more severe, prolonged, and frequent during the past 57 yr, especially for northeastern and central China, suggesting an increasing susceptibility to agricultural drought.

DOI

[41]
Wang H, Schubert S, Koster R et al., 2014a. On the role of SST forcing in the 2011 and 2012 extreme U.S. heat and drought: A study in contrasts. Journal of Hydrometeorology, 15: 1255-1273.This study compares the extreme heat and drought that developed over the United States in 2011 and 2012 with a focus on the role of sea surface temperature (SST) forcing. Experiments with the NASA Goddard Earth Observing System, version 5 (GEOS-5), atmospheric general circulation model show that the winter/spring response over the United States to the Pacific SST is remarkably similar for the two years despite substantial differences in the tropical Pacific SST. As such, the pronounced winter and early spring temperature differences between the two years (warmth confined to the south in 2011 and covering much of the continent in 2012) primarily reflect differences in the contributions from the Atlantic and Indian Oceans, with both acting to cool the east and upper Midwest during 2011, while during 2012 the Indian Ocean reinforced the Pacific-driven, continental-wide warming and the Atlantic played a less important role. During late spring and summer of 2011, the tropical Pacific SST forced a continued warming and drying over the southern United States, though considerably weaker than observed. Nevertheless, the observed 2011 anomalies fall well within the model's intraensemble spread. In contrast, the observed rapid development of intense heat and drying over the central United States during June and July 2012 falls on the margins of the model's intraensemble spread, with the response to the SST giving little indication that 2012 would produce record-breaking precipitation deficits and heat. A diagnosis of the 2012 observed circulation anomalies shows that the most extreme heat and drought was tied to the development of a stationary Rossby wave and an associated anomalous upper-tropospheric high maintained by weather transients.

DOI

[42]
Wang L, Chen W, 2014. Applicability analysis of standardized precipitation evapotranspiration index in drought monitoring in China.Plateau Meteorology, 33: 423-431. (in Chinese)The applicability of Standardized Precipitation Evapotranspiration Index(SPEI) in China has been analyzed.The main aspects of this research comprise goodness of fit test,capability in reproducing history drought events and the comparison between SPEI and Standardized Precipitation Index(SPI) and Palmer Drought Severity Index(PDSI),both of which are widely used in drought monitoring and analysis.The result of goodness of fit test shows that for the boreal winter and shortest time scales,the precipitation minus potential evapotranspiration series fail to match the presumed Log-logistic distribution in the south of Xinjiang,the northwest of Tibet and the area from North China to Hetao indicating the unreliability of SPEI values.With mentioned exceptions above,for most regions nationwide a good fit between the sample series and the Log-logistic distribution independent of the time scale and the month of the year guarantees the robustness of SPEI computation.Secondly,the comparison between spatial distribution of SPEI and China Historical Drought Dataset in typical years indicates that SPEI has good performance in measuring drought as well as flood.Furthermore,the relationship among SPEI,SPI and PDSI is also analyzed.The correlation coefficient between SPEI and SPI is roughly above0.8 for different time scales.However,how well the SPEI correlated with PDSI relies on the time scale.When the time scale is less than 10 months,the poor correlation is observed between SPEI and PDSI;when the time scale is greater than 10 months,the correlation coefficient between SPEI and PDSI remains between 0.7 and0.9.The comparison result shows that if the suitable time scale is chosen,the statistically based drought index,SPEI,has the similar capacity with PDSI which is based on complex soil water balance to describe and monitor drought reasonably.Furthermore,the SPEI has flexibility to adapt to intrinsic multi-scale nature of drought and advantage over simple calculation.

[43]
Xu K, Yang D, Xu X et al., 2015. Copula based drought frequency analysis considering the spatio-temporal variability in Southwest China.Journal of Hydrology, 527: 630-640.http://linkinghub.elsevier.com/retrieve/pii/S0022169415003807

DOI

[44]
Yan Z W, Yang C, 2000. Geographic patterns of extreme climate changes in China during 1951-1997.Climatic and Environmental Research, 5(3): 267-272. (in Chinese)

[45]
Yang P, Xiao Z, Yang J, Liu H, 2013. Characteristics of clustering extreme drought events in China during 1961-2010. Acta Meteorologica Sinca, 27: 186-198.AbstractBased on the Multi-Scale Standardized Precipitation Index (MSPI), extreme severe drought events in China during 1961 2010 were identified, and the seasonal, annual, and interdecadal variations of the clustering extreme drought events were investigated by using the spatial point process theory. It is found that severe droughts present a trend of gradual increase as a result of the significant increase and clustering tendency of severe droughts in autumn. The periodicity analysis of the clustering extreme droughts in different seasons suggests that there is a remarkable interdecadal change in the occurrence of clustering extreme droughts in winter. Meanwhile, it is revealed that the clustering extreme drought events exhibit greatly different annual mean spatial distributions during 1961 2010, with scattered and concentrated clustering zones alternating on the decadal timescale. Furthermore, it is found that the decadal-mean spatial distributions of extreme drought events in summer are correlated out of phase with those of the rainy bands over China in the past 50 years, and a good decadal persistence exists between the autumn and winter extreme droughts, implying a salient feature of consecutive autumn-winter droughts in this 50-yr period. Compared with other regions of China, Southwest China bears the most prominent characteristic of clustering extreme droughts.

DOI

[46]
Ye D Z, Huang R H et al., 1996.Drought and Flood Laws and Causes of Formation in the Yangtze and Yellow River Basins. Shandong: Shandong Science and Technology Press, 61-290. (in Chinese)

[47]
Yu M, Li Q, Hayes M J et al., 2014. Are droughts becoming more frequent or severe in China based on the standardized precipitation evapotranspiration index: 1951-2010?International Journal of Climatology, 34: 545-558.The Standardized Precipitation Evapotranspiration Index (SPEI) was computed based on the monthly precipitation and air temperature values at 609 locations over China during the period 1951–2010.Various characteristics of drought across China were examined including: long-term trends, percentage of area affected, intensity, duration, and drought frequency. The results revealed that severe and extreme droughts have become more serious since late 1990s for all of China (with dry area increasing by 653.72% per decade); and persistent multi-year severe droughts were more frequent in North China, Northeast China, and western Northwest China; significant drying trends occurred over North China, the southwest region of Northeast China, central and eastern regions of Northwest China, the central and southwestern parts of Southwest China and southwestern and northeastern parts of western Northwest mainly due to a decrease in precipitation coupled with a general increase in temperature. In addition, North China, the western Northwest China, and the Southwest China had their longest drought durations during the 1990s and 2000s. Droughts also affected western Northwest, eastern Northwest, North, and Northeast regions of China more frequently during the recent three decades. The results of this article could provide certain references and triggers for establishing a drought early warning system in China. 08 2013 Royal Meteorological Society

DOI

[48]
Zhai J, Huang J, Su B et al., 2017. Intensity-area-duration analysis of droughts in China 1960-2013.Climate Dynamics, 48: 151-168.In this study, the intensity, area, and duration of droughts in China are analyzed using the Standardized Precipitation Index (SPI). The SPI was calculated on monthly data for 530 meteorological stations in China for the period 1960-2013. The time series were analyzed for ten major hydrological regions of China, respectively. The relationships between the intensity and the area of droughts for a specific duration were analyzed by the intensity-area-duration method. The results show that areas with a significant trend in dryness can be found in a band reaching from the southwest to the northeast of China, while areas with significant trends in wetness are especially detected in the northern river basins in recent decades. In addition, for recent years (2000-2013), most of the ten major hydrological regions show opposite trends in the SPI when compared to the whole study period (1960-2013) except for the central and southwestern parts of China. This dryness/wetness trends are related to the intensity and duration of drought events, which have been stronger and lasted longer in the detected dryness band except for some northern river basins. A regional shift of drought centers is found from the northwest to the southeast within Central China. Moreover, a decreasing trend in drought area is observed, which might be related to the regional changes in precipitation pattern associated with the atmosphere-ocean interaction. Changes in the SST of the Tropical Pacific and the Tropical Indian Ocean may have resulted in frequent severe drought events of small areal extent in the central and southwestern parts of China. For the study period, the most severe droughts that covered large areas mainly occurred in the north and west of China during the mid-to-late twentieth century. However, in the early twenty-first century, the most severe droughts were located in the southwest of China covering areas less than 0.7 million km. Conclusively, drought areas show a decreasing tendency, while more intense droughts of longer duration have been experienced, especially in the south of China, in the last decades.

DOI

[49]
Zhang D, Zhang L, Yang J et al., 2010. The impact of temperature and precipitation variation on drought in China in last 50 years.Acta Physica Sinica, 59: 655-663. (in Chinese)Based on homogeneous temeperature,precipitation and the Palmer Drought Severity Index (PDSI) data between 1958 and 2007 of 194 stations in China,quantitative measure of impact of global warming and precipitation variation on the formation of drought in China is made through a statistical model. Dividing China into eight regions,we analyzed the importance of global warming and precipitation variations in each region respectively. Under the background of global warming,the trend of drought in north China still persists. The most probable region of drought in the next five years shows a tendendy of expansion in north China,especially in the direction to the south. Decreased precipitation is still the key factor in drought formation in most regions. However,in the north,northeast and east-northwest China,global warming plays a bigger role in drought formation.

DOI

[50]
Zhang J, Sun F B, Xu J J et al., 2016. Dependence of trends in and sensitivity of drought over China (1961-2013) on potential evaporation model.Geophysical Research Letters, 43: 206-213.The complexity involved in accurate estimation and numerical simulation of regional evapotranspiration (ET) can lead to inconsistency among techniques, usually attributed to methodological deficiencies. Here we hypothesize instead that discrepancies in ET estimates should be expected in some cases and can be applied to measure the effect of anthropogenic influences in developed river basins. We compare an ensemble of corrected ET estimates from land surface models with Gravity Recovery and Climate Experiment and Moderate Resolution Imaging Spectroradiometer satellite-based estimates in the intensively managed Colorado River Basin to contrast the roles of natural variability and human impacts. Satellite-based approaches yield larger annual amplitudes in ET estimates than land surface model simulations, primarily during the growing season. We find a total satellite-based ET flux of 142 +/- 7MAF yr(-1) (175 +/- 8.63 km(3) yr(-1)), with 38% due to anthropogenic influences during summer months. We evaluate our estimates by comparison with reservoir storage and usage allotment components of the basin water management budget.

DOI

[51]
Zhang L X, Zhou T J, 2015. Drought over East Asia: A review.Journal of Climate, 28(8): 3375-3399.East Asia is greatly impacted by drought. North and southwest China are the regions with the highest drought frequency and maximum duration. At the interannual time scale, drought in the eastern part of East Asia is mainly dominated by two teleconnection patterns (i.e., the Pacific apan and Silk Road teleconnections). The former is forced by SST anomalies in the western North Pacific and the tropical Indian Ocean during El Ni o decaying year summers. The precipitation anomaly features a meridional tripolar or sandwich pattern. The latter is forced by Indian monsoon heating and is a propagation of stationary Rossby waves along the Asian jet in the upper troposphere. It can significantly influence the precipitation over north China. Regarding the long-term trend, there exists an increasing drought trend over central parts of northern China and a decreasing tendency over northwestern China from the 1950s to the present. The increased drought in north China results from a weakened tendency of summer monsoons, which is mainly driven by the phase transition of the Pacific decadal oscillation. East Asian summer precipitation is poorly simulated and predicted by current state-of-the-art climate models. Encouragingly, the predictability of atmospheric circulation is high because of the forcing of ENSO and the associated teleconnection patterns. Under the SRES A1B scenario and doubled CO2 simulations, most climate models project an increasing drought frequency and intensity over southeastern Asia. Nevertheless, uncertainties exist in the projections as a result of the selection of climate models and the choice of drought index.

DOI

[52]
Zhang W, Pan S, Cao L et al., 2015. Changes in extreme climate events in eastern China during 1960-2013: A case study of the Huaihe River basin.Quaternary International, 380/381: 22-34.Within the context of global warming, climate extremes, including extreme wet event and drought events, have become one of the most significant and attractive themes around the world. The target region of this study is confined to eastern China, with most of the country's population concentrated, where both the wet and drought climate extremes can cause considerable damages to the economy, particularly to agriculture. From the inter-annual and intraseasonal scale, temporal and spatial distributions of climate extremes for 27 stations in the Huaihe River Basin over the period 1960 2013, are examined rigorously by means of a modified FAO Penman-Monteith method and the standardized variables of the monthly Surface Humid Index. Morlet wavelet analysis is utilized to thoroughly investigate the oscillation and periodicity of extreme wet/drought events during four seasons, as well as the whole year. The results suggest that the frequency of extreme wet events has significantly increased by 0.0118 times/year, whereas the trend for extreme drought events has gradually decreased, at the rate of 0.0127 times/year, both of which are in accordance with inter-decadal variations of climate extremes. Comparative study reveals climate extremes in autumn shows great differences, in sharp contrast to other seasons and the general inter-annual tendency. Spatial distributions of inter-annual extreme climate events exhibit certain symmetry characteristics, from west to east, indicating the combined influences of topography and monsoon circulation. The major cycles of extreme wet and drought events are 14 years and 24 years, respectively. Finally, possible causes of the temporal and spatial distributions of climate extremes are tentatively analyzed, by correlation analysis of six indexes, namely, AOI, AAOI, EASMI, WNPMI, SASMI, and NAOI, with AOI and NAOI being the dominant indexes under the background of large-scale atmospheric circulation. Additionally, other factors such as total annual precipitation, northward movement and enhancement of the subtropical anticyclone, and anthropogenically induced greenhouse forcing can also contribute to the changes in extreme climate events.

DOI

[53]
Zhang Y, Li B, Zheng D, 2002. A discussion on the boundary and area of the Tibetan Plateau in China.Geographical Research, 21: 1-8. (in Chinese)The Tibetan Plateau is a unique geomorphic unit composed of some basic geomorphic types, such as extreme high mountains,high mountains, hills, plains, and tablelands of high altitude or sub-high altitude. Different opinions for the exact scope of Tibetan Plateau exist. According to latest research achievement and the long time fieldwork, questions related to the area and boundary of the Plateau have been discussed in view of geography, and the principles taking geomorphic characters as the main rule and considering the integrity have been made to define the boundary. The 1:1 000 000 geomorphological map was compiled based on 1:100 000 aerial photographic map,1:500 000 topographic map and interpretation of satellite images. By refering to the 1:3 000 000 relief map, the boundary of the Plateau was delineated.The position of the boundary was quantitatively determined with GIS and GPS.The map of electronic version of the Tibetan Plateau was compiled. The main conclusion is that Tibetan Plateau starts from the southern edge of the Himalayan Range, abuts on India,Nepal and Bhutan,connects the northern edge of Kunlun, Altun and Qilian Mts., and joins Tarim Basin and Hexi Corridor in Central Asia.The west of it is the Pamirs and Karakorum Mts., bordering on Kirghizistan, Tajikistan, Afghanistan, Pakistan and Kashmir. The east of it is Yulongxueshan, Daxueshan, Jiajinshan and Qionglaishan Mts.as well as south or east piedmont of Minshan Mts. Tibetan Plateau joins the Qinling Mts.and Loess Plateau with its eastern and northeastern part. Tibetan Plateau in China's territory starts from the Pamirs in the west and reaches to Hengduanshan in the east. It bestrides a longitude of 31 degrees with a length of 2 945 km from east to west,and bestrides a latitude of 13 degrees with a length of 1 532 km from south to north. It ranges from 26°00′12" N to 39°46′50" N and from 73°18′52"E to 104°46′59"E, covering an area of 2 572.4×10 3 km 2. Administratively, it embraces 201 counties (cities) in 6 provinces, namely, the Tibet Autonomous Region (73 counties/cities,1 176.0×10 3 km 2, part of Cona, Mêdog and Zayü), the Qinghai Province(40 counties/cities,721.0×10 3 km 2, some counties only partially), Dêqen Tibetan Autonomous Prefecture in Northwest Yunnan Province(9 counties/cities,33.5×10 3 km 2), West Sichuan Province ( 46 counties/cities about 254.0×10 3 km 2 ,such as Garze Autonomous Prefecture, Aba Tibetan and Qiangzu Autonomous Prefecture,and Muli Autonomous County, etc.),Gansu Province(21 counties/cities, 74.9×10 3 km 2), and Southern Xinjiang Uygur Autonomous Region (about 12 counties/cities, 313.0×10 3 km 2).

DOI

[54]
Zhang Z, Wang P, Chen Y et al., 2014. Spatial pattern and decadal change of agro-meteorological disasters in the main wheat production area of China during 1991-2009.Journal of Geographical Sciences, 24(3): 387-396.Agro-meteorological disasters (AMD) have become more frequent with climate warming. In this study, the temporal and spatial changes in the occurrence frequency of major meteorological disasters on wheat production were firstly explored by analyzing the observed records at national agro-meteorological stations (AMS) of China from 1991 to 2009. Furthermore, impact of climate change on AMD was discussed by comparing the warmer decade (2000-2009) with another decade (1991-2000). It was found that drought was the most frequent disaster during the last two decades, with a highest proportion of 79%. And the frequency of AMD increased significantly with climate change. Specifically, the main disasters occurred more frequently in the reproductive period than in the vegetative period. Besides, the spatial changes in the AMD frequency were characterized by region-specific. For example, the wheat cultivation areas located on the Loess Plateau and the middle-lower reaches of the Yellow River suffered mainly from drought. All these results were strongly linked to climate change in China. Therefore, sound adaptation options should be taken based on the latest changes of AMD under global warming to reduce agricultural damages.

DOI

[55]
Zhao J, Yan D F, Yang Z Y et al., 2015. Improvement and adaptability evaluation of standardized precipitation evapotranspiration index.Acta Physica Sinica, 64(4): 049202.In view of the question about larger estimate error in arid areas by using the Thornthwaite method of estimating potential evaporation in the process of calculating standardized precipitation evapotranspiration index,we use the FAO Penman-Monteith method instead of Thornthwaite method to improve the method of calculating the standardized precipitation evapotranspiration index.Based on the 1961 2013 daily meteorological data offered by 541 stations of Meteorology Bureau,the distribution of test and standardized rainfall index,Palmer drought severity index and soil moisture are used to analyze the consistency with standardized rainfall evaporation index when used to evaluate drought in the applicability of area and season.Result shows that the improvement on the method of evaporation capacity calculation can significantly expand the application of standardized precipitation evapotranspiration index in area and season,making standardized precipitation evapotranspiration index applied to national drought assessment well,making up the shortcomings in the applicability of standardized precipitation evapotranspiration index in winter at a short time scale level in arid region.In addition,both yearly time scale and monthly time scale of drought assessment ability about modified standardized precipitation evapotranspiration index are improved,meeting the demand for drought assessment in our country,which is given priority to seasonal drought.

DOI

[56]
Zou X, Zhai P M, Zhang Q, 2005. Variations in droughts over China: 1951-2003.Geophysical Research Letters, 32: L04707. doi: 10.1029/2004GL021853.The Palmer Drought Severity Index (PDSI) was calculated by using monthly air temperature and precipitation in China during the period 1951 to 2003. For the country as a whole, there are no long-term upward or downward trends in the percentage areas of droughts (defined as PDSI < -1.0). However, significant increases of drought areas are found in North China. Most northern China (except western Northwest China) has experienced severe and prolonged dry periods since the late 1990s, when in some of the areas the extreme drought situations were unprecedented during the period of study. Since these regions are relatively dry areas, frequent drought stress in recent decades has become more serious.

DOI

Outlines

/