Research Articles

Increased soil organic carbon storage in Chinese terrestrial ecosystems from the 1980s to the 2010s

  • XU Li , 1 ,
  • YU Guirui , 1, 2, * ,
  • HE Nianpeng 1, 2
Expand
*Corresponding author: Yu Guirui, PhD and Professor, E-mail:

Author: Xu Li, PhD and Assistant Professor, specialized in global carbon cycle. E-mail:

Received date: 2018-03-30

  Accepted date: 2018-06-22

  Online published: 2019-01-25

Supported by

The Chinese Academy of Sciences Strategic Priority Research Program, No.XDA19020302, National Key Research Project of China, No.2016YFC0500202

National Natural Science Foundation of China,No.31290221, No.41571130043, No.31570471

Copyright

Journal of Geographical Sciences, All Rights Reserved

Abstract

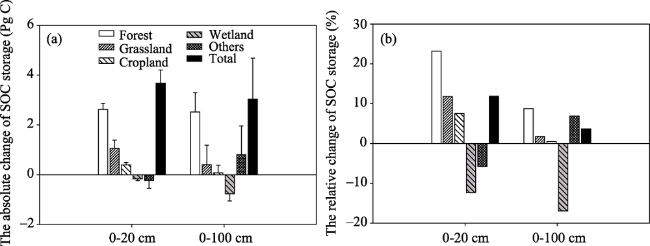
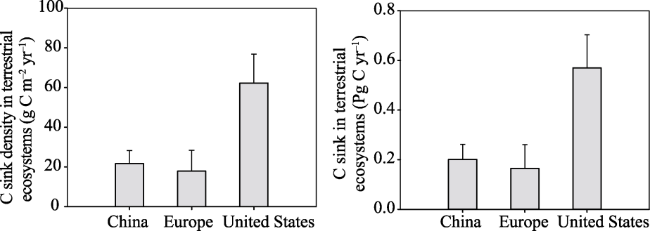
Soil stores a large amount of the terrestrial ecosystem carbon (C) and plays an important role in maintaining global C balance. However, very few studies have addressed the regional patterns of soil organic carbon (SOC) storage and the main factors influencing its changes in Chinese terrestrial ecosystems, especially using field measured data. In this study, we collected information on SOC storage in main types of ecosystems (including forest, grassland, cropland, and wetland) across 18 regions in China during the 1980s (from the Second National Soil Survey of China, SNSSC) and the 2010s (from studies published between 2004 and 2014), and evaluated its changing trends during these 30 years. The SOC storage (0-100 cm) in Chinese terrestrial ecosystems was 83.46 ± 11.89 Pg C in the 1980s and 86.50 ± 8.71 Pg C in the 2010s, and the net increase over the 30 years was 3.04 ± 1.65 Pg C, with an overall rate of 0.101 ± 0.055 Pg C yr-1. This increase was mainly observed in the topsoil (0-20 cm). Forests, grasslands, and croplands SOC storage increased 2.52 ± 0.77, 0.40 ± 0.78, and 0.07 ± 0.31 Pg C, respectively, which can be attributed to the several ecological restoration projects and agricultural practices implemented. On the other hand, SOC storage in wetlands declined 0.76 ± 0.29 Pg C, most likely because of the decrease of wetland area and SOC density. Combining these results with those of vegetation C sink (0.100 Pg C yr-1), the net C sink in Chinese terrestrial ecosystems was about 0.201 ± 0.061 Pg C yr-1, which can offset 14.85%-27.79% of the fossil fuel C emissions from the 1980s to the 2010s. These first estimates of soil C sink based on field measured data supported the premise that China’s terrestrial ecosystems have a large C sequestration potential, and further emphasized the importance of forest protection and reforestation to increase SOC storage capacity.

Cite this article

XU Li , YU Guirui , HE Nianpeng . Increased soil organic carbon storage in Chinese terrestrial ecosystems from the 1980s to the 2010s[J]. Journal of Geographical Sciences, 2019 , 29(1) : 49 -66 . DOI: 10.1007/s11442-019-1583-4

1 Introduction

Soil stores about 80% of the carbon (C) present in the global terrestrial ecosystems (Post et al., 1982). Soil organic carbon (SOC) pools affect global food security directly or indirectly by supplying nutrients, improving soil fertility, and fixing and decomposing pollutants (Cox et al., 2000; Lal, 2004b), and changes in SOC storage can affect global climate to some extent, as a source or sink of atmospheric CO2. In fact, C sequestration capacity of terrestrial ecosystems, especially soil, has been considered an environmentally friendly and cost-effective way to moderate the increased concentration of atmospheric CO2. Therefore, accurate evaluations of SOC storage and its changing trends at a regional scale are important to effectively manage terrestrial ecosystems in a global effort to decrease the rate at which CO2 accumulates in the atmosphere (Piao et al., 2009).
Based on forest inventories, grassland resources surveys, field measurements, and remote-sensing data, some scientists have assessed terrestrial ecosystem C storage and its changing trends at regional and global scales (Pacala et al., 2001; Janssens et al., 2003; Piao et al., 2009; Pan et al., 2011). In China, most studies focused on vegetation C storage (Fang et al., 2007; Pan et al., 2011) and only a few examined changing trends in SOC storage (Wang et al., 2003; Xie et al., 2007), although some studies estimated SOC storage at regional scales (Wuet al., 2003; Yang et al., 2007; Xu et al., 2015; Yang et al., 2017) (Table 1). Furthermore, the estimates of SOC storage both at global and regional scale are still uncertain, with the total SOC storage in world’s soils varying from 1395 to 2200 Pg C (Bohn, 1982; Eswaran et al., 1993; Batjes, 1996; Jobbágy and Jackson, 2000), and the SOC storage in China ranging from 50 to 185.7 Pg C (Fang et al., 1996; Pan, 1999; Yang et al., 2007) (Table 1). These wide ranges are mainly attributed to insufficient sampling (Piao et al., 2009; Schrumpf et al., 2011; Wiesmeier et al., 2012; Ni, 2013). Compared to vegetation inventories and remote-sensing data, which have been regularly obtained, periodic soil survey is scarce, resulting in the unavailability of contemporary soil C measurements (Hayes et al., 2012; Yang et al., 2014b). Thus, it is urgent to obtain additional robust estimates of SOC by using reliable data and optimized methods at regional or global scales.
Table 1 Eatimates of organic carbon(SOC) density and storage in Chinese terrestrial ecosystems reported in different studies
Because China comprises a considerable part of the global terrestrial ecosystems, it is crucial to determine the global C balance in terms of SOC changes (increase or decrease). The government has implemented a series of ecological protection/restoration projects since the 1980s, such as the Three-North Shelter Forest Program, Yangtze River Shelter Forest Project, Zhujiang River Shelter Forest Project, South China Timber Production Project, and Natural Forest Protection Project, to restore or improve the ecological status of these habitats. In addition, many advanced agricultural practices have been implemented to increase crop production and soil improvement (Huang and Sun, 2006). Taken together, these projects have undoubtedly increased C sequestration capacity to tackle climate change (Wang et al., 2011; Liu et al., 2014b; Yang et al., 2014a; Ouyang et al., 2016), and a large increase in C storage, both in vegetation and in soil, has been anticipated. Although some studies assessed changes in vegetation C, or changes in ecosystem C focusing on vegetation (Fanget al., 2007; Xu et al., 2007; Xin et al., 2009; Ma et al., 2010; Liang et al., 2015), it is virtually unknown how SOC storage changed in the past three decades in Chinese terrestrial ecosystems. Still, Yang et al. (2010) explored changes in SOC storage in northern China’s grasslands, combining soil investigation data with historical records and Pan et al. (2010) and Yang et al. (2014a) explored changes in SOC storage across Chinese croplands and forests, respectively, based on published data. Therefore, understanding SOC storage changes in China’s terrestrial ecosystems is imperative to accurately evaluate their capacity to sequester atmospheric CO2, as many studies suggested this is similar between soil and vegetation, or even higher in soil than in vegetation (Lal, 2004a).
In the present study, information on SOC storage in China recorded during the 1980s (8,897 soil profiles from the Second National Soil Survey of China (SNSSC)) and 2010s (7,683 soil profiles published between 2004 and 2014) for the main ecosystems (forest, grassland, cropland, and wetland ecosystems) and at different soil depths (0-20 cm and 0-100 cm), were analyzed with three main objectives: 1) estimate SOC storage in Chinese terrestrial ecosystems during 1980s-2010s; 2) assess the increases in SOC storage from the 1980s to the 2010s; 3) reveal differences in soil C sequestration rates among forest, grassland, cropland, and wetland.

2 Materials and methods

2.1 Data collection

2.1.1 Collection and compilation of the 2010s’ data
To estimate the current status of SOC storage in China, we compiled all the information available in studies considering SOC concentration/content published during the 2010s (i.e., from 2004 to 2014). Data were obtained from: (1) field investigated data published from 2004 to 2014, available in the China National Knowledge Infrastructure (CNKI, http://www.cnki.net) and International Scientific Indexing Web of Knowledge (ISI, http://apps.webofknowledge.com) databases, searching for ‘SOC’ in keywords or abstract; and (2) field-measured data obtained by personal correspondence. Data collected from papers were further screened based on the following rules: 1) data on SOC content must have been obtained through field investigations; 2) field investigations were carried out after 2000; and 3) SOC measuring methods were similar to those in the SNSSC (Xuet al., 2018). If geographical information was not available for sampling sites, we extracted their latitude and longitude with a digital map (http://map.tianditu.com), based on the description of the study site. The 805 papers selected encompassed the main ecosystems in China, namely forest, grassland, cropland, and wetland ecosystems. Specifically, the collected data included records for 7,683 soil samples (4536 samples for the 0-20 cm soil layer, and 3147 samples for the 0-100 cm soil layer; Figure 1 and Table 2).
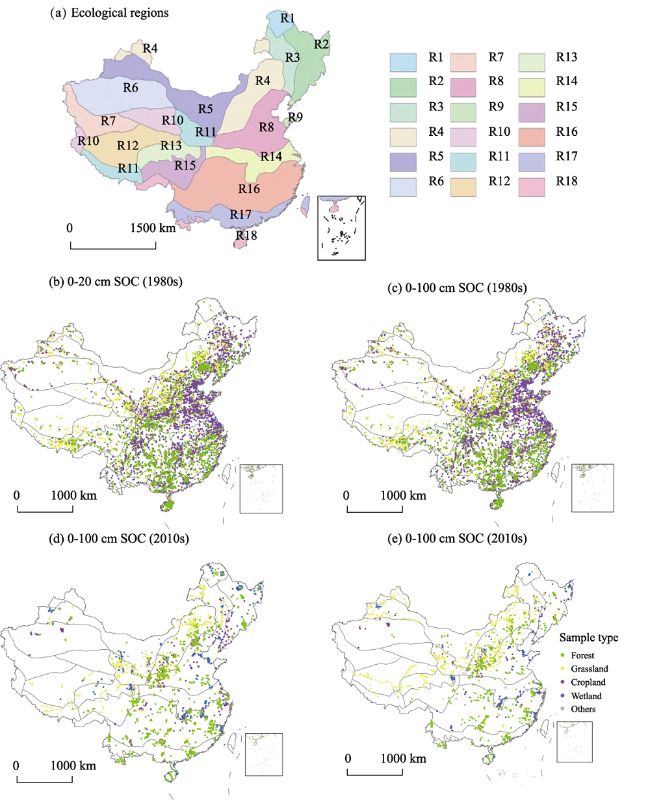
Figure 1 Regional division of China’s terrestrial ecosystems and the distribution of soil samples collected in China in the 1980s and 2010s
R1, Cold humid regions; R2, Temperate humid regions; R3, Temperate semi-humid regions; R4, Temperate semi-arid regions; R5, Temperate arid regions; R6, Warm temperate arid regions; R7, Qinghai-Tibet Plateau frigid arid regions; R8, Warm temperate semi-humid regions; R9, Warm temperate humid regions; R10, Qinghai-Tibet Plateau temperate arid regions; R11, Qinghai-Tibet Plateau temperate semi-arid regions; R12, Qinghai-Tibet Plateau subfrigid semi-arid regions; R13, Qinghai-Tibet Plateau subfrigid semi-humid regions; R14, North subtropical humid regions; R15, Qinghai-Tibet Plateau temperate humid and semi-humid regions; R16, Mid-subtropical humid regions; R17, South subtropical humid regions; R18, Tropical humid regions
Table 2 The properties of soil samples and SOC density (kg C m-2) across different ecosystems of China in the 1980s and 2010s
1980s 2010s
Forest Grassland Cropland Wetland Others Forest Grassland Cropland Wetland Others
0-20cm N 1990 1367 4175 498 867 1861 931 840 796 108
Min 0.04 0.13 0.05 0.14 0.09 <0.01 0.03 0.28 0.18 0.11
Max 15.02 16.94 17.09 57.42 12.26 13.59 13.40 7.91 23.75 6.28
Mean 3.93 3.39 2.95 7.11 2.52 4.48 4.06 3.03 5.60 1.72
SD 2.45 2.53 1.89 5.15 1.74 2.83 2.99 1.56 4.82 1.24
CV 0.62 0.74 0.64 0.72 0.69 0.63 0.74 0.51 0.86 0.72
0-100cm N 1989 1349 4175 498 867 1344 842 544 328 89
Min 0.04 0.13 0.23 0.71 0.11 0.50 0.39 0.94 0.55 0.41
Max 55.87 30.84 49.89 176.17 40.98 34.66 30.01 22.44 85.12 27.50
Mean 10.11 8.56 8.49 23.80 7.06 10.12 8.23 8.16 14.87 5.96
SD 6.90 6.02 5.76 19.07 4.50 6.23 5.74 4.06 14.81 5.09
CV 0.68 0.70 0.68 0.80 0.64 0.62 0.70 0.50 0.99 0.85

N, sample number; Min, Max and Mean, the minimum, maximum, and mean value of SOC density (kg C m-2); SD, standard deviation; CV, the coefficient of variation.

2.1.2 Collection of the 1980s’ data
To estimate the status of SOC storage in the 1980s, we collected 8897 soil profiles from the SNSSC, which was implemented in 1979-1985, and included information on geographic location, soil thickness (cm), organic matter content (%), bulk density (g cm-3), rock content (%), clay, silt and sand content (%), and soil type (Wang et al., 2004). These soil profiles were standardized from soil survey treatises at the provincial and national scale (Figure 1 and Table 2).
2.1.3 Division of ecological regions
To explore regional differences in SOC storage changes, Chinese terrestrial ecosystems were divided into 18 ecological regions (Figure 1) based on climate and topography (Fu et al., 2001), named as follows: cold humid regions (R1), temperate humid regions (R2), temperate semi-humid regions(R3), temperate semi-arid regions (R4), temperate arid regions (R5), warm temperate arid regions (R6), Qinghai-Tibet Plateau frigid arid regions (R7), warmtemperate semi-humid regions (R8), warm temperate humid regions (R9), Qinghai-Tibet Plateau temperate arid regions (R10), Qinghai-Tibet Plateau temperate semi-arid regions (R11); Qinghai-Tibet Plateau subfrigid semi-arid regions (R12), Qinghai-Tibet Plateau subfrigid semi-humid regions (R13), north subtropical humid regions (R14), Qinghai-Tibet Plateau temperate humid and semi-humid regions (R15), mid-subtropical humid regions (R16), south subtropical humid regions (R17), and tropical humid regions (R18) (Xuet al., 2018). Areas of the different ecosystems (forest, grassland, cropland, wetland, and others) within each ecological region in the two periods were extracted from the Chinese land cover data (Wu et al., 2014). The total area of terrestrial ecosystems in China, not including Taiwan Province and inland waters, covered approximately 9.25 × 10⁶ km2.

2.2 Data analysis

2.2.1 Calculation of SOC density
In order to determine the C sequestration rate at 0-20 cm and at 0-100 cm soil depths, we estimated SOC density and storage in both layers. SOC density (kg C m-2) at 0-20 cm or 0-100 cm was calculated using equations (1) and (2):
SOC density =$\sum\nolimits_{i=1}^{\text{n}}{SO{{C}_{i}}}\times B{{D}_{i}}\times {{D}_{i}}\times (1-{{\delta }_{i}})\times 0.1$ (1)
$SO{{C}_{i}}\text{=}SO{{M}_{i}}\times 0.58$ (2)
where SOCi, BDi, Di, δi, and SOMirepresent SOC content (%), bulk density (g cm-3), soil depth (cm), the volumetric percentage of the fraction > 2 mm (%), and soil organic matter (SOM) content (%), respectively, in soil layer i, and n is the number of soil layers. SOM was converted to SOC using the constant 0.58 (Xie et al., 2007). The pedotransfer function was used to estimate bulk density from related SOC concentration in soil samples without bulk density records (Yang et al., 2007), and the mean value of rock fragment volume was used to substitute the same soil type without measured values.
2.2.2 Calculation of SOC storage
SOC storage in the 1980s and 2010s was calculated in two steps (Figure 2). After calculating SOC storage for the several ecological regions, these values were summed to estimate total SOC storage in China according to equation (3):
SOC storage=$\sum_{i=1}^{m}\sum_{j=1}^{n}(SOCD_{ij}\times S_{ij})$ (3)
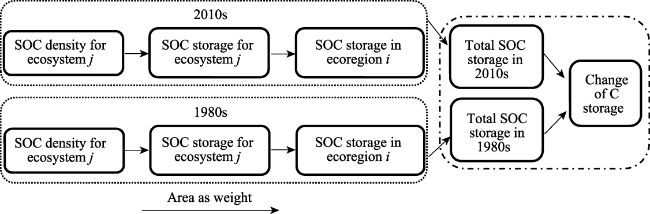
Figure 2 Flow diagram of soil organic carbon (SOC) storage change calculation during the 1980s-2010s
wherem and n are the number of ecological regions and ecosystems, SOCDijare SOC density of ecosystem j in ecological region i, Sijis the surface area of ecosystem j in ecological region i. For ecological regions where the number of samples within one of the ecosystems was less than 10, or where the spatial distribution of samples was extremely uneven (i.e., samples were concentrated in a single area), we combined samples from the same ecosystems in adjacent regions with similar climatic conditions to estimate SOC density (Xu et al., 2018).
2.2.3 Changes in SOC storage from the 1980s to the 2010s
Changes in SOC storage (∆Vs, Pg C yr-1) was calculated according to equation (4):
Vs =$\frac{SOCS(2010\text{s})-SOCS(1980\text{s})}{30}$ (4)
whereSOCS(2010s) and SOCS(1980s)represent SOC storage (Pg C) in the 2010s and 1980s, respectively.

3 Results

3.1 SOC density and storage in the 1980s and 2010s

In the 1980s, SOC storage in the topsoil (0-20 cm) was approximately 30.94 ± 3.93 Pg C and represented 37.07% of SOC storage in the 0-100 cm soil layer (83.46 ± 11.89 Pg C) (Figure 3). The SOC storage in forest, grassland, cropland and wetland topsoil was 11.30 ± 2.44, 9.01 ± 2.33, 5.26 ± 1.13 and 1.36 ± 0.44 Pg C, respectively. In the 0-100 cm soil layer, SOC storage in forest, grassland, cropland, and wetland was 28.81 ± 7.13, 23.31 ± 6.87, 15.10 ± 3.56, and 4.51 ± 1.63 Pg C, respectively (Figure 4).
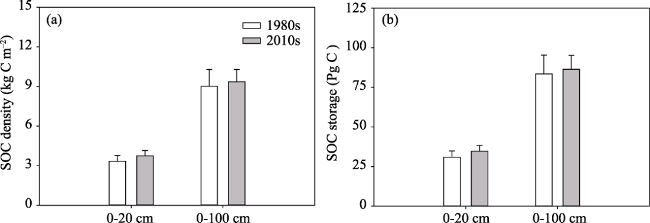
Figure 3 SOC density (a, kg C m-2) and storage (b, Pg C) in China during the 1980s-2010s
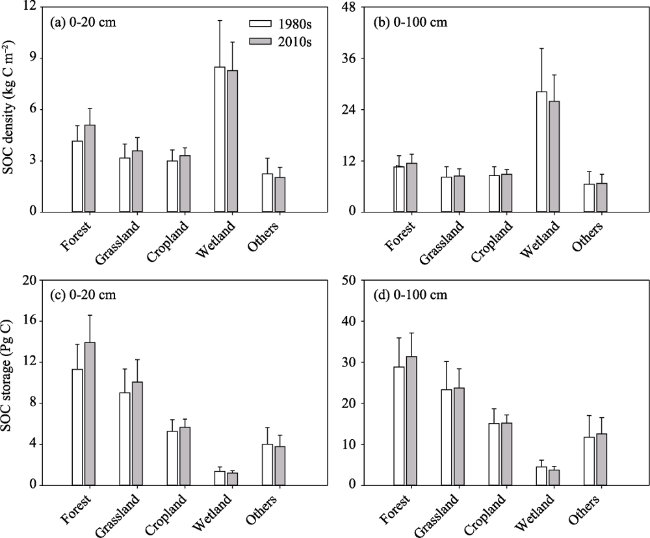
Figure 4 SOC density (a, b; kg C m-2) and storage (c, d; Pg C) across different ecosystems of China
In the 2010s, SOC storage in the topsoil was about 34.62 ± 3.71 Pg C and accounted for 40.02% of SOC storage in the 0-100 cm soil layer (86.50 ± 8.71 Pg C) (Figure 2). In the topsoil, SOC storage in forest, grassland, cropland, and wetland was 13.93 ± 2.66, 10.06 ± 2.19,5.66 ± 0.79, and 1.20 ± 0.24 Pg C, respectively. For the 0-100 cm soil layer, SOC storage in forest, grassland, cropland, and wetland was 31.34 ± 5.78, 23.72 ± 4.68, 15.17 ± 1.99, and 3.75 ± 0.89 Pg C, respectively.

3.2 Changes in SOC density and storage from the 1980s to the 2010s

From the 1980s to the 2010s, China’s SOC storage in 0-20 cm and 0-100 cm layers increased by about 3.68 ± 0.53 and 3.04 ± 1.65 Pg C, at rates of 0.123 ± 0.018 and 0.101 ± 0.055 Pg C yr-1, respectively (Figures 3 and 5a). The increasing rate of SOC storage was higher in the 0-20 cm soil layer (11.88%) than that in the 0-100 cm (3.64%) (Figure 5b).
Figure 5 Absolute (a, Pg C) and relative (b, %) changes in soil organic carbon (SOC) storage across different ecosystems of China
In forests, grasslands, and croplands, SOC storage increased during the past three decades, being the highest in forests and the lowest in croplands. For forests, the net increases in SOC density and storage were higher in the topsoil (0-20 cm) (0.96 ± 0.09 kg C m-2 and 2.62 ± 0.24 Pg C, respectively) than in the 0-100 cm soil layer (0.92 ± 28 kg C m-2 and 2.52 ± 0.77 Pg C, respectively). The net increases in SOC storage in the 0-20 cm and 0-100 cm soil layers of grasslands were estimated as 1.06 ± 0.33 and 0.40 ± 0.78 Pg C, with an average rate of 0.035 ± 0.011 and 0.013 ± 0.026 Pg C yr-1, respectively. Compared to forests and grasslands, the increase in SOC storage in croplands was relative small. Contrarily, SOC density in the 0-20 cm and 0-100 cm soil layers of wetlands decreased by about 1.16 ± 0.51 and 5.29 ± 2.02 kg C m-2, respectively, resulting in a loss of SOC storage in the last three decades (0.17 ± 0.07 and 0.76 ± 0.29 Pg C, respectively).

3.3 Changes in SOC storage in different regions

From the 1980s to the 2010s, SOC density and storage increased in most regions (Table 3). Regarding the topsoil (0-20 cm), SOC density increased the most in cold humid regions (R1) (2.84 ± 0.56 kg C m-2), and SOC storage increased the most in mid-subtropical humid regions (R16) (1.03 ± 0.14 Pg C). In the 0-100 cm soil layer, SOC density and storage increased the most in Qinghai-Tibet Plateau temperate arid regions (R10; 3.33 ± 0.77 kg C m-2and 1.23 ± 0.29 Pg C, respectively). In temperate semi-arid regions (R4), temperate arid regions (R5), Qinghai-Tibet Plateau subfrigid semi-arid regions (R12), and tropical humid regions (R18), SOC density and storage decreased in the 0-20 cm and 0-100 cm soil layers, with R5 presenting the greatest decrease in both indices.
Table 3 Changes in SOC density (kg C m-2) and storage (Pg C) across different ecological regions of China from the 1980s to the 2010s
Table 4 Changes in SOC density (kg C m-2) and storage (Pg C) across different ecological regions of China from the 1980s to the 2010s (0-20 cm layer)
Forests SOC storage increased in most ecological regions but slightly decreased in temperate semi-humid regions (R3), temperate semi-arid regions (R4), temperate arid regions (R5), warm temperate arid regions (R6), and tropical humid regions (R18) (Tables 4 and 5). In grasslands, there was a general increase in SOC storage, although it decreased in some regions in northern China (Tables 4 and 5). Grasslands in Qinghai-Tibet Plateau and in southern China played important roles in SOC accumulation. For croplands, SOC storage slightly increased in the main grain product areas (e.g., temperate humid regions (R2), warm temperate semi-humid regions (R8), and north subtropical humid regions (R14)) (Tables 4 and 5). On the contrary, SOC storage in wetlands decreased in most ecological regions (Tables 4 and 5).

4 Discussion

4.1 Uncertainty of SOC storage estimation in the 1980s and 2010s

The SOC storage (83.46 ± 11.89 Pg C in the 1980s and 86.50 ± 8.71 Pg C in the 2010s) and average densities (9.01 ± 1.28 kg C m-2 in the 1980s and 9.35 ± 0.94 kg C m-2 in the 2010s) estimated for the 0-100 cm soil layer in China were close to the values obtained in most recent studies (Li et al., 2003; Xu et al., 2015), although higher than in Pan (1999), and lower than in Fang et al. (1996) (Table 1). Differences in soil datasets might be the main factor accounting for the variation across SOC storage studies in China. For example, while some studies used data from the first national soil survey (1958-1963) to estimate SOC storage (Fang et al., 1996), others used SNSSC data (1979-1985), or combined SNSSC data with new data (Wu et al., 2003; Yang et al., 2007). Considering the large changes in land-use in China from the 1980s to the 2010s, we combined the SNSSC data with data published during 2004-2014 to estimate SOC storage in the two periods, simultaneously. The datasets used in the present study contained the most recent and comprehensive information, and,therefore, might reflect the current status of SOC storage in China. Differences in SOC storage estimation methods might also have contributed to the wide range of SOC storage estimates. Because changes in climate, vegetation, and land-use are important factors influencing the spatial distribution of SOC storage (Post et al., 1982; Cao and Woodward, 1998; Jobbágy and Jackson, 2000; Yang et al., 2007; Wiesmeier et al., 2012), we first estimated SOC storage across the different ecosystems within each ecological region, and then summed these values to estimate SOC storage at the national scale, to improve the accuracy of estimation. Another factor that might have contributed to the large differences in SOC storage estimates among several studies are the methods used to optimize critical parameters (e.g. soil bulk density, rock fragment volume, soil depth, and area). Additionally, the small number of soil profiles from the northwestern regions might have reduced estimation accuracy to some extent, and, therefore, field measurements in these regions should be strengthened in future studies.

4.2 Changes of SOC storage in different ecosystems from the 1980s to the 2010s

China’s forest soils represented the largest SOC sink over the past three decades, although SOC storage in forests declined in some ecological regions (Tables 3 and 4). Overall, the net increase in SOC storage in the 0-100 cm soil layer (2.52 ± 0.77 Pg C, with an average increasing rate of 0.084 ± 0.026 Pg C yr-1) accounted for 83% of soil C sequestration capacity in Chinese terrestrial ecosystems, which was consistent with the SOC dynamics reported in Xie et al. (2007), Piao et al. (2009), and Yang et al. (2014b). Xie et al. (2007) estimated SOC storage changes based on the mean rate of forest SOC accumulation, Piao et al. (2009) explored changes of SOC storage through regression equations of SOC density on climatic factors and biomass, and Yang et al. (2014) used 501 paired plots to directly evaluate changes in the 0-10 cm layer. Considering method and data source, our estimates should be more accurate and more comprehensive, and the higher estimates in our study could be partly attributed to differences in the study period. Since most reforestation projects started in the 1980s, forest C sequestration (in both vegetation and soil) increased with tree growth (Zhou et al., 2006; Luyssaert et al., 2008). Despite being relatively more stable than top soils (0-20 cm), deep soils (20-100 cm) might have played a role in forest C sequestration, which should be further studied.
Grassland soils in China acted as a weak C sink in the 1980s-2010s period, with SOC storage increasing only 1.06 ± 0.33 and 0.40 ± 0.78 Pg C in the 0-20 cm and 0-100 cm soil layers, respectively. These estimates were consistent with those of Piao et al. (2007), who used regression of SOC density on climatic factors and NDVI to assess changes in Chinese grasslands SOC storage. Contrastingly, Xie et al. (2007) reported a decrease in the SOC storage of China grasslands, which acted as a C source, based on the rate of SOC loss driven by vegetation degradation in Tibetan grasslands. These differences might have resulted from the different approaches used to estimate SOC storage in China’s grasslands (Fang et al., 2010). In this study, there was an overall increase in SOC storage in China’s grasslands, although it decreased in some northern grasslands (Table 5). Previous studies reported an increase in the aboveground biomass in northern China’s grasslands since 2001, when the government implemented measures to protect grassland resources (e.g. returning reclaimed land to grasslands, grazing exclusion, and rest grazing) (Piao et al., 2007; Piao et al., 2009; Xin et al., 2009; Ma et al., 2010). Thus the observed SOC decrease might be partly attributed to a lag in the response of SOC to increase inputs from plant biomass (Hu et al., 2016). Additionally, increases in SOC storage in China’s grassland might be because of new SOM inputs from root and litter, and to a slower SOM decomposition accompanying the decrease in grasslands’ temperature following the increase in aboveground biomass (He et al., 2008, 2013).
Table 5 Changes in SOC density (kg C m-2) and storage (Pg C) across different ecological regions of China from the 1980s to the 2010s (0-100 cm layer)
Croplands had the smallest SOC increase in China over the past 30 years with topsoil (0-20 cm) SOC storage increasing at a rate of 0.013 ± 0.003 Pg C yr-1, approximately. The increase of SOC storage in the topsoil was mainly contributed to changes in agricultural practices to increase crop production, which increased soils’ residues and root input (Huang et al., 2007; Xie et al., 2007; Sun et al., 2010). The return of agricultural residues to croplands has also been pointed out as an important factor contributing to SOC storage increase in some regions of China (Liu et al., 2014a). However, cropland soils in southern China, which have an intensive and long history of agricultural activity, lost SOC in the 0-100 cm layers even though SOC increased in the topsoil.
China’s wetlands acted as substantial C sources during the 1980s and the 2010s, despite the apparent decrease in China’s wetlands SOC storage because of a decrease in wetland area and SOC storage per unit area (Liu and Zhang, 2005). Although wetlands occupy only 1.6%-1.7% of the Chinese terrestrial ecosystems, their SOC content is much higher than in other ecosystems. The decreasing water level or the declining area of wetlands, might lead to a drastic decrease in the SOM, to which increasing soil temperature, porosity and permeability (Davidson and Janssens, 2006). Unfortunately, few studies have addressed wetlands’ role as a C sink or source based on systematic field investigations at a national scale, an issue that still requires further studies.

4.3 Changes of carbon storage in Chinese terrestrial ecosystems from the 1980s to the 2010s

Overall, the soils of Chinese terrestrial ecosystems acted as net C sink (3.04 ± 1.65 Pg C) from the 1980s to the 2010s, with an average increasing rate of 0.101 ± 0.055 Pg C yr-1. Our estimates were slightly higher than that of Piao et al. (2009), which used an inventory-satellite-based and process-based methods to estimate the C sink rate (0.075 Pg C yr-1). Based on China’s ground observation data, Fang et al. (2007)estimated that terrestrial vegetation sunk approximately 0.100 ± 0.006 Pg C yr-1 from 1981-2000. If these results were simply combined (vegetation and soil C sink rates), the net C sink in Chinese terrestrial ecosystems would be 0.201 ± 0.061 Pg C yr-1, which is similar to that of European terrestrial ecosystems (Peterset al., 2010), but lower than that of terrestrial ecosystems in the United States (Xiao et al., 2011) (Figure 6). The amount of C sink in Chinese terrestrial ecosystems may offset about 14.85%-27.79% of the CO2 emissions from fossil fuel during the 1980s-2010s period in China (C emission data in China were retrieved from http://www.globalcarbonproject.org.)
Figure 6 Overall terrestrial ecoystems C sink in China, Europe, and the United States
(Data for Europe and United States are derived from Peters et al., 2010 and Xiao et al., 2011)

5 Conclusions

This is the first estimate of soil C sink in Chinese terrestrial ecosystems at a national scale based on field measured data. The SOC storage (0-100 cm) in China increased 3.04 ± 1.65 Pg C, with an average increasing rate of 0.101 ± 0.055 Pg C yr-1, accompanying the increase rate of 0.100 ± 0.006 Pg C yr-1 in vegetation C storage, because of a series of key ecological restoration projects and changes in agricultural practices. Increase in SOC storage was the largest in forest soils, followed by grasslands and croplands, but decreased in wetlands from the 1980s to the 2010s. Thus, both public and government should pay more attention to the protection of wetlands’ vegetation and soil. Combining soil and vegetation C sink capacity, China’s terrestrial ecosystems might have absorbed 14.85%-27.79% of the fossil fuel C emissions during the 1980s-2010s. Overall, our findings suggested that the large C sequestration potential of China’s terrestrial ecosystems is because of the increase in afforestation and vegetation restoration programs implemented in the past decades, and these ecosystems might play additional important roles in C sequestration in the scenario of global warming.

Acknowledgements

We thank National Climate Center for providing the data of their simulations by regional climate model, and appreciate the data share from National Data Sharing Infrastructure of Earth System Science (http://www.geodata.cn/).

The authors have declared that no competing interests exist.

[1]
Batjes N H, 1996. Total carbon and nitrogen in the soils of the world.European Journal of Soil Science, 47(2): 151-163.

DOI

[2]
Bohn H L, 1982. Estimate of organic carbon in world soils.Soil Science Society of America Journal, 46(5): 1118-1119.The current estimate of organic carbon in world soils, 7.1 × 10kg, is based on such meager data that it must be viewed skeptically. The FAO-UNESCO soil map and other recent soil data indicate that the amount of organic soil carbon is about 30 × 10kg. This new estimate should allow more accurate portrayal of the role of soil carbon in the carbon cycle.

DOI

[3]
Cao M K, Woodward F I, 1998. Net primary and ecosystem production and carbon stocks of terrestrial ecosystems and their responses to climate change.Global Change Biology, 4(2): 185-198.Abstract Evaluating the role of terrestrial ecosystems in the global carbon cycle requires a detailed understanding of carbon exchange between vegetation, soil, and the atmosphere. Global climatic change may modify the net carbon balance of terrestrial ecosystems, causing feedbacks on atmospheric CO 2 and climate. We describe a model for investigating terrestrial carbon exchange and its response to climatic variation based on the processes of plant photosynthesis, carbon allocation, litter production, and soil organic carbon decomposition. The model is used to produce geographical patterns of net primary production (NPP), carbon stocks in vegetation and soils, and the seasonal variations in net ecosystem production (NEP) under both contemporary and future climates. For contemporary climate, the estimated global NPP is 57.0 Gt C y 1 , carbon stocks in vegetation and soils are 640 Gt C and 1358 Gt C, respectively, and NEP varies from 0.5 Gt C in October to 1.6 Gt C in July. For a doubled atmospheric CO 2 concentration and the corresponding climate, we predict that global NPP will rise to 69.6 Gt C y 1 , carbon stocks in vegetation and soils will increase by, respectively, 133 Gt C and 160 Gt C, and the seasonal amplitude of NEP will increase by 76%. A doubling of atmospheric CO 2 without climate change may enhance NPP by 25% and result in a substantial increase in carbon stocks in vegetation and soils. Climate change without CO 2 elevation will reduce the global NPP and soil carbon stocks, but leads to an increase in vegetation carbon because of a forest extension and NPP enhancement in the north. By combining the effects of CO 2 doubling, climate change, and the consequent redistribution of vegetation, we predict a strong enhancement in NPP and carbon stocks of terrestrial ecosystems. This study simulates the possible variation in the carbon exchange at equilibrium state. We anticipate to investigate the dynamic responses in the carbon exchange to atmospheric CO 2 elevation and climate change in the past and future.

DOI

[4]
Cox P M, Betts R A, Jones C D et al., 2000. Acceleration of global warming due to carbon-cycle feedbacks in a coupled climate model.Nature, 408(6813): 184-187.The continued increase in the atmospheric concentration of carbon dioxide due to anthropogenic emissions is predicted to lead to significant changes in climate. About half of the current emissions are being absorbed by the ocean and by land ecosystems, but this absorption is sensitive to climate as well as to atmospheric carbon dioxide concentrations, creating a feedback loop. General circulation models have generally excluded the feedback between climate and the biosphere, using static vegetation distributions and CO2 concentrations from simple carbon-cycle models that do not include climate change. Here we present results from a fully coupled, three-dimensional carbon-climate model, indicating that carbon-cycle feedbacks could significantly accelerate climate change over the twenty-first century. We find that under a 'business as usual' scenario, the terrestrial biosphere acts as an overall carbon sink until about 2050, but turns into a source thereafter. By 2100, the ocean uptake rate of 5 Gt C yr(-1) is balanced by the terrestrial carbon source, and atmospheric CO2 concentrations are 250 p.p.m.v. higher in our fully coupled simulation than in uncoupled carbon models, resulting in a global-mean warming of 5.5 K, as compared to 4 K without the carbon-cycle feedback.

DOI PMID

[5]
Davidson E A, Janssens I A, 2006. Temperature sensitivity of soil carbon decomposition and feedbacks to climate change.Nature, 440(7081): 165-173.

DOI

[6]
Eswaran H, Vandenberg E, Reich P, 1993. Organic carbon in soils of the world.Soil Science Society of America Journal, 57(1): 192-194.The C stored in soils is nearly three times that in the aboveground biomass and approximately double that in the atmosphere. Reliable estimates have been difficult to obtain due to a lack of global data on kinds of soils and the amount of C in each soil. With new data bases, our study is able to provide more reliable data than previous estimates. Globally, 1576 Pg of C is stored in soils, with [approx] 506 Pg (32%) of this in soils of the tropics. It is also estimated that [approx] 40% of the C in soils of the tropics is in forest soils. Other studies have shown that deforestation can result in 20 to 50% loss of this stored C, largely through erosion. 13 refs., 5 tabs.

DOI

[7]
Fang J Y, Guo Z D, Piao S L et al., 2007. Terrestrial vegetation carbon sinks in China, 1981-2000.Science in China Series D: Earth Sciences, 50(9): 1341-1350.Using China’s ground observations, e.g., forest inventory, grassland resource, agricultural statistics, climate, and satellite data, we estimate terrestrial vegetation carbon sinks for China’s major biomes between 1981 and 2000. The main results are in the following: (1) Forest area and forest biomass car-bon (C) stock increased from 116.5×10 ha and 4.3 Pg C (1 Pg C = 10 g C) in the early 1980s to 142.8×10 ha and 5.9 Pg C in the early 2000s, respectively. Forest biomass carbon density increased form 36.9 Mg C/ha (1 Mg C = 10 g C) to 41.0 Mg C/ha, with an annual carbon sequestration rate of 0.075 Pg C/a. Grassland, shrub, and crop biomass sequestrate carbon at annual rates of 0.007 Pg C/a, 0.014―0.024 Pg C/a, and 0.0125―0.0143 Pg C/a, respectively. (2) The total terrestrial vegetation C sink in China is in a range of 0.096―0.106 Pg C/a between 1981 and 2000, accounting for 14.6%―16.1% of carbon dioxide (CO) emitted by China’s industry in the same period. In addition, soil carbon sink is estimated at 0.04―0.07 Pg C/a. Accordingly, carbon sequestration by China’s terrestrial ecosystems (vegetation and soil) offsets 20.8%―26.8% of its industrial CO2 emission for the study period. (3) Considerable uncertainties exist in the present study, especially in the estimation of soil carbon sinks, and need further intensive investigation in the future.

DOI

[8]
Fang J Y, Liu G H, Xu S L, 1996. Soil carbon pool in China and its global significance.Journal of Environmental Sciences, 8(2): 249-254. (in Chinese)

DOI

[9]
Fang J Y, Yang Y H, Ma W H et al., 2010. Ecosystem carbon stocks and their changes in China’s grasslands.Science China Life Sciences, 53(7): 757-765.with an average of 300.2 g C m. Likewise, soil C density also varied greatly between 8.5 and 15.1 kg C m. In total, ecosystem C stock in China’s grasslands was estimated at 29.1 Pg C. (2) Both the magnitude and direction of ecosystem C changes in China’s grasslands differed greatly among previous studies. According to recent reports, neither biomass nor soil C stock in China’s grasslands showed a significant change during the past 20 years, indicating that grassland ecosystems are C neutral. (3) Spatial patterns and temporal dynamics of grassland biomass were closely correlated with precipitation, while changes in soil C stocks exhibited close associations with soil moisture and soil texture. Human activities, such as livestock grazing and fencing could also affect ecosystem C dynamics in China’s grasslands.

DOI PMID

[10]
Fu B J, Liu G H, Ma K M et al., 2001. Scheme of ecological regionalization in China. Acta Ecologica Sinica, 21(1): 1-6. (in Chinese)Ecological regionalization is a base for rational management and sustainable utilization of ecosystems and natural resources It can provide scientific basis for constructing healthy ecological environments and making policies of environmental management In this paper, based on synthetical analysis of the characteristics of ecological environments of China, the principles of ecological regionalization are discussed, and indices and nomenclature of ecological regionalization are proposed, The ecoregions in national scale are divided The results show that there are 3 domains, 13 ecoregions and 57 ecodistricts

[11]
Hayes D J, Turner D P, Stinson G et al., 2012. Reconciling estimates of the contemporary North American carbon balance among terrestrial biosphere models, atmospheric inversions, and a new approach for estimating net ecosystem exchange from inventory-based data.Global Change Biology, 18(4): 1282-1299.We develop an approach for estimating net ecosystem exchange (NEE) using inventory-based information over North America (NA) for a recent 7-year period (ca. 2000–2006). The approach notably retains information on the spatial distribution of NEE, or the vertical exchange between land and atmosphere of all non-fossil fuel sources and sinks of CO2, while accounting for lateral transfers of forest and crop products as well as their eventual emissions. The total NEE estimate of a 61327 ± 252 TgC yr611 sink for NA was driven primarily by CO2 uptake in the Forest Lands sector (61248 TgC yr611), largely in the Northwest and Southeast regions of the US, and in the Crop Lands sector (61297 TgC yr611), predominantly in the Midwest US states. These sinks are counteracted by the carbon source estimated for the Other Lands sector (+218 TgC yr611), where much of the forest and crop products are assumed to be returned to the atmosphere (through livestock and human consumption). The ecosystems of Mexico are estimated to be a small net source (+18 TgC yr611) due to land use change between 1993 and 2002. We compare these inventory-based estimates with results from a suite of terrestrial biosphere and atmospheric inversion models, where the mean continental-scale NEE estimate for each ensemble is 61511 TgC yr611 and 61931 TgC yr611, respectively. In the modeling approaches, all sectors, including Other Lands, were generally estimated to be a carbon sink, driven in part by assumed CO2 fertilization and/or lack of consideration of carbon sources from disturbances and product emissions. Additional fluxes not measured by the inventories, although highly uncertain, could add an additional 61239 TgC yr611 to the inventory-based NA sink estimate, thus suggesting some convergence with the modeling approaches.

DOI

[12]
He N P, Wang R M, Gao Y et al., 2013. Changes in the temperature sensitivity of SOM decomposition with grassland succession: Implications for soil C sequestration.Ecology and Evolution, 3(15): 5045-5054.Understanding the temperature sensitivity (Q10) of soil organic matter (SOM) decomposition is important for predicting soil carbon (C) sequestration in terrestrial ecosystems under warming scenarios. Whether Q10 varies predictably with ecosystem succession and the ways in which the stoichiometry of input SOM influences Q10 remain largely unknown. We investigate these issues using a grassland succession series from free-grazing to 31-year grazing-exclusion grasslands in Inner Mongolia, and an incubation experiment performed at six temperatures (0, 5, 10, 15, 20, and 25 C) and with four substrates: control (CK), glucose (GLU), mixed grass leaf (GRA), and Medicago falcata leaf (MED). The results showed that basal soil respiration (20 C) and microbial biomass C (MBC) logarithmically decreased with grassland succession. Q10 decreased logarithmically from 1.43 in free-grazing grasslands to 1.22 in 31-year grazing-exclusion grasslands. Q10 increased significantly with the addition of substrates, and the Q10 levels increased with increase in N:C ratios of substrate. Moreover, accumulated C mineralization was controlled by the N:C ratio of newly input SOM and by incubation temperature. Changes in Q10 with grassland ecosystem succession are controlled by the stoichiometry of newly input SOM, MBC, and SOM quality, and the combined effects of which could partially explain the mechanisms underlying soil C sequestration in the long-term grazing-exclusion grasslands in Inner Mongolia, China. The findings highlight the effect of substrate stoichiometry on Q10 which requires further study.

DOI PMID

[13]
He N P, Yu Q, Wu L et al., 2008. Carbon and nitrogen store and storage potential as affected by land-use in aLeymus chinensis grassland of northern China. Soil Biology & Biochemistry, 40(12): 2952-2959.

[14]
Hu Z M, Li S G, Guo Q et al., 2016. A synthesis of the effect of grazing exclusion on carbon dynamics in grasslands in China.Global Change Biology, 22(4): 1385-1393.Abstract Grazing exclusion (GE) is considered to be an effective approach to restore degraded grasslands and to improve their carbon (C) sequestration. However, the C dynamics and related controlling factors in grasslands with GE have not been well characterized. This synthesis examines the dynamics of soil C content and vegetation biomass with the recovery age through synthesizing results of 51 sites in grasslands in China. The results illustrate increases in soil C content and vegetation biomass with GE at most sites. Generally, both soil C content and vegetation biomass arrive at steady state after 15 years of GE. In comparison, the rates of increase in above- and belowground biomass declined exponentially with the age of GE, whereas soil C content declined in a milder (linear) way, implying a lagged response of soil C to the inputs from plant biomass. Mean annual precipitation (MAP) and the rate of soil nitrogen (N) change were the main factors affecting the rate of soil C content change. MAP played a major role at the early stage, whereas the rate of soil N change was the major contributor at the middle and late stages. Our results imply that the national grassland restoration projects in China may be more beneficial for C sequestration in humid regions with high MAP. In addition, increased soil N supply to grasslands with GE at the latter recovery stage may enhance ecosystem C sequestration capacity.

DOI PMID

[15]
Huang Y, Sun W J, 2006. Changes in topsoil organic carbon of croplands in mainland China over the last two decades.Chinese Science Bulletin, 51(15): 1785-1803.由寻找文学数据库,我们获得了自从 1993,出版的超过 200 篇文章那与表层土的大小有关在不同区域的器官的碳(SOC ) 。客观地在最后二十年在 SOC 评估变化,我们从这些记录文章选择了 132representative 文章。超过 6 万个土壤样品 and/orsampling 地点在选择文章被包括。从分析这些数据集合的结果显示 SOC 的集中在 53 percent-59 百分比增加了,在 30percent-31% 减少了并且分别地在国家农田的 4 percent-6 百分比稳定了。Afurther 调查证明在中国农田的 SOC 的全部的增长从 311.3Tg 到 401.4 Tg。以行政区域,重要增加分别地在东北中国发生在东方、北的中国和减少。当由土壤伟人组评估了时, SOC 在稻土壤和 fluvo-aquic 土壤更加增加了并且在脆银矿显著地减少了。SOC 的增加被归因于庄稼残余的修正案,器官的粪肥,合成化肥申请的 augment 和营养素的最佳的联合,和没有耕种和还原剂耕种的发展练习。水损失和土壤侵蚀和低输入在脆银矿导致了 SOC 的大减少。以便有效地提高土壤 C 隐遁并且极大地在东北中国控制 SOC 减小,未来努力应该在开发新技术被做,训练农民并且完成政府赔偿的政策,由哪个庄稼稻草的应用程序,授精的改进, no-tillageand 还原剂耕种的实践,和水损失和土壤侵蚀的控制能进一步被认识到。 Torespond 到从京都协议的增加的压力从那时,四个方面进一步为未来研究需要被探讨包括在第二 StateSoil 调查并且目前的 SOC 存储的数量化离子,在决定 SOC 动力学的两个人为的andnon人为的原因的控制机理的理解,能有效地提高 SOC 隐遁或还原剂 SOC 损失的选择的调查,和对在一个公民上的未来的潜力和可能的 SOC 动力学的评价可伸缩。

DOI

[16]
Huang Y, Zhang W, Sun W J et al., 2007. Net primary production of Chinese croplands from 1950 to 1999.Ecological Applications, 17(3): 692-701.Considerable efforts have been made to assess the contribution of forest and grassland ecosystems to the global carbon budget, while less attention has been paid to agriculture. Net primary production (NPP) of Chinese croplands and driving factors are seldom taken into account in the regional carbon budget. We studied crop NPP by analyzing the documented crop yields from 1950 to 1999 on a provincial scale. Total NPP, including estimates of the aboveground and belowground components, was calculated from harvested yield data by (1) conversion from economic yield of the crop to aboveground mass using the ratio of aboveground residue production to the economic yield, (2) estimation of belowground mass as a function of aboveground mass, and (3) conversion from total dry mass to carbon mass. This approach was applied to 13 crops, representing 86.8% of the total harvested acreage of crops in China. Our results indicated that NPP in Chinese croplands increased markedly during this period. Averaging for each decade, the amount of NPP was 146 ± 32, 159 ± 34, 260 ± 55, 394 ± 85, and 513 ± 111 Tg C/yr (mean ± SD) in the 1950s, 1960s, 1970s, 1980s, and 1990s, respectively. This increase may be attributed to synthetic fertilizer application. A further investigation indicated that the climate parameters of temperature and precipitation determined the spatial variability in NPP. Spatiotemporal variability in NPP can be well described by the consumption of synthetic fertilizer and by climate parameters. In addition, the total amount of residue C and root C retained by the soils was estimated to be 618 Tg, with a range from 300 to 1040 Tg over the 50 years.

DOI PMID

[17]
Janssens I A, Freibauer A, Ciais P et al., 2003. Europe’s terrestrial biosphere absorbs 7 to 12% of European anthropogenic CO2 emissions.Science, 300(5625): 1538-1542.

DOI

[18]
Jobbágy E G, Jackson R B, 2000. The vertical distribution of soil organic carbon and its relation to climate and vegetation.Ecological Applications, 10(2): 423-436.

DOI

[19]
Lal R, 2004a. Offsetting China’s CO2 emissions by soil carbon sequestration.Climatic Change, 65(3): 263-275.Fossil fuel emissions of carbon (C) in China in 2000 was about 1 Pg/yr, which may surpass that of the U.S. (1.84 Pg C) by 2020. Terrestrial C pool of China comprises about 35 to 60 Pg in the forest and 120 to 186 Pg in soils. Soil degradation is a major issue affecting 145 Mha by different degradative processes, of which 126 Mha are prone to accelerated soil erosion. Similar to world soils, agricultural soils of China have also lost 30 to 50% or more of the antecedent soil organic carbon (SOC) pool.Some of the depleted SOC pool can be re-sequestered through restoration of degraded soils, and adoption of recommended management practices. The latter include conversion of upland crops to multiple cropping and rice paddies, adoption of integrated nutrient management (INM) strategies, incorporation of cover crops in the rotations cycle and adoption of conservation-effective systems including conservation tillage. A crude estimated potential of soil C sequestration in China is 119 to 226 Tg C/y of SOC and 7 to 138 Tg C/y for soil inorganic carbon (SIC) up to 50 years. The total potential of soil C sequestration is about 12 Pg, and this potential can offset about 25%of the annual fossil fuel emissions in China.

DOI

[20]
Lal R, 2004b. Soil carbon sequestration impacts on global climate change and food security.Science, 304(5677): 1623-1627.

DOI

[21]
Li K R, Wang S Q, Cao M K, 2003. Carbon storage in vegetation and soil of China.Science in China Series D: Earth Sciences, 33(1): 72-80. (in Chinese)

[22]
Liang W, Yang Y T, Fan D M et al., 2015. Analysis of spatial and temporal patterns of net primary production and their climate controls in China from 1982 to 2010.Agricultural and Forest Meteorology, 204: 22-36.Ecosystem net primary production (NPP) represents vegetation biomass increment after accounting for autotrophic respiration and is recognized as an important component of the terrestrial carbon cycle. In this study, the spatial and temporal patterns of NPP and their climate controls in China’s ecosystems for the period of 1982–2010 were analyzed by using a remote sensing-based carbon model (i.e., the Carnegie–Ames–Stanford Approach, CASA) and multiple statistical methods. Validation against NPP observations from 335 forests sites showed good performance of CASA over the study region, with an overall coefficient of determination (R2) of 0.73 and root mean square error (RMSE) of 132.9gCm612yr611. Spatially, we found that the spatial pattern of China’s NPP showed gradients decreasing from the southeast toward northwest, which could be mainly explained by the spatial variability in annual precipitation. Temporally, China’s NPP showed a significant increasing trend at both the national and biome levels during 1982–2010, with an annual increase of 0.011PgC or 0.42%. However, the increasing trends in NPP were not continuous throughout the 29-year period at the national scale. On the other hand, it showed three periods where the trends changed, which was likely being caused by a shift in climate conditions and extensive drought. Air temperature was found to be the dominant climatic factor that controlled the interannual variability in NPP throughout the country except for arid and semi-arid regions in the middle-north and northwest parts of China, where the interannual variations in NPP were mainly explained by changes in precipitation. Similar results were also obtained at the seasonal scale that changes in NPP were generally controlled by that in air temperature except for summertime, in which higher NPP were favored by higher summer precipitation, whereas summer temperature was negatively correlated with NPP. At the monthly scale, NPP responded to change in temperature more rapidly than that in precipitation. However, temperature appeared to control NPP only in humid and semi-humid regions. For monthly NPP–precipitation relationship, the strongest positive relations were observed when NPP lagged behind precipitation by 1–3 months. However, deviating from the common hypothesis that plant in drier areas should respond to water availability more rapidly than in other regions, our analysis revealed a relative large time lag between monthly NPP and precipitation in arid ecosystems (i.e., 3 months). This result suggests that there may be a more complex mechanism of local water redistribution that controls vegetation water use (e.g., use of water from previous year precipitation) in extremely arid ecosystems.

DOI

[23]
Liu C, Lu M, Cui J et al., 2014a. Effects of straw carbon input on carbon dynamics in agricultural soils: A meta-analysis.Global Change Biology, 20(5): 1366-1381.

DOI

[24]
Liu W H, Zhu J J, Jia Q Q et al., 2014b. Carbon sequestration effects of shrublands in Three-North Shelterbelt Forest region, China.Chinese Geographical Science, 24(4): 444-453.Three-North Shelterbelt Forest (TSF) program, is one of six key forestry programs and has a 73-year construction period, from 1978 to 2050. Quantitative analysis of the carbon sequestration of shrubs in this region is important for understanding the overall function of carbon sequestration of the forest and other terrestrial ecosystems in China. This study investigated the distribution area of shrubland in the TSF region based on remote sensing images in 1978 and 2008, and calculated the carbon density of shrubland in combination with the field investigation and previous data from published papers. The carbon sequestration quantity and rate from 1978 to 2008 was analyzed for four sub-regions and different types of shrubs in the TSF region. The results revealed that: 1) The area of shrubland in the study area and its four sub-regions increased during the past thirty years. The area of shrubland for the whole region in 2008 was 1.2 10 7 ha, 72.8% larger than that in 1978. The Inner Mongolia-Xinjiang Sub-region was the largest shrubland distribution area, while the highest coverage rate was found in the North China Sub-region. 2) In decreasing order of their carbon sequestration, the four types of shrubs considered in this study were Hippophae rhamnoides, Caragana spp., Haloxylon ammodendron and Vitex negundo var. heterophylla . The carbon sequestration of H. rhamnoides , with a maximum mean carbon density of 16.5 Mg C/ha, was significantly higher than that of the other three species. 3) The total carbon sequestration of shrubland in the study region was 4.5 10 7 Mg C with a mean annual carbon sequestration of 1.5 10 6 Mg C. The carbon density in the four sub-regions decreased in the following order: the Loess Plateau Sub-region, the North China Sub-region, the Northeast China Sub-region and the Inner Mongolia-Xinjiang Sub-region. The paucity of studies and data availability on the large-scale carbon sequestration of shrub species suggests this study provides a baseline reference for future research in this area.

DOI

[25]
Liu Z G, Zhang K M, 2005. Wetland soils carbon stock in the Sanjiang plain.Journal of Tsinghua University (Science and Technology), 45(6): 788-791. (in Chinese)

[26]
Luyssaert S, Schulze E D, Börner A et al., 2008. Old-growth forests as global carbon sinks.Nature, 455(7210): 213-215.

DOI

[27]
Ma A N, He N P, Yu G R et al., 2016. Carbon storage in Chinese grassland ecosystems: Influence of different integrative methods. Scientific Reports, 6: srep21378.doi:10.1038/srep21378.The accurate estimate of grassland carbon (C) is affected by many factors at the large scale. Here, we used six methods (three spatial interpolation methods and three grassland classification methods) to estimate C storage of Chinese grasslands based on published data from 2004 to 2014, and assessed the uncertainty resulting from different integrative methods. The uncertainty (coefficient of variation, CV, %) of grassland C storage was approximately 4.8% for the six methods tested, which was mainly determined by soil C storage. C density and C storage to the soil layer depth of 10065cm were estimated to be 8.4665±650.4165kg C mand 30.9865±651.25 Pg C, respectively. Ecosystem C storage was composed of 0.2365±650.01 (0.7%) above-ground biomass, 1.3865±650.14 (4.5%) below-ground biomass, and 29.3765±651.2 (94.8%) Pg C in the 0–10065cm soil layer. Carbon storage calculated by the grassland classification methods (18 grassland types) was closer to the mean value than those calculated by the spatial interpolation methods. Differences in integrative methods may partially explain the high uncertainty in C storage estimates in different studies. This first evaluation demonstrates the importance of multi-methodological approaches to accurately estimate C storage in large-scale terrestrial ecosystems.

DOI PMID

[28]
Ma W H, Fang J Y, Yang Y H et al., 2010. Biomass carbon stocks and their changes in northern China’s grasslands during 1982-2006.Science China Life Sciences, 53(7): 841-850.Abstract Grassland covers approximately one-third of the area of China and plays an important role in the global terrestrial carbon (C) cycle. However, little is known about biomass C stocks and dynamics in these grasslands. During 2001-2005, we conducted five consecutive field sampling campaigns to investigate above-and below-ground biomass for northern China's grasslands. Using measurements obtained from 341 sampling sites, together with a NDVI (normalized difference vegetation index) time series dataset over 1982-2006, we examined changes in biomass C stock during the past 25 years. Our results showed that biomass C stock in northern China's grasslands was estimated at 557.5 Tg C (1 Tg=10(12) g), with a mean density of 39.5 g C m(-2) for above-ground biomass and 244.6 g C m(-2) for below-ground biomass. An increasing rate of 0.2 Tg C yr(-1) has been observed over the past 25 years, but grassland biomass has not experienced a significant change since the late 1980s. Seasonal rainfall (January-July) was the dominant factor driving temporal dynamics in biomass C stock; however, the responses of grassland biomass to climate variables differed among various grassland types. Biomass in arid grasslands (i.e., desert steppe and typical steppe) was significantly associated with precipitation, while biomass in humid grasslands (i.e., alpine meadow) was positively correlated with mean January-July temperatures. These results suggest that different grassland ecosystems in China may show diverse responses to future climate changes.

DOI PMID

[29]
Ni J, 2001. Carbon storage in terrestrial ecosystems of China: Estimates at different spatial resolutions and their responses to climate change.Climatic Change, 49(3): 339-358.The carbon storage of terrestrial ecosystems in China was estimated using acommon carbon density method for vegetation and soils relating to thevegetation types. Usingmedian density estimates, carbon storage of 35.23 Gt (1 Gt = 10 15 g) in biomass and119.76 Gt in soils with total of 154.99 Gt were calculated based on thebaseline distribution of37 vegetation types. Total carbon storage of the median estimates at differentspatial resolutionswas 153.43, 158.08 and 158.54 Gt, respectively, for the fine (10′),median (20′) and coarse (30′)latitude × longitude grids. There were differences of 611.56, +3.09and +3.55 Gt carbon storagebetween baseline vegetation and those at different spatial resolutions. Changein mappingresolution would change area estimates and hence carbon storage estimates. Thefiner the spatialresolution in mapping vegetation, the closer the carbon storage to thebaseline estimation. Carbonstorage in vegetation and soils for baseline vegetation is quite similar tothat of biomes predictedby BIOME3 for the present climate and CO 2 concentration of 340ppmv. Climate changealone as well as climate change with elevated CO 2 concentrationwill produce an increasein carbon stored by vegetation and soils, especially a larger increase in thesoils. Total mediancarbon storage of terrestrial ecosystems in China will increase by 5.09 Gt and15.91 Gt for theclimate scenario at CO 2 concentration of 340 ppmv and 500 ppmv,respectively. This ismainly due to changes in vegetation areas and the effects of changes inclimate and CO 2 concentration.

DOI

[30]
Ni J, 2002. Carbon storage in grasslands of China.Journal of Arid Environments, 50(2): 205-218.Carbon storage in grasslands of China was estimated by the carbon density method and based on a nationwide grassland resource survey finished by 1991. The grasslands in China were classified into 18 types, which are distributed mostly in the temperate region and on the Tibetan Plateau, and scattered in the warm-temperate and tropical regions. Based on the median estimate, vegetation, soil and total carbon storage of grasslands in China were 3.06, 41.03 and 44.09 Pg C, respectively. Vegetation had low carbon storage and most carbon was stored in soils. Of the four types of regions that have grasslands, alpine region (54.5%) and temperate region (31.6%) hold more than 85% of the total grassland carbon (in both vegetation and soils) in China. Considering specific types within these two regions, three grassland types, alpine meadow (25.6%), alpine steppe (14.5%) and temperate steppe (11%) constituted more than half of all carbon stored in China's grasslands. In general and regardless of regional vegetation types, steppes (38.6%) and meadows (38.2%) made up more than 2/3 of total grassland carbon. The carbon storage in alpine grasslands may have a significant and long-lived effect on global C cycles. This study estimated more carbon storage in vegetation and less in soils than previous studies. The differences of grassland carbon between this study and two previous studies were due probably to four reasons, i.e. different estimation methods, different classification systems of grasslands, different areas of grasslands, and different carbon densities. China's grasslands cover only 6-8% of total world grassland area and have 9-16% of total carbon in the world grasslands. They make a big contribution to the world carbon storage and may have significant effects on carbon cycles, both in global and in arid lands.

DOI

[31]
Ni J, 2013. Carbon storage in Chinese terrestrial ecosystems: Approaching a more accurate estimate.Climatic Change, 119(3): 905-917.China is an important region for the global study of carbon because of its vast territory with various climate regimes, diverse ecosystems, and long-term human disturbances and land-use history. Carbon storage in ecosystems in China has been estimated using inventory and modeling methods in the past two decades. However, different methods may result in varied magnitudes and forms of carbon storage. In this study, the current status of carbon storage in terrestrial ecosystems in China, including the impacts of land use, is summarized in the national, regional, and biome scales. Significant differences in data have existed among studies. Such differences are mainly attributed to variations in estimation methods, data availability, and periods. According to available national-scale information on Chinese terrestrial ecosystems, vegetation carbon in China is 6.1 Pg C to 76.2 Pg C (mean 36.98 Pg C) and soil carbon is 43.6 Pg C to 185.7 Pg C (mean 100.75 Pg C). The forest sector has vegetation carbon of 3.26 Pg C to 9.11 Pg C (mean 5.49 Pg C), whereas the grassland sector has 0.13 Pg C to 3.06 Pg C (mean 1.41 Pg C). Soil carbon in the forest and grassland sectors exhibits more significant regional variations. Further studies need a comprehensive methodology, which combines national inventory, field measurement, eddy covariance technique, remote sensing, and model simulation in a single framework, as well as all available data at different temporal and spatial scales, to fully account for the carbon budget in China.

DOI

[32]
Ouyang Z Y, Zheng H, Xiao Y et al., 2016. Improvements in ecosystem services from investments in natural capital.Science, 352(6292): 1455-1459.In response to ecosystem degradation from rapid economic development, China began investing heavily in protecting and restoring natural capital starting in 2000. We report on China’s first national ecosystem assessment (2000–2010), designed to quantify and help manage change in ecosystem services, including food production, carbon sequestration, soil retention, sandstorm prevention, water retention, flood mitigation, and provision of habitat for biodiversity. Overall, ecosystem services improved from 2000 to 2010, apart from habitat provision. China’s national conservation policies contributed significantly to the increases in those ecosystem services.

DOI PMID

[33]
Pacala S W, Hurtt G C, Baker D et al., 2001. Consistent land- and atmosphere-based US carbon sink estimates.Science, 292(5525): 2316-2320.For the period 1980-89, we estimate a carbon sink in the coterminous United States between 0.30 and 0.58 petagrams of carbon per year (petagrams of carbon = 1015grams of carbon). The net carbon flux from the atmosphere to the land was higher, 0.37 to 0.71 petagrams of carbon per year, because a net flux of 0.07 to 0.13 petagrams of carbon per year was exported by rivers and commerce and returned to the atmosphere elsewhere. These land-based estimates are larger than those from previous studies (0.08 to 0.35 petagrams of carbon per year) because of the inclusion of additional processes and revised estimates of some component fluxes. Although component estimates are uncertain, about one-half of the total is outside the forest sector. We also estimated the sink using atmospheric models and the atmospheric concentration of carbon dioxide (the tracer-transport inversion method). The range of results from the atmosphere-based inversions contains the land-based estimates. Atmosphere- and land-based estimates are thus consistent, within the large ranges of uncertainty for both methods. Atmosphere-based results for 1980-89 are similar to those for 1985-89 and 1990-94, indicating a relatively stable U.S. sink throughout the period.

DOI PMID

[34]
Pan G X, 1999. Study on carbon reservoir in soils of China.Bulletin of Science and Technology, 15(5): 330-332.

[35]
Pan G X, Xu X W, Smith P et al., 2010. An increase in topsoil SOC stock of China’s croplands between 1985 and 2006 revealed by soil monitoring.Agriculture Ecosystems & Environment, 136(1): 133-138.Soil C sequestration in cropland could play an important role in mitigating the rapidly increasing CO 2 emissions in China. Many efforts had been dedicated to estimating the potential for C sequestration in croplands. Potential increases in SOC in China's croplands had been recently evaluated using inventory-up-scaling simulation and crop-soil C process-based modeling. In this study, data of SOC change at monitoring sites from croplands across mainland China were collected from publications available from 1985 to 2006 to perform a statistical analysis. The data set comprises 1081 observations (404 from rice paddies, RPs and 677 from dry croplands, DCs). Frequency analysis indicates that over 70% of observations show an increase in SOC, which is higher among RPs than DCs. To quantify SOC dynamics, a Relative Annual Change Index in g kg 611 year 611 (RAC, g kg 611 year 611) is defined and calculated using the initial and final SOC values for the duration of monitored observations. RAC values ranged from 610.806 to 0.963 g kg 611 year 611 for DCs and from 610.597 to 0.959 g kg 611 year 611 for RPs, respectively. From this data, the average is estimated to be 0.056 ± 0.200 g kg 611 year 611 for DCs, and 0.110 ± 0.244 g kg 611 year 611 for RPs, with an overall estimate for China's croplands, with RPs and DCs combined, of 0.076 ± 0.219 g kg 611 year 611. A mean increase in topsoil C (0–20 cm) stock of China's croplands was estimated to be 25.5 Tg C year 611 (8 Tg C year 611 in RPs and 17.5 Tg C year 611 in DCs) between 1985 and 2006, with a total topsoil C stock increase of 0.64 Pg C over the whole period. The annual stock increase may offset 6520%, on average, of the total CO 2 emissions of China for 1994. This study suggests an important role of China's croplands, especially rice paddies, for C sequestration to mitigate climate change.

DOI

[36]
Pan Y D, Birdsey R A, Fang J Y et al., 2011. A large and persistent carbon sink in the world’s forests.Science, 333(6045): 988-993.

DOI

[37]
Peng C H, Apps M J, 1997. Contribution of China to the global carbon cycle since the last glacial maximum: Reconstruction from palaeovegetation maps and an empirical biosphere model.Tellus Series B-Chemical and Physical Meteorology, 49(4): 393-408.A better understanding of the long-term global carbon cycle requires improved estimates of the changes in terrestrial carbon storage (vegetation and soil) during the last glacial-interglacial transition. A set of reconstructions of palaeovegetation and palaeoclimate in China for the last glacial maximum (LGM) and the mid-Holocene (MH) allows us to use the Osnabr ck biosphere model (OBM), which needs as input only 3 climatic parameters that are easily derivable from palaeodata, to reconstruct the past terrestrial carbon storage since the LGM. The change from the conditions of the LGM (colder and drier than present) to the MH (warmer and wetter than present) resulted in a gain of 116 Pg of terrestrial carbon in China mainly due to the build-up of temperate forest and tropical monsoon rain forest, and to the effects of changes in climate and CO 2 levels. However, a loss of 26 Pg of terrestrial carbon (which does not include anthropogenic disturbances) occurred in China between the MH and the present due to shifts in the area covered by the main vegetation types. Results also show that glacial-interglacial changes in climate and vegetation distribution, both associated with variations in the Asian monsoon system, significantly affected terrestrial carbon storage in China which strongly contributed to the global carbon cycle.

DOI

[38]
Peng S L, Wen D, He N P et al., 2016. Carbon storage in China’s forest ecosystems: Estimation by different integrative methods. Ecology and Evolution, 6(10): 3129-3145.Abstract Carbon (C) storage for all the components, especially dead mass and soil organic carbon, was rarely reported and remained uncertainty in China's forest ecosystems. This study used field-measured data published between 2004 and 2014 to estimate C storage by three forest type classifications and three spatial interpolations and assessed the uncertainty in C storage resulting from different integrative methods in China's forest ecosystems. The results showed that C storage in China's forest ecosystems ranged from 30.99 to 34.9602Pg02C by the six integrative methods. We detected 5.0% variation (coefficient of variation, CV, %) among the six methods, which was influenced mainly by soil C estimates. Soil C density and storage in the 0–10002cm soil layer were estimated to be 136.11–153.1602Mg02C·ha611 and 20.63–23.2102Pg02C, respectively. Dead mass C density and storage were estimated to be 3.66–5.4102Mg02C·ha611 and 0.68–0.8202Pg02C, respectively. Mean C storage in China's forest ecosystems estimated by the six integrative methods was 8.55702Pg02C (25.8%) for aboveground biomass, 1.95002Pg02C (5.9%) for belowground biomass, 0.69702Pg02C (2.1%) for dead mass, and 21.95802Pg02C (66.2%) for soil organic C in the 0–10002cm soil layer. The R:S ratio was 0.23, and C storage in the soil was 2.1 times greater than in the vegetation. Carbon storage estimates with respect to forest type classification (38 forest subtypes) were closer to the average value than those calculated using the spatial interpolation methods. Variance among different methods and data sources may partially explain the high uncertainty of C storage detected by different studies. This study demonstrates the importance of using multimethodological approaches to estimate C storage accurately in the large-scale forest ecosystems.

DOI PMID

[39]
Peters W, Krol M C, van Der Werf G R#magtechI# et al., 2010. Seven years of recent European net terrestrial carbon dioxide exchange constrained by atmospheric observations.Global Change Biology, 16(4): 1317-1337.We present an estimate of net ecosystem exchange (NEE) of CO2 in Europe for the years 2001–2007. It is derived with a data assimilation that uses a large set of atmospheric CO2 mole fraction observations (6570 000) to guide relatively simple descriptions of terrestrial and oceanic net exchange, while fossil fuel and fire emissions are prescribed. Weekly terrestrial sources and sinks are optimized (i.e., a flux inversion) for a set of 18 large ecosystems across Europe in which prescribed climate, weather, and surface characteristics introduce finer scale gradients. We find that the terrestrial biosphere in Europe absorbed a net average of 61165 Tg C yr611 over the period considered. This uptake is predominantly in non-EU countries, and is found in the northern coniferous (6194 Tg C yr611) and mixed forests (6130 Tg C yr611) as well as the forest/field complexes of eastern Europe (6185 Tg C yr611). An optimistic uncertainty estimate derived using three biosphere models suggests the uptake to be in a range of 61122 to 61258 Tg C yr611, while a more conservative estimate derived from the a-posteriori covariance estimates is 61165±437 Tg C yr611. Note, however, that uncertainties are hard to estimate given the nature of the system and are likely to be significantly larger than this. Interannual variability in NEE includes a reduction in uptake due to the 2003 drought followed by 3 years of more than average uptake. The largest anomaly of NEE occurred in 2005 concurrent with increased seasonal cycles of observed CO2. We speculate these changes to result from the strong negative phase of the North Atlantic Oscillation in 2005 that lead to favorable summer growth conditions, and altered horizontal and vertical mixing in the atmosphere. All our results are available through http://www.carbontracker.eu

DOI

[40]
Piao S L, Fang JY, Ciais P et al., 2009. The carbon balance of terrestrial ecosystems in China.Nature, 458(7241): 1009-1014.The carbon balance of China is of a large scientific and political concern because China is one of the largest fossil fuel CO2 emitter.Here,we use three independent approaches,biomass and soil carbon inventories,biogeochemical models,and atmospheric inversions,to quantify the terrestrial carbon balance of China and its mechanisms.The three approaches produce robustly similar estimates of a net carbon sink in a range of 0.19-0.24 petagrams C per year,indicating that China's terrestrial biosphere has absorbed 28%-37% of its cumulated fossil carbon emission during 1980s and 1990s.The sink is mostly located in southern China,which is related to regional climate change,plantation programs,and shrub recovery.

DOI PMID

[41]
Piao S L, Fang J Y, Zhou L M et al., 2007. Changes in biomass carbon stocks in China’s grasslands between 1982 and 1999. Global Biogeochemical Cycles, 21(2).doi:10.1029/2005GB002634.1] Terrestrial ecosystems in the northern latitudes are significant carbon sinks for atmospheric CO2; however, few studies come from grassland ecosystems. Using national grassland resource inventory data, NDVI (normalized difference vegetation index) time series data set, and a satellite-based statistical model, this study identifies changes in the size and distribution of aboveground biomass carbon (C) stocks for China's grasslands between 1982 and 1999. Biomass C stocks averaged 145.4 Tg C for the study period for a total area of 334.1 0103 104 km2, and have increased by 17.7 Tg C (1 Tg = 1012 g) from 136.3 Tg C in the early 1980s (average of 19820900091984) to 154.0 Tg C in the late 1990s (average of 19970900091999), with an annual increase of 0.7%. This suggests that the aboveground biomass of China's grasslands may have functioned as the C sinks in the past 2 decades. Assuming a constant ratio of aboveground to belowground biomass for each grassland type, we also estimated belowground biomass C and its change over time for each grassland type, generating an average estimate of 1051.1 Tg C for the total (aboveground and belowground) biomass C and an annual increase of 126.67 Tg C for China's grasslands over the 18 years. However, the accuracy of these estimates has limitations due primarily to uncertainties in estimates of belowground C, biomass inventories, and satellite time series data sets.

DOI

[42]
Post W M, Emanuel W R, Zinke P J et al., 1982. Soil carbon pools and world life zones.Nature, 298(5870): 156-159.Soil organic carbon in active exchange with the atmosphere constitutes approximately two-thirds of the carbon in terrestrial ecosystems. The relatively large size and long residence time of this pool (of the order of 1,200 yr) make it a potentially important sink for carbon released to the atmosphere by fossil fuel combustion; however, in many cases, human disturbance has caused a decrease in soil carbon storage. Various recent estimates place the global total of soil carbon between 700 (ref. 2) and 2,946 10g (ref. 5) with several intermediate estimates: 1,080 (ref. 1), 1,392 (ref. 6), 1,456 (ref. 3), and 2,070 10g (ref. 7). Schlesinger'sestimate seems to be based on the most extensive data base (~200 observations, some of which are mean values derived from large studies in particular areas) and is widely cited in carbon cycle studies. In addition to estimating the world soil carbon pool, it is important to establish the relationships between the geographical distribution of soil carbon and climate, vegetation, human development and other factors as a basis for assessing the influence of changes in any of these factors on the global carbon cycle. Our analysis of 2,700 soil profiles, organized on a climate basis using the Holdridge life-zone classification system, indicates relationships between soil carbon density and climate, a major soil forming factor. Soil carbon density generally increases with increasing precipitation, and there is an increase in soil carbon with decreasing temperature for any particular level of precipitation. When the potential evapotranspiration equals annual precipitation, soil carbon densityis ~10 kg m, exceptions to this being warm temperate and subtropical soils. Based on recent estimates of the areal extent of major ecosystem complexeswhich correspond well with climatic life zones, the global soil organic carbon pool is estimated to be ~1,395 10g.

DOI

[43]
Schrumpf M, Schulze E D, Kaiser K et al., 2011. How accurately can soil organic carbon stocks and stock changes be quantified by soil inventories?Biogeosciences, 8(5): 1193-1212.

DOI

[44]
Sun W J, Huang Y, Zhang W et al., 2010. Carbon sequestration and its potential in agricultural soils of China. Global Biogeochemical Cycles, 24(3).doi:10.1029/2009GB003484.1] Agricultural soils hold potential for the expansion of carbon sequestration. With this in mind, we investigated changes in the soil organic carbon (SOC) on the basis of an analysis of data sets extracted from 146 publications and further projected the SOC sequestration potential in China's cropland. Our results suggest that a significant increase in the SOC occurred in east and north China, while a decrease appeared in northeast China. As a whole, the organic carbon density in the topsoil to 30 cm depth increased by 3.36 (2.54 to 4.26) Mg/ha between 1980 and 2000. Accordingly, the croplands in China that cover an area of over 130 Mha sequestered 437 (331 to 555) Tg C, with an average rate of 21.9 (16.6 to 27.8) Tg/yr, during this period. The potential of SOC sequestration in China was estimated to be 2 2.5 Pg C, which could be achieved by the 2050s if crop production and field management are improved.

DOI

[45]
Wang S L, Huang M, Shao X M et al., 2004. Vertical distribution of soil organic carbon in China.Environmental Management, 33(1): S200-S209.中国科学院机构知识库(CAS IR GRID)以发展机构知识能力和知识管理能力为目标,快速实现对本机构知识资产的收集、长期保存、合理传播利用,积极建设对知识内容进行捕获、转化、传播、利用和审计的能力,逐步建设包括知识内容分析、关系分析和能力审计在内的知识服务能力,开展综合知识管理。

DOI

[46]
Wang S Q, Tian H Q, Liu J Y et al., 2003. Pattern and change of soil organic carbon storage in China: 1960s-1980s.Tellus Series B-Chemical and Physical Meteorology, 55(2): 416-427.Soils, an important component of the global carbon cycle, can be either net sources or net sinks of atmospheric carbon dioxide (CO). In this study, we use the first and second national soil surveys of China to investigate patterns and changes in soil organic carbon storage (SOC) during the period from the 1960s to the 1980s. Our results show that there is a large amount of variability in SOC density among different soil types and land uses in the 1980s. The SOC density in the wetlands of Southwest China was the highest (45 kg/m), followed by meadow soils in the South (26 kg/m), forest and woodlands in the Northwest (19 kg/m), steppe and grassland in the Northwest (15 kg/m), shrubs in the Northwest (12 kg/m), paddy lands in the Northwest (13 kg/m), and drylands in the Northwest (11 kg/m). The desert soils of the Western region ranked the lowest (1 kg/m). The density of SOC was generally higher in the west than other regions. Eastern China had the lowest SOC density, which was associated with a long history of extensive land use in the region. The estimation of SOC storage for the entire nation was 93 Pg C in the 1960s and 92 Pg C in the 1980s. SOC storage decreased about 1 Pg C during the 1960s-1980s. This amount of decrease in SOC for the entire nation is small and statistically insignificant. To adequately characterize spatial variations in SOC, larger sampling sizes of soil profiles will be required in the future analyses

DOI

[47]
Wang S Q, Zhou C H, 1999. Estimating soil carbon reservoir of terrestrial ecosystem in China.Geographical Research, 18(4): 349-356. (in Chinese)

[48]
Wang S Q, Zhou C H, Li K R et al., 2000. Analysis on spatial distribution characteristics of soil organic carbon reservoir in China.Acta Geographica Sinica, 55(5): 533-544. (in Chinese)

[49]
Wang Y F, Fu B J, Lu Y H et al., 2011. Effects of vegetation restoration on soil organic carbon sequestration at multiple scales in semi-arid Loess Plateau, China.Catena, 85(1): 58-66.78 Vegetation cover change has a significant effect on SOC sequestration in arid and semi-arid area. 78 Cropland transforming to grassland or shrubland significantly increased SOC at patch scale. 78 Vegetation cover patterns showed different SOC sequestration at hill slope scale. 78 At the small watershed scale, SOC stocks increased by 19% in 0–20 cm soil depth from 1998 to 2006, an average SOC sequestration rate of 19.92 t C y –1 km –2. 78 Research implied significant negative impacts of soil erosion on SOC sequestration.

DOI

[50]
Wiesmeier M, Sporlein P, Geuss U et al., 2012. Soil organic carbon stocks in southeast Germany (Bavaria) as affected by land use, soil type and sampling depth.Global Change Biology, 18(7): 2233-2245.Precise estimations of soil organic carbon (SOC) stocks are of decided importance for the detection of C sequestration or emission potential induced by land use changes. For Germany, a comprehensive, land use–specific SOC data set has not yet been compiled. We evaluated a unique data set of 1460 soil profiles in southeast Germany in order to calculate representative SOC stocks to a depth of 1 m for the main land use types. The results showed that grassland soils stored the highest amount of SOC, with a median value of 11.8 kg m612, whereas considerably lower stocks of 9.8 and 9.0 kg m612 were found for forest and cropland soils, respectively. However, the differences between extensively used land (grassland, forest) and cropland were much lower compared with results from other studies in central European countries. The depth distribution of SOC showed that despite low SOC concentrations in A horizons of cropland soils, their stocks were not considerably lower compared with other land uses. This was due to a deepening of the topsoil compared with grassland soils. Higher grassland SOC stocks were caused by an accumulation of SOC in the B horizon which was attributable to a high proportion of C-rich Gleysols within grassland soils. This demonstrates the relevance of pedogenetic SOC inventories instead of solely land use–based approaches. Our study indicated that cultivation-induced SOC depletion was probably often overestimated since most studies use fixed depth increments. Moreover, the application of modelled parameters in SOC inventories is questioned because a calculation of SOC stocks using different pedotransfer functions revealed considerably biased results. We recommend SOC stocks be determined by horizon for the entire soil profile in order to estimate the impact of land use changes precisely and to evaluate C sequestration potentials more accurately.

DOI

[51]
Wu B F, Yuan Q Z, Yan C Z et al., 2014. Land cover changes of China from 2000 to 2010. QuaternarySciences, 34(4): 723-731. (in Chinese)Land cover change is an important part of ecosystem change and driving factors.In the impacts of the global change and the ecological construction in the 2000 s,the land cover of China has changed significantly.Monitoring and analysis of this change not only can support China carbon source/sink evaluation and assessment of carbon budget,but also provide the basic data for the ecological environment evaluation.Supported by object-oriented classification technology,the land cover data of China(ChinaCover) in 2000 and 2010 have been produced using Landsat TM/ETM and HJ-1 satellite data of 30 m resolution,combined with a large number of data of field investigation.At the same time,vegetation coverage data has been produced using the dimidiate pixel model with resolution of 250 m.This study has analyzed the change of China land cover changes based on the land cover data and vegetation coverage data of 2000 and 2010.Results have showed that;there have been a total of 19 10~4 km~2land cover changes,accounting for about 2%of the China land area.The areas of woodland and artificial surface have been increased;the areas of grassland,wetland and cultivated land have been decreased.The rapid increase of artificial surface and the mass reduction of cultivated land has been the main trend of land cover changes.The area of artificial surface has increased by 28.7%,while the area of cultivated land has decreased by 4.8 10~4 km~2,2.7%lower than in 2000.The conversion areas of cropland to artificial surface have been mainly concentrated in Eastern China;the conversion areas of cropland to forest and grassland have been mainly distributed in the areas where the "Regulations on Restoring Farmland to Forest" has been carried out;Arable land expansion has been mainly occurred in the Sanjiang plain and the Xinjiang oasis.The vegetation coverage changes of forest,shrub and grassland have showed an overall upward trend in 2000 s.There have been 47.3%,58.8%and 55.6%of the forest,shrub and grassland vegetation cover has been improved.But forest quality has had the trend of degradation in the Wenchuan earthquake-stricken area,Hengduan Mountains and Wuyi Mountain areas;shrub vegetation coverage has declined around the Tarim basin,eastern Tibet Plateau,Taihang Mountain,and Ltiliang Mountain areas;grassland has been deteriorated in central Inner Mongolia,southwestern Tibet Plateau,southern Tianshan and Hulun Buir.

DOI

[52]
Wu H B, Guo Z T, Peng C H, 2003. Distribution and storage of soil organic carbon in China. Global Biogeochemical Cycles, 17(2).doi:10.1029/2001GB001844.1] Surface soils hold the largest terrestrial organic carbon pool, although estimates of the world's soil organic carbon storage remain controversial, largely due to spatial data gaps or insufficient data density. In this study, spatial distribution and storage of soil organic carbon in China are estimated using the published data from 34,411 soil profiles investigated during China's second national soil survey. Results show that organic carbon density in soils varies from 0.73 to 70.79 kg C/m2 with the majority ranging between 4.00 and 11.00 kg C/m2. Carbon density decreases from east to west. A general southward increase is obvious for western China, while carbon density decreases from north to south in eastern China. Highest values are observed in forest soils in northeast China and in subalpine soils in the southeastern part of the Tibetan Plateau. The average density of 0908048.01 kg C/m2 in China is lower than the world's mean organic carbon density in soil (09080410.60 kg C/m2), mainly due to the extended arid and semi-arid regions. Total organic carbon storage in soils in China is estimated to be 09080470.31 Pg C, representing 0908044.7% of the world storage. Carbon storage in the surface organic horizons which is most sensitive to interactions with the atmosphere and environmental change is 09080432.54 Pg C.

DOI

[53]
Xiao J F, Zhuang Q L, Law B E et al., 2011. Assessing net ecosystem carbon exchange of U.S. terrestrial ecosystems by integrating eddy covariance flux measurements and satellite observations.Agricultural and Forest Meteorology, 151(1): 60-69.More accurate projections of future carbon dioxide concentrations in the atmosphere and associated climate change depend on improved scientific understanding of the terrestrial carbon cycle. Despite the consensus that U.S. terrestrial ecosystems provide a carbon sink, the size, distribution, and interannual variability of this sink remain uncertain. Here we report a terrestrial carbon sink in the conterminous U.S. at 0.63 pg C yr 611 with the majority of the sink in regions dominated by evergreen and deciduous forests and savannas. This estimate is based on our continuous estimates of net ecosystem carbon exchange (NEE) with high spatial (1 km) and temporal (8-day) resolutions derived from NEE measurements from eddy covariance flux towers and wall-to-wall satellite observations from Moderate Resolution Imaging Spectroradiometer (MODIS). We find that the U.S. terrestrial ecosystems could offset a maximum of 40% of the fossil-fuel carbon emissions. Our results show that the U.S. terrestrial carbon sink varied between 0.51 and 0.70 pg C yr 611 over the period 2001–2006. The dominant sources of interannual variation of the carbon sink included extreme climate events and disturbances. Droughts in 2002 and 2006 reduced the U.S. carbon sink by 6520% relative to a normal year. Disturbances including wildfires and hurricanes reduced carbon uptake or resulted in carbon release at regional scales. Our results provide an alternative, independent, and novel constraint to the U.S. terrestrial carbon sink.

DOI

[54]
Xie X L, Sun B, Zhou H Z et al., 2004. Soil carbon stocks and their influencing factors under native vegetations in China.Acta Pedologica Sinica, 41(5): 687-699. (in Chinese)

[55]
Xie Z B, Zhu J G, Liu G et al., 2007. Soil organic carbon stocks in China and changes from 1980s to 2000s.Global Change Biology, 13(9): 1989-2007.The estimation of the size and changes of soil organic carbon (SOC) stocks is of great importance for decision makers to adopt proper measures to protect soils and to develop strategies for mitigation of greenhouse gases. In this paper, soil data from the Second State Soil Survey of China (SSSSC) conducted in the early 1980s and data published in the last 5 years were used to estimate the size of SOC stocks over the whole profile and their changes in China in last 20 years. Soils were identified as paddy, upland, forest, grassland or waste-land soils and an improved soil bulk density estimation method was used to estimate missing bulk density data. In the early 1980s, total SOC stocks were estimated at 89.61 Pg (1 Pg=10 3 Tg=10 15 g) in China's 870.94 Mha terrestrial areas covered by 2473 soil series. In the paddy, upland, forest and grassland soils the respective total SOC stocks were 2.91 Pg on 29.87 Mha, 10.07 Pg on 125.89 Mha, 34.23 Pg on 249.32 Mha and 37.71 Pg on 278.51 Mha, respectively. The SOC density of the surface layer ranged from 3.5 Mg ha 611 in Gray Desery grassland soils to 252.6 Mg ha 611 in Mountain Meadow forest soils. The average area-weighted total SOC density in paddy soils (97.6 Mg ha 611 ) was higher than that in upland soils (80 Mg ha 611 ). Soils under forest (137.3 Mg ha 611 ) had a similar average area-weighted total SOC density as those under grassland (135.4 Mg ha 611 ). The annual estimated SOC accumulation rates in farmland and forest soils in the last 20 years were 23.61 and 11.72 Tg, respectively, leading to increases of 0.472 and 0.234 Pg SOC in farmland and forest areas, respectively. In contrast, SOC under grassland declined by 3.56 Pg due to the grassland degradation over this period. The resulting estimated net SOC loss in China's soils over the last 20 years was 2.86 Pg. The documented SOC accumulation in farmland and forest soils could thus not compensate for the loss of SOC in grassland soils in the last 20 years. There were, however, large regional differences: Soils in China's South and Eastern parts acted mainly as C sinks, increasing their average topsoil SOC by 132 and 145 Tg, respectively. In contrast, in the Northwest, Northeast, Inner Mongolia and Tibet significant losses of 1.38, 0.21, 0.49 and 1.01 Pg of SOC, respectively, were estimated over the last 20 years. These results highlight the importance to take measures to protect grassland and to improve management practices to increase C sequestration in farmland and forest soils.

DOI

[56]
Xin X P, Zhang B H, Li G et al., 2009. Variation in spatial pattern of grassland biomass in China from 1982 to 2003.Journal of Natural Resources, 24(9): 1582-1592. (in Chinese)In this paper,we used a simple regulated model to explore long term trends in China's grassland biomass and its spatial and temporal pattern,using a time series data set for the Normalized Difference Vegetation Index(NDVI) for maximum growth season(July 15th to August 15th) from 1982 to 2003,together with ground truth biomass data during 1991-1994 and 2002-2003 and historical climate data.We found that grassland biomass increased in the mid 1980s and began to decrease after 1990.The country's grassland biomass decreased by 3.07% from 1988 to 1998,and that of tropical herbosa,temperate meadow steppe,temperate Montana meadow and lowland meadow decreased separately by 10.86%,4.96%,4.86% and 3.49%,respectively.Grassland biomass increased to the same level as the 1980's after 2000's except in the Loess Plateau and southern China.Annual precipitation decreased 23.3% and temperature increased 0.6-1.5 from 1982 to 2003 in grassland area of China.The grassland biomass showed low correlation with precipitation(correlation coefficient equaled to 0.29) and no correlation with temperature.Grassland biomass in the Inner-Mongolia Plateau,southeastern Tibetan Plateau and mountainous area in central northern Xinjiang showed significant fluctuation.

DOI

[57]
Xu L, He N P, Yu G R et al., 2015. Differences in pedotransfer functions of bulk density lead to high uncertainty in soil organic carbon estimation at regional scales: Evidence from Chinese terrestrial ecosystems.Journal of Geophysical Research: Biogeosciences, 120(8): 1567-1575.Abstract Accurate estimation of soil organic carbon (SOC) storage is important for evaluating carbon sequestration of terrestrial ecosystems at regional scale. How the selected pedotransfer functions (PTFs) of bulk density (BD) influence the estimates of SOC storage is still unclear at large scales, although BD is an important parameter in all equations. Here we used data from the second national soil survey in China (8210 soil profiles) to evaluate the influence of eight selected PTFs on the estimation of SOC storage. The results showed that different PTFs may result in a higher uncertainty of SOC storage estimation and the coefficient of variation (CV, %) for the eight PTFs varied from 10.61% to 70.46% (mean65=6512.75%). The observed CV values were higher in the 0–2065cm layer (12.48%) than in the 20–10065cm layer (10.05%). CV values were relatively stable (10–15%) when SOC content ranged from 0.13% to 3.45%. The findings indicate that PTFs may be used cautiously in soils with higher or lower SOC content. Estimates of SOC storage in the 0–10065cm soil layer varied from 67.19 to 95.9765Pg65C in the eight PTFs in China, with an average of 87.3665±658.9365Pg65C (CV65=6510.23%). Our findings provide the insight that differences in PTFs are important sources of uncertainty in SOC estimates. The development of better PFTs, or the integration of various PFTs, is essential to accurately estimate SOC storage at regional scales.

DOI

[58]
Xu L, Yu G R, He N P et al., 2018. Carbon storage in China’s terrestrial ecosystems: A synthesis. Scientific Reports, 8: srep2806. doi:10.1038/s41598-018-20764-9.It is important to accurately estimate terrestrial ecosystem carbon (C) storage. However, the spatial patterns of C storage and the driving factors remain unclear, owing to lack of data. Here, we collected data from literature published between 2004 and 2014 on C storage in China’s terrestrial ecosystems, to explore variation in C storage across different ecosystems and evaluate factors that influence them. We estimated that total C storage was 99.1565±658.71 PgC, with 14.6065±653.24 PgC in vegetation C (Veg-C) and 84.5565±658.09 PgC in soil organic C (SOC) storage. Furthermore, C storage in forest, grassland, wetland, shrub, and cropland ecosystems (excluding vegetation) was 34.0865±655.43, 25.6965±654.71, 3.6265±650.80, 7.4265±651.92, and 15.1765±652.20 PgC, respectively. In addition to soil nutrients and texture, climate was the main factor regulating the spatial patterns of C storage. Climate influenced the spatial patterns of Veg-C and SOC density via different approaches, Veg-C was mainly positively influenced by mean annual precipitation (MAP), whereas SOC was negatively dependent on mean annual temperature (MAT). This systematic estimate of C storage in China provides new insights about how climate constrains C sequestration, demonstrating the contrasting effects of MAP and MAT on Veg-C and SOC; thus, these parameters should be incorporated into future land management and C sequestration strategies.

DOI

[59]
Xu X L, Cao M K, Li K R, 2007. Temporal-spatial dynamics of carbon storage of forest vegetation in China.Progress in Geography, 26(6): 1-10. (in Chinese)

[60]
Yang H F, Mu S J, Li J L, 2014a. Effects of ecological restoration projects on land use and land cover change and its influences on territorial NPP in Xinjiang, China.Catena, 115: 85-95.61We evaluated the LUCC caused by vegetation restoration programs.61The most dominant land cover changes during 2001–2009 were from grassland to forest.61The most obvious increase of total NPP was observed in forest.61Human activities produced an obvious positive effect in the increase of total NPP.61We explored the influences of LUCC and climate change on regional NPP.

DOI

[61]
Yang Y H, Fang J Y, Ma W H et al., 2010. Soil carbon stock and its changes in northern China’s grasslands from 1980s to 2000s.Global Change Biology, 16(11): 3036-3047.Climate warming is likely to accelerate the decomposition of soil organic carbon (SOC) which may lead to an increase of carbon release from soils, and thus provide a positive feedback to climate change. However, SOC dynamics in grassland ecosystems over the past two decades remains controversial. In this study, we estimated the magnitude of SOC stock in northern China's grasslands using 981 soil profiles surveyed from 327 sites across the northern part of the country during 2001–2005. We also examined the changes of SOC stock by comparing current measurements with historical records of 275 soil profiles derived from China's National Soil Inventory during the 1980s. Our results showed that, SOC stock in the upper 30 cm in northern China's grasslands was estimated to be 10.5 Pg C (1 Pg=1015 g), with an average density (carbon stock per area) of 5.3 kg C m612. SOC density (SOCD) did not show significant association with mean annual temperature, but was positively correlated with mean annual precipitation. SOCD increased with soil moisture and reached a plateau when soil moisture was above 30%. Site-level comparison indicated that grassland SOC stock did not change significantly over the past two decades, with a change of 0.08 kg C m612, ranging from 610.30 to 0.46 kg C m612 at 95% confidence interval. Transect-scale comparison confirmed that grassland SOC stock remained relatively constant from 1980s to 2000s, suggesting that soils in northern China's grasslands have been carbon neutral over the last 20 years.

DOI

[62]
Yang Y H, Li P, Ding J Z et al., 2014b. Increased topsoil carbon stock across China’s forests.Global Change Biology, 20(8): 2687-2696.AbstractBiomass carbon accumulation in forest ecosystems is a widespread phenomenon at both regional and global scales. However, as coupled carbon–climate models predicted, a positive feedback could be triggered if accelerated soil carbon decomposition offsets enhanced vegetation growth under a warming climate. It is thus crucial to reveal whether and how soil carbon stock in forest ecosystems has changed over recent decades. However, large-scale changes in soil carbon stock across forest ecosystems have not yet been carefully examined at both regional and global scales, which have been widely perceived as a big bottleneck in untangling carbon–climate feedback. Using newly developed database and sophisticated data mining approach, here we evaluated temporal changes in topsoil carbon stock across major forest ecosystem in China and analysed potential drivers in soil carbon dynamics over broad geographical scale. Our results indicated that topsoil carbon stock increased significantly within all of five major forest types during the period of 1980s–2000s, with an overall rate of 20.002g C02m61202yr611 (95% confidence interval, 14.1–25.5). The magnitude of soil carbon accumulation across coniferous forests and coniferous/broadleaved mixed forests exhibited meaningful increases with both mean annual temperature and precipitation. Moreover, soil carbon dynamics across these forest ecosystems were positively associated with clay content, with a larger amount of SOC accumulation occurring in fine-textured soils. In contrast, changes in soil carbon stock across broadleaved forests were insensitive to either climatic or edaphic variables. Overall, these results suggest that soil carbon accumulation does not counteract vegetation carbon sequestration across China's forest ecosystems. The combination of soil carbon accumulation and vegetation carbon sequestration triggers a negative feedback to climate warming, rather than a positive feedback predicted by coupled carbon–climate models.

DOI PMID

[63]
Yang Y H, Li W H, Zhu C G et al., 2017. Impact of land use/cover changes on carbon storage in a river valley in arid areas of Northwest China.Journal of Arid Land, 9(6): 879-887.Soil carbon pools could become a CO_2 source or sink, depending on the directions of land use/cover changes. A slight change of soil carbon will inevitably affect the atmospheric CO_2 concentration and consequently the climate. Based on the data from 127 soil sample sites, 48 vegetation survey plots, and Landsat TM images, we analyzed the land use/cover changes, estimated soil organic carbon(SOC) storage and vegetation carbon storage of grassland, and discussed the impact of grassland changes on carbon storage during 2000 to 2013 in the Ili River Valley of Northwest China. The results indicate that the areal extents of forestland, shrubland, moderate-coverage grassland(MCG), and the waterbody(including glaciers) decreased while the areal extents of high-coverage grassland(HCG),low-coverage grassland(LCG), residential and industrial land, and cultivated land increased. The grassland SOC density in 0–100 cm depth varied with the coverage in a descending order of HCG>MCG>LCG.The regional grassland SOC storage in the depth of 0–100 cm in 2013 increased by 0.25×10¹¹ kg compared with that in 2000. The regional vegetation carbon storage(S_(rvc)) of grassland was 5.27×10~9 kg in2013 and decreased by 15.7% compared to that in 2000. The vegetation carbon reserves of the under-ground parts of vegetation(S_(ruvb)) in 2013 was 0.68×10~9 kg and increased by approximately 19.01%compared to that in 2000. This research can improve our understanding about the impact of land use/cover changes on the carbon storage in arid areas of Northwest China.

[64]
Yang Y H, Mohammat A, Feng J M et al., 2007. Storage, patterns and environmental controls of soil organic carbon in China.Biogeochemistry, 84(2): 131-141.Based on the data from China's second national soil survey and field observations in northwest China, we estimated soil organic carbon (SOC) storage in China and investigated its spatial and vertical distribution. China's SOC storage in a depth of 1 meter was estimated as 69.1 Pg (100167 g), with an average density of 7.8 kg m6305. About 48% of the storage was concentrated in the top 30 cm. The SOC density decreased from the southeast to the northwest, and increased from arid to semi-humid zone in northern China and from tropical to cold-temperate zone in the eastern part of the country. The vertical distribution of SOC differed in various climatic zones and biomes; SOC distributed deeper in arid climate and water-limited biomes than in humid climate. An analysis of general linear model suggested that climate, vegetation, and soil texture significantly influenced spatial pattern of SOC, explaining 78.2% of the total variance, and that climate and vegetation interpreted 78.9% of the total variance in the vertical SOC distribution.

DOI

[65]
Yu D S, Shi X Z, Wang H J et al., 2007. National scale analysis of soil organic carbon storage in China based on Chinese soil taxonomy.Pedosphere, 17(1): 11-18.Patterns of soil organic carbon (SOC) storage and density in various soil types or locations are the foundation for examining the role of soil in the global carbon cycle. An assessment of SOC storage and density patterns in China based on soil types as defined by Chinese Soil Taxonomy (CST) and the recently compiled digital 1:1000000 Soil Database of China was conducted to generate a rigorous database for the future study of SOC storage. First, SOC densities of 7292 soil profiles were calculated and linked by soil type to polygons of a digital soil map using geographic information system resulting in a 1:1000000 SOC density distribution map of China. Further results showed that soils in China covered 9281 10 3 km 2 with a total SOC storage of 89.14 Gt and a mean SOC density 96.0 t ha 1. Among the 14 CST orders, Cambosols and Argosols constituted high percentage of China's total SOC storage, while Andosols, Vertosols, and Spodsols had a low percentage. As for SOC density, Histosols were the highest, while Primosols were the lowest. Specific patterns of SOC storage of various soil types at the CST suborder, group, and subgroup levels were also described. Results obtained from the study of SOC storage and density of all CST soil types would be not only useful for international comparative research, but also for more accurately estimating and monitoring of changes of SOC storage in China.

DOI

[66]
Yu G R, Li X R, Wang Q F et al., 2010. Carbon storage and its spatial pattern of terrestrial ecosystem in China.Journal of Resources and Ecology, 1(2): 97-109.Process mechanisms of carbon storage and carbon cycle in earth system are the scientific foundation for analyzing the cause of climate change, forecasting the climate change trend, and making mitigation and adaptation countermeasures, which have attracted great attention from the scientific community and international community. Since the late 1980s, Chinese scientists have carried out a great deal of research on the terrestrial ecosystem carbon cycle, and have made great progress in many fields. In this paper, we review the history of the research on the terrestrial carbon cycle in China, summarize the results of the carbon storage in terrestrial ecosystems and its spatial patterns, evaluate the uncertainties of the research, and put forward important scientific issues which are needed to be addressed urgently. Overall, the research on the carbon cycle of terrestrial ecosystems in China consists of four stages of development, i.e., the early carbon cycle research, the comprehensive study on the carbon cycle at regional scale, the experimental research on the adaptation of ecosystem carbon cycle to climate change, and the coupling cycles of C-N-H2O and the regional regulation and control. Most studies indicate that carbon storage of terrestrial ecosystems in China and its spatial pattern are controlled by temperature and precipitation. About 97.95 118.93 Pg carbon is stored in soil, forest and grassland in China. Since the mid 1970s, many management measures such as afforestation and forest management, grassland protection, farming system reformation and conservation tillage, have played important roles in carbon sequestration. However, large uncertainty exists among the evaluation results with various methods. In the future we should focus on the integrated monitoring system of the dynamics of carbon storage and carbon sink, foresight studies on the coupling cycles of ecosystem C-N-H2O and its regional regulation and control, quantitative assessment on the carbon budget and the potential of carbon sink of ecosystems in China, the evaluation of the economic benefit of various technologies for increasing carbon sink of typical ecosystems, and the measurable, reportable and verifiable scientific data and technical supports for establishing the policy framework of greenhouse gas management and carbon trading at national scale.

DOI

[67]
Zheng Y, Niu Z, Gong P et al., 2013. Preliminary estimation of the organic carbon pool in China’s wetlands.Chinese Science Bulletin, 58(6): 662-670. (in Chinese)Accurate estimation of wetland carbon pools is a prerequisite for wetland resource conservation and implementation of carbon sink enhancement plans. The inventory approach is a realistic method for estimating the organic carbon pool in China's wetlands at the national scale. An updated data and inventory approach were used to estimate the amount of organic carbon stored in China's wetlands. Primary results are as follows: (1) the organic carbon pool of China's wetlands is between 5.39 and 7.25 Pg, accounting for 1.3%-3.5% of the global level; (2) the estimated values and percentages of the organic carbon contained in the soil, water and vegetation pools in China's wetlands are 5.04-6.19 Pg and 85.4%-93.5%, 0.22-0.56 Pg and 4.1%-7.7%, 0.13-0.50 Pg and 2.4%-6.9%, respectively. The soil organic carbon pool of China's wetlands is greater than our previous estimate of 3.67 Pg, but is lower than other previous estimates of 12.20 and 8-10 Pg. Based on the discussion and uncertainty analysis, some research areas worthy of future attention are presented.

DOI

[68]
Zhou G Y, Liu S G, Li Z et al., 2006. Old-growth forests can accumulate carbon in soils.Science, 314(5804): 1417-1417.Abstract Old-growth forests have traditionally been considered negligible as carbon sinks because carbon uptake has been thought to be balanced by respiration. We show that the top 20-centimeter soil layer in preserved old-growth forests in southern China accumulated atmospheric carbon at an unexpectedly high average rate of 0.61 megagrams of carbon hectare-1 year-1 from 1979 to 2003. This study suggests that the carbon cycle processes in the belowground system of these forests are changing in response to the changing environment. The result directly challenges the prevailing belief in ecosystem ecology regarding carbon budget in old-growth forests and supports the establishment of a new, nonequilibrium conceptual framework to study soil carbon dynamics.

DOI PMID

[69]
Zhou Y R, Yu Z L, Zhao S D, 2000. Carbon storage and budget of major Chinese forest types.Acta Phytoeclolgica Sinica, 24(5): 518-522. (in Chinese)

Outlines

/