Research Articles

Tracking climate change in Central Asia through temperature and precipitation extremes

  • ZHANG Man , 1, 2 ,
  • CHEN Yaning , 2, * ,
  • SHEN Yanjun 3 ,
  • LI Baofu 4
Expand
  • 1. College of Resources and Environmental Science, Hebei Normal University, Shijiazhuang 050024, China
  • 2. State Key Laboratory of Desert and Oasis Ecology, Xinjiang Institute of Ecology and Geography, CAS, Urumqi 830011, China
  • 3. Key Laboratory of Agricultural Water Resources, Center for Agricultural Resources Research, CAS, Shijiazhuang 050021, China
  • 4. College of Geography and Tourism, Qufu Normal University, Rizhao 276826, Shandong, China
*Corresponding author: Chen Yaning, PhD and Professor, specialized in water resources and ecological hydrological processes in arid areas. E-mail:

Author: Zhang Man, PhD, specialized in extreme climate events in arid areas. E-mail:

Received date: 2018-02-07

  Accepted date: 2018-05-30

  Online published: 2019-01-25

Supported by

National Natural Science Foundation of China, No.41630859

The CAS “Light of West China” Program, No.2015-XBQN-B-17

Copyright

Journal of Geographical Sciences, All Rights Reserved

Abstract

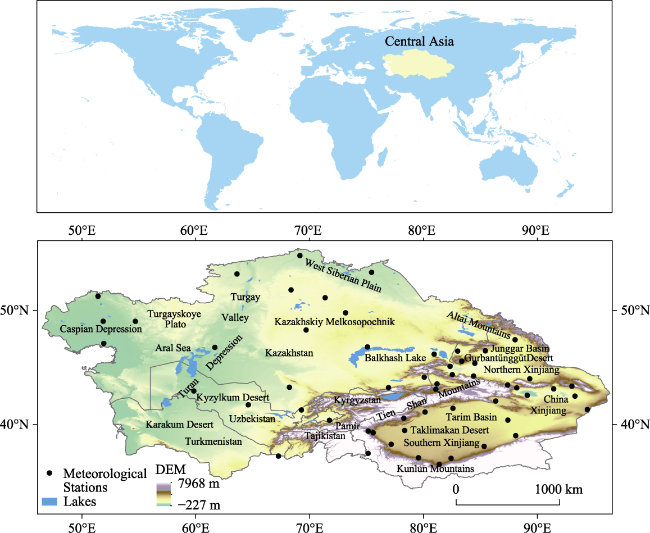
Under the impacts of climate change and human activities, great uncertainties still exist in the response of climate extremes, especially in Central Asia (CA). In this study, we investigated spatial-temporal variation trends and abrupt changes in 17 indices of climate extremes, based on daily climate observations from 55 meteorological stations in CA during 1957-2005. We also speculated as to which atmospheric circulation factors had the greatest impacts on climate extremes. Our results indicated that the annual mean temperature (Tav), mean maximum and minimum temperature significantly increased at a rate of 0.32ºC/10a, 0.24ºC/10a and 0.41ºC/10a, respectively, which was far higher than the increasing rates either globally or across the Northern Hemisphere. Other temperature extremes showed widespread significant warming trends, especially for those indices derived from daily minimum temperature. All temperature extremes exhibited spatially widespread rising trends. Compared to temperature changes, precipitation extremes showed higher spatial and temporal variabilities. The annual total precipitation significantly increased at a rate of 4.76 mm/10a, and all precipitation extremes showed rising trends except for annual maximum consecutive dry days (CDD), which significantly decreased at a rate of -3.17 days/10a. On the whole, precipitation extremes experienced slight wetter trends in the Tianshan Mountains, Kazakhskiy Melkosopochnik (Hill), the Kyzylkum Desert and most of Xinjiang. The results of Cumulative Deviation showed that Tav and Txav had a significant abrupt change around 1987, and all precipitation indices experienced abrupt changes in 1986. Spearman’s correlation analysis pointed to Siberian High and Tibetan Plateau Index_B as possibly being the most important atmospheric circulation factors affecting climate extremes in CA. A full quantitative understanding of these changes is crucial for the management and mitigation of natural hazards in this region.

Cite this article

ZHANG Man , CHEN Yaning , SHEN Yanjun , LI Baofu . Tracking climate change in Central Asia through temperature and precipitation extremes[J]. Journal of Geographical Sciences, 2019 , 29(1) : 3 -28 . DOI: 10.1007/s11442-019-1581-6

1 Introduction

Extreme climate events (ECEs) such as droughts, floods, frosts and heat waves can have devastating impacts on natural ecosystems. They can also have a severe impact on social life and economic development, and have thus received heightened attention recently from researchers (Karl and Easterling, 1999; Easterling et al., 2000; Trenberth et al., 2015; Alexander et al., 2016; Diffenbaugh et al., 2017). The latest findings reveal that ECEs have increased both in frequency and intensity over the past few decades, more or less in tangent with human-induced climate change (Alexander et al., 2006; IPCC, 2012; IPCC, 2013; Zhang et al., 2013; Westra et al., 2013; Kim et al., 2016; Stott, 2016). However, there remains some uncertainty as to the response of ECEs, especially in arid regions like Central Asia (CA) (Lioubimtseva and Henebry, 2009; Herold et al., 2017). A better understanding of climate extremes is required if ECEs are to be appropriately researched.
CA is of exceptional interest to scientists from the perspective of meteorology and hydrology. Being one of the driest regions in the world, CA is not only more sensitive to climate change, but also shrouded in uncertainty with regards to the region’s natural response to changing climate (Lioubimtseva et al., 2005; Li et al., 2015b; Zhang et al., 2017). The poor continuity of station-based daily meteorological observations in CA’s five countries has resulted in a lack of research on ECEs and climate extremes. Other studies have utilized data from grids, soil, and tree rings (Klein Tank et al., 2006; Schiemann et al., 2008; Chen et al., 2009; Lioubimtseva and Henebry, 2009; Yatagai et al., 2012; Li et al., 2015b), but these data tend either to underestimate or overestimate the frequency and intensity of ECEs (King et al., 2013; Mannig et al., 2013; Hu et al., 2016). Furthermore, as one of the core areas of China’s ‘Belt and Road’ Initiative (Silk Road Economic Belt and 21st-Century Maritime Silk Road, first introduced by the Chinese government in 2013), CA has received increasing interest from the international scientific community, with many research projects focusing on the environmental and ecological variations in the region (Li et al., 2015a; Chen et al., 2016; Howard and Howard, 2016; Li et al., 2016b; Frachetti et al., 2017; Li et al., 2017). Despite the notable uptick in attention, however, information about variation trends of climate extremes or about their possible influencing factors and effects on ecological and social systems remains scarce.
To fill this gap, some researchers have begun looking into the impact of ECEs variations, especially in relation to anthropogenic forcing (Zhang et al., 2013; Kim et al., 2016; Stott, 2016; Stott et al., 2016; Chen and Sun, 2017; Diffenbaugh et al., 2017). At the same time, investigations also need to consider the influence of atmospheric circulations and other natural factors on climate extremes. Recent studies by Chen et al. (2008) and Bothe et al. (2012) revealed that precipitation in CA was mainly affected by the strength of the westerly jet stream, while Wei et al. (2017) demonstrated that changes to out-of-phase rainfall among the five countries in CA and northern China were closely related to the southeast-northwest movements of the South Asian High and the Asian westerly jet stream in 1958-2002. Furthermore, Cheng et al. (2016) found that the millennial-scale climate events occurring in CA (from the Tonnel’naya cave, Uzbekistan and the Kesang cave, western China) were closely coupled with the Asian monsoon and westerly jet stream. Additionally, Zhang et al. (2002) showed the influence of East-Asian monsoons on drought in northwest China; Li et al. (2012) noted that the weakening of the Siberian High was a crucial reason for rapid temperature increase in northwestern China from the 1980s to the 1990s; Chen et al. (2014) found that climate extremes had strong and significant relationships with the Tibetan Plateau Index_B (TPI_B) in northwestern China in 1961-2010; and Li et al. (2016a), in continuing the research on the relationships between precipitation and atmospheric circulations, suggested that the West Pacific Subtropical High and the North American Subtropical High were probably the main cause for precipitation variations in northwestern China after the mid-1980s.
Despite their many contributions to the field, these studies have limitations. For instance, some of them focused only on detecting associations between the mean temperature or mean precipitation and atmospheric circulations, without looking at possible associations between climate extremes and atmospheric circulations. Moreover, they studied regional areas within CA, such as only the five countries of CA or northwestern China, but did not investigate CA as a whole. Therefore, in this paper, we use station-based daily climate observations over the course of 49 years (1957-2005) to study spatial-temporal variation trends and abrupt changes in climate extremes in CA. Given that large-scale atmospheric circulation generally determines temperature and precipitation trends (Trenberth et al., 2015; Li et al., 2016a), we tried instead to detect factors impacting atmospheric circulation, which then influence climate extremes in CA.
As water vapour in CA can originate from northern Eurasia, the western Atlantic, the Arctic Ocean, the eastern Pacific Ocean and the southern Indian Ocean, we selected ten relevant atmospheric circulations for our study, namely the Antarctic Oscillation (AAO), Arctic Oscillation (AO), North Atlantic Oscillation (NAO), Northern Oscillation Index (NOI), Pacific Decadal Oscillation (PDO), Pacific-North American pattern (PNA), Siberian High (SH), Southern Oscillation (SO), Tibetan Plateau Index_B (TPI_B), and Westerly Circulation Index (WCI). As well, we investigated the statistical relationships between 17 extreme climate indices (ECIs) and the 10 chosen atmospheric circulations. The findings on climate extremes under the context of climate change will be of great importance for ecological protection and regional economic development in CA.

2 Study area, data, and methodology

2.1 Study area

In this study, CA refers to the vast area (5.65 million km2) generally confined to 45°-96°E and 35°-55°N, covering five Russian-speaking countries (Kazakhstan, Kyrgyzstan, Tajikistan, Turkmenistan and Uzbekistan) and the Xinjiang Uygur Autonomous Region of China (Xinjiang) (Figure 1). The geomorphological landscapes of the five countries in CA are mainly desert and grasslands, and include the Kyzylkum Desert, the Karakum Desert, etc. Meanwhile, the geomorphology in Xinjiang is characterized by a basin-and-range pattern. The Altai Mountains, Tianshan Mountains, and Kunlun Mountains are located in the northern, middle, and southern parts of the region, respectively, with the Junggar Basin and Tarim Basin positioned between these mountains. The Taklimakan Desert, which is the world’s second largest mobile desert, is located in the Tarim Basin. The Tianshan Mountains, known as the ‘water tower of Central Asia’, feature one of the highest concentrations of glaciers globally. These glaciers provide the main water source for people living in the region (Aizen et al., 2006; Pritchard, 2017).
Figure 1 Location of Central Asia and the meteorological stations
As one of the world’s most arid areas, CA has a typical temperate continental climate characterized by sharp temperature differences, intensive evaporation, and dry and rainless environments (Lioubimtseva and Henebry, 2009; Li et al., 2015b). The climatic characteristics of CA are determined by location and topography. Since it is located in the hinterland of Eurasia, a long distance away from any sea or ocean, very little moisture reaches this region. This is the main reason for the dry climate. Precipitation is concentrated in spring and winter, due to the influence of the westerly jet stream and the North Atlantic Oscillation. The western and northwestern plains of CA are primarily influenced by moist westerly Atlantic air masses and cold northerly and north-westerly inflows, while the Himalayas, Tibetan Plateau and Pamirs form a natural barrier to the south, cutting off CA from most of the water vapor from the Indian Ocean (Schiemann et al., 2008; Bothe et al., 2012). In the Xinjiang region, northern Xinjiang is primarily affected by water vapor from the Atlantic and Arctic Oceans, but southern Xinjiang receives little moisture from the Indian Ocean, with the Tianshan Mountains and Tibetan Plateau acting as barriers. Due to the location and water shortage, CA has an extremely fragile natural environment and ecological system, which is extremely sensitive to climate change (Lioubimtseva and Henebry, 2009). All these in turn lead to the increases in the frequency and intensity of extreme climate events and the rises in the natural disaster risks.

2.2 Data and quality control

Taking into consideration the unique climate characteristics of CA, we selected for our study 10 extreme temperature indices (Tav, Txav, Tnav, FD0, ID0, SU25, TXx, TXn, TNx, TNn) and 7 extreme precipitation indices (Prcptot, CDD, CWD, R10mm, R20mm, Rx1 day, Rx5 day) (Table 1) from 27 ECIs introduced by the CCl/CLIVAR/JCOMM Expert Team on Climate Change Detection and Indices (ETCCDI) (http://etccdi.pacificclimate.org/list_27_ indices.shtml).
Table 1 Definitions of 17 extreme climate indices chosen for this study
Index Indicator name Definitions Units
Tav Mean Tmean Annual mean temperature ºC
Txav Mean Tmax Annual average daily maximum temp ºC
Tnav Mean Tmin Annual average daily minimum temp ºC
FD0 Frost days Annual count when TN (daily minimum) < 0ºC days
ID0 Ice days Annual count when TX (daily maximum) < 0ºC days
SU25 Summer days Annual count when TX (daily maximum) > 25ºC days
TXx Max Tmax Monthly maximum value of daily maximum temp ºC
TNx Max Tmin Monthly maximum value of daily minimum temp ºC
TXn Min Tmax Monthly minimum value of daily maximum temp ºC
TNn Min Tmin Monthly minimum value of daily minimum temp ºC
Prcptot Annual total wet-day precipitation Annual total precipitation in wet days (RR ≥1mm) mm
CDD Consecutive dry days Annual maximum number of consecutive days with RR <1 mm days
CWD Consecutive wet days Annual maximum number of consecutive days with RR ≥1 mm days
R10mm Number of heavy precipitation days Annual count of days when RR ≥10 mm days
R20mm Number of very heavy precipitation days Annual count of days when RR ≥20 mm days
Rx1 day Max 1-day precipitation amount Monthly maximum 1-day precipitation mm
Rx5 day Max 5-day precipitation amount Monthly maximum consecutive 5-day precipitation mm

Detail definitions of extreme climate indices can be checked on the ETCCDMI website: http://etccdi.pacificclimate. org/list_27_indices.shtml. All indices are calculated by R ClimDex. Temp denotes temperature. RR represents daily precipitation.

Continuous station-based temperature and precipitation data can greatly improve the research accuracy of climate extremes. Courtesy of the National Oceanic and Atmospheric Administration (NOAA), we downloaded the daily temperature and precipitation records of 568 meteorological stations in the five CA countries (Menne et al., 2012). These records are original datasets and have not undergone quality control. As well, daily observation datasets from 68 meteorological stations in Xinjiang were collected from the China Meteorological Data Service Center (CMDC), but these datasets had undergone the strict quality control and inspection procedures of the CMDC. Additionally, we obtained data from 10 circulation indices (AAO, AO, NAO, NOI, PDO, PNA, SH, SOI, TPI_B, WCI_DJF) (WCI_DJF denotes WCI in December, January and February) from China’s National Climate Center (http://cmdp.ncc.cma.gov.cn/cn/download.htm), and the Earth System Research Laboratory (ESRL) (https://www.esrl.noaa.gov/psd/data/climateindices/list/).
To carry out data quality control on the raw datasets, we used the R ClimDex software package (R ClimDex) (http://etccdi.pacificclimate.org/software.shtml) (Zhang and Feng, 2004), which performed error-detection on these data, such as days with Tmax<Tmin or daily precipitation below 0 mm, and searched for outliers. We chose five standard deviations as thresholds to avoid mistaking the real value as outliers and to obtain better data quality. The datasets from stations that were missing more than 5% of relevant data were discarded. Overall, across the five CA countries, only 22 meteorological stations were suitable for use in this study due to numerous gaps, whereas in Xinjiang, 33 meteorological stations were suitable (Figure 1). Thus, based on a grand total of 55 meteorological stations, we investigated 17 ECIs during 1957-2005 through R ClimDex.

2.3 Method

We used the arithmetic mean values of each ECI from the 55 stations during 1957-2005 as the representative value of CA to reflect the temporal variations of climate extremes in this study (Liu et al., 2014). Regional annual anomaly series and linear regression were conducted to reflect the extent of temporal variations for ECIs.
As the Mann-Kendall non-parametric trend test (MK test) (Mann, 1945; Kendall, 1975) does not need to follow a certain sample distribution and is not affected by the interference of a few outliers, it has been widely used in the research fields of meteorological and hydrological time series variation. In this study, we conducted MK tests based on the values of each ECI to detect the temporal variation trends and significant levels for all stations across CA. Twenty-year overlapping time windows (Zhang et al., 2017) were also utilized to analyze the temporal changing trends of 17 extreme indices in the region during 1957-2005 (for a total of 30 windows in 49 years). Furthermore, we applied Cumulative Deviation (Buishand, 1982) to detect abrupt changes in ECIs based on the mean values of the whole region, after which the Student's t test (Dugmore et al., 2007) was conducted to analyze the mean level of ECIs at the two stages within the time before and time after the abrupt changes. Finally, we employed Spearman’s correlation analysis (Nunes and Lourenço, 2015), which is a non-parametric test, to investigate the statistical relationships between the 17 ECIs and 10 atmospheric circulations.

3 Analysis and results

3.1 Variation trends and abrupt changes in temperature extremes

3.1.1 Temporal patterns of Tav, Txav and Tnav
The Tav, Txav and Tnav indices are useful for reflecting the variation trends of the mean, maximum and minimum temperatures, respectively. On the whole, the Tav, Txav and Tnav indices during 1957-2005 for CA all showed a significant increasing trend, with Tnav exhibiting larger increases than Tav or Txav (Table 2, Figures 2e-2g and 3a-3c). The MK test results revealed that Tav, Txav and Tnav significantly increased (p<0.01) at rates of 0.032ºC/a, 0.024ºC/a and 0.041ºC/a, respectively. The increase in Tav, Txav and Tnav points to a notable warming trend in CA, which is consistent with widespread global warming during the same time period.
Table 2 Temporal variation trends of extreme temperature indices based on MK test during 1957-2005 in CA
Index MK test Percentage of stations
showing increasing trend
Percentage of stations showing
significant increasing trend
Percentage of stations
showing decreasing trend
Percentage of stations
showing significant decreasing trend
Trend rate Z-value Trends Significance
level (p)
Tav 0.032ºC/a 4.89 0.01 98.18% 94.55% 1.82% 0
Txav 0.024ºC/a 3.39 0.01 100% 70.91% 0 0
Tnav 0.041ºC/a 5.78 0.01 98.18% 94.55% 1.82% 1.82%
FD0 -0.323 days/a -4.71 0.01 3.64% 0 96.36% 80.00%
ID0 -0.187 days/a -2.31 0.05 3.64% 0 96.36% 25.45%
SU25 0.206 days/a 3.18 0.01 96.36% 45.45% 3.64% 1.82%
TXx 0.020ºC/a 2.67 0.01 81.82% 29.09% 18.18% 1.82%
TNx 0.030ºC/a 5.14 0.01 87.27% 58.18% 12.73% 1.82%
TXn 0.059ºC/a 2.38 0.05 96.36% 34.55% 3.64% 0
TNn 0.088ºC/a 3.86 0.01 100% 70.91% 0 0

The positive value denotes an increasing trend and negative value represents a decreasing trend.

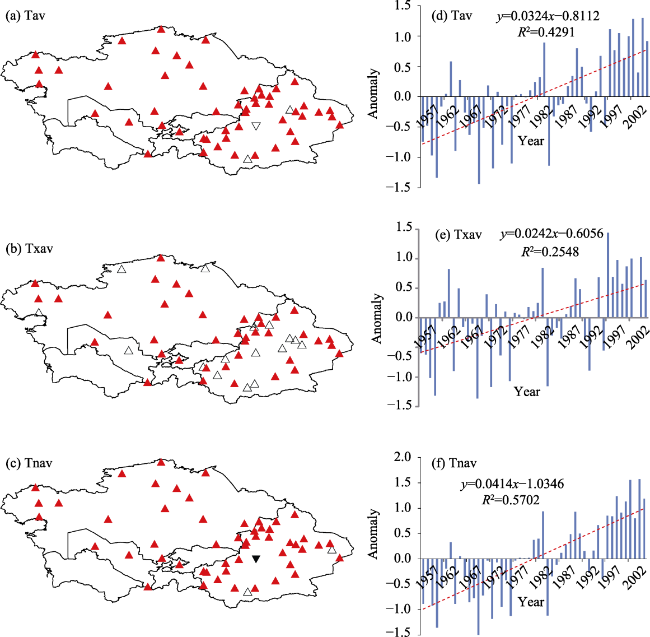
Figure 2 Spatial-temporal variation trends of the extreme temperature indices of Tav, Txav and Tnav during 1957-2005 in Central Asia. (a)-(c): Spatial variation trends of (a) Tav, (b) Txav and (c) Tnav (The red filled triangle denotes significant rising trend (P<0.05); the unfilled triangle denotes rising trend but not significant; the black filled inverted-triangle denotes significant falling trend (P<0.05); the unfilled inverted-triangle denotes falling trend but not significant). (d)-(f): Regional annual anomaly series of (d) Tav, (e) Txav and (f) Tnav (The blue column denotes the annual anomaly series and the red dash line represents the linear regression)
Figure 3 Temporal variation trends of extreme temperature indices during 1957-2005 in CA. (a) Tav, (b) Txav, (c) Tnav, (d) TXx, (e) TNx, (f) SU25, (g) FD0, (h) ID0, (i) TXn and (j) TNn. Red dotted line denotes the mean value of each extreme temperature index before and after abrupt change; Black and blue solid lines represent time series variations and 20-year overlapping averages for each precipitation indices, respectively.
Both Tav and Txav experienced a significant abrupt change around 1987 (Table 3). The mean values of Tav and Txav were 9.09ºC/a and 15.31ºC/a in 1987-2005, respectively, up 18.18% and 4.22% over 1957-1986. Tnav, however, experienced a significant abrupt change around 1977, resulting in a mean value in 1977-2005 of 2.66ºC/a. This was an increase of 1.08ºC/a, whereas the average in 1957-1976 was 1.58ºC/a. The mean value of Tnav in 1977-2005 increased 68.35% over 1957-1986. Thus, Tnav’s rising trend was larger than that of Tav or Txav, indicating that the rise in daily minimum temperature made a significant contribution to the warming rate of CA.
Table 3 Abrupt change of extreme temperature indices based on the test results of cumulative deviation and student’s t test during 1957-2005 in CA
Index Cumulative deviation Period Student’s t test
Q/Sqrt(n) Year of change Mean value P value
Tav 2.02* 1987 1957-1986 8.25ºC/a -2.87*
1987-2005 9.09ºC/a
Txav 1.58* 1987 1957-1986 14.69ºC/a -2.10*
1987-2005 15.31ºC/a
Tnav 2.36* 1977 1957-1976 1.58ºC/a -3.71*
1977-2005 2.66ºC/a
FD0 1.97* 1976 1957-1975 154.59 days/a 3.50*
1976-2005 147.41 days/a
ID0 1.37* 1986 1957-1985 70.43 days/a 2.69*
1986-2005 64.17 days/a
SU25 1.55* 1973 1957-1972 109.55 days/a -3.24*
1973-2005 115.47 days/a
TXx 1.80* 1972 1957-1971 37.21ºC/a -2.53*
1972-2005 37.99ºC/a
TNx 2.17* 1973 1957-1972 22.72ºC/a -2.81*
1973-2005 23.58ºC/a
TXn 1.85* 1978 1957-1977 -15.67ºC/a -3.71*
1978-2005 -13.53ºC/a
TNn 2.35* 1978 1957-1977 -26.48ºC/a -4.89*
1978-2005 -23.65ºC/a

Trends significant (significance level< 0.05) are marked with *.

3.1.2 Spatial patterns of Tav, Txav and Tnav
In 1957-2005, Tav, Txav and Tnav all showed a widespread significant warming trend, especially Tav and Tnav (Figures 2a-2c). Approximately 98.18% of the stations showed rising trends for Tav and Tnav, while 94.55% of the stations showed significant increases. Only one station (located in the northern edge of the Tarim Basin) showed a falling trend, but this was not significant for Tav and Tnav. All (100%) of the stations showed increasing trends for Txav, but only 70.91% showed significant increasing trends. These results indicate that spatial variations in Tav, Txav and Tnav were generally consistent with less spatial diversities in CA.
3.1.3 Temporal patterns of warm extremes (TXx, TNx and SU25)
As the TXx, TNx and SU25 indices reflect variations in summertime temperatures, they are regarded here as warm extremes. All of the warm extremes showed significant rising trends (p<0.01), with rates of 0.020ºC/a, 0.030ºC/a and 0.206 days/a, respectively (Figures 3d-3f and 4a-4c). The rate of increase for SU25 indicated that hotter summer days increased rapidly during 1957-2005. Meanwhile, the rising rate of TNx was higher than TXx. The abrupt change in both TNx and SU25 was significant around 1973, and the mean values of TNx and SU25 in 1957-1972 were 22.72ºC/a and 109.55 days/a, respectively, and 23.58ºC/a and 115.47 days/a in 1973-2005, respectively. The mean values of TNx and SU25 in 1973-2005 increased by 3.79% and 5.40% over 1957-1972, respectively. 1972 marked a significant abrupt change for TXx, with the mean value measuring 0.78ºC/a warmer in 1972-2005 than in previous years. The mean value of TXx in 1972-2005 increased 2.10% over 1957-1971.
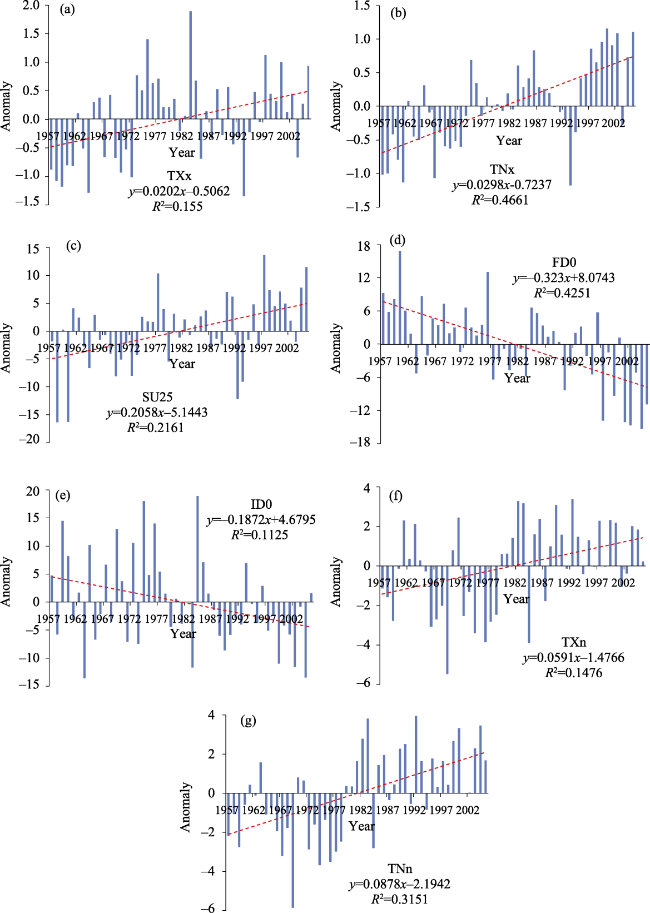
Figure 4 Regional annual anomaly series for each extreme temperature indices. The blue column denotes the annual anomaly series and the red dash line represents the linear regression. (a) TXx, (b) TNx, (c) SU25, (d) FD0, (e) ID0, (f) TXn and (g) TNn.
3.1.4 Spatial patterns of warm extremes (TXx, TNx and SU25)
These three indices showed significant increasing trends mainly in the Turgay Valley, Kyzylkum Desert, Kazakhskiy Melkosopochnik, and northern Tianshan Mountains (Figures 5a-5c). Meanwhile, 8.18% of the stations showed a decreasing trend for TXx, which was mainly distributed around the south and southwest edges of the Tarim Basin. For TNx and SU25, 87.27% and 96.36% of the stations showed increasing trends, respectively, and 58.18% and 45.45% of the stations had significant increases.
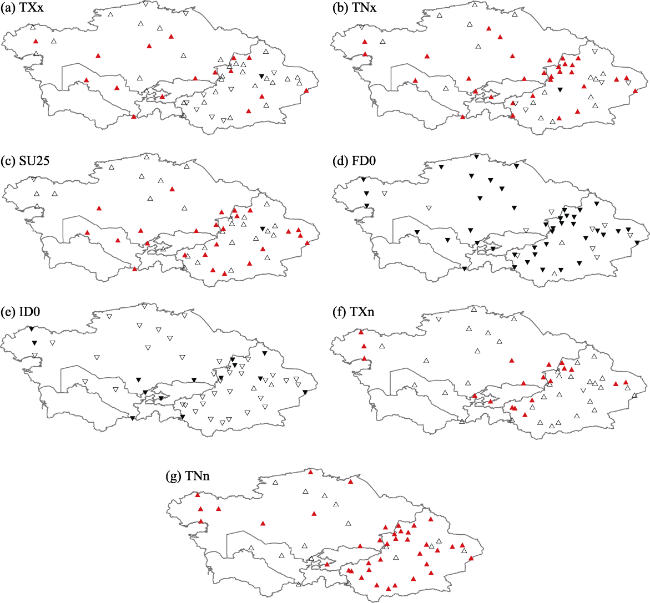
Figure 5 Spatial variation trends of the extreme temperature indices (a) TXx, (b) TNx, (c) SU25, (d) FD0, (e) ID0, (f) TXn and (g) TNn. The red filled triangle denotes significant rising trend (P<0.05); the unfilled triangle denotes rising trend but not significant; the black filled inverted-triangle denotes significant falling trend (p<0.05); the unfilled inverted-triangle denotes falling trend but not significant.
3.1.5 Temporal patterns of cold extremes (FD0, ID0, TXn and TNn)
The FD0, ID0, TXn and TNn indices exhibit temperature changes of cold days and cold nights, so they are regarded as cold extremes here. On the whole, all of the cold extremes during 1957-2005 in CA showed significant changing trends and faster warming rates than the indices of warm extremes (Figures 3g-3j). FD0 showed a significant decreasing trend (p<0.01), at a rate of -0.323 days/a, while ID0 displayed a significant decreasing trend (p<0.05), at a rate of -0.187 days/a (Figures 4d-4e). Meanwhile, TXn significantly increased (p<0.05), at a rate of 0.059ºC/a, while TNn notably increased (p<0.01), at a rate of 0.088ºC/a (Figures 4f-4g). From the above, we can see that the rising rates of cold extremes (TXn and TNn) were more than twice higher than warm extremes (TXx and TNx). This is similar to Tnav, whose increasing rates were also approximately twice that of Txav. Therefore, the warming rates of daily minimum temperatures were higher than daily maximum temperatures, and the faster warming rates of cold extremes were the most important driving force in CA’s climate warming.
Abrupt changes in FD0 occurred around in 1976, with the mean value 7.18 days/a shorter in 1975-2005 than before. The mean value of FD0 in 1976-2005 increased by 4.64% over 1957-1975. An abrupt change for ID0 occurred in 1986, decreasing 6.26 days/a during 1986-2005 compared to previous years. The mean value of ID0 in 1986-2005 increased by 8.89% over 1957-1985. Significant abrupt changes were also detected in 1978 for both TXn and TNn, increasing 2.14ºC/a and 2.83ºC/a, respectively, during 1978-2005 than before. The mean values of TXn and TNn in 1978-2005 increased by 13.66% and 10.69% over 1957-1977, respectively.
3.1.6 Spatial patterns of cold extremes (FD0, ID0, TXn and TNn)
FD0 and ID0 showed widespread falling trends across the entire region of CA. Both FD0 and ID0 showed falling trends at 96.36% of stations, but 80% of the stations showed significant decreases for FD0, while only 25.45% of the stations showed significant decreases for ID0. There was a significant decreasing trend for FD0 in most of CA, except for two isolated stations located at the edge of the Tarim Basin, where an insignificant increasing trend was observed (Figure 5d). For ID0, the stations showing significant decreasing trends were located in southern CA (five countries) and west of northern Xinjiang (Figure 5e). TXn and TNn showed increasing trends at 96.36% and 100% of the stations, respectively, but 70.91% of the stations showed a significant rising trend for TNn and only 34.55% showed significant increases for TXn. In fact, significant increases of TXn mainly occurred in the Caspian Depression and around the Tianshan Mountains (Figure 5f). The entire region of CA showed widespread rising trends for TNN, with significant increases occurring mainly in the Caspian Depression, West Siberian Plain, and across most of Xinjiang (Figure 5g).

3.2 Variation trends and abrupt changes in precipitation extremes

3.2.1 Temporal patterns of Prcptot, CDD and CWD
These three precipitation indices reflect the changing trends of total wet and dry conditions in CA. The results of the MK test revealed that Prcptot exhibited a significant rising trend (p<0.05) at a rate of 0.476 mm/a during 1957-2005 (Table 4, Figures 6d and 7a), while CDD displayed a significant falling trend (p<0.05) at a rate of -0.317 days/a (Figures 6e and 7b) and CWD showed a non-significant increasing trend at a rate of 0.001 days/a (Figures 6f and 7c). All three indices experienced the same abrupt change year (around 1986), but the abrupt change was significant only for Prcptot and CDD (Table 5). The mean values of Prcptot and CWD were 164.88 mm/a and 3.09 days/a in 1986-2005, respectively, increasing 17.63 mm/a and 0.10 days/a. The mean value of CDD was 103.10 days/a in 1986-2005, decreasing 10.39 days/a. The mean values of Prcptot and CWD in 1986-2005 increased by 11.97% and 3.34% over 1957-1985, respectively. For CDD, the mean value in 1986-2005 decreased by 9.15% over 1957-1985.
Table 4 Temporal variation trend of extreme precipitation indices based on the results of MK test during 1957-2005 in CA
Index MK test Percentage of stations
showing increasing trend (%)
Percentage of stations showing
significant increasing trend (%)
Percentage of stations
showing decreasing trend (%)
Percentage of stations
showing significant decreasing trend (%)
Trend rate Z-value Trends Significance
level (p)
Prcptot 0.476 mm/a 2.11 0.05 81.82 25.45 18.18 1.82
CDD -0.317 days/a -2.26 0.05 21.82 1.82 78.18 5.45
CWD 0.001 days/a 0.28 NS 49.09 3.64 50.91 0
R10mm 0.016 days/a 2.19 0.05 76.36 12.73 23.64 1.82
R20mm 0.004 days/a 1.94 0.1 69.09 5.45 30.91 0
Rx1 day 0.040 mm/a 2.14 0.05 69.09 9.09 30.91 1.82
Rx5 day 0.055 mm/a 1.50 NS 65.45 10.91 34.55 3.64

The positive value denotes increasing trend and negative value represents decreasing trend.

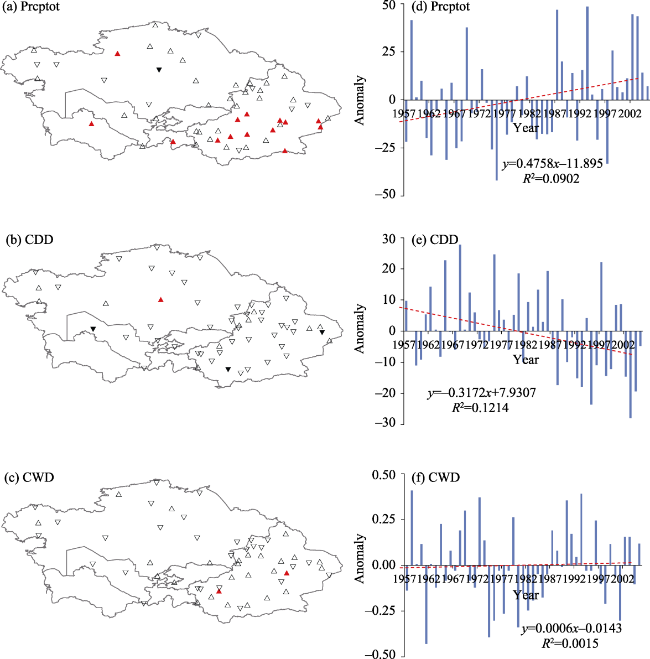
Figure 6 Spatial-temporal variation trends of the extreme precipitation indices of Prcptot, CDD and CWD during 1957-2005 in Central Asia. (a)-(c): Spatial variation trends of (a) Prcptot, (b) CDD and (c) CWD. (The red filled triangle denotes significant rising trend (P<0.05); the unfilled triangle denotes rising trend but not significant; the black filled inverted-triangle denotes significant falling trend (P<0.05); the unfilled inverted-triangle denotes falling trend but not significant). (d)-(f): Regional annual anomaly series of (d) Prcptot, (e) CDD and (f) CWD (The blue column denotes the annual anomaly series and the red dash line represents the linear regression).
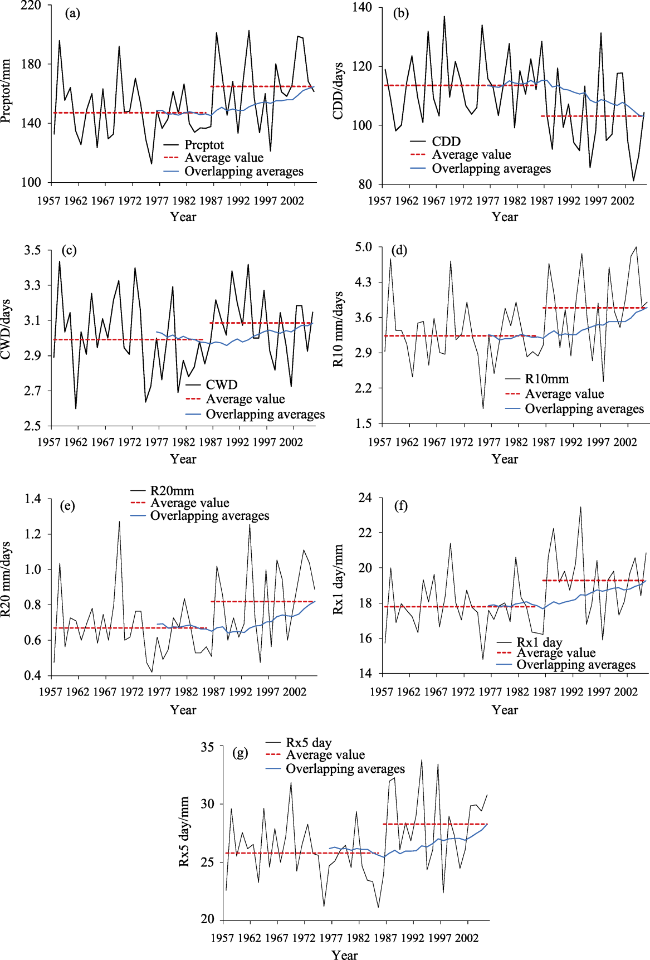
Figure 7 Temporal variation trends of extreme precipitation indices during 1957-2005 in CA. (a) Prcptot, (b) CDD, (c) CWD, (d) R10mm, (e) R20mm, (f) Rx1 day and (g) Rx5 day. Red dotted line denotes the mean value of each extreme temperature indices before and after abrupt change; Black and blue solid lines represent time series variations and 20-year overlapping averages for each precipitation indices, respectively.
Table 5 Abrupt change of extreme precipitation indices based on the test results of cumulative deviation and student’s t test for extreme precipitation indices during 1957-2005 in CA
Index Cumulative deviation Periods Student’s t test
Q/Sqrt(n) Year of change Mean value P value
Prcptot 1.44* 1986 1957-1985 147.25 mm/a -2.64*
1986-2005 164.88 mm/a
CDD 1.58* 1986 1957-1985 113.49 days/a 2.75*
1986-2005 103.10 days/a
CWD 0.81 1986 1957-1985 2.99 days/a -∞*
1986-2005 3.09 days/a
R10mm 1.41* 1986 1957-1985 3.24 days/a -1.94
1986-2005 3.80 days/a
R20mm 1.39* 1986 1957-1985 0.67 days/a -∞*
1986-2005 0.82 days/a
Rx1 day 1.60* 1986 1957-1985 17.80 mm/a -2.57*
1986-2005 19.29 mm/a
Rx5 day 1.52* 1986 1957-1985 25.79 mm/a -2.84*
1986-2005 28.27 mm/a

Trends significant (significance level< 0.05) are marked with *.

3.2.2 Spatial patterns of Prcptot, CDD and CWD
Comparing temperature changes, Prcptot, CDD and CWD were generally less consistent and significant, and showed higher spatial diversity and heterogeneity across the entire study area. Rising trends for Prcptot were observed at 81.82% of the stations, although among these only 25.45% showed significant rises, and these stations were mainly located in the eastern Tianshan Mountains (in Xinjiang) (Figure 6a). Meanwhile, 18.18% of the stations had falling trends for Prcptot and most of these stations were located in the Caspian Depression, Turgay Valley and south of Kazakhstan. For CDD, 78.18% of the stations experienced decreasing trends. Only 5.45% of the stations showed significant decreasing trends. These stations were located in the Kyzylkum Desert and southern Xinjiang, which indicated that the number of dry days had significantly decreased in these areas (Figure 6b). The southwest of Kazakhskiy Melkosopochnik, however, showed significant increases for CDD. Meanwhile, in most areas across CA, CWD showed a falling trend in all five countries as well as west of northern Xinjiang, but rising trends in most of southern Xinjiang (Figure 6c).
3.2.3 Temporal patterns of R10mm, R20mm, Rx1 day and Rx5 day
These four indices were used to show the frequency and intensity of precipitation extremes. Both R10mm (R10) and Rx1 day (Rx1) showed significant increasing trends, with rates of 0.016 days/a and 0.040 mm/a, respectively (Figures 7d, 7f, 8a and 8c). R20mm (R20) and Rx5 day (Rx5) had non-significant rising trends, with rates of 0.004 days/a and 0.055 mm/a, respectively (Figures 7e, 7g, 8b and 8d). Rx1 showed a significant increasing trend but Rx5 did not, which suggested that the intensity of daily precipitation had strengthened during 1957-2005. For all four of the indices (R10, R20, Rx1, Rx5), 1986 marked an abrupt change. R10 and R20 were 3.80 days/a and 0.82 days/a in 1986-2005, respectively, when the mean values were 0.56 days/a and 0.15 days/a longer than previously. Furthermore, the mean values of Rx1 and Rx5 were 19.29 mm/a and 28.27 mm/a in 1986-2005, respectively, increasing 1.49 mm/a and 2.48 mm/a over prior readings. The mean values of R10, R20, Rx1 and Rx5 in 1986-2005 increased by 17.28%, 22.39%, 8.37% and 9.62% over 1957-1985, respectively.
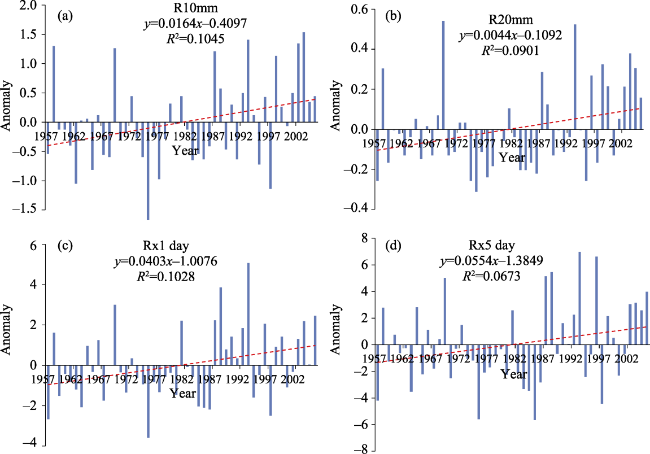
Figure 8 Regional annual anomaly series for each extreme precipitation indices. The blue column denotes the annual anomaly series and the red dash line represents the linear regression. (a) R10mm, (b) R20mm, (c) Rx1 day and (d) Rx5 day.
3.2.4 Spatial patterns of R10, R20, Rx1 and Rx5
Consistent with Prcptot, CDD and CWD outlined above, R10mm, R20mm, Rx1 day and Rx5 day also showed higher spatial diversity and heterogeneity across the entire area under study. For R10, 76.36% of the stations experienced a rising trend, but only 12.73% showed a significant rising trend, and most of those stations were located in southern Xinjiang (Figure 9a). For R20, 30.91% of the stations showed decreasing trends and were mainly in the north of Kazakhstan and the northernmost areas of northern Xinjiang (Figure 9b). Rx1 showed rising trends at 69.09% of the stations (mainly in Xinjiang and western Kazakhstan) but showed falling trends at 30.91% of the stations (mainly in Kazakhskiy Melkosopochnik and southern Kazakhstan) (Figure 9c). For Rx5, 65.45% of the stations showed rising trends, 34.55% exhibited falling trends, and only 10.91% showed significant increasing trends, with most of the latter stations being located in Xinjiang (Figure 9d).
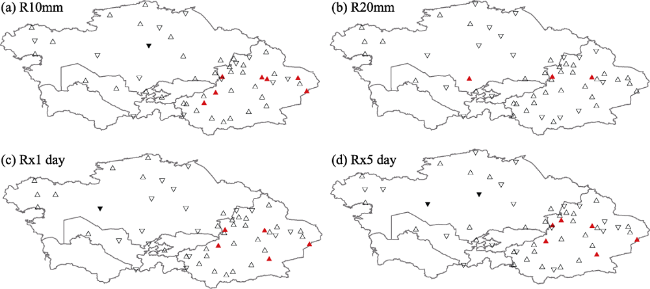
Figure 9 Spatial variation trends of the extreme precipitation indices (a) R10mm, (b) R20mm, (c) Rx1 day, (d) Rx5 day. The red filled triangle denotes significant rising trend (P<0.05); the unfilled triangle denotes rising trend but not significant; the black filled inverted-triangle denotes significant falling trend (P<0.05); the unfilled inverted-triangle denotes falling trend but not significant.

3.3 Possible atmospheric circulation factors influencing climate extremes

Spearman’s correlation analysis was conducted to investigate the statistical relationships between the 17 climate extremes and 10 atmospheric circulations (AAO, AO, NAO, NOI, PDO, PNA, SH, SO, TPI_B and WCI) in CA. The results showed that, in 1957-2005, SH and WCI had significant correlations with temperature extremes (Table 6), while TPI_B and PNA showed good consistency with precipitation extremes (Table 7). SH showed significant correlation with Tav, Txav, Tnav, FD0, ID0, TXn, TNn and Prcptot (correlation coefficient R = -0.415, -0.331, -0.457, 0.320, 0.507, -0.350, -0.365 and -0.313, respectively), and WCI exhibited significant correlation with Tav, Tnav, FD0, TXn and TNn (R = 0.402, 0.485, -0.382, 0.347, and 0.394, respectively). TPI_B had good consistency with Tav, Tnav, ID0, Prcptot, CDD, CWD, R10, R20, Rx1 and Rx5 (R = 0.312, 0.326, -0.377, 0.531, -0.422, 0.311, 0.516, 0.568, 0.344 and 0.451, respectively), whereas PNA had significant correlation with Prcptot, CDD, R10, R20mm, Rx1, Rx5 (R = 0.359, -0.312, 0.324, 0.300, 0.342 and 0.315, respectively).
Table 6 The correlation coefficient values between temperature extremes in CA and atmospheric circulations
Circulation index Indices
Tav Txav Tnav FD0 ID0 SU25 TXx TNx TXn TNn
AAO 0.153 0.216 0.139 -0.049 -0.144 0.078 -0.074 0.153 0.179 0.182
AO 0.247 0.194 0.272 -0.145 -0.157 0.112 0.092 0.028 0.336* 0.271
NAO -0.053 -0.062 0.003 0.079 0.070 0.089 -0.059 -0.104 0.158 0.099
NOI -0.166 -0.046 -0.260 0.264 0.143 0.125 0.054 0.055 -0.119 -0.228
PDO 0.085 -0.101 0.217 -0.150 0.013 -0.002 0.089 0.235 0.160 0.310*
PNA 0.171 0.085 0.248 -0.230 -0.143 0.038 0.098 0.137 0.088 0.214
SH -0.415** -0.331* -0.457** 0.320* 0.507** 0.066 0.004 -0.005 -0.350* -0.365*
SOI -0.172 -0.071 -0.254 0.317* 0.058 -0.061 0.074 0.057 0.010 -0.094
TPI_B 0.312* 0.281 0.326* -0.254 -0.377** 0.028 -0.129 0.073 0.022 0.120
WCI_DJFc 0.402** 0.277 0.485** -0.382* -0.265 0.266 -0.042 0.300 0.347* 0.394**

** Significant at p < 0.01; * Significant at p < 0.05. WCI_DJF denotes WCI in December, January and February.

Table 7 The correlation coefficient values between precipitation extremes in CA and atmospheric circulations
Circulation index Indices
Prcptot CDD CWD R10mm R20mm Rx1 day Rx5 day
AAO -0.039 0.024 -0.102 -0.115 0.115 -0.112 -0.149
AO -0.048 -0.139 0.045 -0.038 -0.113 -0.045 -0.077
NAO -0.115 -0.012 -0.089 -0.099 -0.245 -0.119 -0.185
NOI -0.218 0.097 -0.127 -0.261 -0.143 -0.218 -0.059
PDO 0.252 -0.246 0.056 0.243 0.094 0.226 0.146
PNA 0.359* -0.312* 0.039 0.324* 0.300* 0.342* 0.315*
SH -0.313* 0.170 -0.204 -0.265 -0.232 -0.199 -0.131
SOI -0.191 0.063 -0.123 -0.191 -0.126 -0.170 -0.070
TPI-B 0.531** -0.422** 0.311* 0.516** 0.568** 0.344* 0.451**
WCI_DJF 0.117 -0.269 0.195 0.082 0.015 0.212 0.258

** Significant at p < 0.01; * Significant at p < 0.05. WCI_DJF denotes WCI in December, January and February.

From the preceding, we can see that both SH and TPI_B had significant correlation (p<0.05) with Tav, Tnav and Prcptot. SH had significant correlation (p<0.05) with 7 temperature extremes and strong correlation (p<0.01) with 3 temperature extremes. TPI_B showed good consistency (p<0.05) with all 7 precipitation extremes in this study and significant correlation (p<0.01) with 5 of them. WCI was highly correlated with Tav (p < 0.01), but not with Prcptot (p>0.05). PNA had significant correlation with Prcptot (p > 0.05), but not with Tav (p>0.05). Based on these findings, we speculate that SH and TPI_B were the most important atmospheric circulation factors influencing the temperature and precipitation extremes of CA during 1957-2005.
From Figures 10a and 10b, we can see that TPI_B had a minimum value in 1984. TPI_B showed a decreasing trend prior to 1984, but afterwards showed an overall increasing trend. Except for CDD, which had significant negative correlation with TPI_B, all of the other extreme precipitation indices had strong positive correlations with TPI_B. The temporal variation tendency of TPI_B matched the extreme indices of precipitation, and most of the correlation coefficient values were at 0.40-0.50. Figures 10c and 10d showed that SH had significant positive correlations only with FD0 and ID0 and significant negative correlations with Tav, Txav, Tnav, TXn and TNn. Compared with the correlations between TPI_B and precipitation extremes, SH had only a few with these temperature extremes due to the variation trends of fluctuations not matching well (i.e., most of the correlation coefficient values were at 0.30-0.40).
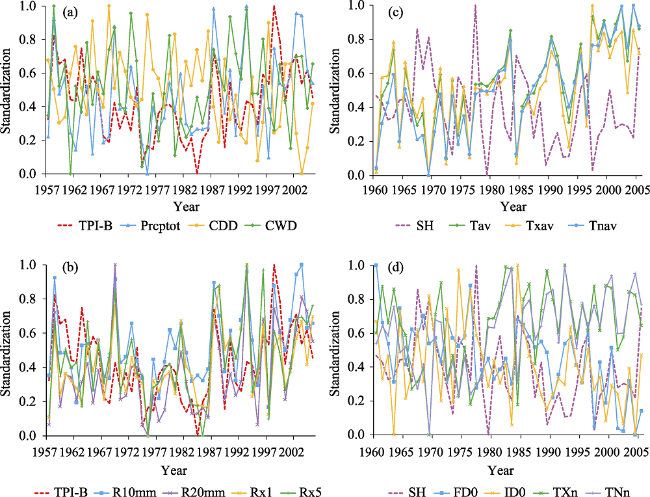
Figure 10 Time series variations between TPI_B and extreme precipitation indices (a)-(b); and between SH and extreme temperature indices (c)-(d)

4 Discussion

The last three decades have been the warmest on record since the late 19th century, which for many researchers indicates a sure sign of global warming (Hansen et al., 2010; Jones et al., 2012; Morice et al., 2012; IPCC, 2013). The increasing rates of average annual land surface air temperature worldwide and in the Northern Hemisphere are 0.07ºC/10a and 0.10ºC/10a, respectively (Harris et al., 2014). In China, Tav increased by 0.27ºC per decade during 1961-2003 (You et al., 2011), while Li et al. (2012), Deng et al. (2014) and Chen et al. (2014) found that Tav increased in arid northwestern China by 0.34ºC/10a in 1960-2010, 0.29-0.39ºC/10a in 1961-2010, and 0.33ºC/10a in 1961-2010, respectively. The present study found that Tav in CA had a significant warming trend at a rate of 0.32ºC/10a during 1957-2005, which was consistent with the study by Hu et al. (2014) and close to the increasing rate of northwestern China. The increasing rate of Tav in CA was far higher than the global rate or that of the Northern Hemisphere. This accelerated warming trend in CA again proves that CA is one of the most sensitive areas to climate change in the world.
The rise in minimum temperature is the main driving force behind climate warming both globally and regionally. In this study, results showed that faster warming trends occurred at extreme temperature indices rooted in daily minimum temperature (Tnav, FD0, TNx and TNn); indices derived from daily maximum temperature (Txav, ID0, SU25, TXx and TXn) also showed warming trends, but with smaller magnitudes. These results were in accordance with previous studies (Table 8). For example, the increasing rates of TNx and TNn occurred more quickly than TXx and TXn worldwide (Alexander et al., 2006), in China (You et al., 2011), the Middle East (Zhang et al., 2005), northwestern China (Wang et al., 2013b; Chen et al., 2014), southwestern China (Li et al., 2012), and the eastern and central Tibetan Plateau (You et al., 2008), which revealed a notable reduction in the frequency of extreme low temperatures from global to regional perspectives.
Table 8 Trends of extreme temperature indices from this study and other works
Index CA (five countries and Xinjiang of China
(1957-2005)
Northwestern China
(1960-2003)
Middle East (1950-2003) Eastern and central Tibetan Plateau (1961-2005) Southwestern China
(1961-2008)
China (1961-2003) Global
(1951-2003)
Tav 4.89* 5.45*
Txav 3.39* 3.96*
Tnav 5.78* 6.77*
FD0 -4.71* -3.24* -0.6 -4.32* -0.29* -3.73*
ID0 -2.31* -2.75* -2.46* -0.09
SU25 3.18* 1
TXx 2.67* 0.17 0.07 0.28* 0.11* 0.07 0.21*
TNx 5.14* 0.32* 0.23* 0.25* 0.17* 0.21* 0.30*
TXn 2.38* 0.61* 0.2 0.30* 0.13* 0.35* 0.37
TNn 3.86* 0.85* 0.28* 0.69* 0.29* 0.63* 0.71*
Data Source This study Wang et al. (2013b) and Chen et al (2014) Zhang et al. (2005) You et al.
(2008)
Li et al.
(2012)
You et al.
(2011)
Alexander
et al. (2006)

Trends significant (significance level< 0.05) are marked with*.

From a global perspective, precipitation extremes showed a general rising trend in the past half-century (Donat et al., 2016). Meanwhile, many studies have been conducted to analyze and estimate the variations of total precipitation and precipitation extremes in arid areas around the world. The variations revealed complex and contrasting trends across arid areas. For example, in northwestern China (Table 9) and western Argentina (Skansi et al., 2013), precipitation extremes exhibited an increasing trend. In the west coast of South America, Prcptot, Rx5 and R20 showed non-significant decreasing trends, while CDD, Rx1 and CWD showed slight increasing trends (Skansi et al., 2013). In Australia, the extreme precipitation indices of simple daily intensity (SDII), very heavy precipitation contribution (R95T) and CDD all were expected to more than double within the next 100 years (Alexander and Arblaster, 2009), whereas in the southwestern United States, total precipitation and flood magnitudes showed that general decreases and droughts had significantly increased (Peterson et al., 2013). Over the Greater Horn of Africa region, there were few significant trends in precipitation extremes except for Prcptot, which showed a significant decrease (Omondi et al., 2014). Prcptot and R10 also consistently showed non-significant decreases and CDD had a general increase over much of the Arabian Peninsula (Donat et al., 2014). In the Middle East, CDD displayed a significant decreasing trend and Prcptot showed a non-significant falling trend (Zhang et al., 2005) In the eastern and central Tibetan Plateau, Prcptot, R10 and Rx1 exhibited a non-significant rising trend, CDD showed a notable falling trend, and CWD charted a falling trend (You et al., 2008). In this study, Prcptot, R10 and Rx1 showed significant rising trends, CDD a notable falling trend, and CWD, R20 and Rx5 non-significant rising trends, all of which reflected increased precipitation and fewer dry days during 1957-2005 in CA. The results of the variations of total precipitation and precipitation extremes in this study were similar with those of other studies during the same time periods (e.g., Lioubimtseva et al., 2005; Klein Tank et al., 2006; Zhang et al., 2017), and were consistent with global changing trends in precipitation extremes.
Table 9 Trends of extreme precipitation indices from this study and other works
Index CA (five countries and Xinjiang of China) (1957-
2005)
CA (five countries)(1938-
2005)
Northwestern China
(1960-2003)
Middle East (1950-
2003)
Eastern and central Tibetan Plateau (1961-
2005)
Southwestern China
(1961-
2008)
China (1961-
2003)
Global (1951-
2003)
Prcptot 2.11* 3.60* 6.82* -0.3 6.66 0.03 3.21 10.59*
CDD -2.26* -2.68* -4.85* -5.0* -4.64* -0.05 -1.22 -0.05
CWD 0.28 1.70 0.047* -0.07 -0.08*
R10mm 2.19* 2.67* 0.22* -0.03 0.23 0
R20mm 1.94 2.97* 0
Rx1 day 2.14* 0.77 0.63* 0 0.27 0.05* 1.37 0.85*
Rx5 day 1.50 1.85* 0.98* 0 -0.08 0.03 1.90 0.55
Data Source This study Zhang et al. (2017) Wang et al. (2013a) Zhang et al. (2005) You et al. (2008) Li et al.
(2012)
You et al.
(2011)
Alexander et al. (2006)

Trends significant (significance level< 0.05) are marked with *.

The above analysis indicates that total precipitation and precipitation extremes exhibited increasing trends in the five countries of Central Asia, as well as in northwest China, the eastern and central Tibetan Plateau, western Argentina, and Australia. At the same time, total precipitation and heavy precipitation showed decreasing trends in the southwestern United States, the west coast of South America, the Greater Horn of Africa region, the Middle East, and the Arabian Peninsula. Meanwhile, CDD or droughts showed rising trends in the west coast of South America, Australia, southwestern United States, the Greater Horn of Africa region and the Arabian Peninsula, while CDD or droughts experienced falling trends only in the five countries of CA (Zhang et al., 2017), northwest China (Wang et al., 2013a; Wang et al., 2013b; Chen et al., 2014; Chen et al., 2015), the Middle East, the eastern and central Tibetan Plateau, and western Argentina. From these findings, we can see that there are uncertainties in total precipitation and dry-humid variations, which may differ in arid regions under climate change. This conclusion is consistent with the findings of Greve et al. (2014) and Donat et al. (2016), which also demonstrated that drier and wetter trends differed across regions. Thus, the question “Is Central Asia getting drier?”, which was raised more than half a century ago (Markov et al., 1951), is still an exploratory subject that requires more discussion across different periods.
In recent years, several scholars concluded that anthropogenic activities formed the root causes of variations in climate change and ECEs (Kim et al., 2016; Stott, 2016; Stott et al., 2016; Chen and Sun, 2017; Diffenbaugh et al., 2017). Anthropogenic activities can also influence changes in atmospheric circulation, which is another aspect of climate change. Therefore, it is necessary to conduct research on the associations between climate extremes and atmospheric circulation. Within the CA region, which includes the five countries of CA as well as northwestern China, some studies showed that mean and climate extremes were closely related to the movements of the westerly jet stream (Chen et al., 2008; Cheng et al., 2016; Wei et al., 2017), the South Asian High (Wei et al., 2017), the Asian monsoon (Zhang et al., 2002; Cheng et al., 2016), SH (Li et al., 2012), TPI_B (Chen et al., 2014), West Pacific Subtropical High, and the North American Subtropical High (Li et al., 2016a). In this study, we detected that SH and WCI had a significant correlation with temperature extremes, while TPI_B and PNA had good consistency with precipitation extremes. In fact, according to comparisons of the significance levels of both temperature and precipitation extremes, we believe that SH and TPI_B might be the most important atmospheric circulation factors affecting climate extremes, a finding which is consistent with previous studies (Li et al., 2012; Chen et al., 2014).
Through its influence on atmospheric circulation, the Tibetan Plateau plays a critical role in the climate formation in Asia and the surrounding areas. To reflect the activities of high pressure and low vortex at 500 hPa over the Tibetan Plateau, TPI_B is adopted into the climate research. TPI_B ranges from 30°N to 40°N and 75°E to 105°E, and is defined as an accumulative value of the 500 hPa height value minus 500 dagpm (Chen et al., 2014). In our study area, TPI_B showed significant relations with all precipitation extremes (Prcptot, CDD, CWD, R10, R20, Rx1 and Rx5) and three temperature extremes (Tav, Tnav and ID0). This result was consistent with the result of Chen et al. (2014) in northwestern China, which revealed that TPI_B was highly correlated with Pav (annual mean precipitation), Tav, Tnav and Txav.
SH is a very dry cold air mass which forms in the Mongolian-Siberian region. It has a great influence on the weather patterns and climate in most of the Northern Hemisphere, especially continental Asia (Cohen et al., 2001; Gong and Ho, 2002; Jeong et al., 2011; Li et al., 2012). In Eurasia, SH is the crucial atmospheric center of action during winter and thus has close associations with winter temperatures. Gong and Ho (2002) showed that SH was relatively strong in the 1960s but weakened substantially from the late 1970s to the 1990s. Jeong et al. (2011) revealed that SH intensity (SHI) exhibited a notable weakening trend during the 1970s and 1980s. In the 1990s, it showed the lowest SHI but recovered rapidly into the 2000s. The reason for the strengthening of the SHI was the increase in Eurasian snow cover in the 1990s and 2000s and the near-surface cooling over the SH central region. In this study, the extreme temperature indices of Tav, Txav, Tnav, FD0, ID0, TXn and TNn in CA had significant correlations with SH and showed warm nights and warm winter trends.

5 Conclusions

In this study, we detected spatial-temporal variation trends and abrupt changes in climate extremes in Central Asia based on daily climate observations across regional monitoring stations during 1957-2005. We also speculated on possible atmospheric circulation factors impacting the climate extremes of CA. Several conclusions are drawn from this study as follows:
(1) During 1957-2005, the annual mean temperature and temperature extremes in CA had widespread significant warming trends, especially for those indices derived from daily minimum temperature, which showed higher warming rates. The rise in minimum temperature was the main driving force in climate warming in CA. In this study, Tav significantly increased at a rate of 0.032ºC/a, which was far higher than the increasing rates globally and in the Northern Hemisphere. The changing rate of Txav, Tnav, TXx, TNx, SU25, TXn, TNn, FD0 and ID0 was 0.024ºC/a, 0.041ºC/a, 0.020ºC/a, 0.030ºC/a, 0.206 days/a, 0.059ºC/a, 0.088ºC/a, -0.323 days/a and -0.187 days/a, respectively. The results indicated that higher extreme temperature values had significantly increased, while colder extreme temperature values had significantly decreased. During 1957-2005, the abrupt change of Tav, Txav, Tnav, TXx, TNx, SU25, TXn, TNn, FD0 and ID0 occurred around 1987, 1987, 1977, 1972, 1973, 1973, 1978, 1978, 1976 and 1986, respectively. Furthermore, Tav and temperature extremes exhibited spatially widespread rising trends with slight spatial variations. In particular, an overall warming trend was noted in the Tianshan Mountains, northern Xinjiang and Kazakhskiy Melkosopochnik.
(2) Compared to temperature changes, annual mean precipitation and extremes in CA were generally less consistent and significant during 1957-2005. Prcptot significantly increased at a rate of 0.476 mm/a, while precipitation extremes increased slightly. The changing rate of CDD, CWD, R10, R20, Rx1 and Rx5 was -0.317 days/a, 0.001 days/a, 0.016 days/a, 0.004 days/a, 0.040 mm/a and 0.055 mm/a, respectively. All of the precipitation indices experienced an abrupt change in 1986 and all precipitation extremes showed spatial diversity and heterogeneity. Wetter trends and precipitation extremes increased in the Tianshan Mountains, Kazakhskiy Melkosopochnik, the Kyzylkum Desert and most of Xinjiang, while drier trends and decreased precipitation extremes emerged in the West Siberian Plain and the Turgay Valley.
(3) Through Spearman’s correlation analysis, we detected that SH and WCI had significant correlations with temperature extremes, and TPI_B and PNA had good consistency with precipitation extremes. SH showed significant correlation with Tav, Txav, Tnav, FD0, ID0, TXn, TNn and Prcptot, and TPI_B had good consistency with Tav, Tnav, ID0, Prcptot, CDD, CWD, R10, R20, Rx1 and Rx5. According to the comparison of significance levels using both temperature and precipitation extremes, we concluded that SH and TPI_B are likely the most important atmospheric circulation factors affecting the climate extremes in this study.

The authors have declared that no competing interests exist.

[1]
Aizen V B, Kuzmichenok V A, Surazakov A B et al., 2006. Glacier changes in the central and northern Tien Shan during the last 140 years based on surface and remote-sensing data.Annals of Glaciology, 43(1): 202-213. doi: 10.3189/172756406781812465.lt;div class="abstract" data-abstract-type="normal"> This research presents a precise evaluation of the recession of Akshiirak and Ala Archa glaciers, Tien Shan, central Asia, based on data of geodetic surveys from 1861–69, aerial photographs from 1943, 1963, 1977 and 1981, 1:25000 scale topographic maps and SRTM and ASTER data from 2000–03. The Akshiirak glacierized massif in the central Tien Shan contains 178 glaciers covering 371.6 km<span class='sup'>2, and the Ala Archa glacier basin in the northern Tien Shan contains 48 glaciers covering 36.31 km<span class='sup'>2. The Tien Shan glaciers retreated as much as 3 km from the 1860s to 2003. Area shrinkage of Akshiirak and Ala Archa was 4.2% and 5.1%, respectively, from 1943 to 1977, and 8.7% and 10.6%, respectively, from 1977 to 2003. The volume of the Akshiirak glaciers was reduced by 3.566 km<span class='sup'>3 from 1943 to 1977 and 6.145 km<span class='sup'>3 from 1977 to 2000. The total reduction of the Tien Shan glaciers is 14.2% during the last 60 years (1943–2003). The northern and central Tien Shan have not experienced a significant precipitation increase during the last 100 years, but they have experienced an increase in summer air temperatures, especially observable since the 1970s, which accelerated the recession of the Tien Shan glaciers.

DOI

[2]
Alexander L V, 2016. Global observed long-term changes in temperature and precipitation extremes: A review of progress and limitations in IPCC assessments and beyond.Weather and Climate Extremes, 11: 4-16. doi: 10.1016/j.wace.2015.10.007.The Intergovernmental Panel on Climate Change (IPCC) first attempted a global assessment of long-term changes in temperature and precipitation extremes in its Third Assessment Report in 2001. While data quality and coverage were limited, the report still concluded that heavy precipitation events had increased and that there had been, very likely, a reduction in the frequency of extreme low temperatures and increases in the frequency of extreme high temperatures. That overall assessment had changed little by the time of the IPCC Special Report on Extremes (SREX) in 2012 and the IPCC Fifth Assessment Report (AR5) in 2013, but firmer statements could be added and more regional detail was possible. Despite some substantial progress throughout the IPCC Assessments in terms of temperature and precipitation extremes analyses, there remain major gaps particularly regarding data quality and availability, our ability to monitor these events consistently and our ability to apply the complex statistical methods required. Therefore this article focuses on the substantial progress that has taken place in the last decade, in addition to reviewing the new progress since IPCC AR5 while also addressing the challenges that still lie ahead.

DOI

[3]
Alexander L V, Arblaster J M, 2009. Assessing trends in observed and modelled climate extremes over Australia in relation to future projections.International Journal of Climatology, 29: 417-435. doi: 10.1002/joc.1730.Multiple simulations from nine globally coupled climate models were assessed for their ability to reproduce observed trends in a set of indices representing temperature and precipitation extremes over Australia. Observed trends over the period 1957-1999 were compared with individual and multi-modelled trends calculated over the same period. When averaged across Australia, the magnitude of trends and interannual variability of temperature extremes were well simulated by most models, particularly for the index for warm nights. The majority of models also reproduced the correct sign of trend for precipitation extremes although there was much more variation between the individual model runs. A bootstrapping technique was used to calculate uncertainty estimates and also to verify that most model runs produce plausible trends when averaged over Australia. Although very few showed significant skill at reproducing the observed spatial pattern of trends, a pattern correlation measure showed that spatial noise could not be ruled out as dominating these patterns. Two of the models with output from different forcings showed that the observed trends over Australia for one of the temperature indices was consistent with an anthropogenic response, but was inconsistent with natural-only forcings. Future projected changes in extremes using three emissions scenarios were also analysed. Australia shows a shift towards warming of temperature extremes, particularly a significant increase in the number of warm nights and heat waves with much longer dry spells interspersed with periods of increased extreme precipitation, irrespective of the scenario used. Copyright 2008 Royal Meteorological Society

DOI

[4]
Alexander L V, Zhang X, Peterson, T C et al., 2006. Global observed changes in daily climate extremes of temperature and precipitation.Journal of Geophysical Research, 111: D5. doi: 10.1029/2005jd006290.A suite of climate change indices derived from daily temperature and precipitation data, with a primary focus on extreme events, were computed and analyzed. By setting an exact formula for each index and using specially designed software, analyses done in different countries have been combined seamlessly. This has enabled the presentation of the most up-to-date and comprehensive global picture of trends in extreme temperature and precipitation indices using results from a number of workshops held in data-sparse regions and high-quality station data supplied by numerous scientists world wide. Seasonal and annual indices for the period 1951-2003 were gridded. Trends in the gridded fields were computed and tested for statistical significance. Results showed widespread significant changes in temperature extremes associated with warming, especially for those indices derived from daily minimum temperature. Over 70 of the global land area sampled showed a significant decrease in the annual occurrence of cold nights and a significant increase in the annual occurrence of warm nights. Some regions experienced a more than doubling of these indices. This implies a positive shift in the distribution of daily minimum temperature throughout the globe. Daily maximum temperature indices showed similar changes but with smaller magnitudes. Precipitation changes showed a widespread and significant increase, but the changes are much less spatially coherent compared with temperature change. Probability distributions of indices derived from approximately 200 temperature and 600 precipitation stations, with near-complete data for 1901-2003 and covering a very large region of the Northern Hemisphere midlatitudes (and parts of Australia for precipitation) were analyzed for the periods 1901-1950, 1951-1978 and 1979-2003. Results indicate a significant warming throughout the 20th century. Differences in temperature indices distributions are particularly pronounced between the most recent two periods and for those indices related to minimum temperature. An analysis of those indices for which seasonal time series are available shows that these changes occur for all seasons although they are generally least pronounced for September to November. Precipitation indices show a tendency toward wetter conditions throughout the 20th century.

DOI

[5]
Bothe O, Fraedrich K, Zhu X H, 2012. Precipitation climate of Central Asia and the large-scale atmospheric circulation.Theoretical and Applied Climatology, 108: 345-354. doi: 10.1007/s00704-011-0537-2.AbstractThe precipitation climate in the larger Tian Shan region of Central Asia is described in terms of the climatological seasonal moisture fluxes and background circulation based on the ERA-40 reanalysis data and a precipitation reanalysis. The study area is partitioned into (1) the Tarim river basin, (2) bordering regions of China, Kyrgyzstan and Kazakhstan, and (3) Northwestern China. Moisture supply to these areas is primarily due to the midlatitude westerlies with contributions from higher latitudes. In addition, moisture from the Indian Ocean is notably imported into the Tarim drainage area. Monthly interannual precipitation variability relates to the variability of hemispheric circulation patterns. Extreme precipitation above and below normal in Western China and Central Asia is analyzed using the standardized precipitation index. Related circulation composites show that, despite regional and seasonal differences, episodes of extreme and severe dryness are dominated by various upstream standing wave patterns from the North Atlantic to Central Asia. These features extend further downstream to the North Pacific. Non-symmetry between wet and dry composites is noted upstream and in regional moisture flux composites.

DOI

[6]
Buishand T A, 1982. Some methods for testing the homogeneity of rainfall records.Journal of Hydrology, 58: 11-27. doi: 10.1016/0022-1694(82)90066-X.Cumulative deviations from the mean are often used in the analysis of homogeneity. Features of five tests on the cumulative deviations are discussed. Some of these tests have optimal properties in testing the null hypothesis of homogeneity against a shift in the mean at an unknown point. Together with the classical von Neumann ratio the tests were applied to the annual amounts of 30-yr. rainfall records in The Netherlands. For a large number of records strong indications for a change in the mean were found. There were only small differences between the various test-statistics with respect to the number of records for which the null hypothesis was rejected.

DOI

[7]
Chen F H, Wang J S, Jin L Y et al., 2009. Rapid warming in mid-latitude Central Asia for the past 100 years.Frontiers of Earth Science in China, 3: 42-50. doi: 10.1007/s11707-009-0013-9.Surface air temperature variations during the last 100 years (1901-2003) in mid-latitude central Asia were analyzed using Empirical Orthogonal Functions (EOFs). The results suggest that temperature variations in four major sub-regions, i.e. the eastern monsoonal area, central Asia, the Mongolian Plateau and the Tarim Basin, respectively, are coherent and characterized by a striking warming trend during the last 100 years. The annual mean temperature increasing rates at each sub-region (representative station) are 0.19degC per decade, 0.16degC per decade, 0.23degC per decade and 0.15degC per decade, respectively. The average annual mean temperature increasing rate of the four sub-regions is 0.18degC per decade, with a greater increasing rate in winter (0.21degC per decade). In Asian mid-latitude areas, surface air temperature increased relatively slowly from the 1900s to 1970s, and it has increased rapidly since 1970s. This pattern of temperature variation differs from that in the other areas of China. Notably, there was no obvious warming between the 1920s and 1940s, with temperature fluctuating between warming and cooling trends (e.g. 1920s, 1940s, 1960s, 1980s, 1990s). However, the warming trends are of a greater magnitude and their durations are longer than that of the cooling periods, which leads to an overall warming. The amplitude of temperature variations in the study region is also larger than that in eastern China during different periods.

DOI

[8]
Chen F H, Yu Z, Yang M et al., 2008. Holocene moisture evolution in arid Central Asia and its out-of-phase relationship with Asian monsoon history.Quaternary Science Reviews, 27: 351-364. doi: 10.1016/j.quascirev.2007.10.017.We synthesize palaeoclimate records from the mid-latitude arid Asian region dominated today by the Westerlies ( rid central Asia (ACA)) to evaluate spatial and temporal patterns of moisture changes during the Holocene. Sediment records from 11 lakes with reliable chronologies and robust proxies were selected to reconstruct moisture histories based on a five-class ordinal wetness index with assigned scores from the driest to wettest periods at individual sites for 200-year time slices. The proxies used in these records include pollen and diatom assemblages, sediment lithology, lake levels, and geochemistry (mainly isotope) data. The results of our synthesis show that ACA as a whole experienced synchronous and coherent moisture changes during the Holocene, namely a dry early Holocene, a wetter (less dry) early to mid-Holocene, and a moderately wet late Holocene. During the early Holocene most of the lakes experienced very low water levels and even dried out before ca 8 ka (1 ka=1000 cal a BP). Hence the effective-moisture history in ACA is out-of-phase with that in monsoonal Asia as documented by numerous palaeoclimate records. In monsoonal Asia, a strong summer monsoon and humid climate characterized the early Holocene, and a weakened summer monsoon and drier climate prevailed during the late Holocene, which were mainly controlled by changes in low-latitude summer insolation. In contrast, we propose that the pattern of Holocene effective-moisture evolution in the westerly dominated ACA was mainly determined by North Atlantic sea-surface temperatures (SSTs) and high-latitude air temperatures that affect the availability, amount and transport of water vapor. Also, topography of the Tibetan Plateau and adjacent Asian highlands could have contributed to the intensification of dry climate in ACA during the early Holocene, as a result of strengthening the subsidence of dry air masses, associated with stronger uplift motion on the plateau by intense heating under a stronger summer insolation. Summer insolation might have played a key role in directly controlling moisture conditions in ACA but only after the northern hemisphere ice-sheets had disappeared in the mid- and late Holocene.

DOI

[9]
Chen H P, Sun, J Q, 2017. Anthropogenic warming has caused hot droughts more frequently in China.Journal of Hydrology, 544: 306-318. doi: 10.1016/j.jhydrol.2016.11.044.Historical records have indicated an increase in high-impact drought occurrences across China during recent decades, but whether this increase is due to natural variability or anthropogenic change remains unclear. Thus, the shift toward dry conditions and their associated attributions across China are discussed in this study, primarily regarding the standardized precipitation evapotranspiration index (SPEI). The results show that drought occurrences across China increased consistently during 1951–2014, especially during the recent twenty years. Most of the increased drought events happened under warm-dry conditions that coincided with relatively high temperature anomalies but without large anomalies in annual precipitation, implying an increase in hot drought events across China. Further analysis revealed that the change in drought occurrences were mainly due to the combined activity of external natural forcings and anthropogenic changes across China. However, external natural forcings were mainly responsible for the variability of droughts and anthropogenic influences for their increasing trends, suggesting that anthropogenic warming has increased hot drought occurrences, associated risks and impacts across China. With continued warming in the future, the impact of anthropogenic warming on the increased hot drought events will be further amplified. The probability of warm years is projected to significantly increase, and the occurrence probability of hot drought events (SPEI02<02611.0) will increase to nearly 100% by the year 2050, even though the annual precipitation is projected to increase across China in the future.

DOI

[10]
Chen Y N, Deng H J, Li B F et al., 2014. Abrupt change of temperature and precipitation extremes in the arid region of Northwest China.Quaternary International, 336: 35-43. doi: 10.1016/j.quaint.2013.12.057.Trends and abrupt detection of temperature and precipitation extremes are important in climate change research. Based on the meteorological data from 68 stations in the arid region of Northwest China (ARNC), we analyzed the trend and abrupt change in temperature and precipitation extremes from 1961 to 2010. Results showed that abrupt change in both temperature and precipitation extremes in Northwest China occurred in around 1986. Interestingly, an abrupt change in Index B of the Tibetan Plateau (TPI_B) was detected in 1985. The temperature and precipitation extremes had strong and significant associations with TPI_B over the period of 1961–2010 (R02=020.685, p02<020.01, and R02=020.441, p02<020.01, respectively). They behaved consistently, with a weakening and decreasing trend from 1961 to 1984 and a strengthening and increasing trend from 1985 to 2010. Thus, TPI_B was probably an important factor in the abrupt change in both temperature and precipitation extremes in the ARNC.

DOI

[11]
Chen Y N, Li Z, Fan Y T et al., 2015. Progress and prospects of climate change impacts on hydrology in the arid region of Northwest China.Environmental Research, 139: 11-19. doi: 10.1016/j.envres.2014.12.029.61The sharp increasing of temperature has turned to hiatus since the 21st century.61Precipitation sharply increased in 1987, since then has been in a high volatility.61Negative effects of global warming on the ecology have been highlighted.61The amount of surface water will probably remain at a high state of fluctuation.

DOI PMID

[12]
Chen Y N, Li Z, Li W H et al., 2016. Water and ecological security: Dealing with hydroclimatic challenges at the heart of China’s Silk Road.Environmental Earth Sciences, 75: 881. doi: 10.1007/s12665-016-5385-z.The Tarim Basin is the heart of China’s Silk Road Economic Belt. The contradiction between economic growth and environmental protection is particularly evident in the basin region. For the past...

DOI

[13]
Cheng H, Spötl C, Breitenbach S F M et al., 2016. Climate variations of Central Asia on orbital to millennial timescales.Scientific Reports, 6: 36975. doi: 10.1038/srep36975.The extent to which climate variability in Central Asia is causally linked to large-scale changes in the Asian monsoon on varying timescales remains a longstanding question. Here we present precisely dated high-resolution speleothem oxygen-carbon isotope and trace element records of Central Asia’s hydroclimate variability from Tonnel’naya cave, Uzbekistan, and Kesang cave, western China. On orbital timescales, the supra-regional climate variance, inferred from our oxygen isotope records, exhibits a precessional rhythm, punctuated by millennial-scale abrupt climate events, suggesting a close coupling with the Asian monsoon. However, the local hydroclimatic variability at both cave sites, inferred from carbon isotope and trace element records, shows climate variations that are distinctly different from their supra-regional modes. Particularly, hydroclimatic changes in both Tonnel’naya and Kesang areas during the Holocene lag behind the supra-regional climate variability by several thousand years. These observations may reconcile the apparent out-of-phase hydroclimatic variability, inferred from the Holocene lake proxy records, between Westerly Central Asia and Monsoon Asia.

DOI PMID

[14]
Cohen J, Saito K, Entekhabi D, 2001. The role of the Siberian High in Northern Hemisphere climate variability.Geophysical Research Letters, 28: 299-302. doi: 10.1029/2000GL011927.The dominant mode of sea level pressure (SLP) variability during the winter months in the Northern Hemisphere (NH) is characterized by a dipole with one anomaly center covering the Arctic with the opposite sign anomaly stretched across the mid-latitudes. Associated with the SLP anomaly, is a surface temperature anomaly induced by the anomalous circulation. We will show that this anomaly pattern originates in the early fall, on a much more regional scale, in Siberia. As the season progresses this anomaly pattern propagates and amplifies to dominate much of the extratropical NH, making the Siberian high a dominant force in NH climate variability in winter. Also since the SLP and surface temperature anomalies originate in a region of maximum fall snow cover variability, we argue that snow cover partially forces the phase of winter variability and can potentially be used for the skillful prediction of winter climate.

DOI

[15]
Deng H J, Chen Y N, Shi X et al., 2014. Dynamics of temperature and precipitation extremes and their spatial variation in the arid region of Northwest China.Atmospheric Research, 138: 346-355. doi: 10.1016/j.atmosres.2013.12.001.61Precipitation indices have strong regional variation.61Temperature indices had significant positive trends in the entire region.61Climate extremes are major factors for the rise of climate average state.

DOI

[16]
Diffenbaugh N S, Singh D, Mankin J S et al., 2017. Quantifying the influence of global warming on unprecedented extreme climate events.Proceedings of the National Academy of Sciences, 114: 4881-4886. doi: 10.1073/pnas.1618082114.Abstract Efforts to understand the influence of historical global warming on individual extreme climate events have increased over the past decade. However, despite substantial progress, events that are unprecedented in the local observational record remain a persistent challenge. Leveraging observations and a large climate model ensemble, we quantify uncertainty in the influence of global warming on the severity and probability of the historically hottest month, hottest day, driest year, and wettest 5-d period for different areas of the globe. We find that historical warming has increased the severity and probability of the hottest month and hottest day of the year at >80% of the available observational area. Our framework also suggests that the historical climate forcing has increased the probability of the driest year and wettest 5-d period at 57% and 41% of the observed area, respectively, although we note important caveats. For the most protracted hot and dry events, the strongest and most widespread contributions of anthropogenic climate forcing occur in the tropics, including increases in probability of at least a factor of 4 for the hottest month and at least a factor of 2 for the driest year. We also demonstrate the ability of our framework to systematically evaluate the role of dynamic and thermodynamic factors such as atmospheric circulation patterns and atmospheric water vapor, and find extremely high statistical confidence that anthropogenic forcing increased the probability of record-low Arctic sea ice extent.

DOI PMID

[17]
Donat M G, Lowry A L, Alexander L V et al., 2016. More extreme precipitation in the world’s dry and wet regions.Nature Climate Change, 6: 508-513. doi: 10.1038/NCLIMATE2941.Extreme precipitation over land has increased over the wettest and driest regions and is likely to keep intensifying over the twenty-first century. This has key implications for dry regions, which may be unprepared for the potential related flooding.

DOI

[18]
Donat M G, Peterson T C, Brunet M et al., 2014. Changes in extreme temperature and precipitation in the Arab region: Long-term trends and variability related to ENSO and NAO.International Journal of Climatology, 34: 581-592. doi: 10.1002/joc.3707.A workshop was held in Casablanca, Morocco, in March 2012, to enhance knowledge of climate extremes and their changes in the Arab region. This workshop initiated intensive data compilation activities of daily observational weather station data from the Arab region. After conducting careful control processes to ensure the quality and homogeneity of the data, climate indices for extreme temperatures and precipitation were calculated.This study examines the temporal changes in climate extremes in the Arab region with regard to long-term trends and natural variability related to ENSO and NAO. We find consistent warming trends since the middle of the 20th Century across the region. This is evident in the increased frequencies of warm days and warm nights, higher extreme temperature values, fewer cold days and cold nights and shorter cold spell durations. The warming trends seem to be particularly strong since the early 1970s. Changes in precipitation are generally less consistent and characterised by a higher spatial and temporal variability; the trends are generally less significant. However, in the western part of the Arab region, there is a tendency towards wetter conditions. In contrast, in the eastern part, there are more drying trends, although, these are of low significance.We also find some relationships between climate extremes in the Arab region and certain prominent modes of variability, in particular El Ni o-Southern Oscillation (ENSO) and North Atlantic Oscillation (NAO). The relationships of the climate extremes with NAO are stronger, in general, than those with ENSO, and are particularly strong in the western part of the Arab region (closer to the Atlantic Ocean). The relationships with ENSO are found to be more significant towards the eastern part of the area of study. 2013 Royal Meteorological Society

DOI

[19]
Dugmore A J, Borthwick D M, Church M J et al., 2007. The role of climate in settlement and landscape change in the North Atlantic Islands: An assessment of cumulative deviations in high-resolution proxy climate records.Human Ecology, 35: 169-178. doi: 10.1007/s10745-006-9051-z.In order to assess possible contributions of climate change to the human ecology of the North Atlantic islands we evaluate the utility of cumulative deviations from the mean, calculated for the Greenland ice core storm frequency proxy (GISP2 Na+) and sea ice proxy (GISP2 chloride excess). Our aim is to identify episodes of unpredictable change in the context of long-term trends of cultural and environmental development. Key changes are identified in the proxy climate records in 975 and 980 AD, 1025 and 1040 AD, 1180 AD, 1425 and 1450 AD, and 1520 and 1525 AD. Some of these changes are consistent with those inferred from new studies of the palaeoecological record of the Faroes. This indicates that the cumulative deviation measure could give greatest prominence to the most important climate changes affecting landscapes and settlement (such as the changes of 1425 and 1450 AD and their immediate aftermath), rather than extreme events, such as great single storms.

DOI

[20]
Easterling D R, Meehl G A, Parmesan C et al., 2000. Climate extremes: Observations, modeling, and impacts.Science, 289, 2068-2074. doi: 10.1126/science.289.5487.2068.http://www.sciencemag.org/cgi/doi/10.1126/science.289.5487.2068

DOI PMID

[21]
Frachetti M D, Smith C E, Traub C M et al., 2017. Nomadic ecology shaped the highland geography of Asia’s Silk Roads.Nature, 543: 193-198. doi: 10.1038/nature21696.Abstract There are many unanswered questions about the evolution of the ancient 'Silk Roads' across Asia. This is especially the case in their mountainous stretches, where harsh terrain is seen as an impediment to travel. Considering the ecology and mobility of inner Asian mountain pastoralists, we use 'flow accumulation' modelling to calculate the annual routes of nomadic societies (from 750090009m to 4,000090009m elevation). Aggregating 500 iterations of the model reveals a high-resolution flow network that simulates how centuries of seasonal nomadic herding could shape discrete routes of connectivity across the mountains of Asia. We then compare the locations of known high-elevation Silk Road sites with the geography of these optimized herding flows, and find a significant correspondence in mountainous regions. Thus, we argue that highland Silk Road networks (from 750090009m to 4,000090009m) emerged slowly in relation to long-established mobility patterns of nomadic herders in the mountains of inner Asia.

DOI PMID

[22]
Gong D Y, Ho C H, 2002. The Siberian High and climate change over middle to high latitude Asia.Theoretical and applied climatology, 72(1): 1-9. doi: 10.1007/s007040200008.The Siberian High is the most important atmospheric centre of action in Eurasia during the winter months. Here its variability and relationship with temperature and precipitation is investigated for the period 1922 to 2000. The pronounced weakening of the Siberian High during the last 656520 years is its most remarkable feature. Mean temperature, averaged over middle to high latitude Asia (30°65E–140°65E, 30°65N–70°65N), is correlated with the Siberian High central intensity (SHCI) with correlation coefficient of 61650.58 (1922–1999), and for precipitation, the correlation coefficient is 61650.44 (1922–1998). Taking the Arctic Oscillation (AO), the SHCI, the Eurasian teleconnection pattern (EU), and the Southern Oscillation (SO) index into account, 72 percent of the variance in temperature can be explained for the period 1949–1997 (for precipitation the variance is 26 percent), with the AO alone explaining 30 percent of the variance, and the Siberian High contributing 24 percent. The precipitation variance explained by the Siberian High is only 9.8 percent of the total.

DOI

[23]
Greve P, Orlowsky B, Mueller B et al., 2014. Global assessment of trends in wetting and drying over land.Nature Geoscience, 7: 716-721. doi: 10.1038/NGEO2247.Changes in the hydrological conditions of the land surface have substantial impacts on society1, 2. Yet assessments of observed continental dryness trends yield contradicting results3, 4, 5, 6, 7. The concept that dry regions dry out further, whereas wet regions become wetter as the climate warms has been proposed as a simplified summary of expected8, 9, 10 as well as observed10, 11, 12, 13, 14 changes over land, although this concept is mostly based on oceanic data8, 10. Here we present an analysis of more than 300 combinations of various hydrological data sets of historical land dryness changes covering the period from 1948 to 2005. Each combination of data sets is benchmarked against an empirical relationship between evaporation, precipitation and aridity. Those combinations that perform well are used for trend analysis. We find that over about three-quarters of the global land area, robust dryness changes cannot be detected. Only 10.8% of the global land area shows a robust ry gets drier, wet gets wetter pattern, compared to 9.5% of global land area with the opposite pattern, that is, dry gets wetter, and wet gets drier. We conclude that aridity changes over land, where the potential for direct socio-economic consequences is highest, have not followed a simple intensification of existing patterns.

DOI

[24]
Hansen J, Ruedy R, Sato M et al., 2010. Global surface temperature change. Reviews of Geophysics, 48: RG4004. doi: 10.1029/2010RG000345.

[25]
Harris I P D J, Jones P D, Osborn T J et al., 2014. Updated high-resolution grids of monthly climatic observations: The CRU TS3. 10 Dataset.International Journal of Climatology, 34(3): 623-642. doi: 10.1002/joc.3711.

DOI

[26]
Herold N, Behrangi A, Alexander L V, 2017. Large uncertainties in observed daily precipitation extremes over land.Journal of Geophysical Research: Atmospheres, 122: 668-681. doi: 10.1002/2016JD025842.We explore uncertainties in observed daily precipitation extremes over the terrestrial tropics and subtropics (50°S-50°N) based on five commonly used products: the Climate Hazards Group InfraRed Precipitation with Stations (CHIRPS) dataset, the Global Precipitation Climatology Centre-Full Data Daily (GPCC-FDD) dataset, the Tropical Rainfall Measuring Mission (TRMM) multi-satellite research product (T3B42 v7), the Precipitation Estimation from Remotely Sensed Information using Artificial Neural Networks-Climate Data Record (PERSIANN-CDR), and the Global Precipitation Climatology Project's One-Degree Daily (GPCP-1DD) dataset. We use the precipitation indices R10mm and Rx1day, developed by the Expert Team on Climate Change Detection and Indices, to explore the behavior of "moderate" and "extreme" extremes, respectively. In order to assess the sensitivity of extreme precipitation to different grid sizes we perform our calculations on four common spatial resolutions (0.25° × 0.25°, 1° × 1°, 2.5° × 2.5°, and 3.75° × 2.5°). The impact of the chosen "order of operation" in calculating these indices is also determined. Our results show that moderate extremes are relatively insensitive to product and resolution choice, while extreme extremes can be very sensitive. For example, at 0.25° × 0.25° quasi-global mean Rx1day values vary from 37 mm in PERSIANN-CDR to 62 mm in T3B42. We find that the interproduct spread becomes prominent at resolutions of 1°× 1° and finer, thus establishing a minimum effective resolution at which observational products agree. Without improvements in interproduct spread, these exceedingly large observational uncertainties at high spatial resolution may limit the usefulness of model evaluations. As has been found previously, resolution sensitivity can be largely eliminated by applying an order of operation where indices are calculated prior to regridding. However, this approach is not appropriate when true area averages are desired (e.g., for model evaluations).

DOI

[27]
Howard K W F, Howard K K, 2016. The new “Silk Road Economic Belt” as a threat to the sustainable management of Central Asia’s transboundary water resources.Environmental Earth Sciences, 75: 976. doi: 10.1007/s12665-016-5752-9.Abstract Central Asia is well known for its history of water mismanagement. The rapid, catastrophic demise of the Aral Sea is testament to the unsustainable water diversion practices introduced by the Soviet Union in the 1960s and the failure of the five sovereign nations, Kazakhstan, Kyrgyzstan, Uzbekistan, Tajikistan and Turkmenistan, that inherited responsibility for Central Asia’s ailing resources, to develop the types of program necessary for the sustainable management of what had become a shared “transboundary” water resource. Although nearly 25 years have passed since the break-up of the Soviet Union, rivalry and deep mistrust between the guardian nations of Central Asia’s water resources remains a serious impediment to achieving the level of cooperation necessary for constructive, water management and decision-making. This is a grave concern given the anticipated impacts of climate change and natural population growth on water in the region. For many Asians, the recently proposed new “Silk Road Economic Belt” is viewed as an immense opportunity to bring wealth and prosperity to some of the poorest regions of China and Central Asia. However, given Central Asia’s appalling record of water management, there is little confidence that the project’s water needs can be adequately met. In effect, the new “Silk Road Economic Belt” and the rapid growth it will bring to the region, represents a serious long-term threat to the sustainable management of Central Asia’s transboundary water resources. The fundamental concern is that the project may place too great a burden on a water management system in Central Asia that is seriously dysfunctional and shows no sign of improvement. Central Asian countries need to recognise that the economic success of the “Silk Road Economic Belt” hinges on their ability to develop programs that can ensure the region’s water resources are managed in a sound and sustainable manner. This will be a difficult challenge and will require cooperation amongst the countries of Central Asia that goes far beyond what currently seems possible. Major reforms are necessary and external pressures from neighbouring Russia and China are likely required to make this happen. It is also essential that the project be supported by sound science and good hydrological data, both of which are seriously lacking in the region. There will be a need to invest in scientific research in the relevant fields. With judicious planning, good science and a commitment amongst the nations of Central Asia to create a shared vision and collaborate towards a common goal, the “New Silk Road” can be developed both beneficially and sustainably.

DOI

[28]
Hu Z, Hu Q, Zhang C et al., 2016. Evaluation of reanalysis, spatially interpolated and satellite remotely sensed precipitation data sets in Central Asia.Journal of Geophysical Research: Atmospheres, 121: 5648-5663. doi: 10.1002/2016JD024781.Abstract Accuracy of any gridded climatic datasets is as important as their availability for regional climate and ecological studies. In this study, the accuracy of estimated precipitation in Central Asia from three recently developed reanalysis datasets, MERRA, ERA-Interim and CFSR, is evaluated through comparisons with observations from 399 stations during 1979-2010. An interpolated precipitation dataset from station observations and a satellite remotely-sensed dataset, TRMM 3B42, are included in the evaluation. Major results show that MERRA data have higher accuracy than ERA-Interim and CFSR, although they all overestimate the observed precipitation especially in late spring and early summer months, suggesting errors in their ways of representing convective precipitation in that region. In comparison, the interpolated and satellite sensed data, which provide no upper air information/data, have higher accuracy. While all these datasets have difficulty in describing stations precipitation in mountainous areas, the reanalysis datasets have particularly large discrepancies. In examining the discrepancy in the reanalysis data, a Precipitation-Topography Partial Least Square method is proposed to incorporate certain terrain/geographic effects on precipitation in mapping the gridded data to the station locations for comparison with the observation. The outcome suggests the estimated station precipitation by this new method is closer to the observed than the method without considering those factors. The improvement by this method and by possible other methods taking into account different details/aspects of the influences indicates that it is only meaningful to compare the accuracy or relevance of gridded datasets to station observations in a relative sense among various datasets.

DOI

[29]
Hu Z Y, Zhang C, Hu Q et al., 2014. Temperature changes in Central Asia from 1979 to 2011 based on multiple datasets.Journal of Climate, 27: 1143-1167.The arid and semiarid region in central Asia is sensitive and vulnerable to climate variations. However, the sparse and highly unevenly distributed meteorological stations in the region provide limited data for understanding of the region’s climate variations. In this study, the near-surface air temperature change in central Asia from 1979 to 2011 was examined using observations from 81 meteorological stations, three local observation validated reanalysis datasets of relatively high spatial resolutions, and the Climate Research Unit (CRU) dataset. Major results suggested that the three reanalysis datasets match well with most of the local climate records, especially in the low-lying plain areas. The consensus of the multiple datasets showed significant regional surface air temperature increases of 0.36°–0.42°Cdecade-1 in the past 33 years. No significant contributions from declining irrigation and urbanization to temperature change were found. The rate is larger in recent years than in the early years in the study period. Additionally, unlike in many regions in the world, the temperature in winter showed no increase in central Asia in the last three decades, a noticeable departure from the global trend in the twentieth century. The largest increase in surface temperature was occurring in the spring season. Analyses further showed a warming center in the middle of the central Asian states and weakened temperature variability along the northwest–southeast temperature gradient from the northern Kazakhstan to southern Xinjiang. The reanalysis datasets also showed significant negative correlations between temperature increase rate and elevation in this complex terrain region.

DOI

[30]
IPCC, 2012. Managing the risks of extreme events and disasters to advance climate change adaptation. In: Field C B, Barros V, Stocker T F et al. A Special Report Working Groups I and II of the Intergovernmental Panel on Climate Change. Cambridge, UK, and New York, NY, USA: Cambridge University Press, 109-290.

[31]
IPCC, 2013: Summary for policymakers. In: Climate Change 2013: The Physical Science Basis. Contribution of Working Group I to the Fifth Assessment Report of the Intergovernmental Panel on Climate Change. In: Stocker T F, Qin D, Plattner G-Ket al. eds. Cambridge, United Kingdom and New York, NY, USA: Cambridge University Press.

[32]
Jeong J-H, Ou T, Linderholm H W et al., 2011. Recent recovery of the Siberian High intensity.Journal of Geophysical Research: Atmospheres, 116: D23102. doi: 10.1029/2011JD015904.1] This study highlights the fast recovery of the wintertime Siberian High intensity (SHI) over the last two decades. The SHI showed a marked weakening trend from the 1970s to 1980s, leading to unprecedented low SHI in the early 1990s according to most observational data sets. This salient declining SHI trend, however, was sharply replaced by a fast recovery over the last two decades. Since the declining SHI trend has been considered as one of the plausible consequences of climate warming, the recent SHI recovery seemingly contradicts the continuous progression of climate warming in the Northern Hemisphere. We suggest that alleviated surface warming and decreased atmospheric stability in the central Siberia region, associated with an increase in Eurasian snow cover, in the recent two decades contributed to this rather unexpected SHI recovery. The prominent SHI change, however, is not reproduced by general circulation model (GCM) simulations used in the IPCC AR4. The GCMs indicate the steady weakening of the SHI for the entire 21st century, which is found to be associated with a decreasing Eurasian snow cover in the simulations. An improvement in predicting the future climate change in regional scale is desirable.

DOI

[33]
Jones P D, Lister D H, Osborn T J et al., 2012. Hemispheric and large-scale land-surface air temperature variations: An extensive revision and an update to 2010.Journal of Geophysical Research: Atmospheres, 117: D05127.[1] This study is an extensive revision of the Climatic Research Unit (CRU) land station temperature database that has been used to produce a grid-box data set of 500° latitude 0103 500° longitude temperature anomalies. The new database (CRUTEM4) comprises 5583 station records of which 4842 have enough data for the 19610900091990 period to calculate or estimate the average temperatures for this period. Many station records have had their data replaced by newly homogenized series that have been produced by a number of studies, particularly from National Meteorological Services (NMSs). Hemispheric temperature averages for land areas developed with the new CRUTEM4 data set differ slightly from their CRUTEM3 equivalent. The inclusion of much additional data from the Arctic (particularly the Russian Arctic) has led to estimates for the Northern Hemisphere (NH) being warmer by about 0.100°C for the years since 2001. The NH/Southern Hemisphere (SH) warms by 1.1200°C/0.8400°C over the period 19010900092010. The robustness of the hemispheric averages is assessed by producing five different analyses, each including a different subset of 20% of the station time series and by omitting some large countries. CRUTEM4 is also compared with hemispheric averages produced by reanalyses undertaken by the European Centre for Medium-Range Weather Forecasts (ECMWF): ERA-40 (19580900092001) and ERA-Interim (19790900092010) data sets. For the NH, agreement is good back to 1958 and excellent from 1979 at monthly, annual, and decadal time scales. For the SH, agreement is poorer, but if the area is restricted to the SH north of 6000°S, the agreement is dramatically improved from the mid-1970s.

DOI

[34]
Karl T R, Easterling D R, 1999. Climate extremes: Selected review and future research directions.Climatic Change, 42: 309-325. doi: 10.1007/978-94-015-9265-9_17.Trends and multi-decadal variations of weather and climate extremes have only recently received attention from the climate community. Interest has stemmed from exponentially increasing economic losses related to climate and weather extremes, and apparent increases in deaths attributed to these events, suggesting that key decision makers need a better understanding of the potential uses of climate information. The need for data on climate extremes in disaster mitigation activities such as the International Decade for Natural Disaster Reduction also has provided another motivation for focus in this area. The losses cited above raise questions as to whether extreme weather events are actually increasing in frequency, whether society as a whole is becoming more vulnerable to extreme weather events, whether public perception has been unduly influenced by enhanced media attention, or some combination. Given these questions, of particular interest here is the extent to which we can document changes in climate and weather extremes. Attribution of ongoing trends to specific climate forcings, such as anthropogenic effects or other factors related to natural climate variability are still equivocal. For some areas and variables increases in the frequency of extreme events are apparent, while in other areas there are suggestions of declines in these events. A review of this information suggests that further understanding of the cause(s) of the apparent changes in climate and weather extremes is strongly dependent upon progress in our ability to monitor and detect these multi-decadal trends. Based on these analyses we show that this will likely require increased attention in the following areas: 1) The development of more effective international data exchange for high resolution historical climate and weather records, 2) Increased emphasis on rescuing data with appropriate resolution from deteriorating manuscripts and other non-electronic media, 3) A greater emphasis on removing inhomogeneities in the instrumental record and ongoing weather monitoring programs (that provide much of our information about changes and variations of weather and climate extremes), 4) More effective use of space-based measurements and reanalysis products derived from models, 5) More robust monitoring of local extreme weather events such as tornadoes, hail, lightning, and wind, and 6) More effective means to integrate and communicate information about what we know and do not know about changes in climate extremes. Progress in each of these areas is reviewed in context with outstanding remaining challenges, and the benefits that can be expected if we meet these requirements.

DOI

[35]
Kendall M G, 1975. Rank Correlation Measures. London: Charles Griffin, 202.

[36]
Kim Y H, Min S K, Zhang X et al., 2016. Attribution of extreme temperature changes during 1951-2010.Climate Dynamics, 46(5/6): 1769-1782. doi: 10.1007/s00382-015-2674-2.An attribution analysis of extreme temperature changes is conducted using updated observations (HadEX2) and multi-model climate simulation (CMIP5) datasets for an extended period of 1951 2010. Compared to previous HadEX/CMIP3-based results, which identified human contributions to the observed warming of extreme temperatures on global and regional scales, the current results provide better agreement with observations, particularly for the intensification of warm extremes. Removing the influence of two major modes of natural internal variability (the Arctic Oscillation and Pacific Decadal Oscillation) from observations further improves attribution results, reducing the model-observation discrepancy in cold extremes. An optimal fingerprinting technique is used to compare observed changes in annual extreme temperature indices of coldest night and day (TNn, TXn) and warmest night and day (TNx, TXx) with multi-model simulated changes that were simulated under natural-plus-anthropogenic and natural-only (NAT) forcings. Extreme indices are standardized for better intercomparisons between datasets and locations prior to analysis and averaged over spatial domains from global to continental regions following a previous study. Results confirm previous HadEX/CMIP3-based results in which anthropogenic (ANT) signals are robustly detected in the increase in global mean and northern continental regional means of the four indices of extreme temperatures. The detected ANT signals are also clearly separable from the response to NAT forcing, and results are generally insensitive to the use of different model samples as well as different data availability.

DOI

[37]
King A D, Alexander L V, Donat M G, 2013. The efficacy of using gridded data to examine extreme rainfall characteristics: A case study for Australia.International Journal of Climatology, 33: 2376-2387. doi: 10.1002/joc.3588.A 0.05 0.05 gridded dataset of daily observed rainfall is compared with high-quality station data at 119 sites across Australia for performance in capturing extreme rainfall characteristics. A range of statistics was calculated and analysed for a selection of extreme indices representing the frequency and intensity of heavy rainfall events, and their contribution to total rainfall. As is often found for interpolated data, we show that the gridded dataset tends to underestimate the intensity of extreme heavy rainfall events and the contribution of these events to total annual rainfall as well as overestimating the frequency and intensity of very low rainfall events. The interpolated dataset captures the interannual variability in extreme indices. The spatial extent of significant trends in the frequency of extreme rainfall events is also reproduced to some degree. An investigation into the performance of this gridded dataset in remote areas reveals issues, such as the appearance of spurious trends, when stations come in and out of use. We recommend masking over areas of low station density for this particular gridded data. It is likely that in areas of low station density, gridded datasets will, in general, not perform as well. Therefore, caution should be exercised when examining trends and variability in these regions. We conclude that this gridded product is suitable for use in studies on trends and variability in rainfall extremes across much of Australia. The methodology employed in this study, to examine extreme rainfall over Australia in a gridded dataset, may be applied to other areas of the world. While our study indicates that, in general, gridded datasets can be used to investigate extreme rainfall trends and variability, the data should first be subjected to tests similar to those employed here.

DOI

[38]
Klein Tank A M G, Peterson T C, Quadir D A et al., 2006. Changes in daily temperature and precipitation extremes in Central and South Asia.Journal of Geophysical Research, 111: D16105. doi: 10.1029/2005JD006316.ABSTRACT 1] Changes in indices of climate extremes are studied on the basis of daily series of temperature and precipitation observations from 116 meteorological stations in central and south Asia. Averaged over all stations, the indices of temperature extremes indicate warming of both the cold tail and the warm tail of the distributions of daily minimum and maximum temperature between 1961 and 2000. For precipitation, most regional indices of wet extremes show little change in this period as a result of low spatial trend coherence with mixed positive and negative station trends. Relative to the changes in the total amounts, there is a slight indication of disproportionate changes in the precipitation extremes. Stations with near-complete data for the longer period of 1901 2000 suggest that the recent trends in extremes of minimum temperature are consistent with long-term trends, whereas the recent trends in extremes of maximum temperature are part of multidecadal climate variability.

DOI

[39]
Li B F, Chen Y N, Chen Z S et al., 2016a. Why does precipitation in Northwest China show a significant increasing trend from 1960 to 2010?Atmospheric Research, 167: 275-284. doi: 10.1016/j.atmosres.2015.08.017.Based on monthly precipitation data from 74 weather stations in the arid region of northwest China, we employed statistical methods to analyse the characteristics of precipitation and investigated the relationships between precipitation and 11 atmospheric circulations. The results showed that the precipitation in northwest China had a significantly increasing trend (P < 0.01), at a rate of 0.61 mm/year, which is higher than the average rate of China (- 0.16 mm/year) for the same period. Annual precipitation increased markedly after 1987, but the increase in precipitation gradually declined from north to south and from west to east. We found that the precipitation variation in spring, summer, autumn, and winter plays an important role in the yearly change, accounting for 21.6%, 42.4%, 18.4%, and 17.6%, respectively. The correlation analysis indicated that the annual precipitation revealed strong and significant associations with the West Pacific Subtropical High (WPSH, R = 0.60, P < 0.001) and the North America Subtropical High (NASH, R = 0.57, P < 0.001) from 1960 to 2010. We therefore suggest that the strengthening of the WPSH and NASH after the mid-1980s is probably the main cause for the significant increasing trend of precipitation in northwest China.

DOI

[40]
Li B F, Chen Y N, Shi X, 2012. Why does the temperature rise faster in the arid region of Northwest China?Journal of Geophysical Research: Atmospheres, 117: D16115. doi: 10.1029/2012JD017953.

[41]
Li P Y, Qian H, Howard K W F et al., 2015a. Building a new and sustainable “Silk Road Economic Belt”.Environmental Earth Sciences, 74: 7267. doi: 10.1007/s12665-015-4739-2.

DOI

[42]
Li P Y, Qian H, Zhou W, 2017. Finding harmony between the environment and humanity: An introduction to the thematic issue of the Silk Road.Environmental Earth Sciences, 76: 105. doi: 10.1007/s12665-017-6428-9.The Silk Road initiative is both exciting and controversial, as it may bring environmental degradation and water resources concerns, and at the same time it promotes swift economic growth in poverty-s

DOI

[43]
Li Z, Chen Y N, Li W H et al., 2015b. Potential impacts of climate change on vegetation dynamics in Central Asia.Journal of Geophysical Research: Atmospheres, 120: 12345-12356. doi: 10.1002/2015JD023618.Observations indicate that although average temperatures in Central Asia showed almost no increases from 1997 to 2013, they have been in a state of high variability. Despite the lack of a clear increasing trend, this 15 year period is still the hottest in nearly half a century. Precipitation in Central Asia remained relatively stable from 1960 to 1986 and then showed a sharp increase in 1987. Since the beginning of the 21st century, however, the increasing rate of precipitation has diminished. Dramatic changes in meteorological conditions could potentially have a strong impact on the region's natural ecosystems, as some significant changes have already occurred. Specifically, the normalized difference vegetation index (NDVI) of natural vegetation in Central Asia during 1982-2013 exhibited an increasing trend at a rate of 0.004 per decade prior to 1998, after which the trends reversed, and the NDVI decreased at a rate of 0.003 per decade. Moreover, our results indicate that shrub cover and patch size exhibited a significant increase in 2000-2013 compared to the 1980s-1990s, including shrub encroachment on grasslands. Over the past 10 years, 8% of grassland has converted to shrubland. Precipitation increased in the 1990s, providing favorable conditions for vegetation growth, but precipitation slightly reduced at the end of the 2000s. Meanwhile, warming intensified 0.93 C since 1997 compared to the average value in 1960-1997, causing less moisture to be available for vegetation growth in Central Asia.

DOI

[44]
Li Z, Chen Y N, Wang Y et al., 2016b. Drought promoted the disappearance of civilizations along the ancient Silk Road.Environmental Earth Sciences, 75: 1116. doi: 10.1007/s12665-016-5925-6.Understanding the reasons of the disappearance of oasis civilizations along the ancient Silk Road will provide useful references for human’s adaptation to environmental changes in the extreme arid regions in the nowadays and future. Although some studies have associated the demise of complex societies with deteriorating climate in the world, the demise of the civilizations along the ancient Silk Road has remained unresolved. Here, this paper used the nearly 200002years of climate characteristics revealed by Guliya ice cores, combined with the reconstruction of temperature from tree rings located in the west Kunlun Mountains around the Tarim Basin to examine the climate variations in the Northwestern China in the historical periods. Then this paper compared the demise time of the ancient oases civilizations along the ancient Silk Road from the relevant annals of states and counties. The results showed that climate change may be responsible for the rise and demise of past oasis civilizations in the ancient Silk Road. The periods of fourth to fifth centuries and the seventh to eighth centuries were characterized by long-term drought accompanied by cold climate; five ancient oases and seven ancient oases were demised, respectively, during these periods. Cold–dry climate could cause a deficiency in water resources for irrigation; thus, agricultural production fell and the society was destabilized. Recently, creation of a new “Silk Road economic belt” is realized. Modern oases will face more serious threat under the climate change. The region’s irrigation area increased 67.202% over the past 3002years. The agricultural sector consumes 9302% of regional renewable water resources. Once the drought occurred, many modern oases—like their ancient counterparts—may well trigger more civil uprising and violent conflict in the already water-stressed regions.

DOI

[45]
Lioubimtseva E, Cole R, Adams J M et al., 2005. Impacts of climate and land-cover changes in arid lands of Central Asia.Journal of Arid Environments, 62: 285-308. doi: 10.1016/j.jaridenv.2004.11.005.Despite the growing understanding of the global climate change, great uncertainties exist in the prediction of responses of and regions to global and regional, natural and human-induced climate change. Meteorological data series show a steady increase of annual and winter temperatures in Central Asia since the beginning of the 20th century that might have a strong potential impact on the region's natural ecosystems, agricultural crops, and human health. Analyses of the NOAA AVHRR temporal series since the 1980s showed a decrease in aridity from 1991-2000 compared to 1982-1990. While most climate models agree that the temperature in and Central Asia will increase by 1-2 degrees C by 2030-2050, precipitation projections vary from one model to another and projected changes in the aridity index for different model runs show no consistent trend for this region.Local and regional human impacts in and zones can significantly modify surface albedo, as well as water exchange and nutrient cycles that could have impacts on the climatic system both at the regional and global scales. (c) 2005 Elsevier Ltd. All rights reserved.

DOI

[46]
Lioubimtseva E, Henebry G M, 2009. Climate and environmental change in arid Central Asia: Impacts, vulnerability, and adaptations.Journal of Arid Environments, 73: 963-977. doi: 10.1016/j.jaridenv.2009.04.022.Vulnerability to climate change and other hazards constitutes a critical set of interactions between society and environment. As transitional economies emerging from the collapse of the Soviet Union, the republics of Central Asia are particularly vulnerable due to (1) physical geography (which dominated by temperate deserts and semi-deserts), (2) relative underdevelopment resulting from an economic focus on monoculture agricultural exports before 1991, and (3) traumatic social, economic, institutional upheavals following independence. Aridity is expected to increase across the entire Central Asian region, but especially in the western parts of Turkmenistan, Uzbekistan, and Kazakhstan. Temperature increases are projected to be particularly high in summer and fall, accompanied by decreases in precipitation. We examine the concepts of vulnerability, adaptation, and mitigation in the context of climate change in Central Asia. We explore three major aspects of human vulnerability ood security, water stress, and human health nd propose a set of indicators suitable for their assessment. Non-climatic stresses are likely to increase regional vulnerability to climate change and reduce adaptive capacity due to resource deployment to competing needs.

DOI

[47]
Liu M X, Xu X L, Sun A Y et al., 2014. Is southwestern China experiencing more frequent precipitation extremes?Environmental Research Letters, 9: 064002. doi: 10.1088/1748-9326/9/6/064002.Climate extremes have and will continue to cause severe damages to buildings and natural environments around the world. A full knowledge of the probability of the climate extremes is important for the management and mitigation of natural hazards. Based on Mann-Kendall trend test and copulas, this study investigated the characteristics of precipitation extremes as well as their implications in southwestern China (Yunnan, Guangxi and Guizhou Province), through analyzing the changing trends and probabilistic characteristics of six indices, including the consecutive dry days, consecutive wet days, annual total wet day precipitation, heavy precipitation days (R25), max 5 day precipitation amount (Rx5) and the rainy days (RDs). Results showed that the study area had generally become drier (regional mean annual precipitation decreased by 11.4 mm per decade) and experienced enhanced precipitation extremes in the past 60 years. Relatively higher risk of drought in Yuanan and flood in Guangxi was observed, respectively. However, the changing trends of the precipitation extremes were not spatially uniform: increasing risk of extreme wet events for Guangxi and Guizhou, and increasing probability of concurrent extreme wet and dry events for Yunnan. Meanwhile, trend analyses of the 10 year return levels of the selected indices implied that the severity of droughts decreased in Yunnan but increased significantly in Guangxi and Guizhou, and the severity of floods increased in Yunnan and Guangxi in the past decades. Hence, the policy-makers need to be aware of the different characterizations and the spatial heterogeneity of the precipitation extremes.

DOI

[48]
Mann H B, 1945. Non-parametric tests against trend.Econometrica, 13: 245-259.

DOI

[49]
Mannig B, Müller M, Starke E et al., 2013. Dynamical downscaling of climate change in Central Asia.Global and Planetary Change, 110: 26-39. doi: 10.1016/j.gloplacha.2013.05.008.The high-resolution regional climate model (RCM) REMO has been implemented over the region of Central Asia, including western China. A model run forced by reanalysis data (1/2 degrees resolution), and two runs forced by a GCM (one run with 1/2 degrees and one run with 1/6 degrees resolution) have been realized. The model has been evaluated regarding its ability to simulate the mean climate of the period 1971-2000. It has been found that the spatial pattern of mean temperature and precipitation is simulated well by REMO. The REMO simulations are often closer to observational data than reanalysis data are, and show considerably higher spatial detail. The GCM-forced simulations extend to the year 2100 under the A1B scenario. The climate change signal of temperature is largest in winter in the northern part of the study area and over mountainous terrain. A warming up to 7 C is projected until the end of the 21st century. In summer, warming is strongest over the southern part of Central Asia. Changes in precipitation are spatially more heterogeneous. (C) 2013 Elsevier B.V. All rights reserved.

DOI

[50]
Markov K V, 1951. Is Middle and Central Asia getting drier?Geografgiz, 24: 98-116.

[51]
Menne M J, Durre I, Vose R S et al., 2012. An overview of the Global Historical Climatology Network-Daily Database.Journal of Atmospheric and Oceanic Technology, 29: 897-910.ABSTRACT A database is described that has been designed to fulfill the need for daily climate data over global land areas. The dataset, known as GlobalHistorical Climatology Network (GHCN)-Daily, was developed for a wide variety of potential applications, including climate analysis and monitoring studies that require data at a daily time resolution (e.g., assessments of the frequency of heavy rainfall, heat wave duration, etc.). The dataset contains records from over 80 000 stations in 180 countries and territories, and its processing system produces the official archive for U.S. daily data. Variables commonly include maximum and minimum temperature, total daily precipitation, snowfall, and snow depth; however, about two-thirds of the stations report precipitation only. Quality assurance checks are routinely applied to the full dataset, but the data are not homogenized to account for artifacts associated with the various eras in reporting practice at any particular station (i.e., for changes in systematic bias). Daily updates are provided for many of the station records in GHCN-Daily. The dataset is also regularly reconstructed, usually once per week, from its 201 data source components, ensuring that the dataset is broadly synchronized with its growing list of constituent sources. The daily updates and weekly reprocessed versions of GHCN-Daily are assigned a unique version number, and the most recent dataset version is provided on the GHCN-Daily website for free public access. Each version of the dataset is also archived at the NOAA/National Climatic Data Center in perpetuity for future retrieval.

DOI

[52]
Morice C P, Kennedy J J, Rayner N A et al., 2012. Quantifying uncertainties in global and regional temperature change using an ensemble of observational estimates: The HadCRUT4 data set.Journal of Geophysical Research: Atmospheres, 117: D08101. doi: 10.1029/2011JD017187.1] Recent developments in observational near-surface air temperature and sea-surface temperature analyses are combined to produce HadCRUT4, a new data set of global and regional temperature evolution from 1850 to the present. This includes the addition of newly digitized measurement data, both over land and sea, new sea-surface temperature bias adjustments and a more comprehensive error model for describing uncertainties in sea-surface temperature measurements. An ensemble approach has been adopted to better describe complex temporal and spatial interdependencies of measurement and bias uncertainties and to allow these correlated uncertainties to be taken into account in studies that are based upon HadCRUT4. Climate diagnostics computed from the gridded data set broadly agree with those of other global near-surface temperature analyses. Fitted linear trends in temperature anomalies are approximately 0.0700°C/decade from 1901 to 2010 and 0.1700°C/decade from 1979 to 2010 globally. Northern/southern hemispheric trends are 0.08/0.0700°C/decade over 1901 to 2010 and 0.24/0.1000°C/decade over 1979 to 2010. Linear trends in other prominent near-surface temperature analyses agree well with the range of trends computed from the HadCRUT4 ensemble members.

DOI

[53]
Nunes A N, Lourenço L, 2015. Precipitation variability in Portugal from 1960 to 2011.Journal of Geographical Sciences, 25(7): 784-800.

DOI

[54]
Omondi P A, Awange J L, Forootan E et al., 2014. Changes in temperature and precipitation extremes over the Greater Horn of Africa region from 1961 to 2010.International Journal of Climatology, 34(4): 1262-1277. doi: 10.1002/joc.3763.ABSTRACTRecent special reports on climate extremes have shown evidences of changes in the patterns of climate extremes at global, regional and local scales. Understanding the characteristics of climate extremes at regional and local levels is critical not only for the development of preparedness and early warning systems, but is also fundamental in the development of any adaptation strategies. There is still very limited knowledge regarding the past, present and future patterns of climate extremes in the Greater Horn of Africa (GHA). This study, which was supported by the World Bank Global Facility for Disaster Reduction and Recovery (WB-GFDRR) and implemented by the World Meteorological Organization, was organized in terms of three workshops with three main objectives; (1) analysis of daily rainfall and temperature extremes for ten countries in the GHA region using observed in situ data running from 1971 to 2006, (2) assessing whether the United Kingdom Met-office and Hadley centre Providing REgional Climates for Impact Studies (UK-PRECIS) modelling system can provide realistic representation of the past and present climate extremes as observed by available in situ data, and (3) studying the future regional climate extremes under different scenarios to further assess the expected changes in climate extremes. This paper, therefore, uses the outputs of these workshops and also includes post-workshop analyses to assess the changes of climate extremes within the GHA. The results showed a significant decrease in total precipitation in wet days greater than 1 m and increasing warm extremes, particularly at night, while cold extremes are decreasing. Considering a combination of geophysical models and satellite gravimetry observations from the Gravity Recovery and Climate Experiment (GRACE) mission in the frame of GRACE daily Kalman-smoothing models, for the years 2002 to 2010, we explored a decline in total water storage variations over the GHA.

DOI

[55]
Peterson T C, Heim R R, Hirsch R et al., 2013. Monitoring and understanding changes in heat waves, cold waves, floods, and droughts in the United States: State of knowledge.Bulletin of the American Meteorological Society, 94(6): 821-834. doi: 10.1175/BAMS-D-12-00066.1.Weather and climate extremes have been varying and changing on many different time scales. In recent decades, heat waves have generally become more frequent across the United States, while cold waves have been decreasing. While this is in keeping with expectations in a warming climate, it turns out that decadal variations in the number of U.S. heat and cold waves do not correlate well with the observed U.S. warming during the last century. Annual peak flow data reveal that river flooding trends on the century scale do not show uniform changes across the country. While flood magnitudes in the Southwest have been decreasing, flood magnitudes in the Northeast and north-central United States have been increasing. Confounding the analysis of trends in river flooding is multiyear and even multidecadal variability likely caused by both large-scale atmospheric circulation changes and basin-scale memory in the form of soil moisture. Droughts also have long-term trends as well as multiyear and decadal variability. Instrumental data indicate that the Dust Bowl of the 1930s and the drought in the 1950s were the most significant twentieth-century droughts in the United States, while tree ring data indicate that the megadroughts over the twelfth century exceeded anything in the twentieth century in both spatial extent and duration. The state of knowledge of the factors that cause heat waves, cold waves, floods, and drought to change is fairly good with heat waves being the best understood.

DOI

[56]
Pritchard H D, 2017. Asia’s glaciers are a regionally important buffer against drought.Nature, 545: 169-174. doi: 10.1038/nature22062.

DOI

[57]
Schiemann R, Lüthi D, Vidale P L et al., 2008. The precipitation climate of Central Asia: Intercomparison of observational and numerical data sources in a remote semiarid region.International Journal of Climatology, 28: 295-314. doi: 10.1002/joc.1532.The original article to which this Erratum refers was published in International Journal of Climatology.

DOI

[58]
Skansi M d l M, Brunet M, Sigró J et al., 2013. Warming and wetting signals emerging from analysis of changes in climate extreme indices over South America.Global and Planetary Change, 100: 295-307. doi: 10.1016/j.gloplacha.2012.11.004.78 Strong evidence for warming, wetting and intensified rainfall in South America 78 Cold (warm) extremes are decreasing (increasing) over the 1950–2010 period. 78 Local trends are spatially more coherent for temperature than for precipitation. 78 Precipitation is increasing, with SE South America and Amazonia contributing more. 78 Intensification of heavy rainy events over eastern part of the continent is found.

DOI

[59]
Stott P A, 2016. How climate change affects extreme weather events.Science, 352: 1517-1518. doi: 10.1126/science.aaf7271.

DOI

[60]
Stott P A, Christidis N, Otto F E Let al., 2016. Attribution of extreme weather and climate-related events.Wiley Interdisciplinary Reviews: Climate Change, 7(1): 23-41. doi: 10.1002/wcc.380.Unusual or extreme weather and climate-related events are of great public concern and interest, yet there are often conflicting messages from scientists about whether such events can be linked to climate change. There is clear evidence that climate has changed as a result of human-induced greenhouse gas emissions, and that across the globe some aspects of extremes have changed as a result. But this does not imply that human influence has significantly altered the probability of occurrence or risk of every recently observed weather or climate-related event, or that such events are likely to become significantly more or less frequent in the future. Conversely, it is sometimes stated that it is impossible to attribute any individual weather or climate-related event to a particular cause. Such a statement can be interpreted to mean that human-induced climate change could never be shown to be at least partly responsible for any specific weather event, either the probability of its occurrence or its magnitude. There is clear evidence from recent case studies that individual event attribution is a feasible, if challenging, undertaking. We propose a way forward, through the development of carefully calibrated physically-based assessments of observed weather and climate-related events, to identify changed risk of such events attributable to particular factors including estimating the contributions of factors to event magnitude. Although such event-specific assessments have so far only been attempted for a relatively small number of specific cases, we describe research under way, coordinated as part of the international Attribution of Climate-related Events (ACE) initiative, to develop the science needed to better respond to the demand for timely, objective, and authoritative explanations of extreme events. The paper considers the necessary components of a prospective event attribution system, reviews some specific case studies made to date (Autumn 2000 UK floods, summer 2003 European heatwave, annual 2008 cool US temperatures, July 2010 Western Russia heatwave) and discusses the challenges involved in developing systems to provide regularly updated and reliable attribution assessments of unusual or extreme weather and climate-related events.

DOI PMID

[61]
Trenberth K E, Fasullo J T, Shepherd T G, 2015. Attribution of climate extreme events.Nature Climate Change, 5: 725-730. doi: 10.1038/nclimate2657.There is a tremendous desire to attribute causes to weather and climate events that is often challenging from a physical standpoint. Headlines attributing an event solely to either human-induced climate change or natural variability can be misleading when both are invariably in play. The conventional attribution framework struggles with dynamically driven extremes because of the small signal-to-noise ratios and often uncertain nature of the forced changes. Here, we suggest that a different framing is desirable, which asks why such extremes unfold the way they do. Specifically, we suggest that it is more useful to regard the extreme circulation regime or weather event as being largely unaffected by climate change, and question whether known changes in the climate system's thermodynamic state affected the impact of the particular event. Some examples briefly illustrated include 'snowmaggedon' in February 2010, superstorm Sandy in October 2012 and supertyphoon Haiyan in November 2013, and, in more detail, the Boulder floods of September 2013, all of which were influenced by high sea surface temperatures that had a discernible human component.

DOI

[62]
Wang H J, Chen Y N, Chen Z S, 2013a. Spatial distribution and temporal trends of mean precipitation and extremes in the arid region, northwest of China, during 1960-2010.Hydrological Processes, 27: 1807-1818. doi: 10.1002/hyp.9339.On the basis of daily precipitation records at 76 meteorological stations in the arid region, northwest of China, the spatial and temporal distribution of mean precipitation and extremes were analysed during 19600900092010. The Mann090009Kendall trend test and linear least square method were utilized to detect monotonic trends and magnitudes in annual and seasonal mean precipitation and extremes. The results obtained indicate that both the mean precipitation and the extremes have increased except in consecutive dry days, which showed the opposite trend. The changes in amplitude of both mean precipitation and extremes show seasonal variability. On an annual basis, the number of rain days (R0.1) has significantly increased. Meanwhile, the precipitation intensity as reflected by simple daily intensity index (SDII), number of heavy precipitation days (R10), very wet days (R95p), max 1-day precipitation amount (RX1day) and max 5-day precipitation amount (RX5day) has also significantly increased. This suggests that the precipitation increase in the arid region is due to the increase in both precipitation frequency and intensity. Trends in extremes are very highly correlated with mean trends of precipitation. The spatial correlation between trends in extremes and trends in the mean is stronger for winter (DJF) than for annual and other seasons. The regional annual and seasonal precipitation and extremes are observed the step jump in mean in the late 1980s. Overall, the results of this study are good indicators of local climate change, which will definitely enhance human mitigation to natural hazards caused by precipitation extremes. Copyright 0008 2012 John Wiley & Sons, Ltd.

DOI

[63]
Wang H J, Chen Y N, Shi X et al., 2013b. Changes in daily climate extremes in the arid area of northwestern China.Theoretical and Applied Climatology, 112: 15-28. doi: 10.1007/s00704-012-0698-7.There has been a paucity of information on trends in daily climate and climate extremes, especially for the arid region. We analyzed the changes in the indices of climate extremes, on the basis of daily maximum and minimum air temperature and precipitation at 59 meteorological stations in the arid region of northwest China over the period 1960-2003. Twelve indices of extreme temperature and six indices of extreme precipitation are examined. Temperature extremes show a warming trend with a large proportion of stations having statistically significant trends for all temperature indices. The regional occurrence of extreme cool days and nights has decreased by -0.93 and -2.36 days/decade, respectively. Over the same period, the occurrence of extreme warm days and nights has increased by 1.25 and 2.10 days/decade, respectively. The number of frost days and ice days shows a statistically significant decrease at the rate of -3.24 and -2.75 days/decade, respectively. The extreme temperature indices also show the increasing trend, with larger values for the index describing variations in the lowest minimum temperature. The trends of Min Tmin (Tmax) and Max Tmin (Tmax) are 0.85 (0.61) and 0.32 (0.17) A degrees C/decade. Most precipitation indices exhibit increasing trends across the region. On average, regional maximum 1-day precipitation, annual total wet-day precipitation, and number of heavy precipitation days and very wet days show insignificant increases. Insignificant decreasing trends are also found for consecutive dry days. The rank-sum statistic value of most temperature indices exhibits consistent or statistically significant trends across the region. The regional medians after 1986 of Min Tmin (Tmax), Max Tmin (Tmax), warm days (nights), and warm spell duration indicator show statistically more larger than medians before 1986, but the frost days, ice days, cool days (nights), and diurnal temperature range reversed. The medians of precipitation indices show insignificant change except for consecutive dry days before and after 1986.

DOI

[64]
Wei W, Zhang R H, Wen Met al., 2017. Relationship between the Asian westerly jet stream and summer rainfall over Central Asia and North China: Roles of the Indian Monsoon and the South Asian High.Journal of Climate, 30: 537-552. doi: 10.1175/JCLI-D-15-0814.1.

DOI

[65]
Westra S, Alexander L V, Zwiers F W, 2013. Global increasing trends in annual maximum daily precipitation.Journal of Climate, 26: 3904-3918. doi: 10.1175/JCLI-D-12-00502.1.

DOI

[66]
Yatagai A, Kamiguchi K, Arakawa O et al., 2012. Constructing a long-term daily gridded precipitation dataset for Asia based on a dense network of rain gauges.Bulletin of the American Meteorological Society, 93: 1401-1415. doi: 10.1175/BAMS-D-11-00122.1.

DOI

[67]
You Q L, Kang S C, Aguilar E et al., 2008. Changes in daily climate extremes in the eastern and central Tibetan Plateau during 1961-2005.Journal of Geophysical Research: Atmospheres, 113: D07101. doi: 10.1029/2007jd009389.http://www.agu.org/pubs/crossref/2008/2007JD009389.shtml

DOI

[68]
You Q L, Kang S C, Aguilar E et al., 2011. Changes in daily climate extremes in China and their connection to the large scale atmospheric circulation during 1961-2003.Climate Dynamics, 36: 2399-2417. doi: 10.1007/s00382-009-0735-0.Based on daily maximum and minimum surface air temperature and precipitation records at 303 meteorological stations in China, the spatial and temporal distributions of indices of climate extremes are analyzed during 1961–2003. Twelve indices of extreme temperature and six of extreme precipitation are studied. Temperature extremes have high correlations with the annual mean temperature, which shows a significant warming of 0.27°C/decade, indicating that changes in temperature extremes reflect the consistent warming. Stations in northeastern, northern, northwestern China have larger trend magnitudes, which are accordance with the more rapid mean warming in these regions. Countrywide, the mean trends for cold days and cold nights have decreased by 610.47 and 612.0602days/decade respectively, and warm days and warm nights have increased by 0.62 and 1.7502days/decade, respectively. Over the same period, the number of frost days shows a statistically significant decreasing trend of 613.3702days/decade. The length of the growing season and the number of summer days exhibit significant increasing trends at rates of 3.04 and 1.1802days/decade, respectively. The diurnal temperature range has decreased by 610.18°C/decade. Both the annual extreme lowest and highest temperatures exhibit significant warming trends, the former warming faster than the latter. For precipitation indices, regional annual total precipitation shows an increasing trend and most other precipitation indices are strongly correlated with annual total precipitation. Average wet day precipitation, maximum 1-day and 5-day precipitation, and heavy precipitation days show increasing trends, but only the last is statistically significant. A decreasing trend is found for consecutive dry days. For all precipitation indices, stations in the Yangtze River basin, southeastern and northwestern China have the largest positive trend magnitudes, while stations in the Yellow River basin and in northern China have the largest negative magnitudes. This is inconsistent with changes of water vapor flux calculated from NCEP/NCAR reanalysis. Large scale atmospheric circulation changes derived from NCEP/NCAR reanalysis grids show that a strengthening anticyclonic circulation, increasing geopotential height and rapid warming over the Eurasian continent have contributed to the changes in climate extremes in China.

DOI

[69]
Zhang C J, Xie J N, Li D L et al., 2002. Effect of East-Asian monsoon on drought climate of Northwest China.Plateau Meteorology, 21(2): 193-198. (in Chinese)

[70]
Zhang M, Chen Y N, Shen Y J et al., 2017. Changes of precipitation extremes in arid Central Asia.Quaternary International, 436: 16-27. doi: 10.1016/j.quaint.2016.12.024.Despite growing evidence of increasing precipitation extremes around the world, research into extreme precipitation events in Central Asia (CA) is still scarce. In this study, based on daily precipitation records from 22 meteorological stations, several methods were used to detect the spatial-temporal distribution, abrupt change and return periods for six extreme precipitation indices as well as the total annual precipitation during 1938–2005 in CA. The results show that all precipitation indices experienced increasing trend except for annual maximum number of consecutive dry days (CDD), which had a significant decreasing trend. Abrupt changes for most of precipitation indices mainly occurred around 1957 during 1938–2005. Return periods for all seven precipitation indices concentrated in 10-year period. Meanwhile, all precipitation indices showed spatial diversity and heterogeneity, and the entire area tended to be wetter and experienced fewer dry conditions. Understanding these changes of precipitation extremes in CA will definitely benefit to water resource management, natural hazard prevention and mitigation, and reliable future projections in this region.

DOI

[71]
Zhang X B, Aguilar E, Sensoy S et al., 2005. Trends in Middle East climate extreme indices from 1950 to 2003.Journal of Geophysical Research: Atmospheres, 110: D22. doi: 10.1029/2005JD006181.A climate change workshop for the Middle East brought together scientists and data for the region to produce the first area-wide analysis of climate extremes for the region. This paper reports trends in extreme precipitation and temperature indices that were computed during the workshop and additional indices data that became available after the workshop. Trends in these indices were examined for 1950-2003 at 52 stations covering 15 countries, including Armenia, Azerbaijan, Bahrain, Cyprus, Georgia, Iran, Iraq, Israel, Jordan, Kuwait, Oman, Qatar, Saudi Arabia, Syria, and Turkey. Results indicate that there have been statistically significant, spatially coherent trends in temperature indices that are related to temperature increases in the region. Significant, increasing trends have been found in the annual maximum of daily maximum and minimum temperature, the annual minimum of daily maximum and minimum temperature, the number of summer nights, and the number of days where daily temperature has exceeded its 90th percentile. Significant negative trends have been found in the number of days when daily temperature is below its 10th percentile and daily temperature range. Trends in precipitation indices, including the number of days with precipitation, the average precipitation intensity, and maximum daily precipitation events, are weak in general and do not show spatial coherence. The workshop attendees have generously made the indices data available for the international research community.

DOI

[72]
Zhang X B, Feng Y, 2004. R ClimDex (1.0). User Manual. Climate research branch environment Canada Downsview, Ontario Canada.

[73]
Zhang X B, Wan H, Zwiers F W et al., 2013. Attributing intensification of precipitation extremes to human influence.Geophysical Research Letters, 40: 5252-5257. doi: 10.1002/grl.51010.This study provides estimates of the human contribution to the observed widespread intensification of precipitation extremes. We consider the annual maxima of daily (RX1day) and 5 day consecutive (RX5day) precipitation amounts over the Northern Hemisphere land area for 1951-2005 and compare observed changes with expected responses to external forcings as simulated by multiple coupled climate models participating in Coupled Model Intercomparison Project Phase 5. The effect of anthropogenic forcings can be detected in extreme precipitation observations, both individually and when simultaneously estimating anthropogenic and naturally forced changes. The effect of natural forcings is not detectable. We estimate that human influence has intensified annual maximum 1 day precipitation in sampled Northern Hemisphere locations by 3.3% [1.1% to 5.8%, >90% confidence interval] on average. This corresponds to an average intensification in RX1day of 5.2% [1.3%, 9.3%] per degree increase in observed global mean surface temperature consistent with the Clausius-Clapeyron relationship.

DOI

Outlines

/