Research Articles

Sensitivity of arid/humid patterns in China to future climate change under a high-emissions scenario

  • MA Danyang , 1, 2, 3 ,
  • DENG Haoyu 1, 2 ,
  • YIN Yunhe , 1, * ,
  • WU Shaohong 1, 2 ,
  • ZHENG Du 1, 2
Expand
  • 1. Key Laboratory of Land Surface Pattern and Simulation, Institute of Geographic Sciences and Natural Resources Research, CAS, Beijing 100101, China
  • 2. University of Chinese Academy of Sciences, Beijing 100049, China
  • 3. Henan Province Development and Reform Commission, Zhengzhou 450018, China
*Corresponding author: Yin Yunhe (1979-), PhD and Professor, E-mail:

Author: Ma Danyang (1990-), PhD, E-mail:

Received date: 2018-07-20

  Accepted date: 2018-09-10

  Online published: 2019-01-25

Supported by

National Key Research and Development Program of China, No.2017YFC1502904

National Natural Science Foundation of China, No.41530749, No.41571043

Copyright

Journal of Geographical Sciences, All Rights Reserved

Abstract

Changes in regional moisture patterns under the impact of climate change are an important focus for science. Based on the five global climate models (GCMs) participating in the Coupled Model Intercomparison Project Phase 5 (CMIP5), this paper projects trends in the area of arid/humid climate regions of China over the next 100 years. It also identifies the regions of arid/humid patterns change and analyzes their temperature sensitivity of responses. Results show that future change will be characterized by a significant contraction in the humid region and an expansion of arid/humid transition zones. In particular, the sub-humid region will expand by 28.69% in the long term (2070-2099) relative to the baseline period (1981-2010). Under 2°C and 4°C warming, the area of the arid/humid transition zones is projected to increase from 10.17% to 13.72% of the total of China. The humid region south of the Huaihe River Basin, which is affected mainly by a future increase in evapotranspiration, will retreat southward and change to a sub-humid region. In general, the sensitivity of responses of arid/humid patterns to climate change in China will intensify with accelerating global warming.

Cite this article

MA Danyang , DENG Haoyu , YIN Yunhe , WU Shaohong , ZHENG Du . Sensitivity of arid/humid patterns in China to future climate change under a high-emissions scenario[J]. Journal of Geographical Sciences, 2019 , 29(1) : 29 -48 . DOI: 10.1007/s11442-019-1582-5

1 Introduction

The dynamic responses of terrestrial systems to climate change have been at the frontier for research in the discipline of geography (Wu et al., 2016). A climate zone is the synthesis of many climatic factors and is closely related to broad-scale vegetation type (Bailey, 2009). It allows both moisture and thermal conditions to be examined simultaneously for a better assessment of multivariate climate change (Grundstein, 2008). The mean global surface temperature has increased by ~0.85°C (0.65°C-1.06°C) between the years 1880 and 2012 (IPCC, 2013). Climate scenarios project a further increase in global mean surface temperature of 0.3°C to 4.8°C by the end of 21st century. Accelerating climate change is projected to have majorimplications for climate zones and may cause significant zonal shifts (Mahlstein et al., 2013).
The impact of climate change on the spatial distribution of climate zones has become increasingly evident in recent decades at both global (Chan et al., 2015; Reid et al., 2015; Huang et al., 2016a) and regional (Gerstengarbe et al., 2009; Feng et al., 2012; Zhu et al., 2015) scales. According to observational studies, there have been significant expansions in semi-arid regions worldwide (Huang et al., 2016a), as well as poleward shifts in temperate, continental, and polar climate zones (Chan et al., 2015). Dry and wet climate zones in China have shown marked fluctuations and contrasts over the latter half of the 20th century (Yang et al., 2002). The drying trend in northern China has extended to the east and south (Ma et al., 2005). The boundary between semi-arid and sub-humid regions has likewise migrated (Zheng et al., 2013). The dynamics of climate zones have been used to evaluate the performance of climate models, based on methods such as Köppen classification (Lohmann, 1993; Gnanadesikan et al., 2006), Thornthwaite clustering (Elguindi et al., 2014), and K-means clustering (Zhang et al., 2016). Belda et al. (2015) suggested that the global climate models (GCMs) in the Coupled Model Intercomparison Project Phase 5 (CMIP5) needs to be improved to boost the performance in simulating the distribution of climate classification.
Changes in drought risk and aridity in many regions are among the primary effects anticipated under global warming (Dai, 2013; Trenberth et al., 2013; Greve et al., 2015). Changes associated with moisture conditions have great effects on the spatial and temporal distribution of arid/humid climate regions (AHCRs) (Yin et al., 2015), but quantifying those effects remains a challenge. Recent studies have reported a general consensus that projected changes in temperature and precipitation will cause considerable shifts in AHCRs over the global landmass (Hanf et al., 2012; Feng et al., 2014; Rohli et al., 2015). According to Feng et al. (2014), existing climate types will gradually shift towards warmer and drier types over 2071-2100, with notable expansion in arid and semi-arid climates by between 8.4% and 15.9%. Projections of more arid and/or semi-arid regions in the 21st century have been investigated in West Africa (Sylla et al., 2015), the Mediterranean (Gao et al., 2008; Alessandri et al., 2014), and China (Li et al., 2013; Cheng et al., 2015). As greenhouse gas emissions intensify in future, the area of bioclimatic zones prone to desertification in China will tend to increase (Ci et al., 2002). Under the high-emissions scenario, the range of Cwa(Monsoon-influenced humid subtropical climate)and Dwa(Monsoon-influenced hot-summer humid continental climate)climates in Eastern China is projected to expand (Cheng et al., 2015). Zhao et al. (2014) pointed out that arid and semi-arid areas globally will experience a significant temperature rise under various concentration pathways. Wet regions will become wetter and dry regions become drier. However, to what extent future climate change will affect regional shifts in China is still uncertain and differs from region to region.
Following these considerations, climate observations and CMIP5 GCM simulations were used in this study to estimate reference evapotranspiration based on the revised Penman-Monteith model. Combining reference evapotranspiration with precipitation, an aridity index was constructed to classify arid/humid climate types. We examined the trend in hydroclimatic variables under the high-emissions scenario and investigated the change in AHCR areas. This reveals the sensitivity of arid/humid patterns to climate change and indicates the regions that are most sensitive. The results help to understand more deeply the driving mechanisms responsible for variations in the land surface system, the evolution of plant communities, and the probability of desertification. They also provide a scientific foundation for developing appropriate strategies for adapting to climate change.

2 Materials and methods

2.1 Data sources

2.1.1 Meteorological data
We obtained quality-controlled monthly observations of maximum and minimum air temperatures, precipitation, relative humidity, sunshine duration, and wind speed from 581 meteorological stations in China for the period 1981-2010 (Figure 1). Data were provided by the National Meteorological Center of the China Meteorological Administration (CMA). Observations from individual meteorological stations were deleted from the dataset if a station was built after 1981, one station’s location changed during the study period, another station was closed before 2010, or more than 5% of the data were missing. Missing data were estimated by averaging the values obtained from the same station during other years. To meet the model input requirements, ground-based point meteorological data were interpolated on a 0.5° × 0.5° grid using a thin-plate spline method.
Figure 1 Distribution of 581 meteorological stations and arid/humid climate regions across China for the period 1981-2010
2.1.2 Climate simulations
To derive the regional mean temperature changes and corresponding spatial and temporal shifts in AHCRs across China, monthly climate data from 1950 to 2099 were utilized from the CMIP5 multi-model dataset (Taylor et al., 2012). These data are available from the Inter-Sectoral Impact Model Intercomparison Project (ISI-MIP) (Hempel et al., 2013; Warszawski et al., 2014). Five GCMs (HadGEM2-ES, IPSL-CM5A-LR, GFDL-ESM2M, MIROC-ESMCHEM, and NorESM1-M) with a horizontal resolution of 0.5°×0.5° participate in the ISI-MIP (Table 1). The representative concentration pathway (RCP) 8.5 scenario with radiative forcing of ~8.5 W m-2 in 2100 was selected (Moss et al., 2010). This scenario provides a large range of temperature increases and is suitable for assessing the impacts of future climate change (Mahlstein et al., 2013; Piontek et al., 2014; Leng et al., 2015).
Table 1 Global climate models used in this study
Model name Original resolution
(latitude × longitude)
Modeling center Country
NorESM1-M 1.875° × 2.5° Norwegian Climate Centre Norway
MIROC-ESM-CHEM 2.8°×2.8° Atmosphere and Ocean Research Institute (The University of Tokyo), National Institute for Environmental Studies, and Japan Agency for Marine-Earth Science and Technology Japan
IPSL-CM5A-LR 1.875°×3.75° Institut Pierre-Simon Laplace France
HadGEM2-ES 1.25°×1.875° Met Office Hadley Centre UK
GFDL-ESM2M 2.0°×2.5° Geophysical Fluid Dynamics Laboratory USA
Before simulation data are used to study climate change impacts, correction is recommended to reduce the bias of climate model simulations compared with the observed climate (Feng et al., 2012; Engelbrecht et al., 2016). Here, the simulated climatic variables were adjusted to have the same climatological annual mean as the real observations over China for the baseline period 1981-2010. First, the annual mean anomalies were calculated, based on differences between observed and GCM-generated data for the baseline period, for each of the five model simulations. The anomalies were then added to the scenario data to provide model inputs for the period 2011-2099 (Yin et al., 2013).
The shifts in climate zones were analyzed under the 21st century warming levels from 1°C to 6°C, relative to the baseline period. Projecting impacts for a given global warming is useful, as this is consistent with the approach of the UNFCCC (United Nations Framework Convention on Climate Change) in phrasing mitigation targets (Vautard et al., 2014; Swain et al., 2015; Roudier et al., 2016; Schleussner et al., 2016). Although global temperature thresholds provide useful information, local conditions are most important to those living with, and adapting to, the consequences of climate change (Joshi et al., 2011). Here, the years of warming over China were determined by applying an 11-year low-pass filter to the annual regional land-surface temperature anomalies, to eliminate inter-annual variability for each model. These years are generally considered to be the central points of the 11-year climatic means, as suggested by difference calculations between climate zones in China (Chen et al., 2015, Engelbrecht et al., 2016).
The multi-model ensemble (MME) means of the five models were computed. These models are assumed to be independent and are given equal weight in this study. The MME can be used to provide both a consensus representation of the climate system and a measure of the confidence to be placed in the consensus (Taylor et al., 2012). The MME approach is expected to outperform individual models in simulating global and regional climates (Pierce et al., 2009; Knutti et al., 2010; Zhao et al., 2014). The GCM ensemble means show good agreement with observed values in China and are thus able to reproduce variations in aridity during the baseline period (Yin et al., 2015).

2.2 Arid/humid zone classification

Many previous studies have relied on Köppen climate classification schemes (Crosbie et al., 2012; Chan et al., 2016; Engelbrecht et al., 2016), based primarily on temperature and precipitation. The complex interplay of water supply and demand, including both precipitation (P) and reference evapotranspiration (ETo), is critical for projecting changes in dryness (Cook et al., 2014; Greve et al., 2015; Mcevoy et al., 2016) and dryland dynamics (Huang et al., 2016b). The aridity index (AI), usually expressed as the ratio between ETo and P (Budyko, 1974; Wu et al., 2010), is widely used as an indicator of regional moisture conditions and is an effective criterion to classify AHCRs.
In general, ETo reflects the maximum water demand of an environment to maintain its water balance, and P reflects the water supply over large regions. Currently, since it is difficult to obtain observed ETo over large regions, ETo is often simulated using models. Reasonable prediction of future ETo is important to reduce uncertainty in the assessment of climate-zone shifts. One widely used method to simulate ETo is the Penman-Monteith model (Allen et al., 1998), which emphasizes the important role of radiative and aerodynamic controls on ETo. It is thus more appropriate for projections of long-term drought and dryland conditions under climate change (Sherwood et al., 2014; Huang et al., 2016b). The modified Penman-Monteith model, recommended in 1998 by the Food and Agriculture Organization (hereafter the FAO56-PM model), has been applied in both arid and humid environments (Allen et al., 1998). Radiation is calculated in the model by an Ångström formula, the accuracy of which is determined by empirical coefficients within regional limits. In our previous studies, solar radiation in the FAO56-PM model was calibrated for China and proved to be suitable in representing arid/humid zones (Yin et al., 2008). Therefore, the Penman-Monteith model was again used in the present study to simulate ETo over China.
$E{{T}_{\text{o}}}=\frac{0.408\Delta ({{R}_{\text{n}}}-G)+\gamma \frac{900}{T+273}{{U}_{2}}({{e}_{\text{s}}}-{{e}_{\text{a}}})}{\Delta +\gamma (1+0.34{{U}_{2}})}$ (1)
where Rn is the net radiation (MJ m-2), G is the soil heat flux (MJ m-2), γis the psychrometric constant (kPa °C-1),Δis the slope of the saturation vapor pressure curve (kPa °C-1), T is the average temperature (°C), U2 is the wind speed at 2 m height (m s-1), es is the mean saturation vapor pressure (kPa), and ea is the actual vapor pressure (kPa).
Under climate change, the AI has significance for bioclimate beyond the simple association with precipitation and temperature (Moral et al., 2016). According to the study of Wu et al. (2005), AI is conventionally used to classify the land surface at a broad scale into four zones: humid, sub-humid, semi-arid, and arid. These zones are represented by specific types of natural vegetation: forest, forest steppe including meadow, steppe, and desert, respectively (Table 2).
Table 2 Criteria for demarcating the arid/humid climate regions of China according to aridity index (AI)
Arid/humid climate region Aridity index (AI = ETo/P) Natural vegetation type
Humid AI < 1.0 Forest
Sub-humid 1.0 ≤ AI < 1.5 Forest steppe (including meadow)
Semi-arid 1.5 ≤ AI < 4.0 Steppe (meadow steppe, and desert steppe)
Arid AI ≥ 4.0 Desert

2.3 Sensitivity assessment of AHCR shifts due to warming

The fundamental idea of sensitivity analysis is to establish a quadratic function relationship between changes in AHCR area and temperature increase, thereby allowing measurement of the sensitivity of AHCR shifts to warming from the slope of the quadratic curve. First, an 11-year running mean was applied to AI series on a grid scale from 2011 to 2099, to reduce the effect of short-term climate variability and improve the robustness of the results. The percentage area change in AHCRs over China was counted year by year, by determining whether climate types shift in future relative to the baseline period. Using a quadratic function, the area of AHCR shift corresponds to temperature increase according to the national mean temperature anomaly, as shown in Eq. 2. The slope of the fitted curve (Eq. 3) is the rate of area change with temperature, which is deemed to reflect the sensitivity of AHCR shifts to warming. A rate of >0 indicates positive sensitivity, whereas a rate of <0 indicates negative sensitivity.
$y=a{{x}^{2}}+bx+c$ (2)
$s=2ax+b$ (3)
wherey is the area change as a function of the regional mean temperature anomaly x, relative to the baseline period; s is the rate of area change; a, b, and c are parameters fitted to the model.

3 Results

3.1 Future changes in ETo, P, and AI over China

Changes in multi-model projected ETo, P, and AI under the RCP8.5 scenario relative to 1981-2010 are shown in Figures 2 and 3. Generally, all three variables increase to a greater extent over the long term (2070-2099) than over the mid term (2040-2069), although regional discrepancies exist. According to the MME results, ETo is likely to increase across almost the entire country, especially in eastern areas. The increase reaches 10%-20% in the mid term and >20% in the long term, for Northeast China and southern parts of the Qinling Mountains-Huaihe River Basin. P has a tendency to increase similar to ETo but with a different spatial pattern. P tends to increase more in the north, including the Tibetan Plateau, by >30% in the long term, compared with <10% in the south. AI mainly increases in the southeast and decreases in the northwest. The most notable AI increase is in the middle and lower reaches of the Yangtze River and western Xinjiang, where the increase could reach 20% in the long term. The decrease in northwestern areas is likely to be >10% over the mid to long term. AI changes in the range of -10% to ~10% in North and Northeast China, and increases by >10% in the east of Northeast China.
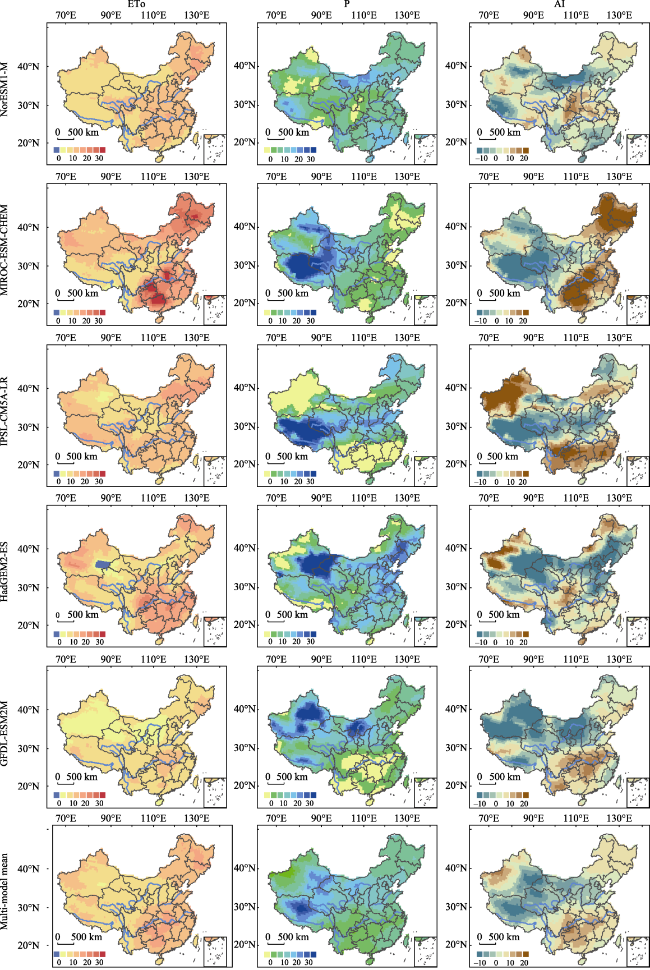
Figure 2 Percentage deviations over China in reference evapotranspiration (ETo), precipitation (P), and aridity index (AI) for 2040-2069, relative to the baseline period under the RCP8.5 scenario
Figure 3 Percentage deviations over China in reference evapotranspiration (ETo), precipitation (P) and aridity index (AI) for 2070-2099, relative to the baseline period under RCP8.5
Changes in the variables differ between the five GCMs. The most notable change in AI was simulated by the IPSL-CM5A-LR model. AI is likely to increase >20% in the long term in all areas, except in Tibet and the west of Northeast China. With the HadGEM2-ES model, AI increases slightly in the southeast coast and to the west of Xinjiang, whereas the clearest decrease of >10% is seen in most northern parts. As changes in ETo projected by IPSL-CM5A-LR and HadGEM2-ES are similar, the AI changes are attributed mainly to the changes in P. Relative to the baseline period, P simulated by IPSL-CM5A-LR is negative in Xinjiang and south of the Yangtze River. Therefore, the smallest increase in total P gave the largest increase in AI. P simulated by HadGEM2-ES is positive across almost the entire country, with a 30% increase in the long term. Therefore, the largest increase in total P led to the smallest change in AI. For both ETo and P, the difference among GCMs in the long term is greater than in the mid term, and the difference in P is larger than that in ETo.

3.2 Spatio-temporal changes in AHCRs over China

Figure 4 shows the anomalies in areal changes in AHCRs over China relative to the baseline period 1981-2010 under RCP8.5. For the MME mean, the proportion of humid regions shows a significant reduction from 2011 to 2099, at a rate of -0.030% per year (p < 0.01). The areas of sub-humid and semi-arid regions show significant expansions at rates of 0.017% (p < 0.05) and 0.011% (p < 0.05), whereas the arid region shows no significant change. Compared with observations during the baseline period, the sizes of humid and arid regions show an average decline of 1.28% and 1.53%, respectively. The sub-humid region expands by 1.98% on average, and the semi-arid region shows an average anomaly of 0.84%. The differences in simulated AHCR areas between the GCMs are indicated by average standard deviations of 5.14%, 3.44%, 3.74%, and 3.79% for the period 2011-2099.
Figure 4 Area percentages (%) of (a) humid, (b) sub-humid, (c) semi-arid, and (d) arid regions in China during the 21st century, expressed as anomalies relative to the baseline period under RCP8.5. The time series were smoothed using an 11-year running mean
The spatial distribution of AHCRs in China from the mid to long term under RCP8.5 is shown in Figure 5, with summary statistics presented in Table 3. Both humid and arid regions are likely to shrink in future, and their respective areas are projected to reduce by 5.93% and 1.95% over 2040-2069 relative to the baseline period. The humid region will evidently shrink, as shown by its projected 12.61% decrease over 2070-2099. On the contrary, sub-humid and semi-arid regions are likely to expand, with projected increases of 16.28% and 1.38% in the mid term, respectively. The expansion of the sub-humid region reaches 28.69% in the long term. The arid region mainly decreases in the mid term, but increases over the long term. The areas of humid and sub-humid regions vary much more over the long term than over the mid term.
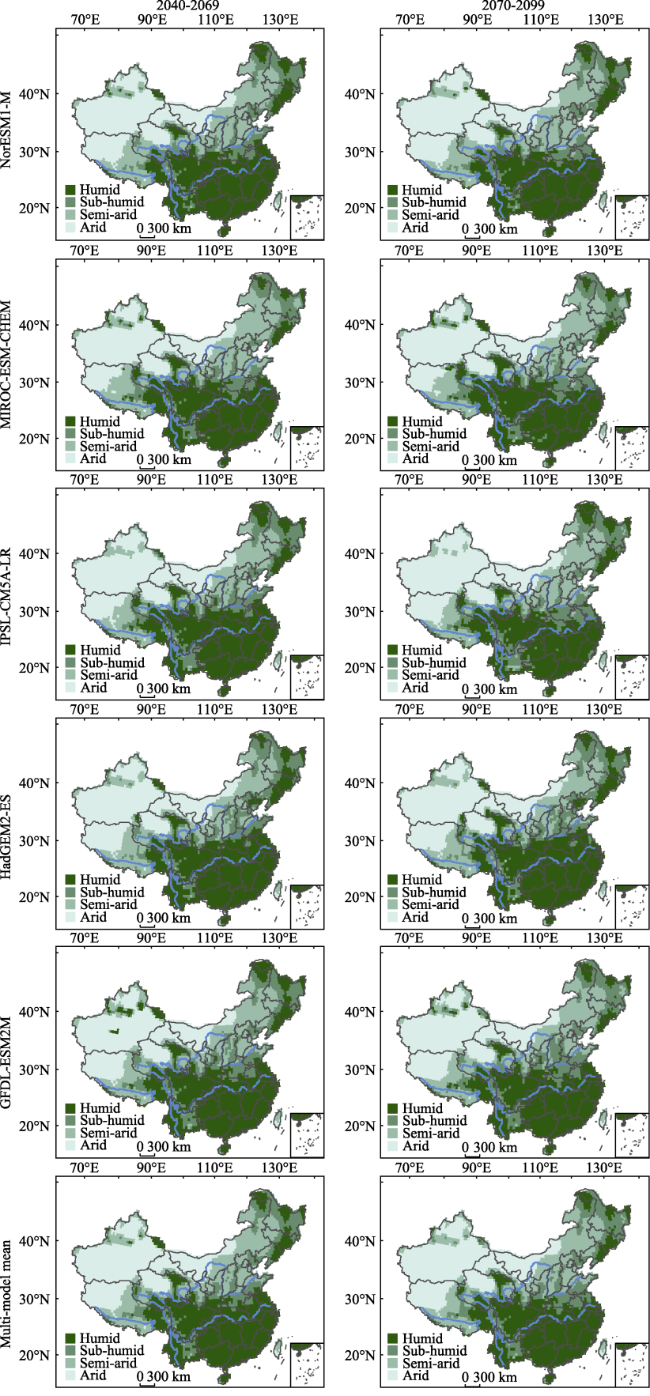
Figure 5 Spatial distribution of arid/humid climate regions (AHCRs) across China during 2040-2069 and 2070-2099 under RCP8.5
Table 3 Percentage areas (%) of arid/humid climate regions (AHCRs) in China for the periods 2040-2069 and 2070-2099 under RCP8.5, and the amount of change (%) relative to the baseline period
GCM Period Humid Sub-humid Semi-arid Arid
Area Change Area Change Area Change Area Change
1981-2010 35.76 13.94 24.61 25.69
NorESM1-M 2040-2069 32.78 -8.33 15.27 9.54 26.65 8.29 25.29 -1.56
2070-2099 31.47 -12 16.26 16.64 26.04 5.81 26.23 2.1
MIROC-ESM-CHEM 2040-2069 32.13 -10.15 16.24 16.5 27.62 12.23 24.01 -6.54
2070-2099 32.75 -8.42 17.02 22.09 26.8 8.9 23.43 -8.8
IPSL-CM5A-LR 2040-2069 35.37 -1.09 16.35 17.29 22.33 -9.26 25.95 1.01
2070-2099 30.18 -15.6 18.87 35.37 23.14 -5.97 27.81 8.25
HadGEM2-ES 2040-2069 34.45 -3.66 17.15 23.03 21.67 -11.95 26.74 4.09
2070-2099 33.97 -5.01 18.71 34.22 21.54 -12.47 25.78 0.35
GFDL-ESM2M 2040-2069 34.15 -4.5 17.14 22.96 26.15 6.26 22.56 -12.18
2070-2099 30.26 -15.38 20.03 43.69 26.13 6.18 23.57 -8.25
Multi-model mean 2040-2069 33.64 -5.93 16.21 16.28 24.95 1.38 25.19 -1.95
2070-2099 31.25 -12.61 17.94 28.69 24.98 1.5 25.83 0.54
The multi-model simulated distributions of AHCRs across China show certain similarities (Figure 5). Northwest China is the main arid region, where a clear increase in future precipitation may result in a significant decrease in aridity index. Shrinkage of the arid region will occur primarily in the northwest, especially in northwest Tibet, possibly leading to a northward shift in the arid region’s southern boundary (Figures 1 and 5). In addition, part of the semi-arid region north of Xinjiang may become arid, causing the entire region to shift northward. The boundary between semi-arid and sub-humid regions is projected to shift northwards in the east of the Tibetan Plateau, and shift southeastwards in Northeast China and east of the North China Plain. With the semi-arid region of Inner Mongolia shifting eastwards, the semi-arid region in Northeast China will expand.
The increase in evapotranspiration will likely cause a significant rise in the aridity index over most areas in the east of China (Figures 2 and 3). Thus, the humid regions of Northeast China and in the south will shrink relative to the baseline period (Figures 1 and 5). Generally, the humid region will shift to the south. The humid region of the Huaihe River basin is projected to shrink and be gradually replaced by the sub-humid region. This means that the boundary between humid and sub-humid regions will lie in the far south. Moreover, the humid region will become sub-humid in Daxing’an, Xiaoxing’an, and the Changbai Mountains in Northeast China and part of the southeast of the country. Changes simulated by different GCMs for humid and sub-humid regions are essentially consistent, but the results concerning semi-arid and arid regions are variable. Specifically, NorESM1-M, MIROC-ESM-CHEM, and GFDL-ESM2M show that the semi-arid region mainly shrinks but the arid region mainly expands. However, the other two GCMs give contrasting results (Figure 5).

3.3 Sensitivity of AHCR shifts to warming

Using the 11-year running mean of the AI series from 2011 to 2099, the proportions of AHCR areas that shift relative to the baseline period under RCP8.5 were calculated. Figure 6a
shows a quadratic curve that fits the areas of change and the temperature anomalies. Figure 6b shows the corresponding rates indicating the sensitivity of AHCR shifts to warming. All shifting areas show an increasing trend as the temperature anomaly rises. Among the GCMs, the GFDL-ESM2M changes from a decreasing to an increasing trend at ~2°C. The MME results show that the percentage area affected by AHCR shifts in China increases from 10.24 ± 1.89% to 14.19 ± 3.30% for the common 1.14%-3.87% range of temperature anomalies.
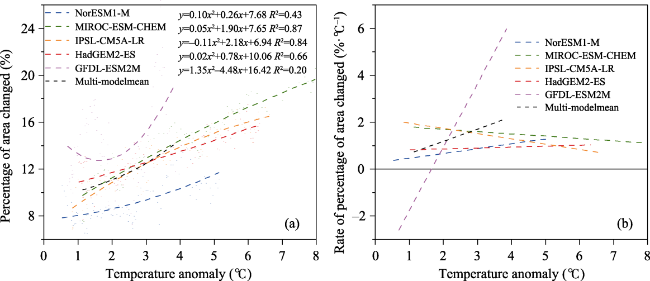
Figure 6 Shifts in arid/humid climate regions (AHCRs) across China and the rate of change with temperature anomaly relative to the baseline period under RCP8.5. (a) Percentage area change (%). (b) Rate of percentage area change (%°C-1). Before quadratic curve fitting, data were smoothed using an 11-year running mean. The original data points are shown as dots in (a)
Whereas the GFDL-ESM2M rate changes from negative to positive, all other GCMs show continuously positive rates. Specifically, the changing rates of MIROC-ESM-CHEM and IPSL-CM5A-LR gradually slow down with rising temperatures, suggesting a weakening sensitivity of AHCR shifts to warming. For the MME mean, the greater the temperature increment, the higher the sensitivity of AHCR shifts. In general, the rate of change ranged from 0.73 (± 1.34%°C-1) to 2.16 (± 2.16%°C-1). This means that the area of AHCR shift will increase by 1.44% as the average temperature rises by 1°C.

3.4 AHCR shifts with 2°C and 4°C warming

Figures 7 and 8 illustrate the changed and unchanged areas of AHCRs, as projected after 2°C and 4°C warming under RCP8.5, simulated by various GCMs. From the MME statistics (Table 4), given 2°C and 4°C warming relative to the baseline period, the following results emerge. The humid region mainly shrinks, with its area projected to reduce by 13.03% and 9.95%, occupying 3.56% and 4.66% of the country, respectively. The sub-humid region considerably expands, increasing by 33.15% and 50.29%, occupying 4.62% and 7.01% of the country for 2°C and 4°C warming, respectively. The semi-arid region also expands, projected to increase by 13.49% and 16.65%, and occupying 3.32% and 4.10% of the country, respectively. The arid region remains mostly unchanged. The AHCR areas of expansion and contraction increase from 2°C to 4°C warming, except for the arid region. According to the MME results, the total area of change in China is projected to increase from 10.17% for 2°C warming to 13.72% for 4°C warming, bringing a further increase of 3.55%.
Figure 7 Spatial distribution of humid, sub-humid, semi-arid, and arid regions over China for 2°C warming under RCP8.5, showing changed and unchanged areas relative to the baseline period
Figure 8 Spatial distribution of humid, sub-humid, semi-arid, and arid regions over China for 4°C warming under RCP8.5, showing changed and unchanged areas relative to the baseline period
Table 4 Percentage change in the areas of humid, sub-humid, semi-arid, and arid regions over China for 2°C and 4°C warming under RCP8.5, relative to the baseline period
GCM 2°C 4°C
Humid Sub-
humid
Semi-
arid
Arid Humid Sub-
humid
Semi-
arid
Arid
NorESM1-M Expansion 0.47 3.61 3.26 0.73 0.72 6.28 4.84 1.10
Contraction 3.23 2.54 1.19 1.09 5.05 4.07 2.38 1.44
Total changed 8.06 12.93
MIROC-ESM-CHEM Expansion 0.87 8.05 4.24 0.13 1.64 8.33 4.92 0.54
Contraction 6.61 2.84 1.68 2.17 6.15 4.06 2.64 2.57
Total changed 13.29 15.42
IPSL-CM5A-LR Expansion 1.59 3.75 2.25 2.55 3.17 7.00 2.63 1.61
Contraction 2.50 2.89 3.85 0.90 2.95 3.63 5.74 2.10
Total changed 10.13 14.41
HadGEM2-ES Expansion 1.23 4.97 3.35 1.24 1.22 7.81 3.41 1.58
Contraction 3.57 3.68 2.69 0.86 4.08 3.33 5.32 1.30
Total changed 10.79 14.03
GFDL-ESM2M Expansion 1.12 2.72 3.50 1.21 0.58 5.62 4.70 0.88
Contraction 1.87 2.04 2.00 2.64 5.08 3.05 1.34 2.32
Total changed 8.55 11.78
Multi-model mean Expansion 1.06 4.62 3.32 1.17 1.47 7.01 4.10 1.14
Contraction 3.56 2.80 2.28 1.53 4.66 3.63 3.48 1.94
Total changed 10.17 13.72
In spatial terms, the Huaihe River Basin and Northeast China are the primary regions experiencing a shrinking humid region and expanding sub-humid region, as well as parts of Southwest China. Expansion of the semi-arid region would occur mainly in the transition zone between the sub-humid and semi-arid parts of eastern China, and in the transition zone between arid and semi-arid parts of western China. The difference between the models is projected to be larger for the reduced humid region and expanded sub-humid region. Standard deviations are 1.83% and 2.08% at 2°C warming, and 1.20% and 1.10% at 4°C warming, respectively. The difference between the models is projected to be the smallest in terms of the amount of arid-region change.
Concerning differences between GCMs, the reduction in the humid region and expansion of the sub-humid region are both projected to be the largest by the MIROC-ESM-CHEM model, as is the total area of change (13.29% for 2°C warming and 15.42% for 4°C warming). For GFDL-ESM2M, although the total area of change is projected to be the smallest among models (8.55% for 2°C warming and 11.78% for 4°C warming), the contraction of the humid region and expansion of the sub-humid region are greater for 4°C warming than for 2°C warming. The NorESM1-M model projects the largest increase (4.87%) in the total area of change from 2°C to 4°C warming, caused mainly by a shift from a humid to a sub-humid climate in the Huaihe River basin, and shifts from a sub-humid to a semi-arid climate in the Loess Plateau and the North China Plain.
According to the models indicating change, the various climate regions are more likely to shrink or expand at their peripheries (Figure 9). Almost all of the contraction of the humid region (99.73% for 2°C warming and 99.75% for 4°C warming) would be replaced by the sub-humid region. The area of shrinkage in the sub-humid region to the east of 105°E would mostly become semi-arid (67.86% for 2°C warming and 72.20% for 4°C warming), whereas elsewhere it would mostly become humid (64.77% for 2°C warming and 73.45% for 4°C warming). Similarly, the reduced part of the semi-arid region in Northwest China would become mostly arid (73.91% for 2°C warming and 82.08% for 4°C warming), or become sub-humid elsewhere (63.05% for 2°C warming and 85.03% for 4°C warming). In addition, over 90% of the decrease in the arid region would be replaced by a semi-arid climate.
Figure 9 Spatial distribution of humid, sub-humid, semi-arid, and arid regions over China for 2°C and 4°C warming under RCP8.5 relative to the baseline period, showing the number of models projecting change within each region

4 Discussion

This study used an aridity index (AI) to classify arid/humid climate regions (AHCRs) in China. Changes in AHCR patterns under future warming were then analyzed. Results indicate that changes in the 21st century under the RCP8.5 scenario are characterized by a significant contraction in the humid region and a significant expansion in the arid/humid transition zone. This is consistent with the conclusions of Wang et al. (2016), who posited that the boundaries of the East Asian climate transition zone would shift southeast and northwest, with a higher migration rate for the southern boundary. Research based on the Köppen classification system has shown that the subtropical humid region in Southeast China will contract substantially by the end of the 21st century, relative to the end of 20th century, particularly for the higher-emission scenarios RCP6.0 and RCP8.5 (Chan et al., 2016). Other research that used soil moisture to classify AHCRs also showed a significant contraction in the humid region of China, and a southeast expansion of the semi-arid and sub-humid climate zones in Northern China (Li et al., 2013). A global-scale study indicated that dryland areas will occupy 50% and 56% of the global land area under the RCP4.5 and RCP8.5 scenarios, respectively, with the greatest expansion in semi-arid regions (Huang et al., 2016b). In contrast, our study shows a greater expansion in the sub-humid region. This discrepancy possibly relates to the index ranges used for climate classification, as the semi-arid definition (AI = P/ETo, 0.2 ≤AI< 0.5) employed by Huang et al. (2016b) covers a wider range than that used here.
Changes in AHCR areas and boundaries are closely related to regional arid/humid trends, and are influenced by both natural factors and human activities. Based on observations and model simulations (Dai, 2013; Fu et al., 2015), some scholars regard changes in atmospheric circulation and sea-surface temperature as key drivers of land-surface precipitation change, and consider that decreasing precipitation is the main reason for the intensification of drought in many tropical and subtropical regions. However, temperature change may have additional important effects on shifts in climatic regimes as global warming continues during the 21st century (Feng et al., 2014). Rising temperatures will lead to increasing deficits in water vapor pressure, increasing evaporation demands, and decreasing soil moisture. The mutual reinforcement of these effects will promote drought processes (Sherwood et al., 2014; Huang et al., 2016b), and thus change the regional arid/humid patterns.
Changes in vegetation cover caused by climate change or human activities may in turn affect drought trends or moisture conditions. Zeng et al. (2009) used an air-ocean-land coupling model to investigate the dynamics of vegetation composition. They found that the superposition of warming effects and albedo feedback from vegetation cover may enhance the expansion of deserts in subtropical semi-arid regions in the future. In our study, the atmospheric water-demand increase due to climate warming exceeds the precipitation increase. The tendency for a shift towards greater aridity in most humid regions in Eastern China may therefore affect the evolution of the AHCR pattern. This finding is essentially consistent with Wang et al. (2014) analysis based on the Palmer drought severity index (PDSI).
We also investigated the sensitivity of AHCR patterns to climate change in China. We found an increase in area of the arid/humid transition zone, as derived from the multi-model average, with an increase in regional average temperature. Moreover, the faster the temperature rise, the faster the response of the arid/humid transition zone. For Köppen climate zones at the global scale, changes under the RCP8.5 scenario will accelerate with rising temperatures, with the rate by the end of the 21st century reaching approximately twice that of the early 20th century (Mahlstein et al., 2013). As a result, nearly one-third of temperate arid lands will change to subtropical arid lands over the next century, possibly accompanied by changes in vegetation type and ecosystem services (Schlaepfer et al., 2017).
Our research also indicates how the junction between arid/humid zones in China is usually the area of significant transformation. Affected by the interaction of the East Asian summer monsoon and the mid-latitude westerly winds (Qian et al., 2009), the arid/humid transition zone extending from southwest to northeast China displays strong gradients in climate and ecosystem types (Fu, 1992). Agricultural and grazing land uses overlap. However, the ecological environment of the transition zone is fragile and highly sensitive to both climate change and human activity (Shi, 1996). As global warming intensifies, the arid/humid transition zone may face a growing risk of natural disasters, land degradation, and desertification (Huang et al., 2016b; Wang et al., 2016). Jiang et al. (2017) found that the sub-humid and semi-arid regions are similarly sensitive to climate change under the RCP4.5 scenario, that climate-sensitive regions will expand in China, and that humid regions will change to sub-humid regions in future.
Accurate climate modeling is crucial for simulating changes in the geographical distribution and areas of various climatic types (Zhang et al., 2016). Model uncertainty is one source of general uncertainty in climate prediction, and the discrepancies between models vary with time, space, and amount of warming (Mahlstein et al., 2013; Chen et al., 2015; Belda et al., 2016). Mahlstein et al. (2013) posited that under the RCP8.5 scenario, ~20% of the world’s land area will experience a change in Köppen climate zone by the end of this century. Results vary from 17% to 27% for individual models, and the discrepancies between models increase with higher global average temperatures. For multi-model simulations, Belda et al. (2016) showed that the difference was the smallest for desert climates, the largest for northern and tundra climates, and that scenario RCP8.5 resulted in a greater difference than RCP4.5. Chen et al. (2015) found that for simulations of extreme temperature and precipitation indices in China, the uncertainty increases over time. Furthermore, the contribution of scenario uncertainty will exceed climate-model uncertainty towards the end of the century. In a study of future AHCR change in China, Yin et al. (2015) noted that aridity index values show a stronger volatility and a weaker trend compared with other climatic factors such as temperature, precipitation, and potential evapotranspiration, and that the difference between models is relatively small. Based on the corrected aridity index, the present study found that multi-model difference in humid zone variation in China is slightly larger than that for the three drier climate zones.

5 Conclusions

We combined climate observation data, CMIP5 GCM forecast data, and simulated reference evapotranspiration (ETo) data based on the revised Penman-Monteith model to calculate aridity index (AI) values across China. Projected spatial patterns of arid/humid zones corresponding to different levels of climate warming were then mapped. By analyzing future changes in the areas covered by arid/humid zones and their sensitivity to temperature increase, the following main conclusions were arrived at.
On the whole, ETo, P, and AI all increase under the RCP8.5 scenario, relative to the baseline period 1981-2010. The ETo increment is high in the east and low in the west, whereas the P increment is high in the north and low in the south. The AI increases in the southeast and decreases in the northwest. The projected amount of change differs between models, but is generally greater in the long term (2070-2099) than in the mid term (2040-2069). The degree of change in evapotranspiration is generally higher than that for precipitation. This may result in a humid to sub-humid transition for the southern part of the Huaihe River Basin.
During the 21st century, the humid region will contract significantly (p < 0.01), whereas the sub-humid and semi-arid regions will expand (p < 0.05). Compared with observed values for the baseline period, the sub-humid region will change the most. Its percentage of the national land area in China will increase at an average rate of 1.98%, to expand by 28.69% in the long term. The humid region will contract in Eastern China, causing a southward shift in the boundary between humid and sub-humid zones in the Huaihe River basin, a southeastward shift in the boundary between sub-humid and semi-arid zones in North and Northeast China. In contrast, aridity will decrease in Western China, causing a northward shift in the boundary between arid and semi-arid zones.
Under the RCP8.5 scenario, areal changes in arid/humid zones according to the multi-model mean will continue increasing with rising temperature. For most GCMs, the temperature sensitivity of changes in arid/humid climate regions will gradually increase as the temperature anomaly increases. In general, the humid region will mainly contract, whereas sub-humid and semi-arid regions are mainly projected to expand. The national total area of land experiencing such changes will increase from 10.17% for 2°C warming to 13.72% for 4°C warming.

The authors have declared that no competing interests exist.

[1]
Alessandri A, de Felice M, Zeng N et al., 2014. Robust assessment of the expansion and retreat of Mediterranean climate in the 21st century.Scientific Reports, 4(3): 7211. doi: 10.1038/srep07211.Abstract The warm-temperate regions of the globe characterized by dry summers and wet winters (Mediterranean climate; MED) are especially vulnerable to climate change. The potential impact on water resources, ecosystems and human livelihood requires a detailed picture of the future changes in this unique climate zone. Here we apply a probabilistic approach to quantitatively address how and why the geographic distribution of MED will change based on the latest-available climate projections for the 21st century. Our analysis provides, for the first time, a robust assessment of significant northward and eastward future expansions of MED over both the Euro-Mediterranean and western North America. Concurrently, we show a significant 21st century replacement of the equatorward MED margins by the arid climate type. Moreover, future winters will become wetter and summers drier in both the old and newly established MED zones. Should these projections be realized, living conditions in some of the most densely populated regions in the world will be seriously jeopardized.

DOI PMID

[2]
Allen R G, Pereira L S, Raes D et al., 1998. Crop Evapotranspiration: Guidelines for Computing Crop Water Requirements. United Nations Food and Agriculture Organization, Rome.

[3]
Bailey R G, 2009. Ecosystem Geography: From Ecoregions to Sites. New York: Springer-Verlag.

[4]
Belda M, Holtanová E, Halenka T et al., 2015. Evaluation of CMIP5 present climate simulations using the Köppen-Trewartha climate classification.Climate Research, 64(3): 201-212.

DOI

[5]
Belda M, Holtanová E, Kalvová J et al., 2016. Global warming-induced changes in climate zones based on CMIP5 projections.Climate Research, 71(1): 17-31.Abstract Climate classifications can provide an effective tool for integrated assessment of climate model results. We present an analysis of future global climate projections performed in the framework of the Coupled Model Intercomparison Project Phase 5 (CMIP5) project by means of K ppen-Trewartha classification. Maps of future climate type distributions were created along with the analysis of the ensemble spread. The simulations under scenarios with representative concentration pathway (RCP) 4.5 and RCP8.5 showed a substantial decline in ice cap, tundra, and boreal climate in the warming world, accompanied by an expansion of temperate climates, dry climates, and savanna, nearly unanimous within the CMIP5 ensemble. Results for the subtropical climate types were generally not conclusive. Changes in climate zones were also analyzed in comparison with the individual model performance for the historical period 1961-1990. The magnitude of change was higher than model errors only for tundra, boreal, and temperate continental climate types. For other types, the response was mostly smaller than model error, or there was considerable disagreement among the ensemble members. Altogether, around 14% of the continental area is expected to change climate types by the end of the 21st century under the projected RCP4.5 forcing and 20% under the RCP8.5 scenario.

DOI

[6]
Budyko M I, 1974. Climate and Life. New York: Academic Press.

[7]
Chan D, Wu Q G, 2015. Significant anthropogenic-induced changes of climate classes since 1950.Scientific Reports, 5: 13487. doi: 10.1038/srep13487.Anthropogenic forcings have contributed to global and regional warming in the last few decades and likely affected terrestrial precipitation. Here we examine changes in major K ppen climate classes from gridded observed data and their uncertainties due to internal climate variability using control simulations from Coupled Model Intercomparison Project 5 (CMIP5). About 5.7% of the global total land area has shifted toward warmer and drier climate types from 1950 2010, and significant changes include expansion of arid and high-latitude continental climate zones, shrinkage in polar and midlatitude continental climates, poleward shifts in temperate, continental and polar climates, and increasing average elevation of tropical and polar climates. Using CMIP5 multi-model averaged historical simulations forced by observed anthropogenic and natural, or natural only, forcing components, we find that these changes of climate types since 1950 cannot be explained as natural variations but are driven by anthropogenic factors.

DOI PMID

[8]
Chan D, Wu Q G, Jiang G X et al., 2016. Projected shifts in Köppen climate zones over China and their temporal evolution in CMIP5 multi-model simulations.Advances in Atmospheric Sciences, 33(3): 283-293.Previous studies have examined the projected climate types in China by 2100. This study identified the emergence time of climate shifts at a 171 scale over China from 1990 to 2100 and investigated the temporal evolution of K02ppen–Geiger climate classifications computed from CMIP5 multi-model outputs. Climate shifts were detected in transition regions (7%–8% of China’s land area) by 2010, including rapid replacement of mixed forest (Dwb) by deciduous forest (Dwa) over Northeast China, strong shrinkage of alpine climate type (ET) on the Tibetan Plateau, weak northward expansion of subtropical winterdry climate (Cwa) over Southeast China, and contraction of oceanic climate (Cwb) in Southwest China. Under all future RCP (Representative Concentration Pathway) scenarios, the reduction of Dwb in Northeast China and ET on the Tibetan Plateau was projected to accelerate substantially during 2010–30, and half of the total area occupied by ET in 1990 was projected to be redistributed by 2040. Under the most severe scenario (RCP8.5), sub-polar continental winter dry climate over Northeast China would disappear by 2040–50, ET on the Tibetan Plateau would disappear by 2070, and the climate types in 35.9% and 50.8% of China’s land area would change by 2050 and 2100, respectively. The results presented in this paper indicate imperative impacts of anthropogenic climate change on China’s ecoregions in future decades.

DOI

[9]
Chen H P, Sun J Q, 2015. Changes in climate extreme events in China associated with warming.International Journal of Climatology, 35(10): 2735-2751.ABSTRACT The science that humans are the cause of global warming, and that the associated climate change would lead to serious changes in climate extreme events, food production, freshwater resources, biodiversity, human mortality, etc. is unequivocal. After several political negotiations, a 265°C warming has been considered to be the benchmark for such damaging changes. However, an increasing amount of scientific research indicates that higher levels of warming are increasingly likely. What would the world be like if such higher levels of warming occurred? This study aims to provide information for better politically driven mitigation through an investigation of the changes in temperature- and precipitation-based extreme indices using CMIP5 (coupled model intercomparison project phase 5) simulations of a warming of 1, 2, and 365°C in China. Warming simulations show more dramatic effects in China compared with the global average. In general, the results show relatively small change signals in climate extreme events in China at 165°C, larger anomalies at 265°C, and stronger and more extended anomalies at 365°C. Changes in the studied temperature indices indicate that warm events would be more frequent and stronger in the future, and that cold events would be reduced and weakened. For changes in the precipitation indices, extreme precipitation generally increases faster than total wet-day precipitation, and China will experience more intensified extreme precipitation events. Furthermore, the risk of flooding is projected to increase, and the dry conditions over northern China are projected to be mitigated. In certain regions, particularly Southwest China, the risks of both drought and flood events would likely increase despite the decreased total precipitation in the future. Uncertainties mainly derived from inter-model and scenario variabilities are attached to these projections, but a high model agreement can be generally observed in the likelihood of these extreme changes.

DOI

[10]
Cheng Z G, Zhang Y M, Xu Y, 2015. Projection of climate zone shifts in the 21st century in China based on CMIP5 models data.Climate Change Research, 11(2): 93-101. (in Chinese)Climate classification of China in the end of the 20 th century was simulated by using 21 CMIP5 models data and Climatic Research Unit(CRU) data sets.Then,climate classification in the mid and end of the 21 st century under the RCP2.6 and RCP8.5 scenarios was also simulated.The results show that the temporal distribution pattern of temperature and precipitation can be simulated well by CMIP5 data in China and the climate classification simulated by using CRU data sets has good fitness with that of FAO.There is no significant change in climate classification in the 21 st century relative to that in the end of the 20 th century.The range of Cwa and BS climates will increase by 28.2% /86.9% and 24.1% /49.4% in the mid /end of the 21 st century under RCP8.5,compared with that in the end of the 20 th century.Dwa climates will expand,but ET and BW climates will decrease significantly in the end of the 21 st century.

[11]
Ci L J, Yang X H, Chen Z X, 2002. The potential impacts of climate change scenarios on desertification in China.Earth Science Frontiers, 9(2): 287-294. (in Chinese)The feedback mechanism between climate change and desertification has become one of research focuses all over the world, and the reduction of GHGs emission and the combat against desertification have become a global cooperation field. As one of developing countries, China's desertification and its control influences on global climate change; and climate change also influences on desertification in China. In this paper, data from 1914 meteorological stations nationwide are selected as baseline data; and on the basis of the revision of Thornthwaite Equation in Qinghai\|Tibet Plateau using Vegetation Division Map, the HadCM2 model is used to predict the change of desertification\|prone bioclimatic zones in 2030 and 2056. The result shows that the areas of all the desertification\|prone bioclimatic zones have a tendency to increase, and the increasing tendency of the dry sub\|humid area is the highest and that of semi\|arid areas the second. Compared to the 3956 581 thousand square kilometers of desertification\|prone bioclimatic zones in 1990, in the case of 1 percent of annual increasing rate of GHGs with sulphate aerosol effect, the areas will be increased by 11 33 percent and 12 94 percent in 2030 and 2056 respectively; whereas in the case of 0 5 percent of annual increasing rate of GHGs with sulphate aerosol effect, the areas will be increased by 3 75 percent and 6 95 percent in 2030 and 2056 respectively; the latter will be to 7 58 and 5 99 percentage less than the former. Keeping the 0 5 percent of annual increasing rate of GHGs under human alleviation activities, the increasing rate of desertification\|prone bioclimatic zones does slow down, but the total increasing amount is still significant. Hence, further reinforcement of climate\|desertification\|related researches will be helpful to establish the positive feedback between the combat against desertification and the reduction of annual increasing rate of GHGs, which will contribute to environmental protection in China and in the world

[12]
Cook B I, Smerdon J E, Seager R et al., 2014. Global warming and 21st century drying.Climate Dynamics, 43(9/10): 2607-2627.Global warming is expected to increase the frequency and intensity of droughts in the twenty-first century, but the relative contributions from changes in moisture supply (precipitation) versus evaporative demand (potential evapotranspiration; PET) have not been comprehensively assessed. Using output from a suite of general circulation model (GCM) simulations from phase 5 of the Coupled Model Intercomparison Project, projected twenty-first century drying and wetting trends are investigated using two offline indices of surface moisture balance: the Palmer Drought Severity Index (PDSI) and the Standardized Precipitation Evapotranspiration Index (SPEI). PDSI and SPEI projections using precipitation and Penman-Monteith based PET changes from the GCMs generally agree, showing robust cross-model drying in western North America, Central America, the Mediterranean, southern Africa, and the Amazon and robust wetting occurring in the Northern Hemisphere high latitudes and east Africa (PDSI only). The SPEI is more sensitive to PET changes than the PDSI, especially in arid regions such as the Sahara and Middle East. Regional drying and wetting patterns largely mirror the spatially heterogeneous response of precipitation in the models, although drying in the PDSI and SPEI calculations extends beyond the regions of reduced precipitation. This expansion of drying areas is attributed to globally widespread increases in PET, caused by increases in surface net radiation and the vapor pressure deficit. Increased PET not only intensifies drying in areas where precipitation is already reduced, it also drives areas into drought that would otherwise experience little drying or even wetting from precipitation trends alone. This PET amplification effect is largest in the Northern Hemisphere mid-latitudes, and is especially pronounced in western North America, Europe, and southeast China. Compared to PDSI projections using precipitation changes only, the projections incorporating both precipitation and PET changes increase the percentage of global land area projected to experience at least moderate drying (PDSI standard deviation of も 1) by the end of the twenty-first century from 12 to 30 %. PET induced moderate drying is even more severe in the SPEI projections (SPEI standard deviation of も 1; 11 to 44 %), although this is likely less meaningful because much of the PET induced drying in the SPEI occurs in the aforementioned arid regions. Integrated accounting of both the supply and demand sides of the surface moisture balance is therefore critical for characterizing the full range of projected drought risks tied to increasing greenhouse gases and associated warming of the climate system.

DOI

[13]
Crosbie R S, Pollock D W, Mpelasoka F S et al., 2012. Changes in Köppen-Geiger climate types under a future climate for Australia: Hydrological implications.Hydrology & Earth System Sciences, 16(9): 3341-3349.

[14]
Dai A, 2013. Increasing drought under global warming in observations and models.Nature Climate Change, 3(1): 52-58.Historical records of precipitation, streamflow and drought indices all show increased aridity since 1950 over many land areas(1,2). Analyses of model-simulated soil moisture(3,4), drought indices(1,5,6) and precipitation-minus-evaporation(7) suggest increased risk of drought in the twenty-first century. There are, however, large differences in the observed and model-simulated drying patterns(1,2,6). Reconciling these differences is necessary before the model predictions can be trusted. Previous studies(8-12) show that changes in sea surface temperatures have large influences on land precipitation and the inability of the coupled models to reproduce many observed regional precipitation changes is linked to the lack of the observed, largely natural change patterns in sea surface temperatures in coupled model simulations(13). Here I show that the models reproduce not only the influence of El Nino-Southern Oscillation on drought over land, but also the observed global mean aridity trend from 1923 to 2010. Regional differences in observed and model-simulated aridity changes result mainly from natural variations in tropical sea surface temperatures that are often not captured by the coupled models. The unforced natural variations vary among model runs owing to different initial conditions and thus are irreproducible. I conclude that the observed global aridity changes up to 2010 are consistent with model predictions, which suggest severe and widespread droughts in the next 30-90 years over many land areas resulting from either decreased precipitation and/or increased evaporation.

DOI

[15]
Elguindi N, Grundstein A, Bernardes S et al., 2014. Assessment of CMIP5 global model simulations and climate change projections for the 21st century using a modified Thornthwaite climate classification.Climatic Change, 122(4): 523-538.A modified Thornthwaite Climate Classification is applied to a 32-member ensemble of CMIP5 GCMs in order to 1) evaluate model performance in the historical climate and 2) assess projected climate change at the end of the 21 s t century following two greenhouse gas representative concentration pathways (RCP4.5 and RCP8.5). This classification scheme differs from the well-known K ppen approach as it uses potential evapotranspiration for thermal conditions, a moisture index for moisture conditions, and has even intervals between climate classes. The multi-model ensemble (MME) reproduces the main spatial features of the global climate reasonably well, however, in many regions the climate types are too moist. Extreme climate types, such as those found in polar and desert regions, as well as the cool- and cold-wet types of eastern North America and the warm and cool-moist types found in the southern U.S., eastern South America, central Africa and Europe are reproduced best by the MME. In contrast, the cold-dry and cold-semiarid climate types characterizing much of the high northern latitudes and the warm-wet type found in parts of Indonesia and southeast Asia are poorly represented by the MME. Regionally, most models exhibit the same sign in moisture and thermal biases, varying only in magnitude. Substantial changes in climate types are projected in both the RCP4.5 and RCP8.5 scenarios. Area coverage of torrid climate types expands by 11 % and 19 % in the RCP4.5 and RCP8.5 projections, respectively. Furthermore, a large portion of these areas in the tropics will experience thermal conditions which exceed the range of historical values and fall into a novel super torrid climate class. The greatest growth in moisture types in climate zones is among those with dry climates (moisture index values < 0) with increased areas of more than 8 % projected by the RCP8.5 MME.

DOI

[16]
Engelbrecht C J, Engelbrecht F A, 2016. Shifts in Köppen-Geiger climate zones over southern Africa in relation to key global temperature goals.Theoretical & Applied Climatology, 123(1/2): 247-261.Potential changes in K02ppen-Geiger climate zones over southern Africa (Africa south of 22 °S) under future climate change are investigated using an ensemble of high-resolution projections of a regional climate model. The projections are performed under the A2 scenario of the Special Report on Emission Scenarios (SRES), and changes are presented for those times in the future when the increase in global average02surface02temperature reaches thresholds of 1, 2, and 302°C, relative to the present-day baseline climatology. Widespread shifts in climate regimes are projected, of which the southern and eastern expansion of the hot desert and hot steppe zones is the most prominent. From occupying 33.1 and 19.402% of southern Africa under present-day climate, these regions are projected to occupy between 47.3 and 59.702% (hot desert zone) and 24.9 and 29.902% (hot steppe zone) of the region in a future world where the global temperature has increased by 302°C. The cold desert and cold steppe zones are projected to decrease correspondingly. The temperate regions of eastern South Africa, the Cape south coast, and winter rainfall region of the southwestern Cape are also projected to contract. An expansion of the hot steppe zone into the cold steppe and temperate zones may favor the intrusion of trees (and therefore the savanna biome) into the most pristine grasslands of southern Africa. However, the correlative climate-vegetation approach of using projected changes in K02ppen-Geiger zones to infer future vegetation patterns is of limited value in the savanna complex of southern Africa, where complex feedbacks occur between carbon dioxide (CO 2 ) concentrations, trees, C 4 grasses, fire, and climate. The present-day temperate Cape Fynbos regime may come under increasing pressure as the encompassing temperate zone is invaded mainly from the east by the hot steppe climate regime under climate change, with the incidence of Fynbos fires also becoming more likely in a generally warmer and drier climate.

DOI

[17]
Feng S, Ho C H, Hu Q et al., 2012. Evaluating observed and projected future climate changes for the Arctic using the Köppen-Trewartha climate classification.Climate Dynamics, 38(7/8): 1359-1373.The ecosystems in the Arctic region are known to be very sensitive to climate changes. The accelerated warming for the past several decades has profoundly influenced the lives of the native populations and ecosystems in the Arctic. Given that the K02ppen-Trewartha (K-T) climate classification is based on reliable variations of land-surface types (especially vegetation), this study used the K-T scheme to evaluate climate changes and their impact on vegetation for the Arctic (north of 50°N) by analyzing observations as well as model simulations for the period 1900–2099. The models include 16 fully coupled global climate models from the Intergovernmental Panel on Climate Change Fourth Assessment. By the end of this century, the annual-mean surface temperature averaged over Arctic land regions is projected to increase by 3.1, 4.6 and 5.3°C under the Special Report on Emissions Scenario (SRES) B1, A1b, and A2 emission scenarios, respectively. Increasing temperature favors a northward expansion of temperate climate (i.e., Dc and Do in the K-T classification) and boreal oceanic climate (i.e., Eo ) types into areas previously covered by boreal continental climate (i.e., Ec ) and tundra; and tundra into areas occupied by permanent ice. The tundra region is projected to shrink by 611.8602×0210 6 02km 2 (6133.0%) in B1, 612.402×0210 6 02km 2 (6142.6%) in A1b, and 612.502×0210 6 02km 2 (6144.2%) in A2 scenarios by the end of this century. The Ec climate type retreats at least 5° poleward of its present location, resulting in 6118.9, 6130.2, and 6137.1% declines in areal coverage under the B1, A1b and A2 scenarios, respectively. The temperate climate types ( Dc and Do ) advance and take over the area previously covered by Ec . The area covered by Dc climate expands by 4.6102×0210 6 02km 2 (84.6%) in B1, 6.8802×0210 6 02km 2 (126.4%) in A1b, and 8.1602×0210 6 02km 2 (149.6%) in A2 scenarios. The projected redistributions of K-T climate types also differ regionally. In northern Europe and Alaska, the warming may cause more rapid expansion of temperate climate types. Overall, the climate types in 25, 39.1, and 45% of the entire Arctic region are projected to change by the end of this century under the B1, A1b, and A2 scenarios, respectively. Because the K-T climate classification was constructed on the basis of vegetation types, and each K-T climate type is closely associated with certain prevalent vegetation species, the projected large shift in climate types suggests extensive broad-scale redistribution of prevalent ecoregions in the Arctic.

DOI

[18]
Feng S, Hu Q, Huang W et al., 2014. Projected climate regime shift under future global warming from multi-model, multi-scenario CMIP5 simulations.Global & Planetary Change, 112(1): 41-52.This study examined shifts in climate regimes over the global land area using the K02ppen–Trewartha (K–T) climate classification by analyzing observations during 1900–2010, and simulations during 1900–2100 from twenty global climate models participating in Phase 5 of the Coupled Model Inter-comparison Project (CMIP5). Under the Intergovernmental Panel on Climate Change Representative Concentration Pathways 8.5 (RCP8.5) scenario, the models projected a 3°–10°C warming in annual temperature over the global land area by the end of the twenty-first century, with strong (moderate) warming in the high (middle) latitudes of the Northern Hemisphere and weaker warming in the tropics and the Southern Hemisphere. The projected changes in precipitation vary considerably in space and present greater uncertainties among the models. Overall, the models are consistent in projecting increasing precipitation over the high-latitude of the Northern Hemisphere, and reduced precipitation in the Mediterranean, southwestern North America, northern and southern Africa and Australia. Based on the projected changes in temperature and precipitation, the K–T climate types would shift toward warmer and drier climate types from the current climate distribution. Regions of temperate, tropical and dry climate types are projected to expand, while regions of polar, sub-polar and subtropical climate types are projected to contract. The magnitudes of the projected changes are stronger in the RCP8.5 scenario than the low emission scenario RCP4.5. On average, the climate types in 31.4% and 46.3% of the global land area are projected to change by the end of the twenty-first century under RCP4.5 and RCP8.5 scenarios, respectively. Further analysis suggests that changes in precipitation played a slightly more important role in causing shifts of climate type during the twentieth century. However, the projected changes in temperature play an increasingly important role and dominate shifts in climate type when the warming becomes more pronounced in the twenty-first century.

DOI

[19]
Fu C, 1992. Transitional Climate Zones and Biome Boundaries: A Case Study from China. New York: Springer.Boundary regions between continental-scale climatic zones are characterized by strong gradients in climate variables, such as temperature, humidity, wind speed and direction, and climate instability. This instability in climate may cause these boundary zones to be particularly sensitive to the natural and anthropogenic factors associated with global change (di Castri et al. 1988; Delcourt and Delcourt, Chapter 2, this volume).

DOI

[20]
Fu Y H, Zhao H, Piao S et al., 2015. Declining global warming effects on the phenology of spring leaf unfolding.Nature, 526(7571): 104. doi: 10.1038/nature15402.Heat requirement, expressed in growing degree days (GDD), is a widely used method to assess and predict the effect of temperature on plant development. Until recently, the analysis of spatial patterns of GDD requirement for spring vegetation green-up onset was limited to local and regional scales, mainly because of the sparse and aggregated spatial availability of ground phenology data. Taking... [Show full abstract]

DOI PMID

[21]
Gao X J, Giorgi F, 2008. Increased aridity in the Mediterranean region under greenhouse gas forcing estimated from high resolution simulations with a regional climate model.Global & Planetary Change, 62(3): 195-209.We use three measures of aridity, the K ppen climate classification, the UNEP aridity index and the Budyko dryness index, to estimate the possible effects of late 21st century climate change on the Mediterranean region under increased greenhouse gas concentrations (A2 and B2 IPCC emission scenarios) as simulated with a high resolution (20 km grid interval) regional climate model (the ICTP RegCM). A basic validation of the reference simulation along with a brief discussion of the surface climate changes for the A2 and B2 scenarios is also provided. Analysis of the changes in all three aridity measures indicates that by the end of the 21st century the Mediterranean region might experience a substantial increase in the northward extension of dry and arid lands, particularly in the central and southern portions of the Iberian, Italian, Hellenic and Turkish peninsulas and in areas of southeastern Europe (e.g. Romania and Bulgaria), the Middle East, northern Africa and major Islands (Corsica, Sardinia and Sicily). Most Ice-Cap areas of the Alps are also projected to disappear. These effects are due to a large warming and pronounced decrease in precipitation, especially during the spring and summer seasons. In addition, fine scale topography and coastline features affect the aridity change signal. We identify the southern Mediterranean as a region particularly vulnerable to water stress and desertification processes under climate change conditions.

DOI

[22]
Gerstengarbe F W, Werner P C, 2009. A short update on Koeppen climate shifts in Europe between 1901 and 2003.Climatic Change, 92(1/2): 99-107.The question is investigated how far global warming in the period 1901 2003 will affect the region of Europe. For this purpose, changes of the climate zones that exist according to Koeppen will be analysed. The trends and outliers in terms of expansion and location of individual climate types are used as statistical indicators of climate change. The most important results of this study are: a) a significant increase of the extension of the climate types BS and Cr; b) a significant decrease of the extension of the climate types Dc and Ec; c) the largest changes are observed within the last two decades. These changes are discussed in relation to the mean conditions of temperature and precipitation. Moreover, significant correlations between the area extensions of climate types and the NAO index could be found.

DOI

[23]
Gnanadesikan A, Stouffer R J, 2006. Diagnosing atmosphere-ocean general circulation model errors relevant to the terrestrial biosphere using the Köppen climate classification.Geophysical Research Letters, 33(22): 2832-2849.http://www.agu.org/pubs/crossref/2006/2006GL028098.shtml

DOI

[24]
Greve P, Seneviratne S I, 2015. Assessment of future changes in water availability and aridity.Geophysical Research Letters, 42(13): 5493-5499.Substantial changes in the hydrological cycle are projected for the 21st century, but these projections are subject to major uncertainties. In this context, the “dry gets drier, wet gets wetter” (DDWW) paradigm is often used as a simplifying summary. However, recent studies cast doubt on the validity of the paradigm and also on applying the widely usedP61E(precipitation656165evapotranspiration) metric over global land surfaces. Here we show in a comprehensive CMIP5‐based assessment that projected changes in mean annualP61Eare generally not significant, except for high‐latitude regions showing wetting conditions until the end of the 21st century. Significant increases in aridity do occur in many subtropical and also adjacent humid regions. However, combining both metrics still shows that approximately 70% of all land area will not experience significant changes. Based on these findings, we conclude that the DDWW paradigm is generally not confirmed for projected changes in most land areas. Future changes in water availability and aridity are assessedUnderlying uncertainties are explicitly taken into accountThe “dry gets drier, wet gets wetter” paradigm is challenged Future changes in water availability and aridity are assessed Underlying uncertainties are explicitly taken into account The “dry gets drier, wet gets wetter” paradigm is challenged

DOI PMID

[25]
Grundstein A, 2008. Assessing climate change in the contiguous United States using a modified Thornthwaite climate classification scheme.Professional Geographer, 60(3): 398-412.Climate change across the contiguous United States is investigated using a modified version of Thornthwaite's climate classification scheme. This approach allows both moisture and thermal conditions to be examined simultaneously for a better assessment of multivariate climate change. Changes in area of different climate types over time is determined using the climate year approach and the spatial nature of climate change is examined by computing climate types based on averages from three thirty-year periods over the twentieth century. Over the study period from 1895 to 2005, statistically significant changes in areal coverage of different climate types have occurred. In the eastern half of the country, climate divisions have become wetter and changed to moister climate categories. The most prominent change has occurred in the Deep South, where the climate has changed to both a lower thermal category and a wetter moisture category. Much of the country has experienced positive temperature trends, but only climate divisions in the Southwest and Upper Midwest show changes to higher thermal categories.

DOI

[26]
Hanf F, Körper J, Spangehl T et al., 2012. Shifts of climate zones in multi-model climate change experiments using the Köppen climate classification.Meteorologische Zeitschrift, 21(2): 111-123.This study investigates the future changes in the climate zones' distribution of the Earth's land area due to increasing atmospheric greenhouse gas concentrations in three IPCC SRES emissions scenarios (A1B, A2 and B1). The K ppen climate classification is applied to climate simulations of seven atmosphere-ocean general circulation models (AOGCMs) and their multi-model mean. The evaluation of the skill of the individual climate models compared to an observation-reanalysis-based climate classification provides a first order estimate of relevant model uncertainties and serves as assessment for the confidence in the scenario projections. Uncertainties related to differences in simulation pathways of the future projections are estimated by both, the multi-model ensemble spread of the climate change signals for a given scenario and differences between different scenarios. For the recent climate the individual models fail to capture the exact K ppen climate types in about 24 39 % of the global land area excluding Antarctica due to temperature and precipitation biases, while the multi-model ensemble mean simulates the present day observation-reanalysisbased distribution of the climate types more accurately. For the end of the 21century compared to the present day climate the patterns of change are similar across the three scenarios, while the magnitude of change is largest for the highest emission scenario. Moreover, the temporal development of the climate shifts from the end of the 20st century and during the 21century show that changes of the multi-model ensemble mean for the A2 and B1 scenario are generally within the ensemble spread of the individual models for the A1B scenario, illustrating that for the given range of scenarios the model uncertainty is even larger than the spread given by the different GHG concentration pathways. The multi-model ensemble mean's projections show climate shifts to dryer climates in the subtropics (Australia, Mediterranean Basin, southern Africa). This is consistent with an increase of area classified as Tropical Savanna Climate as well as Dry Climates. Furthermore, there is a poleward extension of the warmer climate types in the northern hemisphere causing a retreat of regions with Cold Climate with Moist Winter and Tundra Climate. The European region shows largest changes comparing the shifts in the different continents (37.1 % of the European land area) as a result of a large extension of the Humid Temperate Climate across eastern and north-eastern Europe at the cost of the Cold Climate with Moist Winter.

DOI

[27]
Hempel S, Frieler K, Warszawski L et al., 2013. A trend-preserving bias correction- The ISI-MIP approach.Earth System Dynamics, 4(2): 219-236.Statistical bias correction is commonly applied within climate impact modelling to correct climate model data for systematic deviations of the simulated historical data from observations. Methods are based on transfer functions generated to map the distribution of the simulated historical data to that of the observations. Those are subsequently applied to correct the future projections. Here, we present the bias correction method that was developed within ISI-MIP, the first Inter-Sectoral Impact Model Intercomparison Project. ISI-MIP is designed to synthesise impact projections in the agriculture, water, biome, health, and infrastructure sectors at different levels of global warming. <br><br> Bias-corrected climate data that are used as input for the impact simulations could be only provided over land areas. To ensure consistency with the global (land + ocean) temperature information the bias correction method has to preserve the warming signal. Here we present the applied method that preserves the absolute changes in monthly temperature, and relative changes in monthly values of precipitation and the other variables needed for ISI-MIP. The proposed methodology represents a modification of the transfer function approach applied in the Water Model Intercomparison Project (Water-MIP). Correction of the monthly mean is followed by correction of the daily variability about the monthly mean. <br><br> Besides the general idea and technical details of the ISI-MIP method, we show and discuss the potential and limitations of the applied bias correction. In particular, while the trend and the long-term mean are well represented, limitations with regards to the adjustment of the variability persist which may affect, e.g. small scale features or extremes.

DOI

[28]
Huang J P, Ji M X, Xie Y K et al., 2016a. Global semi-arid climate change over last 60 years.Climate Dynamics, 46(3/4): 1131-1150.This study analyzes areal changes and regional climate variations in global semi-arid regions over 61 years (1948-2008) and investigates the dynamics of global semi-arid climate change. The results reveal that the largest expansion of drylands has occurred in semi-arid regions since the early 1960s. This expansion of semi-arid regions accounts for more than half of the total dryland expansion. The area of semi-arid regions in the most recent 15 years studied (1990-2004) is 7 % larger than that during the first 15 years (1948-1962) of the study period; this expansion totaled 0.4 x 10(6) and 1.2 x 10(6) km(2) within the American continents and in the Eastern Hemisphere, respectively. Although semi-arid expansion occurred in both regions, the shifting patterns of the expansion are different. Across the American continents, the newly formed semi-arid regions developed from arid regions, in which the climate became wetter. Conversely, in the continental Eastern Hemisphere, semi-arid regions replaced sub-humid/humid regions, in which the climate became drier. The climate change in drying semi-arid regions over East Asia is primarily dominated by a weakened East Asian summer monsoon, while the wetting of semi-arid regions over North America is primarily controlled by enhanced westerlies.

DOI

[29]
Huang J P, Yu H P, Guan X D et al., 2016b. Accelerated dryland expansion under climate change.Nature Climate Change, 6(2): 166-171.Drylands are home to more than 38% of the total global population and are one of the most sensitive areas to climate change and human activities. Projecting the areal change in drylands is essential for taking early action to prevent the aggravation of global desertification. However, dryland expansion has been underestimated in the Fifth Coupled Model Intercomparison Project (CMIP5) simulations considering the past 58 years (1948-2005). Here, using historical data to bias-correct CMIP5 projections, we show an increase in dryland expansion rate resulting in the drylands covering half of the global land surface by the end of this century. Dryland area, projected under representative concentration pathways (RCPs) RCP8.5 and RCP4.5, will increase by 23% and 11%, respectively, relative to 1961-1990 baseline, equalling 56% and 50%, respectively, of total land surface. Such an expansion of drylands would lead to reduced carbon sequestration and enhanced regional warming, resulting in warming trends over the present drylands that are double those over humid regions. The increasing aridity, enhanced warming and rapidly growing human population will exacerbate the risk of land degradation and desertification in the near future in the drylands of developing countries, where 78% of dryland expansion and 50% of the population growth will occur under RCP8.5.

DOI

[30]
IPCC, 2013. Climate Change 2013: The Physical Science Basis. Contribution of Working Group I to the Fifth Assessment Report of the Intergovernmental Panel on Climate Change. Cambridge, United Kingdom and New York, USA: Cambridge University Press.

[31]
Jiang J, Jiang D B, Lin Y H, 2017. Changes and projection of dry/wet areas over China.Chinese Journal of Atmospheric Sciences, 41(1): 43-56. (in Chinese)Based on the dry/wet index, the authors analyzed changes in dry/wet regions over China and projected their future change scenarios using CMIP5(Coupled Model Intercomparison Project Phase 5) models. For the period of 1962 2011, the results show that the averages of extreme arid, arid, semi-arid, semi-humid, and humid regions account for 2.8%, 11.7%, 22.4%, 32.6%, and 30.5% of the land area of the country, respectively. The dry/wet index decreases overall and tends to become wet in the west and dry in the east. There is a significant contraction of humid and extremearid regions but a significant expansion of semi-humid, semi-arid, and arid regions, indicating an increase in the climatically sensitive regions. The distribution of the change trend of dry/wet index during the spring and autumn resembles that of the annual mean, and the northwest tends to become dry during the winter while the southeast is becoming wet during the summer. Under the RCP4.5(Representative Concentration Pathway 4.5) scenario, the median of the 18 CMIP5 models shows that, relative to the period of 1986 2005, annual precipitation would decrease only in the southeast, and the potential evapotranspiration would increase over the entire country, leading to dry/wet index decreases in most regions except the western part. The humid, arid, and extreme arid regions would reduce, while the opposite is true for the semi-arid and semi-humid regions.

[32]
Joshi M, Hawkins E, Sutton R et al., 2011. Projections of when temperature change will exceed 2°C above pre-industrial levels.Nature Climate Change, 1(8): 407-412.

DOI

[33]
Knutti R, Furrer R, Tebaldi C et al., 2010. Challenges in combining projections from multiple climate models.Journal of Climate, 23(10): 2739-2758.Abstract Recent coordinated efforts, in which numerous general circulation climate models have been run for a common set of experiments, have produced large datasets of projections of future climate for various scenarios. Those multimodel ensembles sample initial conditions, parameters, and structural uncertainties in the model design, and they have prompted a variety of approaches to quantifying uncertainty in future climate change. International climate change assessments also rely heavily on these models. These assessments often provide equal-weighted averages as best-guess results, assuming that individual model biases will at least partly cancel and that a model average prediction is more likely to be correct than a prediction from a single model based on the result that a multimodel average of present-day climate generally outperforms any individual model. This study outlines the motivation for using multimodel ensembles and discusses various challenges in interpreting them. Among these challenges a...

DOI

[34]
Leng G Y, Tang Q H, Rayburg S, 2015. Climate change impacts on meteorological, agricultural and hydrological droughts in China.Global & Planetary Change, 126: 23-34.中国科学院机构知识库(CAS IR GRID)以发展机构知识能力和知识管理能力为目标,快速实现对本机构知识资产的收集、长期保存、合理传播利用,积极建设对知识内容进行捕获、转化、传播、利用和审计的能力,逐步建设包括知识内容分析、关系分析和能力审计在内的知识服务能力,开展综合知识管理。

DOI

[35]
Li M X, Ma Z G, 2013. Soil moisture-based study of the variability of dry-wet climate and climate zones in China.Chinese Science Bulletin, 58(Suppl.1): 531-544.An ensemble soil moisture dataset was produced from 11 of 25 global climate model (GCM) simulations for two climate scenarios spanning 1900 to 2099; this dataset was based on an evaluation of the spatial correlation of means and trends in reference to soil moisture simulations conducted using the community land model driven by observed atmospheric forcing. Using the ensemble soil moisture index, we analyzed the dry-wet climate variability and the dynamics of the climate zone boundaries in China over this 199-year period. The results showed that soil moisture increased in the typically arid regions, but with insignificant trends in the humid regions; furthermore, the soil moisture exhibited strong oscillations with significant drought trends in the transition zones between arid and humid regions. The dynamics of climate zone boundaries indicated that the expansion of semiarid regions and the contraction of semi-humid regions are typical characteristics of the dry-wet climate variability for two scenarios in China. During the 20th century, the total area of semiarid regions expanded by 11.5% north of 30 degrees N in China, compared to the average area for 1970-1999, but that of semi-humid regions decreased by approximately 9.8% in comparison to the average for the period of 1970-1999, even though the transfer area of the humid to the semi-humid regions was taken into account. For the 21st century, the dynamics exhibit similar trends of climate boundaries, but with greater intensity.

DOI

[36]
Lohmann R, 1993. The Koppen climate classification as a diagnostic tool for general circulation models.Climate Research, 3(3): 177-193.Koppen climate classification was applied to the output of atmospheric general circulation models and coupled atmosphere-ocean circulation models. The classification was used to validate model control runs of the present climate and to analyse greenhouse gas warming simulations The most prominent results of the global warming con~putationsw ere a retreat of regions of permafrost and the increase of areas with tropical rainy climates and dry climates.

DOI

[37]
Ma Z G, Fu C B, Dan L, 2005. Decadal variations of arid and semi-arid boundary in China.Chinese Journal of Geophysics, 48(3): 519-525. (in Chinese)Decadal variations of arid and semi-arid boundary in China during last 100 years have been analyzed by using Thornthwaite's method. The results indicate that, during the last 50 years, there is a distinguished periodic variation of arid and semi-arid boundary in their locations in the middle part of northeast China and northern part of central northern China, and an obvious trend moving to east. In south part of Shannxi province and central northern China, the boundaries of arid and semi-arid areas have been moving to the south, and there is also a periodic variation in the locations, the boundary of semi-arid area reaches the largest extent to the south. During the last 100 years, there is a trend of the boundaries moving to the south or east, and in the south part of northern China and the central part of northeast China, the extent and intensity of arid and semi-arid area was the largest and severest in the 1920s. The location variation of arid and semi-arid boundaries is closely related to regional warming and precipitation reduction.

DOI

[38]
Mahlstein I, Daniel J S, Solomon S, 2013. Pace of shifts in climate regions increases with global temperature.Nature Climate Change, 3(8): 739-743.Human-induced climate change causes significant changes in local climates, which in turn lead to changes in regional climate zones. Large shifts in the world distribution of K ppen-Geiger climate classifications by the end of this century have been projected. However, only a few studies have analysed the pace of these shifts in climate zones, and none has analysed whether the pace itself changes with increasing global mean temperature. In this study, pace refers to the rate at which climate zones change as a function of amount of global warming. Here we show that present climate projections suggest that the pace of shifting climate zones increases approximately linearly with increasing global temperature. Using the RCP8.5 emissions pathway, the pace nearly doubles by the end of this century and about 20% of all land area undergoes a change in its original climate. This implies that species will have increasingly less time to adapt to K ppen zone changes in the future, which is expected to increase the risk of extinction.

DOI

[39]
Mcevoy D J, Huntington J L, Mejia J F et al., 2016. Improved seasonal drought forecasts using reference evapotranspiration anomalies.Geophysical Research Letters, 43(1): 377-385.A novel contiguous United States (CONUS) wide evaluation of reference evapotranspiration (ET; a formulation of evaporative demand) anomalies is performed using the Climate Forecast System version 2 (CFSv2) reforecast data for 1982-2009. This evaluation was motivated by recent research showing ETanomalies can accurately represent drought through exploitation of the complementary relationship between actual evapotranspiration and ET. Moderate forecast skill of ETwas found up to leads of 5 months and was consistently better than precipitation skill over most of CONUS. Forecasts of ETduring drought events revealed high categorical skill for notable warm-season droughts of 1988 and 1999 in the central and northeast CONUS, with precipitation skill being much lower or absent. Increased ETskill was found in several climate regions when CFSv2 forecasts were initialized during moderate-to-strong El Ni o-Southern Oscillation events. Our findings suggest that ETanomaly forecasts can improve and complement existing seasonal drought forecasts.

DOI

[40]
Moral F J, Paniagua L L, Rebollo F J et al., 2016. Spatial analysis of the annual and seasonal aridity trends in Extremadura, southwestern Spain.Theoretical & Applied Climatology, 130(3/4): 917-932.The knowledge of drought (or wetness) conditions is necessary not only for a rational use of water resources but also for explaining landscape and ecology characteristics. An increase in aridity in ma

DOI

[41]
Moss R H, Edmonds J A, Hibbard K A et al., 2010. The next generation of scenarios for climate change research and assessment.Nature, 463(7282): 747-756.

DOI

[42]
Pierce D W, Barnett T P, Santer B D et al., 2009. Selecting global climate models for regional climate change studies.Proceedings of the National Academy of Sciences, 106(21): 8441-8446.Regional or local climate change modeling studies currently require starting with a global climate model, then downscaling to the region of interest. How should global models be chosen for such studies, and what effect do such choices have? This question is addressed in the context of a regional climate detection and attribution (D&A) study of January-February-March (JFM) temperature over the western U.S. Models are often selected for a regional D&A analysis based on the quality of the simulated regional climate. Accordingly, 42 performance metrics based on seasonal temperature and precipitation, the El Nino/Southern Oscillation (ENSO), and the Pacific Decadal Oscillation are constructed and applied to 21 global models. However, no strong relationship is found between the score of the models on the metrics and results of the D&A analysis. Instead, the importance of having ensembles of runs with enough realizations to reduce the effects of natural internal climate variability is emphasized. Also, the superiority of the multimodel ensemble average (MM) to any 1 individual model, already found in global studies examining the mean climate, is true in this regional study that includes measures of variability as well. Evidence is shown that this superiority is largely caused by the cancellation of offsetting errors in the individual global models. Results with both the MM and models picked randomly confirm the original D&A results of anthropogenically forced JFM temperature changes in the western U.S. Future projections of temperature do not depend on model performance until the 2080s, after which the better performing models show warmer temperatures.

DOI

[43]
Piontek F, Müller C, Pugh T A et al., 2014. Multisectoral climate impact hotspots in a warming world.Proceedings of the National Academy of Sciences, 111(9): 3233-3238.The impacts of global climate change on different aspects of humanity's diverse life-support systems are complex and often difficult to predict. To facilitate policy decisions on mitigation and adaptation strategies, it is necessary to understand, quantify, and synthesize these climate-change impacts, taking into account their uncertainties. Crucial to these decisions is an understanding of how impacts in different sectors overlap, as overlapping impacts increase exposure, lead to interactions of impacts, and are likely to raise adaptation pressure. As a first step we develop herein a framework to study coinciding impacts and identify regional exposure hotspots. This framework can then be used as a starting point for regional case studies on vulnerability and multifaceted adaptation strategies. We consider impacts related to water, agriculture, ecosystems, and malaria at different levels of global warming. Multisectoral overlap starts to be seen robustly at a mean global warming of 3 C above the 1980-2010 mean, with 11% of the world population subject to severe impacts in at least two of the four impact sectors at 4 C. Despite these general conclusions, we find that uncertainty arising from the impact models is considerable, and larger than that from the climate models. In a low probability-high impact worst-case assessment, almost the whole inhabited world is at risk for multisectoral pressures. Hence, there is a pressing need for an increased research effort to develop a more comprehensive understanding of impacts, as well as for the development of policy measures under existing uncertainty.

DOI PMID

[44]
Qian W H, Ding T, Hu H R et al., 2009. An overview of dry-wet climate variability among monsoon-westerly regions and the monsoon northernmost marginal active zone in China.Advances in Atmospheric Sciences, 26(4): 630-641.

DOI

[45]
Reid P C, Hari R E, Beaugrand G et al., 2015. Global impacts of the 1980s regime shift.Global Change Biology, 22(2): 682-703.Abstract Despite evidence from a number of Earth systems that abrupt temporal changes known as regime shifts are important, their nature, scale and mechanisms remain poorly documented and understood. Applying principal component analysis, change-point analysis and a sequential t -test analysis of regime shifts to 72 time series, we confirm that the 1980s regime shift represented a major change in the Earth's biophysical systems from the upper atmosphere to the depths of the ocean and from the Arctic to the Antarctic, and occurred at slightly different times around the world. Using historical climate model simulations from the Coupled Model Intercomparison Project Phase 5 (CMIP5) and statistical modelling of historical temperatures, we then demonstrate that this event was triggered by rapid global warming from anthropogenic plus natural forcing, the latter associated with the recovery from the El Chich n volcanic eruption. The shift in temperature that occurred at this time is hypothesized as the main forcing for a cascade of abrupt environmental changes. Within the context of the last century or more, the 1980s event was unique in terms of its global scope and scale; our observed consequences imply that if unavoidable natural events such as major volcanic eruptions interact with anthropogenic warming unforeseen multiplier effects may occur.

DOI PMID

[46]
Rohli R V, Joyner T A, Reynolds S J et al., 2015. Globally extended Kӧppen-Geiger climate classification and temporal shifts in terrestrial climatic types.Physical Geography, 36(2): 142-157.Increasing awareness of the impacts of global climate change on marine ecosystems and concerns about shifting bioclimatic and agricultural zones necessitate a reassessment of the geographical distribution of Earth090005s climate types. In recent years, the availability of truly global data-sets has allowed for the application of climatic types, including the K07§ppen090009Geiger system, over the oceans. This research uses NCAR Reanalysis data to create a global 090004Extended K07§ppen090009Geiger climate classification090005, including the world ocean, for the 19810908082010 averaging period. The percentages of Earth090005s surface covered by tropical rainforest (Af), tropical monsoon (Am), and (especially) the mesothermal090009 mild summer (Cfc) climate types are much larger than in the terrestrial only analysis. Expanding and contracting terrestrial climate zones are also identified based on the differences in the total area through comparison with maps produced for 19010908081925, 19260908081950, 19510908081975, 19760908082000 and model-output-based predicted K07§ppen090009Geiger types for 20760908082100. Results suggest that hot desert (BWh), hot semi-arid (BSh), and Af climatic types are projected to expand, while the tundra and most mesothermal and microthermal types will decrease in area. These results assist in projecting global impacts of climatic change.

DOI

[47]
Roudier P, Andersson J C M, Donnelly C et al., 2016. Projections of future floods and hydrological droughts in Europe under a +2°C global warming.Climatic Change, 135(2): 341-355.

DOI

[48]
Schlaepfer D R, Bradford J B, Lauenroth W K et al., 2017. Climate change reduces extent of temperate drylands and intensifies drought in deep soils.Nature Communications, 8: 14196. doi: 10.1038/ncomms14196.Drylands cover 40% of the global terrestrial surface and provide important ecosystem services. While drylands as a whole are expected to increase in extent and aridity in coming decades, temperature and precipitation forecasts vary by latitude and geographic region suggesting different trajectories for tropical, subtropical, and temperate drylands. Uncertainty in the future of tropical and subtropical drylands is well constrained, whereas soil moisture and ecological droughts, which drive vegetation productivity and composition, remain poorly understood in temperate drylands. Here we show that, over the twenty first century, temperate drylands may contract by a third, primarily converting to subtropical drylands, and that deep soil layers could be increasingly dry during the growing season. These changes imply major shifts in vegetation and ecosystem service delivery. Our results illustrate the importance of appropriate drought measures and, as a global study that focuses on temperate drylands, highlight a distinct fate for these highly populated areas. Future stress on water resources, and on temperate drylands in particular, remains uncertain. Here, the authors show that climate in the late twenty first century may reduce the extent of temperate drylands, dry deep soils, and create intra-regional and intercontinental differences in ecological drought.

DOI PMID

[49]
Schleussner C F, Lissner T K, Fischer E M et al., 2016. Differential climate impacts for policy-relevant limits to global warming: the case of 1.5°C and 2°C.Earth System Dynamics, 7(2): 327-351.

DOI

[50]
Sherwood S, Fu Q, 2014. A drier future?Science, 343(6172): 737-739.

DOI

[51]
Shi Z T, 1996. Regional characters of natural disaster in marginal monsoon belt of China.Journal of Arid Land Resources & Environment, 10(4): 1-7. (in Chinese)The Monsoon Marginal Belt refers to the region which belongs to internal continent influenced by Asian Summer Monsoon fluctuation. The marginal monsoon area lies in thecentral part of China with the runing of NE-SW and can be divided into south part andnorth part. Because the marginal monsoon area is sensitive to climatic changes,the ecological environment is weak. There exist various natural disasters in the marginal monsoonarea of China,including all types of disasters in atmosphere,lithosphpere and biosphere. Inaddition,the human activities increase and strenthen the disasters.

[52]
Swain S, Hayhoe K, 2015. CMIP5 projected changes in spring and summer drought and wet conditions over North America.Climate Dynamics, 44(9/10): 2737-2750.Climate change is expected to alter the mean and variability of future spring and summer drought and wet conditions during the twenty-first century across North America, as characterized by the Standardized Precipitation Index (SPI). Based on Coupled Model Intercomparison Project phase 5 simulations, statistically significant increases are projected in mean spring SPI over the northern part of the continent, and drier conditions across the southwest. Dry conditions in summer also increase, particularly throughout the central Great Plains. By end of century, greater changes are projected under a higher radiative forcing scenario (RCP 8.5) as compared to moderate (RCP 6.0) and lower (RCP 4.5). Analysis of projected changes standardized to a range of global warming thresholds from +1 to +4 C reveals a consistent spatial pattern of wetter conditions in the northern and drier conditions in the southwestern part of the continent in spring that intensifies under increased warming, suggesting that the magnitude of projected changes in wetness and drought may scale with global temperature. For many regions, SPI interannual variability is also projected to increase (even for regions that are projected to become drier), indicating that climate may become more extreme under greater warming, with increased frequency of both extreme dry and wet seasons. Quantifying the direction and magnitude of projected future trends from global warming is key to informing strategies to mitigate human influence on climate and help natural and managed resources adapt.

DOI

[53]
Sylla M B, Elguindi N, Giorgi F et al., 2015. Projected robust shift of climate zones over West Africa in response to anthropogenic climate change for the late 21st century.Climatic Change, 134(1/2): 1-13.The response of West African climate zones to anthropogenic climate change during the late 21st century is investigated using the revised Thornthwaite climate classification applied to ensembles of CM

DOI

[54]
Taylor K E, Stouffer R J, Meehl G A, 2012. An overview of CMIP5 and the experiment design.Bulletin of the American Meteorological Society, 93(4): 485-498.

DOI

[55]
Trenberth K E, Dai A, van derSchrier G et al., 2013. Global warming and changes in drought.Nature Climate Change, 4(1): 17-22.Several recently published studies have produced apparently conflicting results of how drought is changing under climate change. The reason is thought to lie in the formulation of the Palmer Drought Severity Index (PDSI) and the data sets used to determine the evapotranspiration component. Here, we make an assessment of the issues with the PDSI in which several other sources of discrepancy emerge, not least how precipitation has changed and is analysed. As well as an improvement in the precipitation data available, accurate attribution of the causes of drought requires accounting for natural variability, especially El Ni o/Southern Oscillation effects, owing to the predilection for wetter land during La Ni a events. Increased heating from global warming may not cause droughts but it is expected that when droughts occur they are likely to set in quicker and be more intense.

DOI

[56]
Vautard R, Gobiet A, Sobolowski S et al., 2014. The European climate under a 2°C global warming.Booklist, 9(3): 034006. doi: 10.1088/1748-9326/9/3/034006.

[57]
Wang L, Chen W, 2014. A CMIP5 multimodel projection of future temperature, precipitation, and climatological drought in China.International Journal of Climatology, 34(6): 2059-2078.ABSTRACTIn this study, fine-resolution multimodel climate projections over China are developed based on 35 climate models and two emissions scenarios (RCP4.5 and RCP8.5) from phase five of the Coupled Model Intercomparison Project (CMIP5) by means of Bias Correction and Spatial Disaggregation. The yearly-averaged temperature is projected to increase by 0.8 to 1.665°C (0.8 to 1.765°C), 1.5 to 2.765°C (2 to 3.765°C), and 1.9 to 3.365°C (3.4 to 665°C) under RCP4.5 (RCP8.5) in three time slices (2010–2039, 2040–2069, and 2070–2099), respectively. The most warming occurs in winter and the least in summer, and the inland areas in the northwest will warm much faster than the southeast. Under the background of surface warming, the probability of extreme low temperatures in winter defined as the monthly temperature being lower than the 9th percentile of the climatological distribution will sharply reduce to 0.1–1.7% under RCP4.5 for the period 2010–2039 and even lower for the following decades. For precipitation change, a remarkable increase is found over most areas of China except the Southwest, ranging from approximately 2 to 20%. The projected precipitation changes are highly robust in northern China, but inconsistent in southern China. In spite of widespread precipitation increases, most areas of China quantified by the Palmer Drought Severity Index are projected to become drier as a consequence of increasing evaporation driven by temperature increases. Detailed examination shows that drought that is moderate or severe according to current climate standards will become the norm in the future. Not only will incidences of severe and extreme drought increase dramatically in the future, but extreme wet events will also become more probable. Furthermore, the increasing drought risk in Southwest China and the Qinghai-Tibetan Plateau is nearly twice that for other parts of China.

DOI

[58]
Wang L, Chen W, Huang G et al., 2016. Changes of the transitional climate zone in East Asia: past and future.Climate Dynamics, 49(4): 1463-1477.The transitional climate zone (TCZ) between humid and arid regions in East Asia is characterized by sharp climate and biome gradients, interaction between the East Asian summer monsoon and the mid-latitude westerly winds and mixed agriculture-pasture activities. Consequently, it is highly vulnerable to natural disturbances and particularly human-driven global change. This study aims to illuminate the spatial and temporal variation of TCZ across both the retrospective and the prospective periods. In the historical period, both the front and rear edges of TCZ exhibit wide year-to-year excursions and have experienced coastward migration with increasing aridity throughout TCZ. Furthermore, precipitation fluctuation mainly contributes to interannual variability of TCZ whereas potential evaporation behavior dominates the long-term trends of TCZ. Models are capable of largely reproducing the shape and orientation of TCZ, although northwestward bias is apparent. In global warming scenario period, there will be continuing southeastward displacement for the front edge but the opposite northwestward movement is projected for the rear one, as a consequence of significant drying trends in the humid zone together with regime shifts towards humid conditions in the arid zone. Despite expanded TCZ sector, however, the available water resources inside it suffer little magnitude changes without preferential tendency towards either drier or wetter conditions, implying neither deleterious nor beneficial effects on the TCZ environment. Moreover, interannual variability of TCZ is expected to become stronger, resulting in more frequent occurrences of extreme swings. Finally, it is noted that uncertainty arising from climate models dominates in the TCZ than dispersed emission scenarios, in contrast to the situation in humid and arid zones.

DOI

[59]
Warszawski L, Frieler K, Huber V et al., 2014. The Inter-Sectoral Impact Model Intercomparison Project (ISI-MIP): Project framework.Proceedings of the National Academy of Sciences, 111(9): 3228-3232.The Inter-Sectoral Impact Model Intercomparison Project offers a framework to compare climate impact projections in different sectors and at different scales. Consistent climate and socio-economic input data provide the basis for a cross-sectoral integration of impact projections. The project is designed to enable quantitative synthesis of climate change impacts at different levels of global warming. This report briefly outlines the objectives and framework of the first, fast-tracked phase of Inter-Sectoral Impact Model Intercomparison Project, based on global impact models, and provides an overview of the participating models, input data, and scenario set-up.

DOI

[60]
Wu S H, Yin Y H, Zheng D et al., 2005. Aridity/humidity status of land surface in China during the last three decades.Science in China Ser D Earth Sciences, 48(9): 1510-1518.To clarify aridity/humidity status of land surface is helpful for studying environmental background and regional differences, seeking causes of environmental change, and providing a scientific basis for researches on climate change in the future. In this paper, the authors calculated potential evapotranspiration of China using data from 616 meteorological stations during the period of 1971-2000 with the Penman-Monteith model recommanded by FAO in 1998. Vysothkii model was used to calculate aridity/humidity index. Then the calculated results of sta-tions were interpolated to land surface using ArcGIS. Results show that the annual average potential evapotranspiration is 400-1500 mm in the whole country, 600-800 mm in most parts of it; and 350-1400 mm in growing season (April-Octobor), which is nearly 200 mm less than the annual average. According to the aridity/humidity indexes of 1.0, 1.5 and 4.0, the aridity/humidity status is categorized to four types, namely, humid, subhumid, semiarid and arid. A majority of stations (76%) are more humid in growing season than the annual average. Results of comprisons between the distribution map of aridity/humidity index with that of precipitation and vegetation indicate a good consistence of aridity/humidity status with natural environment. Therefore potential evapotranspiration calculated with modified FAO Penman-Monteith model in combination with aridity/humidity index that considers water balance can more reasonably explain the actual land surface aridity/humidity status of China.

DOI

[61]
Wu S H, Yin Y H, Zheng D et al., 2010. Moisture conditions and climate trends in China during the period 1971-2000.International Journal of Climatology, 26(2): 193-206.This paper describes the general moisture conditions and the annual and seasonal trends of temperature, precipitation, potential evapotranspiration and aridity/humidity index from 1971 to 2000 in China. Observed climatic data from 616 meteorological stations over China's land surface were used. Potential evapotranspiration was calculated by the Penman-Monteith model with a modified net radiation part to accommodate China's unique climatic conditions. According to the aridity/humidity index, a ratio of potential evapotranspiration to precipitation, four moisture regional types were delineated gradually from the southeast to the northwest, i.e. humid, subhumid, semiarid and arid throughout China. Linear regression was performed on the 30-year time series of the four climate factors in order to detect possible trends. The results confirm the obvious spatial and temporal difference of climate trends. Surface air temperature has increasing trends almost all over China especially in winter. Most stations are statistically significant. Annual precipitation shows increasing trends at more than half of the stations, and the increasing trends mainly occur in summer and winter while the decreasing trends occur in spring and autumn. However, most stations are not statistically significant. Potential evapotranspiration has decreasing trends in most stations and nearly half of the stations are statistically significant. Annual aridity/humidity index shows primarily decreasing trends with a distribution nearly the same as the increasing trends of precipitation. The index has the decreasing trends in spring and summer and the increasing trends in autumn and winter. The results suggest that it is necessary to consider precipitation and potential evapotranspiration simultaneously to describe the moisture conditions exactly. Copyright 2005 Royal Meteorological Society

DOI

[62]
Wu S H, Yin Y H, Zheng D et al., 2016. Advances in terrestrial system research in China.Journal of Geographical Sciences, 26(7): 791-802.陆地表面具有空间时间的异质。陆上的系统(TS ) 包括地在陆地表面上学习,物理区域化客观地描述系统的地理带状配列。中国在资源和环境条件与明显的空间变化有一个广阔区域,它高度在社会经济的开发影响。在这篇论文,在中国的 TS 研究的进步是 overviewed,研究优先级在不久的将来被勘探。自从 1950 年代,中国作为它的社会经济的发展对 TS 学习给予了大注意,并且在物理地理区域化, eco 地理的区域化和全面区域化上进行了研究。与加深全球变化研究一起, TS 的动力学高度被担心了。在研究期间,方法论逐渐地从专家智力的集成的质的研究被开发了到基于领域,天赋的观察和实验处理的量的研究,包括信息技术和数学模拟的物理、化学、生物的进程,以及应用程序。在不久的将来, TS 将与思想方式,目的和未来地球节目的关键研究结合,到机制和在陆地表面元素之中的相互作用的地区性的效果的焦点,到全球变化的 TS 的反应,地区性的联合起来上的量的识别边界,并且应用程序到在持续社会经济的开发的 TS 。

DOI

[63]
Yang J P, Ding Y J, Chen R S et al., 2002. The interdecadal fluctuation of dry and wet climate boundaries in China in recent 50 years.Acta Geographica Sinica, 57(6): 655-661. (in Chinese)1 Introduction Global warming has been the certainty. Under the scenario of climatic warming global hydrological cycle, the amount of water resources and water resources distribution change accordingly. Some regions become wet, while others become dry

DOI

[64]
Yin Y H, Ma D Y, Wu S H et al., 2015. Projections of aridity and its regional variability over China in the mid-21st century.International Journal of Climatology, 35(14): 4387-4398.ABSTRACT The effects of aridity on ecosystems and water cycles are pronounced and have received considerable attention. However, aridity changes due to future warming and its regional variability over China remain uncertain. This paper aims to identify the spatiotemporal variations in aridity and its key influencing factors over China in the mid-21st century based on five general circulation models (GCMs) and four representative concentration pathway (RCP) scenarios. An aridity index ( AI ), defined as the ratio of reference evapotranspiration ( ET o) to precipitation ( P ), was calculated. We show that the GCM ensemble means are able to reproduce the variation of aridity during the baseline period. Generally, ET o anomalies are consistently positive. Other than for the RCP2.6 low-emission scenario, precipitation and aridity are both projected to increase. There are pronounced regional differences in aridity changes; i.e. wetter across most of western China and drier across most of eastern China in the mid-21st century. Negative AI anomalies in western China can be attributed mainly to the projected increase in precipitation. In eastern China, the AI was higher despite positive precipitation anomalies, due mainly to the greater effect of climate change on increasing atmospheric moisture demand. This suggests that evapotranspiration demand should be incorporated into aridity changes under future warming.

DOI

[65]
Yin Y H, Wu S H, Zhao D S, 2013. Past and future spatiotemporal changes in evapotranspiration and effective moisture on the Tibetan Plateau.Journal of Geophysical Research: Atmospheres, 118(19): 10850-10860.1] Observed evaporative demand has decreased worldwide during the past several decades. This trend is also noted on the Tibetan Plateau, a region that is particularly sensitive to climate change. However, patterns and trends of evapotranspiration and their relationship to drought stress on the Tibetan Plateau are complex and poorly understood. Here, we analyze spatiotemporal changes in evapotranspiration and effective moisture (defined as the ratio of actual evapotranspiration (ETa) to reference crop evapotranspiration (ETo)) based on the modified Lund-Potsdam-Jena Dynamic Global Vegetation Model (LPJ). Climate data from 80 meteorological stations on the Tibetan Plateau were compiled for the period 19810900092010 and future climate projections were generated by a regional climate model through the 21st century. The results show regional trends towards decreasing ETo and statistically significant increases in ETa (p090009<0900090.05) and effective moisture during the period 19810900092010 (p090009<0900090.001). A transition from significant negative to positive ETo occurred in 1997. Additionally, a pronounced increase in effective moisture occurred during the period 19810900091997 because of significant decreased ETo before 1997. In the future, regional ETo and ETa are projected to increase, thus reducing drought stress, because of generally increased effective moisture. Future regional differences are most pronounced in terms of effective moisture, which shows notable increases in the northwestern plateau and decreases in the southeastern plateau. Moreover, the reduced magnitude of effective moisture is likely to intensify in the long term, due mainly to increased evaporative demand.

DOI

[66]
Yin Y H, Wu S H, Zheng D et al., 2008. Radiation calibration of FAO56 Penman-Monteith model to estimate reference crop evapotranspiration in China.Agricultural Water Management, 95(1): 77-84.The standardized FAO56 Penman–Monteith model, which has been the most reasonable method in both humid and arid climatic conditions, provides reference crop evapotranspiration (ET o) estimates for planning and efficient use of agricultural water resources. Net radiation is an important and site-specific component to determine ET o. The empirical radiation estimation in FAO56 Penman–Monteith model was calibrated by observed solar radiation of 81 meteorological stations over China during 1971–2000, and measurements of net longwave radiation in the Tibetan Plateau. Results showed that 03ngstr02m formula based on simple annual linear regression coefficients of 0.20 and 0.79 yielded the least error for the preserved 30 validation stations, and are thus recommended for estimating solar radiation in China. The optimal calibration of net longwave radiation was based on Penman estimation combined with the minimum and maximum temperatures. The calibrated net radiation served as the basis to estimate ET o accurately, which would be overestimated by about 27% if no local calibration is performed on the FAO56 Penman–Monteith model in China. The average ET o was 769 mm yr 611 based on calibrated radiation model in China during 1971–2000.

DOI

[67]
Zeng N, Yoon J H, 2009. Expansion of the world's deserts due to vegetation-albedo feedback under global warming.Geophysical Research Letters, 36(17): L17401.Abstract Top of page Abstract 1.Introduction 2.Methodology 3.Results 4.Discussion and Conclusions Acknowledgments References Supporting Information [1] Many subtropical regions are expected to become drier due to climate change. This will lead to reduced vegetation which may in turn amplify the initial drying. Using a coupled atmosphere-ocean-land model with a dynamic vegetation component that predicts surface albedo change, here we simulate the climate change from 1901 to 2099 with CO 2 and other forcings. In a standard IPCC-style simulation, the model simulated an increase in the world's ‘warm desert’ area of 2.5 million km 2 or 10% at the end of the 21st century. In a more realistic simulation where the vegetation-albedo feedback was allowed to interact, the ‘warm desert’ area expands by 8.5 million km 2 or 34%. This occurs mostly as an expansion of the world's major subtropical deserts such as the Sahara, the Kalahari, the Gobi, and the Great Sandy Desert. It is suggested that vegetation-albedo feedback should be fully included in IPCC future climate projections.

DOI

[68]
Zhang X L, Yan X D, 2016. Deficiencies in the simulation of the geographic distribution of climate types by global climate models.Climate Dynamics, 46(9/10): 2749-2757.The performances of General Circulation Models (GCMs) when checked with conventional methods (i.e. correlation, bias, root-mean-square error) can only be evaluated for each variable individually. The geographic distribution of climate type in GCM simulations, which reflects the spatial attributes of models and is related closely to the terrestrial biosphere, has not yet been evaluated. Thus, whether the geographic distribution of climate types was well simulated by GCMs was evaluated in this study for nine GCMs. The results showed that large areas of climate zones classified by the GCMs were allocated incorrectly when compared to the basic climate zones established by observed data. The percentages of wrong areas covered approximately 30-50 % of the total land area for most models. In addition, the temporal shift in the distribution of climate zones according to the GCMs was found to be inaccurate. Not only were the locations of shifts poorly simulated, but also the areas of shift in climate zones. Overall, the geographic distribution of climate types was not simulated well by the GCMs, nor was the temporal shift in the distribution of climate zones. Thus, a new method on how to evaluate the simulated distribution of climate types for GCMs was provided in this study.

DOI

[69]
Zhao T B, Chen L, Ma Z G, 2014. Simulation of historical and projected climate change in arid and semiarid areas by CMIP5 models.Science Bulletin, 59(4): 412-429.Based on Climatic Research Unit Time Series 3.1 temperature and Global Precipitation Climatology Center full data reanalysis version 6 precipitation data, the abilities of climate models from the fifth phase of the Coupled Model Intercomparison Project to simulate climate changes over arid and semiarid areas were assessed. Simulations of future climate changes under different representative concentration pathways (RCPs) were also examined. The key findings were that most of the models are able to capture the dominant features of the spatiotemporal changes in temperature, especially the geographic distribution, during the past 60 years, both globally as well as over arid and semiarid areas. In addition, the models can reproduce the observed warming trends, but with magnitudes generally less than the observations of around 0.1-0.3 /50a. Compared to temperature, the models perform worse in simulating the annual evolution of observed precipitation, underestimating both the variability and tendency, and there is a huge spread among the models in terms of their simulated precipitation results. The multimodel ensemble mean is overall superior to any individual model in reproducing the observed climate changes. In terms of future climate change, an ongoing warming projected by the multi-model ensemble over arid and semiarid areas can clearly be seen under different RCPs, especially under the high emissions scenario (RCP8.5), which is twice that of the moderate scenario (RCP4.5). Unlike the increasing temperature, precipitation changes vary across areas and are more significant under high-emission RCPs, with more precipitation over wet areas but less precipitation over dry areas. In particular, northern China is projected to be one of the typical areas experiencing significantly increased temperature and precipitation in the future.

DOI

[70]
Zheng J Y, Bian J J, Ge Q S et al., 2013. The climate regionalization in China for 1981-2010.Chinese Science Bulletin, 58(30): 3088-3099. (in Chinese)In groundwater-dependent ecosystems, groundwater circulation controls the overall water quality and ecosystem dynamics. Groundwater and vegetation across a 30-km groundwater transect linking oasis, desert and river in an extremely arid area were investigated with a series of soil profiles drilled into the unsaturated zone to understand groundwater circulation and its control on groundwater quality and surface vegetation in the extremely arid Lower Tarim River, NW China. Measurements have included water-table depth, water chemistry and water isotopes (H-2, O-18, H-3) for 15 water samples, soil moisture and chloride content for 11 soil profiles, and vegetation investigation. Results show that the groundwater in desert zone is characterized by slow recharge rate (pre-modern water), great water-table depth (6.17-9.43 m) and high salinity (15.32-26.50 g/L), while that in oasis (uncultivated land) and riparian zone is characterized by relatively fast recharge rate (modern water), small groundwater-table depth (3.56-8.36 m) and low salinity (1.25-1.95 g/L). Stable isotopes show that secondary evaporation takes place during irrigation in oasis. The vegetation characteristics (coverage, richness, evenness and number of plants) are closely related to soil moisture and water-table depth. Groundwater recharge from irrigation in oasis and from river in riparian zone sustains a better ecosystem than that in the desert area, where lateral and vertical groundwater recharge is limited. The more evapotranspirative enrichment may occur in the vegetated and water-rich riparian zone as compared to desert. This study also demonstrates the effectiveness of environmental tracers in studying ecohydrological processes in arid regions.

DOI

[71]
Zhu G R, Li Y, 2015. Types and changes of Chinese climate zones from 1961 to 2013 based on Köppen climate classification.Arid Land Geography, 38(6): 1121-1132. (in Chinese)K?ppen climate classification,which is based on temperature and precipitation,has been used worldwide. Beside temperature and precipitation,the distribution of natural vegetation is also considered as a major reference for the system. With clear quantitative limits,the classification system can be easily used to distinguish different climate types. A variety of climatic classification methods have been tried in China to explore Chinese climate classification and climate change in recent years,but most of them are not in line with international classification methods. In this paper,the K?ppen climate classification was used to classify the climate zones of China,and 7 climate subtyps,including a,b,c,d,h,k,G,were considered. China DEM(http://www.ngdc.noaa.gov),China monthly surface air temperature and surface precipitation 0.5 0.5 gridded dataset(http://cdc.cma.gov.cn)were used to classify the climate zones. According to the results,there are 4 major climate zones,including arid climate(B),warm temperate climates(C)and snow climates(D)and polar climates(E). Major climatic types include steppe climate(Bs),desert climate(Bw),warm temperate climate with dry winter(Cw),warm temperate climate,fully humid(Cf),snow temperate climate with dry winter(Dw),tundra climate(ET). The results of K?ppen climate classification were compared with climate zones from other climate classification.Decadal climate change processes of China have been discussed according to variability of climate zone. From1961 to 2010,the global warming in China was very obvious,northern China and the eastern part of northwest China have been drier during the period while the western part of northwest China has become wetter,the arid climate zone expended in the Qinghai-Tibet Plateau due to increasing temperature,the changing trend of precipitation is not obvious in southern China. But from 2011 to 2013,most of China was becoming cold and wet.

Outlines

/