Research Articles

Threshold sediment flux for the formation of river deltas in Hainan Island, southern China

  • LI Gaocong , 1 ,
  • ZHOU Liang 2 ,
  • QI Yali 1, 3 ,
  • GAO Shu , 2, *
Expand
  • 1. Collaborative Innovation Center of South China Sea Studies, Nanjing University, Nanjing 210023, China
  • 2. State Key Laboratory for Estuarine and Coastal Research, East China Normal University, Shanghai 200062, China
  • 3. College of Electronics and Information Engineering, Guangdong Ocean University, Zhanjiang 524088, Guangdong, China
*Corresponding author: GaoShu (1956-), Professor, E-mail:

Author: Li Gaocong (1987-), PhD Candidate, specialized in estuarine and coastal sciences. E-mail:

Received date: 2017-08-14

  Accepted date: 2017-12-15

  Online published: 2019-01-25

Supported by

National Natural Science Foundation of China, No.41530962,No.41706096

This study also supports in part by the China Scholarship Council, No.201606190151

Copyright

Journal of Geographical Sciences, All Rights Reserved

Abstract

The knowledge of geomorphological evolution from an estuary to a river delta is necessary to form the formulation of comprehensive land-ocean interaction management strategies. In this study, the dominant factor controlling the geomorphological variability and the threshold sediment flux (TSF) to form a river delta in Hainan Island, southern China, including accommodation space, sediment supply, and reworking forces, was investigated by the method of big data analytics. The results indicated the 25 estuaries in consideration can be divided into three geographical groups, i.e. the multi-factors-controlled northern mixed estuaries, wave-dominated western estuaries with river deltas, and typhoon-dominated eastern coastal lagoon estuaries. For alluvial plain (AP) estuaries, the order of magnitude of TSFs is the smallest (101 kt·yr-1), for barrier-lagoon (BL) ones is the highest (> 102 kt·yr-1), and for drowned valley (DV) ones is moderate (102kt·yr-1). The river deltas associated with DV systems should be relatively large, and those related to BLs should be small, with the AP deltas being between the above mentioned types. The present study provides a technique to evaluate the role played by TSF for the formation of river deltas in micro-tidal and wave-dominated and typhoon-influenced coastal environments.

Cite this article

LI Gaocong , ZHOU Liang , QI Yali , GAO Shu . Threshold sediment flux for the formation of river deltas in Hainan Island, southern China[J]. Journal of Geographical Sciences, 2019 , 29(1) : 146 -160 . DOI: 10.1007/s11442-019-1589-y

1 Introduction

River deltas are important interfaces between continents and oceans, playing a role of both “driver” and “recorders” for natural and anthropogenic environment changes (Bianchi and Allison, 2009; Gao and Collins, 2014; Schmidt, 2015). Fluvial sediment supply is the principal source for such systems with respect to the source-to-sink mechanisms (Bates, 1953; Wright, 1977). The occurrence of a river delta will not happen as the amount of sediment available is below a critical value or threshold (Sloss, 1963; Vail et al., 1977; Gao and Collins, 2014). Long-term global climate has changed catchment-estuarine systems and, nowadays, worldwide river deltas are not only under dramatic threat from sediment starvation, but also suffer from river flooding, natural and man-made subsidence, sea-level rise, storm surges and coastal erosion (Blum and Roberts, 2009; Foufoula-Georgiou, 2013; Zhonget al., 2014; Han et al., 2015). Thus, any knowledge of the threshold sediment flux for the transition from an estuary to a river delta becomes important to formulate comprehensive land-ocean interaction management strategies (Stanley and Warne, 1994; Syvitski and Milliman, 2007; Giosanet al., 2014). However, although the concept of threshold sediment flux for the formation of a river delta was proposed several decades ago, little attention has been paid to the quantifying of this variable.
Regarding the above-mentioned situations, the estuaries and river deltas along the coastlines of Hainan Island, southern China, represent typical examples. In terms of the magnitude of sediment supply, the total flux has been estimated to be around 4 Mt·yr-1 (CEH, 1999), which is a very small value as compared to that of Taiwan Island (Chen et al., 1992) and islands in East Indies (Millimanet al., 1999; Milliman and Farnsworth, 2013). Significant geomorphological variability of estuaries, however, can be identified along the coastal Hainan (Gaoet al., 2016; Li et al., 2016). Apparently, such a variability is related to factors of the sea-level changes, morphological/bathymetric characteristics, terrestrial sediment supply, and hydrodynamic forcing. Although previous studies have dealt with some of the factors, e.g., geological background (Wang et al., 1983; Wang, 2006), history of sea level changes (Zhang and Liu, 1987;Ma et al., 2003), waves and tidal range (Wang et al., 1983; Wang et al., 2001), typhoon influence incidences (Tuet al., 2016; Zhou et al., 2017), the vulnerability of coasts (Wang et al., 2017) and sedimentary records interpretation (Gaoet al., 2016), there is a lack of systematic investigation into the factor of sediment flux of different rivers.
In the present study, a dataset of 25 estuaries was established by the method of big data analytics, including factors of estuarine original topography, history of sea level changes, catchment basin elevation maximum (hmax) and area (A), hypsometry integral (HI), sediment flux (Qs), average wave height, average tidal range, intensive typhoon events, and estuarine geomorphology. On such a basis, the dominant factor influencing estuarine geomorphological variability and the threshold sediment flux (TSF) for the formation of river deltas in coastal Hainan during the Holocene were analyzed.

2 Study area

Located in southern China and northwestern part of the South China Sea (Figure 1a), Hainan Island is the second largest island in China, with a surface area of 35.4 ×10³ km2. Its landscape is characterized by mountains in the central part, and hills and highly indented promontory-embayment coastlines in the coastal areas. The highest mountain is the Mt. Wuzhishan, reaching an elevation of 1867 m above sea level. The mountains and hills are mostly composed of Palaeozoic metamorphic and sedimentary rocks, intruded by Paleozoic and Mesozoic granites, and the outcrop rocks of northern Hainan is mostly composed of Cenozoic to Holocene volcanic, basaltic rocks (Wang and Zhou, 1990; Wang et al., 2001).
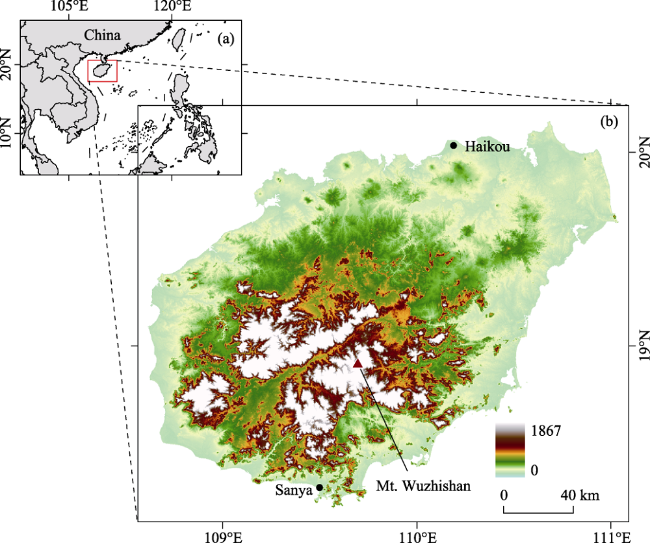
Figure 1 Location (a) and digital elevation model (b) of the study area
The climate is dominated by tropical monsoons, with northeast winds in winter and southwest winds in summer (Zhang et al., 2013). The annual average temperature is within the range of 22.8-25.8℃ (SBHP, 1994-2011). The tide in this area is diurnal and in a microtidal environment, with a range of 0.69-1.89 m; NE wave prevails during winter, SE and SW waves prevail during summer (Wang et al., 1983; Wang et al., 2001). Typhoons are frequent in the summer rainy season and they derive both from the west Pacific Ocean and from the South China Sea (CDCCBC, 1999; STI, 2006).

3 Methods

3.1 Data sources

In the present study, the first step is to carry out catchment basin analysis on the ArcGis 9.3, using a 90 m resolution Digital Elevation Model (DEM) of Hainan Island downloaded from the Geospatial Data Cloud (http://www.gscloud.cn) (Figure 1b). Subsequently, the variables of catchment basin area (A), elevation maximum (Hmax), mean (Hmean), and minimum (Hmin) could be obtained (Li et al., 2016). In terms of spatial resolution, the highest relative error of every pixel point is 45 m. For the calculation of estuarine sediment flux, two parameters, e.g. elevation maximum and area were used. Since their units are in km and km2, which are two orders of magnitude higher than the data resolution, it is assumed in this study that the impact of error related to the spatial resolution on sediment flux results should be small. Combined with estuarine remote sensing imagines on the Google Earth Pro, 25 rivers were chosen as the study estuaries subjectively. These rivers are located more or less uniformly around the Hainan coastlines with easily recognizable estuarine geomorphology, with their total catchment basin area accounts for 80.78% of Hainan Island (Figure 2a).
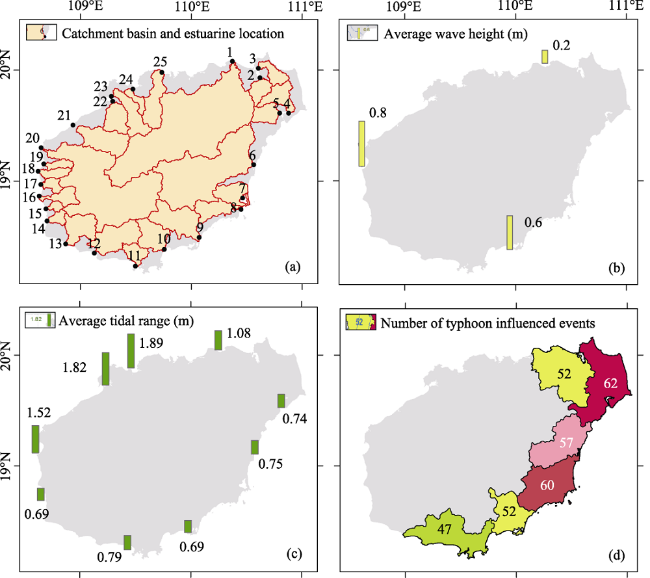
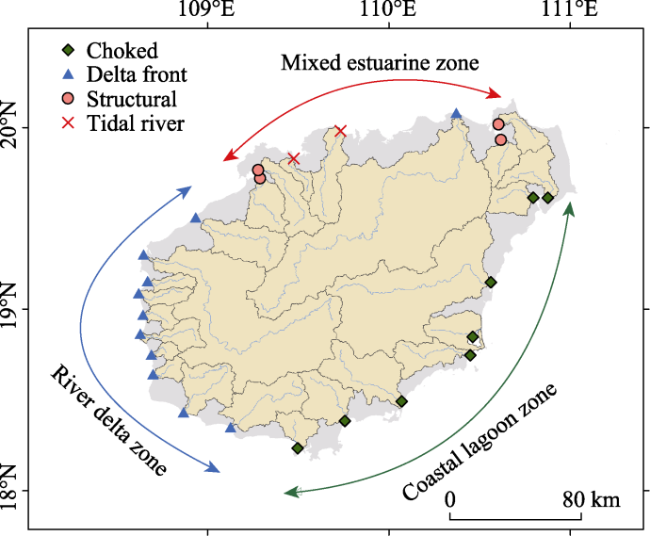
Figure 2 Estuaries in consideration (a), average wave height (b),average tidal range (c), and the number of intensive typhoons (d) from 1949 to 2014
Data of other factors were collected based on the big data analytical method by making full use of previous research results (Cukier and Viktor, 2013; Hampton et al., 2013). The original topography of estuaries is consulted from the studies of Wang et al. (1983) and Yuan et al. (2006). The history of sea level changes of Hainan Island since the mid-Holocene were collected from the studies of Luo (1986), Zhang and Liu (1987), Li (1996), Wang (1999), and Ma et al. (2003). The observed average wave height (Figure 2b) and average tidal range (Figure 2c) pertain to the studies of Wang et al. (1983) and Wang et al. (2001). The number of times influenced intensively by typhoon from 1949 to 2014 is based on Tuet al. (2016) (Figure 2d).

3.2 Analytical methods

3.2.1 Accommodation space identification
The accommodation space for estuarine sedimentation is mainly determined by factors of the estuarine original topography and sea level changes (Sloss, 1963; Vail et al., 1977; Gao and Collins, 2014). For the estuaries of Hainan Island, their original topography includes alluvial valley (AV), pluvial-alluvial terrace (PAT), and structural valley (SV). With the sea level changes during the mid-Holocene, the accommodation space of these estuaries transform to three categories, e.g. alluvial plain (AP), barrier-lagoon (BL), and drowned valley (DV).
3.2.2 Sediment flux estimation
The BQART formula (Syvitski and Milliman, 2007) is generally used to compute fluvial sediment flux (Qs), and specific cases can be found in studies of Kettneret al. (2010) and Nienhuiset al. (2015). This formula estimates the Qs based on geomorphic and tectonic influences (basin area and relief), geography (temperature, runoff), geology (lithology, ice cover), and human activities (reservoir trapping, soil erosion):
$Q=0.075{{A}^{0.8}}$ (1)
${{Q}_{s}}=\omega B{{Q}^{0.31}}{{A}^{0.5}}RT$ (2)
where Q is fluvial discharge (m3·s-1), A is drainage area (km2), ω = 0.0006 is a constant of proportionality. B = IL(1-TE)Ehaccounts for geological and land use factors; I is glacier erosion factor (1 in this case); L is an average basin-wide lithology factor; TE and Eh account respectively for the trapping efficiency of lakes and man-made reservoirs and human-influenced soil erosion factor which was assumed to cancel out (Syvitski and Milliman, 2007; Nienhuis et al., 2015). Because the study area mainly composed of granite in basaltic lithology (Wang et al., 1991), this study assigned L = 1 for the study basins. R is the maximum relief (km) and T = 23.5 is the basin average temperature. At last, those predicted values were corrected by the gauging station records from the studies of Yang et al. (2013).
3.2.3 Hypsometry integral analysis
In terms of the geomorphological evolution stage, sediment flux discharges from catchment basin are relatively smaller, larger, and smaller in relation to the ‘young’, ‘mature’, and ‘old’ stages, respectively (Li et al., 2016). The Hypsometry Integral (HI) is generally used to infer the stage of geomorphic development of a drainage basin (Strahler, 1952). Convex hypsometric curves characterize relatively ‘young’ and weakly eroded regions (HI> 0.6), S-shaped curves characterize moderately eroded regions (0.35 <HI< 0.6), and concave curves characterize relatively ‘old’ and highly eroded regions (HI< 0.35). The value of HI can be estimated by
HI = (Hmean - Hmin) / (Hmax - Hmin) (3)
where Hmean and (Hmax - Hmin) are the mean elevation and the elevation drop of the basin, respectively (Pike and Wilson, 1971).
3.2.4 Bed reworking forces analysis
In this study, three factors, including the average wave height, average tidal range, and the number of intensive typhoon events, were regarded as the main reworking forces for the sediment deposition in estuarine regions. The data of observed average wave height and average tidal range, collected from the studies of Wang et al. (1983) and Wang et al. (2001), was used to interpolate values for each estuary in consideration, according to the principle of Kriging and estuarine coordinates.
3.2.5 Estuarine geomorphological classification
To determine the categories of the estuaries, the criterion of morphogenetic classification of estuaries given by Perillo (1995) was used. It consists of primary and secondary categories. The former includes former river valleys, former glacial valleys, river-dominated, and structural subcategories, and the latter refers to coastal lagoon estuary which includes choked, restricted, and leaky subcategories. In this study, the estuarine geomorphological classifications were determined by visual interpretation method with respect to their accommodation space and satellite imagines characteristics.
3.2.6 Threshold sediment flux analysis
In this study, the term “threshold sediment flux (TSF)” refers to the threshold of fluvial sediment flux for the formation of a river delta during the Holocene. Only when the sediment flux of a river is greater than the TSF, can a river delta be formed in its estuarine region (Gao and Collins, 2014). Its value generally depends on the accommodation space and bed reworking forces of the estuarine area. Figure 3 illustrates the procedures to determine the order of magnitude of TSF, for which factors of the estuarine geomorphological classification, accommodation space, and sediment supply are all taken into account. First the type of accommodation space of the given estuary is determined, then to determine whether or not the estuary is a delta front estuary, after that, to define whether or not the Qs of the catchment basin is larger than the TSF.
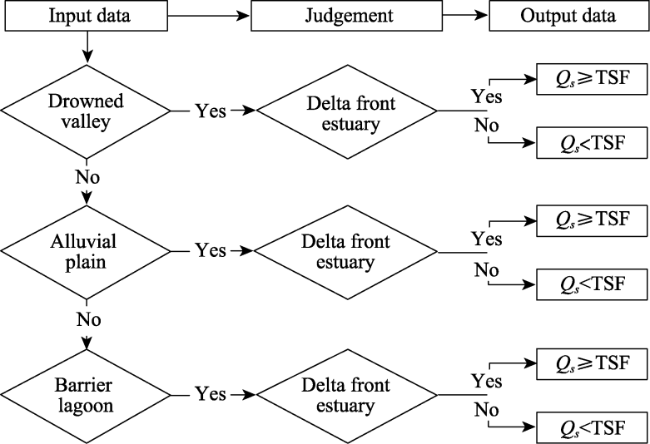
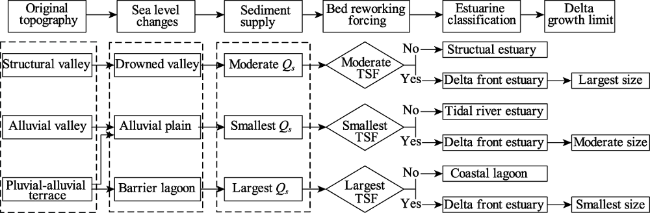
Figure 3 Flow chart for the determination of the order of magnitude of TSF

4 Results

4.1 Accommodation space

In terms of estuarine original topography, either SVs or AVs characterize the base of the topography of the north and west coastal Hainan, and the PATs dominated in the west coast (Wang, 1983; Yuan et al., 2006) (Table 1). Since the Last Glacial Period, sea level rose to ~4 m above the present position in ca. 6800 to 5800 a BP (Ma et al., 2003); since then, two cycles of rise-drop of sea level occurred, with a magnitude of 4-6 m (Zhang and Liu, 1987). The sea level gradually stabilized as the present position in the last 2000 years, and at present, the level is rising slightly caused by global warming (Wang, 1999). With the sea level changes, sediments from the adjacent continental shelf were transported shoreward, and gradually combined the Late Pleistocene pluvial-alluvial terraces and erosion platforms or the hills (Li, 1986). As a result, many barrier-lagoon systems were formed in the eastern Hainan coastlines, with barriers in width of 1-2 km, in length of 10-30 km and in height of 20-30 m (Luo, 1986). Meanwhile, the accommodation space of those SVs or AVs estuaries have transformed to drowned valley (DV) and alluvial plain (AP) estuaries.
Table 1 Summary of factors controlling the Holocene estuarine geomorphological variability in Hainan Island (SV = Structural valley; PAT = Pluvial-alluvial terrace; AV = Alluvial valley; DV = Drowned valley; AP = Alluvial plain; BL = Barrier-Lagoon; SE = Structural estuary; TRE = Tidal river estuary; DFE = Delta front estuary; CE = Choked estuary)

4.2 Estuarine sediment flux

Similar to the characteristic of basins’ areas, the Nandu, Changhua, and Wanquan rivers have the largest Qs, with annual sediment discharge of 9.20, 5.99 and 7.07 Mt, respectively. These predicted values, however, are one order of magnitude higher than that of gauging station records (e.g. Yang et al., 2013). This study used α = 0.1 as the correction coefficient for Qs. Consequently, the annual sediment flux of the above three rivers is 920, 599 and 707 kt, respectively.
The modified Qs of these three rivers is greater than other rivers considerably, of which only 5 rivers have the order of magnitude of 100-200 kt·yr-1 for Qs, and the other 17 rivers are in order of magnitude of ~10-100 kt·yr-1 (Table 1). The total Qs of the basins in consideration is ~3.50 Mt·yr-1. When the rest basins are being consideration, the total Qs for Hainan Island is supposed to around 4 Mt·yr-1, a value in accordance with the value of previously studied by the Committee of Encyclopedia of Hainan (1999). Thus, the correction coefficient (α = 0.1) was considered to be valid which can be used in subsequent analysis.
All basins in consideration have hypsometric curves in shape of concave (Figure 4). On average, the HI values is 0.18, ranging from 0.07 to 0.28 (Table 1). Both concave curves and low HI values indicate the old geomorphological evolution stage of the study basins (Strahler, 1952; Li et al., 2016). In addition, the HI value is relatively larger in the western and southern basins than eastern and northern basins.
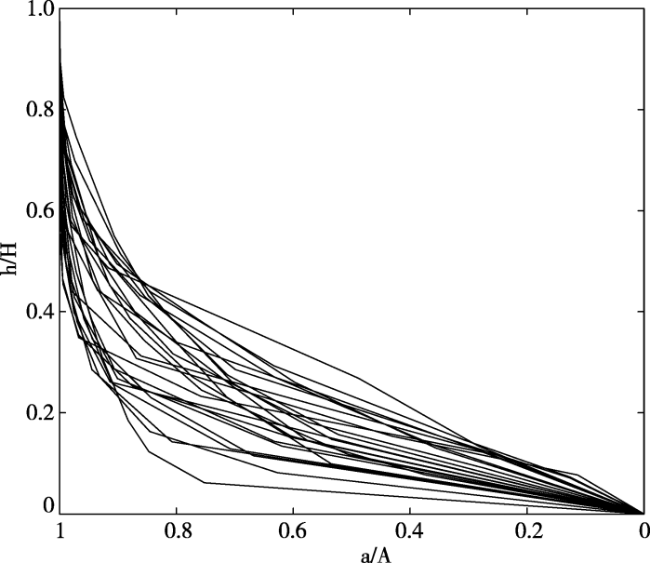
Figure 4 Concave normalized hypsometric curves of the study basins

4.3 Characteristics of reworking forces

Figures 2b, 2c, 2d and Table 1 show that, the three reworking forces have a strong regional signature. The average wave height tends to decrease from 0.8 m in western coast to approximately 0.2 m in the north-eastern coast (Wang et al., 1983; Wang et al., 2001). The average tidal range decreases from more than 1.89 m in northeastern Hainan to approximately 0.69 m in southeastern Hainan (Wang et al., 1983). In addition, typhoon process influenced estuaries on eastern coast significantly, and they occur with an average frequency of 8 events yr-1 over the last five decades (CDCCBC, 1999; STI, 2006; Tu et al., 2016). Thus, in terms of the dominant bed reworking force, wave dominates the western coast, typhoon dominates the eastern coast, and tide dominates the northern coast.

4.4 Estuarine geomorphological identification

Two categories and four subcategories of estuarine types can be identified from the 25 estuaries in Hainan coasts (Table 1). The first category is primary estuary and mostly located in the northern, western and southern coasts, including tidal river, delta front, and structural subcategories. The Yangqiao and Wenlan estuaries belong to tidal river subcategory, with increasing width of the river channel in the seaward direction. Except for the Nandu estuary in the northern part of Hainan Island, the subcategory of the delta front estuary is most common in the southwestern coast. The structural estuary is common on the northern coast, including Chun, Beimen, Nanyang, and Zhuxi rivers. The last subcategory is choked estuary and most common in the eastern and southeastern coasts (Figure 5).
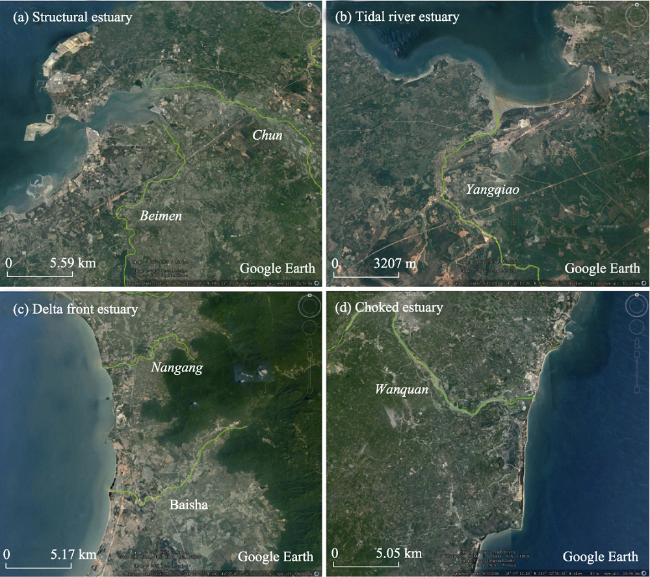
Figure 5 Estuarine remote sensing imagines: (a) structural estuary; (b) tidal river estuary; (c) delta front estuary; (d) choked estuary

4.5 Threshold sediment flux

In terms of the accommodation space, Hainan estuaries can be divided into DV, BL, and AP categories. For the estuaries of DV category, when the sediment supply is ranged from 5 to 62 kt·yr-1, the estuarine geomorphology belongs to the structural estuary. As the supply increases to 707 and 920 kt·yr-1, the geomorphology, however, belongs to delta front estuary. For the BL category, all estuaries belong to the choked subcategory, with a large range from 9 to 599 kt·yr-1. For the AP category, the geomorphology belongs to delta front estuary when the supply is ranged from 9 to 160 kt·yr-1, except for the two tidal river estuaries in the northern coast. The latter is characterized by a relatively small average wave height (0.3 m) and a relatively large average tidal range (1.63-1.89 m) compared with the former. Thus, in terms of TSF to form a river delta in coastal Hainan, the order of magnitude for AP estuaries is 101 kt·yr-1, for DV ones is 102 kt·yr-1, and for BL ones should be larger than 102 kt·yr-1.

5 Discussion

5.1 Dominant factor controlling the estuarine geomorphological variability

In terms of morphogenetic classification, this study indicated significant variation among the estuaries in the Hainan coasts. The primary estuaries include tidal river, delta front and structural subcategories located in the northern and western coasts; secondary estuaries (choked estuary) in the eastern coast (Figure 6). Enhanced knowledge of dominant factor controlling the evolution of estuaries in coastal Hainan during the Holocene is important for understanding the variability of estuarine geomorphology.
Figure 6 Geomorphological classification of the studied estuaries
The accommodation space, terrestrial sediment supply, and hydrodynamic forcing are generally considered as the three main factors influencing the geomorphological evolution of estuaries (Dyer, 1995; Gao and Collins, 2014). Apparently, the characteristic of estuarine accommodation space controlled the first-order variation of estuaries, while the factors of sediment supply and hydrodynamic forces controlled their secondary-order variation. Although the sediment fluxes of northern and eastern rivers are larger than that of western rivers, no river delta has developed in these areas (except for the Nandu River whichcharacterized by a relative large sediment flux), while many wave-dominated river deltas have formed in the western coast. The average wave height is larger on the western coast than that on the northern and eastern coasts, and the tide range is larger on the northern coast than the southern coast (Wang et al., 1983). In addition, typhoon processes affect sediment erosion and accretion of eastern coast considerably, because of their strong winds, high waves, strong currents, and heavy rains (Tu et al., 2016; Huang, 2017).
Therefore, the dominant factor controlling the estuarine geomorphological variability on coastal Hainan have a strong regional signature. Waves dominate the western delta frontal estuarine hydrodynamic environment, and tide, sediment supply, and original topography dominate the northern mixed estuarine environment, and typhoon dominate the eastern coastal lagoon estuarine environment. As such, the estuaries in consideration can be divided into three geographical groups, i.e. the multifactor-controlled northern mixed estuaries, wave-dominated western estuaries with deltas, and typhoon-dominated eastern coastal lagoon estuaries (Figure 6). In the future, additional research work should focus on the observations and numerical modeling of alongshore transport either induced by waves and typhoon events to better understand the sediment budget around estuaries on coastal Hainan.

5.2 Threshold sediment flux for the formation of river deltas

The present estuarine geomorphology is the comprehensive product of accommodation space, fluvial sediment supply and estuarine hydrodynamic forces since the high sea level period during the Holocene (Inman and Nordstrom, 1971; Stanley and Warne, 1994). The geomorphological variability of estuaries in coastal Hainan arises an interesting question related to the geomorphological evolution from an estuary to a river delta, i.e., whether or not there is a threshold flux of fluvial sediment for forming a river delta.. Whether or not the fluvial sediment will settle down in an estuary and eventually contribute to the delta formation depends upon many factors, such as river flow patterns in an estuary (Bates, 1953), gravitational circulation (Dyer, 1995), tidal pumping (Dyer, 1995; Yu et al., 2014), flocculation processes (Eisma, 1986), wave processes (Aston and Giosan, 2011; Nienhuis et al., 2015), typhoon (Huang, 2017), and water depth (Gao, 2007). Although in situ observations could be used to obtained precise sediment budgets of the estuaries, they cost a great deal of time and money; further, those processes occurred in past cannotbe obtain by observation. Thus, it is meaningful to propose a practical method by using various existing data to determine the TSF for the studies of estuarine geomorphological evolution.
The present study provides a typical example to evaluate the role played by TSF for the formation of river deltas in coastal Hainan by using many existing data, including factors of accommodation space, sediment supply, and bed reworking forcing. The results show that the TSF is in close contact with the type of accommodation space. In order to form a river delta in coastal Hainan, the order of magnitude of TSF for AP estuaries (101 kt·yr-1) is the smallest, for BL ones is the largest (> 102 kt·yr-1), and for DV ones is in between (102 kt·yr-1). For the structural estuaries in northern coast and choked estuaries in the eastern coast, more fluvial sediments, first of all, are needed to fill the large accommodation of incised valleys and lagoons than that of those alluvial plain estuaries. Although the filling process of many southern lagoons has been completed, these lagoons, however, also failed to form delta frontal deposition. A reasonable explanation for this is that alongshore sediment transport and reworking induced by typhoon processes is so strong to inhibit enough fluvial sediments to settle down. In addition, the eastern coastlines show a spiral plan shape, representing an equilibrium state of geomorphological evolution (Davis and Hayes, 1984). Moreover, the catchment basins in consideration are all at an ‘old’ geomorphological evolution stage, of which the sediment discharge flux should be relatively smaller than ‘mature’ stage in their life-cycle (Li et al., 2016). Therefore, although the Qsvalues of the eastern rivers are larger than that of western rivers, river delta will be only poorly developed over a long period of time.
When the sediment supply is below the TSF, no delta will, or a river delta will suffer from wave-induced or flooding-induced erosion. For example, the TSF of the Changjiang River has been estimated to be around 300 Mt·yr-1 (Yang et al., 2003), the present Qs, however, is smaller than this value, so are under dramatic threat of coastal erosion and subaqueous delta retreat (Yang et al., 2011). In comparison, if the amount is larger than the TSF, the morphology of a delta is concerned with sediment size (Orton and Reading, 1993; Caldwell and Edmonds, 2014), cohesion (Edmonds and Slingerland, 2009) and the relative importance of delta-shaping processes (Wright and Coleman, 1972; Gao and Collins, 2014).
Due to the different order of magnitude of TSF, it can be inferred that significant differences of the geomorphological size will occur between those deltas developed from different kinds of accommodation space. In generally, the size of the accommodation space for DV estuaries in coastal Hainan are relative larger, and for AP estuaries are relative smaller, and for BL ones are in between. Combined with the bed reworking forcing, river deltas formed from the DVs will have the largest size (i.e. the Nandu River delta), and relative smaller size for the BLs, and in between for the APs (Figure 7). Similar landscapes have occurred in Asia estuaries, the area of the delta plains is of the order of 103-104 km2for large river deltas, such as the Ganges-Brahmaputra River delta and Changjiang River delta, which are in association with large drowned valley during mid-Holocene, whereas those alluvial plain ones are only in order of 101-102 km2 (Li et al., 2018). Future works should focus on the process-product relationships between drainage basins and estuaries/deltas. Owing to the effects of changing the climate and frequent human activities, the water and sediment discharges entering the sea greatly changed, thereby exerting a significant impact on the development and evolvement of the estuarine/delta sedimentary systems.
Figure 7 Flow chart for the Holocene estuarine geomorphological evolution in coastal Hainan

6 Concluding remarks

In the present study, the dominant factors controlling the geomorphological variability of estuaries in coastal Hainan Island and the threshold sediment flux (TSF) to form a river delta were investigated based on the big data method. Results indicated the 25 estuaries under consideration can be divided into three geomorphological zones, e.g. the northern mixed estuaries zone, the western river deltas zone, and the eastern coastal lagoons zone. The dominant factor for the former zone is original topography, or tide process, or sediment supply, while that of the secondary zone is wave process, and that of the last zone is typhoon process. In coastal Hainan, the order of magnitude for alluvial plain estuaries to form a river delta is the smallest (101 kt·yr-1), for barrier lagoon ones is the largest (> 102 kt·yr-1), and for drowned valley ones is in between (102 kt·yr-1). The growth limit of those river deltas formed under the drowned valley estuaries will have the largest size, and the smallest size for the barrier lagoon estuaries, and in between for alluvial plain estuaries, further investigations are required to test this hypothesis.

The authors have declared that no competing interests exist.

[1]
Bates C C, 1953. Rational theory of delta formation.Aapg Bulletin, 37(9): 2119-2162.If a delta is defined as a sedimentary deposit built by jet flow into or within a permanent body of water, these modifications allow for the existence of three basic types of deltaic deposits, depending on the density contrast between entraining and entrained fluids. Examples of these different types of inflow are cited from the Mississippi Delta region. In the case of hyperpycnal inflow (inflow more dense), it is suggested that turbidity currents carrying coarse-grained material during glacial stages eroded the Mississippi Submarine Canyon and supplied the material for the submarine delta off the canyon's mouth. Homopycnal inflow (inflow equally dense), which gives rise to the deltaic deposit characterized by classical top-, fore-, and bottom-set beds, is described for the Lake Ponch rtrain, Louisiana, area when the Bonnet Carre Floodway is in operation and for crevasses in the Lower Mississippi River. Hypopycnal inflow (inflow less dense) is discussed in some detail, including such aspects as flocculation effects, lunate bar development at river mouths, development of distributaries and flank depressions, the seaward movement of river water upon leaving the river's mouths, and effects of the earth's rotation. Modifying effects of wind, waves, and tides on deltaic deposits are discussed briefly.

DOI

[2]
Bianchi T S, Allison M A, 2009. Large-river delta-front estuaries as natural “Recorders” of global environmental change.Proceedings of the National Academy of Sciences, 106(20): 8085-8092.Large-river delta-front estuaries (LDE) are important interfaces between continents and the oceans for material fluxes that have a global impact on marine biogeochemistry. In this article, we propose that more emphasis should be placed on LDE in future global climate change research. We will use some of the most anthropogenically altered LDE systems in the world, the Mississippi/Atchafalaya River and the Chinese rivers that enter the Yellow Sea (e. g., Huanghe and Changjiang) as case-studies, to posit that these systems are both "drivers" and "recorders" of natural and anthropogenic environmental change. Specifically, the processes in the LDE can influence ("drive") the flux of particulate and dissolved materials from the continents to the global ocean that can have profound impact on issues such as coastal eutrophication and the development of hypoxic zones. LDE also record in their rapidly accumulating subaerial and subaqueous deltaic sediment deposits environmental changes such as continental-scale trends in climate and land-use in watersheds, frequency and magnitude of cyclonic storms, and sea-level change. The processes that control the transport and transformation of carbon in the active LDE and in the deltaic sediment deposit are also essential to our understanding of carbon sequestration and exchange with the world ocean n important objective in global change research. U. S. efforts in global change science including the vital role of deltaic systems are emphasized in the North American Carbon Plan (www.carboncyclescience.gov).

DOI PMID

[3]
Blum M D, Roberts H H, 2009. Drowning of the Mississippi Delta due to insufficient sediment supply and global sea-level rise.Nature Geoscience, 2(7): 488-491.Over the past few centuries, 25% of the deltaic wetlands associated with the Mississippi Delta have been lost to the ocean. Plans to protect and restore the coast call for diversions of the Mississippi River, and its associated sediment, to sustain and build new land. However, the sediment load of the Mississippi River has been reduced by 50% through dam construction in the Mississippi Basin, which could affect the effectiveness of diversion plans. Here we calculate the amount of sediment stored on the delta plain for the past 12,000 years, and find that mean storage rates necessary to construct the flood plain and delta over this period exceed modern Mississippi River sediment loads. We estimate that, in the absence of sediment input, an additional 10,000-13,500kmwill be submerged by the year 2100 owing to subsidence and sea-level rise. Sustaining existing delta surface area would require 18-24billiontons of sediment, which is significantly more than can be drawn from the Mississippi River in its current state. We conclude that significant drowning is inevitable, even if sediment loads are restored, because sea level is now rising at least three times faster than during delta-plain construction.

DOI

[4]
Caldwell R L, Edmonds D A, 2014. The effects of sediment properties on deltaic processes and morphologies: A numerical modeling study.Journal of Geophysical Research: Earth Surface,119(5): 961-982.AbstractThere is a pressing need to understand how different delta morphologies arise because morphology determines a delta's ecologic structure, resilience to relative sea-level rise, and stratigraphic architecture. We use numerical modeling (Delft3D) to explain how deltaic processes and morphology are controlled by the incoming sediment properties. We conducted 36 experiments of river-dominated delta formation varying the following sediment properties of the incoming grain-size distribution: the median, standard deviation, skewness, and percent cohesive sediment, which is a function of the first three properties. Changing standard deviation and skewness produces minimal morphological variation, whereas an increase in dominant grain size (D84) and decrease in percent cohesive sediment produce a transition from elongate deltas with few channels to semicircular deltas with many channels. This transition occurs because critical shear stresses for erosion and settling velocities of grains set the number of channel mouths and the dominant delta-building process. Together, the number of channel mouths and the dominant process&mdash;channel avulsion, mouth bar growth, or levee growth&mdash;set the delta morphology. Coarse-grained, noncohesive deltas have many channels dominated by avulsion, creating semicircular planforms with relatively smooth delta fronts. Intermediate-grained deltas have many channels dominated by mouth bar growth, creating semicircular planforms with rugose delta fronts. Fine-grained, cohesive deltas have a few channels, the majority of which are dominated by levee growth, creating elongate planforms with smooth delta fronts. The process-based model presented here provides a previously lacking mechanistic understanding of the effects of sediment properties on delta channel network and planform morphology.

DOI

[5]
Chen J S, Chen M, Xie G B, 1992. Comparative study on water chemistry between Hainan Island and Taiwan Island.Acta Geographica Sinica, 47(5): 403-409.The differences of the major ion chemistry of the rivers, and the physical and chemical denudation rates (PDR and CDR, respectively) of the river drainage areas between the Hainan Island and Taiwan Island were studied. The total dissolved solid content of the Hainan Island's rivers (60-80 mg/1), which is influenced by the weathering of granite and basalt, is much less than that of the Taiwan Island's rivers(250 mg/ and more or less) dominiated by the weathering of sedimentary rocks. The river drainage areas in the Taiwan Island is also characterized by a much higher FDR and a higher CDR, due to their extremely abundant precipitation and water-flow, especially, in the Central Ranges which has been rising rapidly since the Pliocence.

[6]
Committee of Data Compilation of Coastal Bays in China (CDCCBC), 1999. Compilation of Coastal Bays in China Vol.11: Coastal Bays of Hainan Province. Beijing: China Ocean Press, 1-426. (in Chinese)

[7]
Committee of Encyclopedia of Hainan (CEH), 1999. Encyclopedia of Hainan Island. Beijing: China Press for Encyclopedia, 1-893. (in Chinese)

[8]
Cukier K, Viktor M S, 2013. The rise of big data: How it’s changing the way we think about the world.Foreign Affairs, 92(1): 28-40.

[9]
Davis J R A, Hayes M O, 1984. What is a wave-dominated coast?Marine Geology, 60(1): 313-329.During the past decade or so, various coasts have been designated as wave-dominated or tide-dominated. Typically there is an association made between coastal morphology and the dominant process that operates on the coast in question. Most authors consider long, smooth, barrier coasts with few inlets and poorly developed ebb deltas as “wave-dominated”. These coasts are associated with microtidal ranges. Conversely, mesotidal coasts tend to develop short, drumstick-shaped barriers with well-developed ebb deltas. They are considered as tide-dominated barriers. Such generalizations may be restricted to coasts with moderate wave energy although this is commonly not stated. Exceptions to these stated generalizations are so numerous that wave energy and tidal prism must also be included in characterizing coasts. The relative effects of waves and tides are of extreme importance. It is possible to have wave-dominated coasts with virtually any tidal range and it is likewise possible to have tide-dominated coasts even with very small ranges. The overprint of tidal prism will also produce tide-dominated morphology on coasts with microtidal ranges.

DOI

[10]
Dyer K R, 1995. Sediment Transport Processes in Estuaries.Developments in Sedimentology, 53: 423-449.

DOI

[11]
Edmonds D A, Slingerland R L, 2010. Significant effect of sediment cohesion on delta morphology.Nature Geoscience,3(2): 105.The morphologies of the world's deltas are thought to be determined by river discharge, tidal range and wave action . More recently, sea-level rise and human engineering have been shown to shape delta evolution. The effects of factors such as sediment type and the overall amount of sediment carried by rivers are considered secondary. In particular, the role of sediment cohesion, which is controlled by sediment size and type of vegetation, is unclear. Here we use a numerical flow and transport model to show that sediment cohesiveness also strongly influences the morphology of deltas. We find that, holding all other factors constant, highly cohesive sediments form bird's-foot deltas with rugose shorelines and highly complex floodplains, whereas less cohesive sediments result in fan-like deltas with smooth shorelines and flat floodplains. In our simulations, sediment cohesiveness also controls the number of channels that form within the deltas, and the average angle of bifurcation of those channels. As vegetation generally acts as a cohesive agent, we suggest that deltas that formed before the expansion of land plants in the Devonian period should show fan-like characteristics, a finding consistent with the limited data from the sedimentological record.

DOI

[12]
Eisma D, 1986. Flocculation and de-flocculation of suspended matter in estuaries.Netherlands Journal of Sea Research, 20(2/3): 183-199.Flocculation and de-flocculation have been observed in estuaries and the processes involved are discussed. Salt flocculation plays a minor role, if any. Flocs are mainly formed by a combination of two groups of processes: those bringing particles together, and those keeping them together. The first group is related to the flow conditions in the water and to organisms that clog particles into faeces or pseudofaeces or attach them to mucus. The second is related to the formation of sticky organic matter by a variety of organisms. Two main types of flocs have been observed: microflocs with a diameter up to 125 m, and macroflocs with a maximum size of 3 4 mm. Microflocs consist of mineral particles and organic matter. Their formation is strongly related to the origin of the organic matter, to the organisms producing it, and to conditions of (temporary) deposition and resuspension. Mucopolysaccharides, produced by bacteria, algae and higher plants and mobilized from the suspended matter at low salinity, are important in glueing particles together. The microflocs, together with single mineral particles, are the basic building units of macroflocs. Macroflocs are fragile and formed in the water under conditions of viscous flow. Their maximum size is determined by turbulent shear, the size of the smallest turbulent whirls on the Kolmogorov scale being of the same order as the maximum floc size. They are easily destroyed during sampling. In estuaries the microflocs of fluvial origin are broken up by organisms consuming the organic matter in the microflocs, and reflocculated into new microflocs with newly formed organic matter of estuarine origin. The size of the microflocs, as seen under a microscope or determined by size analysis, is likely to be determined mainly by the binding strength of the organic matter in relation to the total mass of the floc and the physical disturbance produced during sampling and size analysis.

DOI

[13]
Foufoula-Georgiou E, Syvitski J, Paola C et al., 2013. International year of deltas 2013: A proposal. Eos,Transactions American Geophysical Union, 92(40): 340-341.Marine and lacustrine deltas around the world are economic and environmental hot spots. They occupy approximately 1% of the Earth's land area but are home to more than 500 million people090000a population density more than 10 times the world average [Ericson et al., 2006]090000all within 5 meters of sea level [Overeem and Syvitski, 2009]. This high density is supported by high productivity, rich biodiversity, and transport along a network of waterways. Yet deltaic systems are some of the world's most delicate and vulnerable natural systems, residing at the boundary between land and water, and are subject to upstream human control, local resource exploration, and climatic impacts.

DOI

[14]
Gao S, 2007. Modeling the growth limit of the Changjiang Delta.Geomorphology, 85(3/4): 225-236.River deltas grow in response to sediment discharge from the land. It is not clear, however, whether or not there is a limit for such growth. Conceptual geometric models are used in this paper, in association with the principle of mass conservation, in an attempt to answer this question. Preliminary analyses of the Changjiang Delta indicate that delta growth is constrained by a number of factors: the original topography/bathymetry, sediment supply, sediment retention in the estuary, sea-level rise, ground subsidence. The quantity of sediment supply per unit area and the Sediment Retention Index for the subaqueous delta decrease as the delta progrades towards deeper water, resulting in a decreasing rate of growth. The limit of growth is reached when the index approaches zero, i.e. the shoreline reaches the shelf edge. If the combined effect of sea-level rise and ground subsidence is considered together with decrease in the sediment discharge from land, the limit is reached at an earlier stage. For the Changjiang Delta, the model output (using hypothesized Sediment Retention Index estimates) implies that the delta growth will reach its limit in the near future. This will occur sooner if the sediment output of the river is reduced to 60% of its original level, in response to the upstream basin changes. Further knowledge, however, is required of the Retention Index, together with the information on future changes in river input and the character of the sediments in order to improve the accuracy of the simulations.

DOI

[15]
Gao S, Collins M B, 2014. Holocene sedimentary systems on continental shelves.Marine Geology, 352(3): 268-294.61Holocene continental shelf deposits are related to sediment dynamic processes.61The sedimentary records associated with shelf deposits are high-resolution slices.61Modeling approaches to the formation of sedimentary records can be developed.

DOI

[16]
Gao S, Zhou L, Li G C et al., 2016. Processes and sedimentary records for Holocene coastal Environmental changes, Hainan Island: An overview.Quaternary Sciences, 36(1): 1-17. (in Chinese)

[17]
Giosan L, Syvitski J, Constantinescu S et al., 2014. Climate change: Protect the world’s deltas.Nature, 516(7529): 31-33.Sea-level rise and river engineering spell disaster, say Liviu Giosan and colleagues.

DOI PMID

[18]
Hampton S E, Strasser C A, Tewksbury J J et al., 2013. Big data and the future of ecology.Frontiers in Ecology and the Environment, 11(3): 156-162.

DOI

[19]
Han G, Chu X, Xing Q et al., 2015. Effects of episodic flooding on the net ecosystem CO2 exchange of a supratidal wetland in the yellow river delta.Journal of Geophysical Research: Biogeosciences, 120(8): 1506-1520.Abstract Episodic flooding due to intense rainfall events is characteristic in many wetlands, which may modify wetland-atmosphere exchange of CO2. However, the degree to which episodic flooding affects net ecosystem CO2 exchange (NEE) is poorly documented in supratidal wetlands of coastal zone, where rainfall-driven episodic flooding often occurs. To address this issue, the ecosystem CO2 fluxes were continuously measured using the eddy covariance technique for 465years (2010–2013) in a supratidal wetland in the Yellow River Delta. Our results showed that over the growing season, the daily average uptake in the supratidal wetland was 611.4, 611.3, 611.0, and 611.365g65C65m61265d611 for 2010, 2011, 2012, and 2013, respectively. On the annual scale, the supratidal wetland functioned as a strong sink for atmospheric CO2, with the annual NEE of 61223, 61164, and 6124765g65C65m61265yr611 for 2011, 2012, and 2013, respectively. The mean diurnal pattern of NEE exhibited a smaller range of variation before episodic flooding than after it. Episodic flooding reduced the average daytime net CO2 uptake and the maximum rates of photosynthesis. In addition, flooding clearly suppressed the nighttime CO2 release from the wetland but increased its temperature sensitivity. Therefore, effects of episodic flooding on the direction and magnitude of NEE should be considered when predicting the ecosystem responses to future climate change in supratidal wetlands.

DOI

[20]
He D Z, Zhang S L, 1985. The regional climate division of Hainan Island.Acta Geographica Sinica, 40(2): 169-178. (in Chinese)Hainan Island is a part of tropical China, The differentiation of temperature within Hainan Island is not significant, but that of rainfall distribution is quite remarkable. According to the principle of climatic division the main indices of climatic division in tropic should be given way from the heat (temperature) to the moisture (rainfall, rainy, season ︹). On the other hand, although the climate of Hainan Island is belong to tropical, but it is modified deeply by the monsoon, as the northen part of this island there appears a the Island, play an important role of climate division. Hence, moisture, temperature and topography of Hainan are chosen as the three main indices for the division work simultaneously. The climatic division of Hainan should be divided into eastern side and the western side by the parameter of water balance; also divided into nortern part and southern part by the thermal parameter (temperature), they made a cross shape over the Island; again, divide the mountain and the lower flat land(corespondant of wind condition) which made a circle shape. By mean of that, the regional division of Hainan may be after a model (fig. 1) divided into 8 division parts as follow: 1. NE part seashore plain climate, more cool, windy and more wet, such as in Wenchang. The shore lin forest belt should be built for agriculture. 2. NW part seashore plain climate, more cool, windy but more dry, such as Lingao. 3. NE part hill district and basin climate, more cold and wet in winter, such as Tunchang. 4. NW part mountain arid hill district and basin climate, occasionally fierce cold winter. It is harmful to rubber tree cultivation, such as in Baisha. 5. SE part seahore plain climate, more windy, more warm, and wet, such as Qionghai. Shore line forest belt should be built up for agricuture. 6. SW part seashore plain climate, more warm, fierce dry, such as Dongfang. 7. SE part of mountain and hill district, valley and basin climate; more wet and warm, such as Baoting. It is favour for rubber and other tropical crops, as, an old district of tropical agriculture. 8. SW part of mountain and hill district basin climate, more warm and dry, such as Ledong. There are many small areas with more favorable local climate for rubber here and there. It is a new region for the cultivation of rubber and other tropical crops or forest.

[21]
Huang W P, 2017. Modelling the effects of typhoons on morphological changes in the Estuary of Beinan, Taiwan.Continental Shelf Research, 135: 1-13.61This study used measured and simulated results to analyze the effect of typhoon.61The effects of the waves, tides, wave induced currents, and suspended load of the river to the changes of the bathymetry were all taken into consideration.61Typhoons can cause either accretion or erosion at the river mouth, depending on the balance between river discharges and wave action.

DOI

[22]
Inman D L, Nordstrom C E, 1971. On the tectonic and morphologic classification of coasts.The Journal of Geology, 79(1): 1-21.

DOI

[23]
Kettner A J, Restrepo J D, Syvitski J P M, 2010. A spatial simulation experiment to replicate fluvial sediment fluxes within the Magdalena River Basin, Colombia.Journal of Geology, 118(4): 363-379.Spatial variation of natural conditions (geomorphology, geography, and geology) and human perturbations (deforestation and reservoir retention) in river basins determine the variability of within-basin riverine sediment fluxes. Originally developed to determine a 30-yr normal of sediment load at a river mouth or for a “whole basin,” the scaling model BQART is validated to predict the sediment discharge from “within-basin” tributaries. Subbasins of the monsoonal-influenced Magdalena River are used here as case studies. By taking into account spatially variable geological, climatological, and human influences of the Magdalena tributaries, and by incorporating observational data to adjust for floodplain trapping due to a tectonic depression, the BQART model overestimates the cumulative sediment flux of 21 tributaries by 25% compared with observations (). For a given subbasin, BQART estimates are well within a factor of 3. The relatively short durations of the observations of each of the tributaries (6–25 yr), in combination with rapidly changing subbasin environments (like deforestation and mining intensification), likely affect the goodnesses of fit of the comparisons.

DOI

[24]
Li C C, 1986. Geomorphic characteristics of the harbour-coasts in South China.Acta Geographica Sinica, 41(4): 311-320. (in Chinese)This paper analysed the main factors of the coastal formation in South China, i.e. the geological structures, the geographical conditions of the mainland coast, the raise of the sea-level during Holocene, the tide, the wave, the longshore drift and so on. The coast in South China is characterized by the pattern of barrier-lagoon (or bay), because the tide range is small and the sediment transported by wave is rather strong. The mud-sand of most part of the barriers was derived from inner shelf, and moved landward with sea-level rise in Holocene. The author described in full details of the morphology about the two patterns of harbour-coasts (i.e. submerged valley and barrier-lagoon). The characteristics of the harbour of barrier-lagoon are as follows: 1.A harbour with the barrier-lagoon is commonly independent from the adjacent coastal systems; 2.Either the pluvial-alluvial terraces and the erosion platforms or the hills always lie at the back of the barrier-lagoon (or bay) systems; 3.During the Holocene, the barriers had evolved continuously by retreat, progradation and return. That correspondingly caused the changes of the other morphology, such as the area of lagoon, the mud flat, the tidal inlet and its sand bodies; 4. The foreshorelines of most barriers have tended to the logarithmic spiral plan shape; 5. The morphodynamics of beach may be divided into three sections; 6. The throat-position of the tidal inlet is always situated in the apex of Z-shaped headland-bay and is generally stable.

[25]
Li G C, Gao S, Dai C, 2016. Geomorphological evolution of major catchment basins of Hainan Island, southern China.Quaternary Sciences, 36(1): 121-130. (in Chinese)

[26]
Li G C, Gao S, Gao J H, 2018. Modeling the growth limit of seven major Holocene river deltas in Asia.Marine Geology & Quaternary Geology, 38(1): 11-22. (in Chinese)River deltas grow in response to sediment discharge from the land,and there is a limit of growth.A conceptual geometric model is used in this paper,based on the principle of mass conservation,to investigate the impact of the significant decrease in sediment supply to the growth of deltas taking seven large Asian river deltas as examples.Furthermore,the sediment retention index for the Holocene period,the critical river input for maintenance of a delta and the growth limit without human interferences are discussed.Preliminary analyses of these deltas indicate that the area of delta plain is roughly in an order of 103~104 km~2,and the volumes of 101~103 km~3,and both are significantly positively correlated with the fluvial flux before the large numbers of dams being constructed.The range of the Holocene retention index varies between36%~54%,with an average of 45%,indicating that more than half of the sediment escaped offshore and supported the deposition of shelf mud or deep sea fan.For the Yangtze,the Pearl,the Red,the Mekong and the Indus rivers,their sediment discharges are now below the level required to maintain the area of the sub-aerial deltaic plain and the volume of the entire deltaic deposits,except for the Irrawaddy and the Ganges-Brahmaputra rivers,of which the river discharges are higher than the critical level required to maintain their total volumes,but lower than the critical level required to maintain deltaic plain areas.Without coastal protection projects,the area and volume for the former five deltas would drop sharply,but increase for the latter two.The present study has established the interrelationships between the growth magnitude,Holocene sediment retention index,the critical fluvial sediment flux and the growth limit of the seven Asian major river deltas,demonstrating that the method based on the conceptual geometric model has a great potential to predict the long-term evolution of river deltas.

DOI

[27]
Luo Z L, 1986. Recent coastal landforms in Hainan Island.Tropical Geography, 7(1): 65-75. (in Chinese)

[28]
Ma Z B, Xiao, J L, Zhao X T et al., 2003. Precise u-series dating of coral reefs from the South China Sea and the high sea level during the Holocene.Journal of Coastal Research, 19(2): 296-303.Coral reefs formed along the southern coast of Hainan Island are one of the most developed Holocene fringing reefs in China. We present new precise230Th ages of coral reefs collected from the Shuiweiling section in the southern coast of the Hainan Island, Dengloujiao in the southwest of the Leizhou Peninsula, and the Chenhang Island and Jinyin Island of the Xisha (Paracel) Islands in the South China Sea. Using the high-precision U-series dates and stratigraphie evidence, the timing and character of the sea-level variations of the middle-Holocene in study region are examined. The results show that a flourishing period of coral reef flats in the South China Sea and along its northern coasts appeared in ca. 6800 to 5800 a BP, which is 650 to 950 years earlier than the previous14C dates (6150-4850 a). The sea level relative to the southern coasts of South China Sea was 3 to 4 m or more higher than that of the present during this period.

DOI

[29]
Milliman J D, Farnsworth K L, 2013. River Discharge to the Coastal Ocean: A Global Synthesis. London: Cambridge University Press.

[30]
Milliman J D, Farnsworth K L, Albertin C S, 1999. Flux and fate of fluvial sediments leaving large islands in the East Indies.Journal of Sea Research, 41(1/2): 97-107.Because of their generally small drainage basin areas, high topographic relief, relatively young and erodible rocks, and heavy rainfall, rivers draining the high-standing islands of the East Indies transport a disproportionately large amount of sediment to the ocean. Rivers on the islands of Sumatera (Sumatra), Jawa (Java), Borneo, Sulawesi (Celebes), Timor and New Guinea are calculated to discharge about 4.2 10 t of sediment annually. Although these six islands only account for about 2% of the land area draining into the global ocean, they may be responsible for as much as 20 to 25% of the sediment export. Fluvial sediment leaving these islands is discharged into several distinctly different provinces: shallow epicontinental seas such as the Sunda Shelf, Gulf of Papua and Sea of Arafura; and narrow-shelf, active margins along the western and southern sides of Sumatra and Java, and the north coast of New Guinea. High-resolution seismic profiles in the Gulf of Papua (New Guinea) show a clinoform sequence of Holocene sediments pinching out on the mid- to outer shelf, with sediment thickness locally greater than 40 m near the coast; some but perhaps not much sediment escapes to the outer shelf and the deeper Papua Trough beyond. In contrast, seismic profiles off northern New Guinea show river-derived sediment prograding over and by-passing a narrow shelf that locally has buried a relict barrier reef. A small fraction of the sediment escaping the northern shelf may be transported to the eastern equatorial Pacific by way of the Equatorial Counter Current, where it may help fertilize equatorial upwelling.

DOI

[31]
Nienhuis J H, Ashton A D, Giosan L, 2015. What makes a delta wave-dominated?Geology, 43(6): 511-514.River deltas, low-lying landforms that host high concentrations of human population and ecosystem services, face a new, and mostly unknown, future over the coming decades and centuries. Even as some deltas experience decreased sediment supply from damming, others will see increased sediment discharge from land-use changes. There are proposals to actively use riverine sediment supply to build new land and counteract delta loss. We present a novel approach to understanding the morphology of deltas by quantifying the balance between river inputs and the largely overlooked ability of waves to spread sediments along the coast. Defining a fluvial dominance ratio iver sediment input versus the potential maximum alongshore sediment transport away from the delta mouth llows a quantitative assessment of this sediment transport balance. For a series of deltas on Java, Indonesia, that exhibit a large range of sediment loads but have a homogeneous drainage lithology and wave climate, and for more eclectic global examples, shoreline deflection increases along with this fluvial dominance ratio. The fluvial dominance ratio also predicts the observed transition from cuspate, wave-dominated deltas to fluvially dominated deltas with protruding, crenulated shorelines. Not only does this approach provide a more quantitative foundation for paleoenvironmental reconstructions and delta management, perhaps more importantly, this simple metric of fluvial dominance has a predictive application in determining potential morphology of deltas created by engineered sediment diversions.

DOI

[32]
Orton G J, Reading H G, 1993. Variability of deltaic processes in terms of sediment supply, with particular emphasis on grain size.Sedimentology, 40(3): 475-512.Short term variability in delta form and process can be partly explained by the relative strength of hydraulic parameters such as river discharge, discharge variability, wave energy flux and tidal range. However, the calibre or grain size is also important. The amount, mode of transport and grain size of the sediment load delivered to a delta front have a considerable effect on the facies, formative physical processes, related depositional environments and morphology of the deltaic depositional system. The available grain size influences (1) the gradient and channel pattern of the fluvial system on the delta plain; (2) the mixing behaviour of sediment as it discharges into the ambient basin waters at the river mouth; (3) the type of shoreline, whether reflective or dissipative, and its response to both wave energy and tidal regime; and (4) the deformation and resedimentation processes on the subaqueous delta front. Long term aspects of deltaic sedimentation, including a few generalized relationships between sediment supply and physiographic setting, are briefly introduced. The need for further detailed research on modern and ancient deltaic dispersal systems is emphasized, and specific suggestions are given for future research.

DOI

[33]
Perillo G M, 1995. Definitions and geomorphologic classifications of estuaries.Developments in Sedimentology, 53: 17-47.

DOI

[34]
Pike R J, Wilson S E, 1971. Elevation-relief ratio, hypsometric integral, and geomorphic area-altitude analysis.Geological Society of America Bulletin, 82(4): 1079-1083.

DOI

[35]
Schmidt C, 2015. Alarm over a sinking delta.Science, 348(6237): 845-846.Vietnam9s Mekong River delta—the world9s third largest delta—is sinking, putting some 20 million people and vast swaths of fertile farmland at risk. Recent research has found that the delta, which covers some 55,000 square kilometers and sits about 2 meters above sea level, is subsiding at rates of 1 to 4.7 centimeters per year. Among the culprits: levees that prevent sediment from spilling out of rivers and collecting in the delta, and some 1 million wells drilled since the 1980s for drinking and agriculture. If groundwater depletion continues at present rates, researchers estimate, the delta could sink by nearly a meter by midcentury. Now, an alliance of Vietnamese and Dutch scientists is trying to get ahead of the problem. They met in Vietnam recently to launch the Rise and Fall project, a $1 million, 5-year effort to better understand what9s driving Mekong delta subsidence and develop strategies to reverse it. "We know virtually nothing about what9s beneath our feet," said geographer Philip Minderhoud, a co-leader of the project and doctoral candidate at Utrecht University in the Netherlands, during the 11 March gathering. New studies aim to change that.

DOI

[36]
Shanghai Typhoon Institute (STI), 2006. Climatological Atlas for Tropical Cyclones Affecting China (1951-2000). Beijing: Science Press, 177. (in Chinese)

[37]
Sloss L L, 1963. Sequences in the cratonic interior of North America.Geological Society of America Bulletin, 74: 93-113.

DOI

[38]
Stanley D J, Warne A G, 1994. Worldwide Initiation of Holocene marine deltas by deceleration of sea-level rise.Science, 265(5169): 228-231.

DOI

[39]
Statistical Bureau of Hainan Province, 1994-2011. Statistical Yearbook of Hainan Province. Statistical Publishing House, Beijing.(in Chinese) (Note: The ‘‘Statistical Yearbook of Hainan Province’’ has been published once a year since 1994 and, to avoid tedious and lengthy listing of references in this article, a combination for the period of 1994-2011 is adopted to have a single citation in the text as well as in the Figure legends) since 1994 and, to avoid tedious and lengthy listing of references in this article, a combination for the period of 1994-2011 is adopted to have a single citation in the text as well as in the Figure legends).

[40]
Strahler A N, 1952. Hypsometric area-altitude analysis of erosional topography.Geological Society of America Bulletin, 63(11): 1117.

DOI

[41]
Syvitski J P M, Milliman J D, 2007. Geology, geography, and human’s battle for dominance over the delivery of fluvial sediment to the coastal ocean.Journal of Geology, 115(1): 1-19.Sediment flux to the coastal zone is conditioned by geomorphic and tectonic influences (basin area and relief), geography (temperature, runoff), geology (lithology, ice cover), and human activities (reservoir trapping, soil erosion). A new model, termed “BQART” in recognition of those factors, accounts for these varied influences. When applied to a database of 488 rivers, the BQART model showed no ensemble over‐ or underprediction, had a bias of just 3% across six orders of magnitude in observational values, and accounted for 96% of the between‐river variation in the long‐term (±30 years) sediment load or yield of these rivers. The geographical range of the 488 rivers covers 63% of the global land surface and is highly representative of global geology, climate, and socioeconomic conditions. Based strictly on geological parameters (basin area, relief, lithology, ice erosion), 65% of the between‐river sediment load is explained. Climatic factors (precipitation and temperature) account for an additional 14% of the variability in global patterns in load. Anthropogenic factors account for an additional 16% of the between‐river loads, although with ever more dams being constructed or decommissioned and socioeconomic conditions and infrastructure in flux, this contribution is temporally variable. The glacial factor currently contributes only 1% of the signal represented by our globally distributed database, but it would be much more important during and just after major glaciations. The BQART model makes possible the quantification of the influencing factors (e.g., climate, basin area, ice cover) within individual basins, to better interpret the terrestrial signal in marine sedimentary records. The BQART model predicts the long‐term flux of sediment delivered by rivers; it does not predict the episodicity (e.g., typhoons, earthquakes) of this delivery.

DOI

[42]
Tu J Y, Gao S, Zhou L et al., 2016. Return periods and spatial-temporal distribution patterns of typhoons affecting in eastern Hainan Island.Quaternary Sciences, 36(1): 184-195. (in Chinese)

[43]
Vail P R, Mitchum R M, Todd R G et al., 1977. Seismic stratigraphy and global changes of sea level. In: Payton C E (ed.). Seismic Stratigraphy-Applications to Hydrocarbon Exploration. American Association of Petroleum Geologists Memoir, 26: 49-212.

[44]
Wang B C, Chen S L, Gong W P et al., 200. Formation and Evolution of Embayment Coast of Hainan Island. Beijing: China Ocean Press, 1-214. (in Chinese)

[45]
Wang W J, 1999. Sea level change and development course of barrier lagoons along coast of western Guangdong since middle Holocene.Tropical Oceanology, 18(3): 32-37. (in Chinese)Barrier lagoon coast is an important kind of coast. Taking the coast of western Guangdongfor example, the paper expounds the developmnt course of barrier lagoons under the influenceof sea level change in this area, and comes to the following conclusions. 7 000 yeare before present, the sea level had risen to + 4m. Sand from the continental shelf deposited towards land, forming projecting part at the back of the barriers across haymouths of lagoons. Thereafter, sea level fell grandually to the present level, the regressive sand wedges thus formed grew into low barriers and beaches towards sea. 2000 years before present, the sea level tended towards relative stability. Atpresent, the sea level is rising slightly, resulting in coast erosion. The paper also makes an analysis on the migration mechanism of coastal sand, coastal deposit at high sea level and present coastal erosion under the influence of sea level change.

[46]
Wang W J, Jin Z M, Bao Q S, 1983. Characteristic of natural conditions and the construction of ports in the coastal areas of Hainan Island.Tropical Geography, 3(3): 8-13. (in Chinese)

[47]
Wang X, Ma D, Jiang D, 1991. Geology of Hainan Island (II): Tectonic Geology. Beijing: Geological Press, 1-106. (in Chinese)

[48]
Wang Y, Peter M I, Zhu D et al., 2001. Coastal plain evolution in southern Hainan Island, China.Chinese Science Bulletin, 46(1): 90-96.The coast of southern Hainan Island is characterized by wide sandy embayments, which consist of ( i) drowned valleys bounded by steep bedrock hills and only locally receiving sediments, and embayments of various dimensions covered either by (ii) alluvial-deltaic deposits or by (iii) sands of coastal beach ridges/barriers and associated elongated lagoons. During the late Tertiary-Pleistocene the area has experienced isostatic and eustatic movements associated with neotectonics and climatic changes. Such history isrecorded in terraces at various altitudes (SO, 40, 20 m asl) and sequences of coastal sand ridges/baymouth bars. The Holocene variations in sea level and climate are recorded in the dated coastal ridges, coral reef and beachrock. Conditions suitable for reef development started about 8000 a BP. The GPR profiles also show that the internal structures of the sand ridges have composite nature being formed by several superimposed secondary ridges.

DOI

[49]
Wang Y, Zhou L F, 1990. The volcanic coast in the area of northwest Hainan Island.Acta Geographica Sinica, 50(3): 321-330. (in Chinese)There have been two periods of volcanism with 5 eruptions in the area of northwestern Hainan Island. The first one occurred in late Pleistocene, dating back to 5.2X10⁴ a B. P.. It formed a lava field which covered a sandy deposit. This was later baked and altered. Another eruption took place 2.5X10⁴ a B. P. The lava which emitted at that time consists of olivine basalt and tholeiite basalt; the flow ripples of elastics of them are still well-preserved Later eruptions occurred in the Holocene, which many small breached craters appearing on the coasts and islands around and in the Beibu Bay. The last of these eruptions raised the former shingle beaches 15 m high and the former tidal flat to form terrace 20 m above sea level. This volcanic belt runs along the seashore which trends in northeast direction. It might be the result of a crustal extension in the Beibu Bay and Yingge Sea, Since the earth crust here is only 30 km thick. At present barrier coral reefs are well-developed along this volcanic coast. Most probably, they have basalt thus emitted as their basement, since the geothermal gradient here is favorable for their growth.

DOI

[50]
Wang Y P, Shi B, Zhang L et al., 2017. Assessing the vulnerability of changing coasts, Hainan Island, China.Acta Oceanologica Sinica, 36(4): 114-120.Knowledge of coastline changes and vulnerability is of great importance to local government departments that are responsible for the management and development of coastal zones.To study the nature of change and vulnerability along the coasts of the Hainan Island,we collected a large number of sediment samples through the last few years,and reconstructed the changes of the coastline by combining the data of sediment grain-size analysis and the nautical charts/TM RS imaginary.Contrary to being almost free from erosion(as expected from the findings that the coastlines are in a relatively stable state),four major cities in Hainan(i.e.,Haikou,Wenchang,Sanya and Changjiang) turned out to be suffered from a moderate coastal vulnerability primarily because of the large populations that impose considerable pressure on the coastlines.Thus,the assessment methodology utilized in this study,including both anthropogenic and natural factors,serves as a useful tool to obtain a comprehensive understanding of coastline vulnerability for local government,in terms of coastal management and adaptation.

DOI

[51]
Wright L D, Coleman J M, 1972. River delta morphology: Wave climate and the role of the subaqueous profile.Science, 176(4032): 282-284.Application of a comprehensive wave climate program to seven major deltas indicates that deltaic configurations and coastal landform combinations depend to a considerable degree on the wave power adjacent to the shore and on the river discharge relative to wave forces. Nearshore wave power is not correlative with deepwater wave power but, owing to frictional attenuation, is a function of the subaqueous slope. The subaqueous slope, in turn, depends partially on the slope and width of the continental shelf but primarily on the rate at which the river can supply sediments to the nearshore zone. River-dominated configurations result only when the river is able to build flat offshore profiles, which reduce nearshore wave power; where the subaqueous slope is steep, waves reach the shore comparatively undiminished and wave-built forms prevail.

DOI PMID

[52]
Xia X M, 2015. Status of Marine Resources and Environment of Hainan Island. Beijing: China Ocean Press, 1-27. (in Chinese)

[53]
Xu G, Guo Q, Niu S et al., 2013. Research on climate change characteristics of different regions in Hainan Island in the last 50 years.Journal of Natural Resources, 28: 799-810.By connecting temperature and precipitation data of seven national standard meteorological stations which were evenly distributed in Hainan Island from 1959 to 2008 with the existing climatic regionalization of Hainan Island,we studied climate change of different climatic regions in Hainan Island in the last 50 years.And the result showed that the trend of temperature increase obviously existed in these regions in the last 50 years,with warming amplitudes being higher in Northeast,Southwest,Central Mountain,Southeast and Northwest regions,respectively.In interannual time scale,the warming amplitudes of annual average maximum temperature(Tmax),annual mean temperature(Tmean) and annual average minimum temperature(Tmin) were decreasing from Tmin to Tmax.In seasonal time scale,the annual mean temperature(Tmean) was increasing seasonally in different regions,with warming amplitudes being higher in winter,autumn,spring and summer,respectively.The seasonal warming amplitudes of geographic differences were similar to those in interannual time scale.What's more,the abrupt change of Tmean was changeable in different climatic regions,being 1972-1974 in Southwest,1979 in Northwest,1987 in Northeast,1985-1990 in Southeast,and 1990 in Central Mountain regions,respectively.And the annual average precipitations were changeable in different climatic regions which were higher in Central Mountain regions,then decreasing in the order of Southeast,Northwest,Northeast and Southwest.On the other hand,the annual precipitation anomaly and abrupt change of all climatic regions fluctuated sharply except Southwest region which got through the significance test(P0.05).Generally,percentages of dry/wet seasonal precipitation accounted for 20% and 80% respectively in annual precipitation in different climatic regions.Light rainfall mainly occurred in dry season while heavy rainfall mainly in wet season.And the contribution rate of precipitation in dry season is the highest in Central Mountain region while in wet season it was the contrary.The precipitation levels of heavy rain and rainstorm had great influence on annual precipitation,which accounted for about 50% of total precipitation.And Southwest region was the heavy rainstorm and extremely heavy rainstorm-prone area.

[54]
Yang S L, Milliman J D, Li P et al., 2011. 50,000 dams later: Erosion of the Yangtze River and its delta.Global and Planetary Change, 75(1): 14-20.Using 50 years of hydrologic and bathymetric data, we show that construction of ~ 50,000 dams throughout the Yangtze River watershed, particularly the 2003 closing of the Three Gorges Dam (TGD), has resulted in downstream channel erosion and coarsening of bottom sediment, and erosion of the Yangtze's subaqueous delta. The downstream channel from TGD reverted from an accretion rate of ~ 90 Mt (1Mt = 1000 000 t)/yr between the mid-1950 s and mid-1980 s to an erosion rate of ~ 60 Mt/yr after closing of the TGD. The delta front has devolved from ~ 125 Mm 3 (1 Mm 3 = 1000 000 m 3)/yr of sediment accumulation in the 1960 s and 1970 s, when river sediment load exceeded 450 Mt/yr, to perhaps 100 Mm 3/yr of erosion in recent years. As of 2007 erosion seemed to have been primarily centered at 5 8 m water depths; shallower areas remained relatively stable, perhaps in part due to sediment input from eroding deltaic islands. In the coming decades the Yangtze's sediment load will probably continue to decrease, and its middle-lower river channel and delta will continue to erode as new dams are built, and the South-to-North Water Diversion is begun.

DOI

[55]
Yang S L, Zhu J, Zhao Q, 2003. A preliminary study on the influence of Changjiang River sediment supply on subaqueous delta.Acta Oceanologica Sinica, 25(5): 83-91. (in Chinese)

[56]
Yang Z H, Jia J J, Wang X K et al., 2013. Characteristics and variations of water and sediment fluxes into the sea of the top three rivers of Hainan in recent 50 years.Marine Science Bulletin, 32(1): 92-99. (in Chinese)Based on the hydrological data at the estuaries of Nandu River,Changhua River and Wanquan River from 1957 to 1987 and from 2006 to 2008,this paper analyzed monthly,seasonal and annual variations in terms of runoff and sediment discharges of three rivers into the sea.The results showed that typhoon season(July-October) was revealed to be the period for the peaks of water and sediment fluxes,particularly during the period of September or October.Three rivers also featured more sediments with floods and less sediment with low flow.Nandu River was of the largest water discharge and Changhua River had the strongest sediment transport.Water and sediment fluxes were found to show a decrease overall in recent 50 years.Before 1980s,water and sediment fluxes fluctuated greatly around the average,but the deviation reduced since 1980s.The change of runoff discharges might mainly be related to the precipitation of the fluvial basins.Meanwhile,precipitation,basin slope,underlaying surface properties and human activities were considered to be the factors affecting sediment discharges.

[57]
Yu Q, Wang Y, Gao J et al.Gao J , 2014. Turbidity maximum formation in a well-mixed macrotidal estuary: The role of tidal pumping.Journal of Geophysical Research: Oceans, 119(11): 7705-7724.Traditionally, vertical circulation (induced by gravity circulation and tidal straining), tidal pumping, and resuspension are suggested as the major processes for the formation and maintenance of the estuarine turbidity maximum (ETM). Due to strong mixing, tidal pumping is considered as the dominating process in macrotidal estuaries. To analyze field observation data, the classical empirical decomposition method is commonly suggested, but the tidal pumping flux (TPF) based on this method may lead to erroneous conclusions about the mechanisms of ETM formation because the effects of advection induced by the horizontal SSC gradient and fine bed sediment supply are ignored. If these effects are included, the TPF clearly reproduces the convergence patterns and thus demonstrates its role in the formation of the ETM. By a simplified analytical solution, the TPF is the result of the competition between the downstream flux induced by the river current together with the lag in sediment response and the upstream flux induced by tidal asymmetry and the lag. Field observations in the well-mixed macrotidal Yalu River estuary (located between China and North Korea) were analyzed. Tidal pumping is identified as the dominant mechanism of its ETM formation, and the position of the ETM for different river discharges and sediment settling velocities can be predicted by the concept of tidal pumping by numerical and analytical procedures. The present study provides a typical example of how to evaluate the tidal pumping contributions on ETM formation using the combined information provided by field data, numerical modeling results, and analytical solutions. Key Points The role of tidal pumping is comprehensively revealed by removing two effects Responses of ETM to river discharge and sediment settling velocity are explained

DOI

[58]
Yuan J P, Yu L S, Deng Y Q et al., 2006. Geomorphologic division and classification of Hainan Island.Natural Science Journal of Hainan University, 24(4): 364-370. (in Chinese)Geomorphologic units of Hainan Island can be divided into four classes: geomorphic regions,sub-geomorphic regions,landform-genetic types,and micro relief.They are divided into two big geomorphic regions,called a north mesa plain and a south mountains region.They contain 14 sub-regions.There are mountains,hills,platforms,terraces,and plains.However,the dominant geomorphologic landforms are mesa and mountain that covers 32.6% of the whole area of Hainan Island.Taking into consideration of the kinds and directions of exogenic forces and history of geomorphic development,five geomorphologic genetic types,including erosional and denudation structural landform,denudational and erosional landform,riverine accumulation landform,marine-built landform,and volcano landform,are delimited

[59]
Zhang J, Wang D R, Jennerjahn T et al., 2013. Land-sea interactions at the east coast of Hainan Island, South China Sea: A synthesis.Continental Shelf Research, 57(1): 132-142.

DOI

[60]
Zhang Z Y, Liu R H, 1987. The Holocene along the coast of Hainan Island.Scientia Geographica Sinica, 7(2): 129-138.Sanya formation (Q), Qiongshan formation (Q) and Ledong formation (Q). Spore-pollen analysis shows that there are 6 spore-pollen zones existed, reflecting two cycles of climatic fluctuation from warm-dry to hot-humid. The climax of hot-humid period occurred 6,000-5,000 years B.P.. Based on the C dating data of the 38 samples representing the positions of ancient sea level, a breakthrough curve representing the sea level change during the Holocone is obtained, in which , a sea level change caused by tectonic movement is subtracted. Two cycles of rise-drop of sea level with three periods of high sea level were found. The period with the highest sea level is some 6,000-5,000 years B.P.. According to the rise-drop rate of sea level, four periods of the sea level change can be distinguished in the Holocene. The amplitude of the sea flunctuation is about 6m over the past 6,000 years.

DOI

[61]
Zhong H, van Gelder P, van Overloop P et al., 2014. Application of a fast stochastic storm surge model on estimating the high water level frequency in the lower Rhine delta.Natural Hazards, 73(2): 743-759.In the Lower Rhine Delta of the Netherlands, the high water level is driven by a joint impact of the downstream storm surge and the upstream fluvial discharge, and affected by the operation of existing man-made structures. In scenario-based risk assessment, a large number of stochastic scenarios of storm surges are required for estimating the high water level frequency. In this article, a fast computing stochastic storm surge model is applied to the gauge station of Hook of Holland in the west of the Netherlands. A fixed number of tides are considered in this model based on the information of historical storm surge events. Based on this model, a large number of stochastic storm surge scenarios are derived and forced into a one-dimensional hydrodynamic model of the Netherlands, resulting in peak water levels in Rotterdam, the most vulnerable city in the delta. These peak water levels are statistically analyzed and converted to the high water level frequency curve in Rotterdam. The high water level frequency curve in Rotterdam tends to a much lower design water level compared to the official design water level that is used to design the dikes and structures for protection of the city. Moreover, there is a significant difference in the high water level frequency curves due to the fact that the stochastic storm surge model considers different numbers of tides. This highlights the critical impact of the storm surge duration on the high water level frequency in the Lower Rhine Delta.

DOI

[62]
Zhou L, Gao S, Yang Y et al., 2017. Typhoon events recorded in coastal lagoon deposits, southeastern Hainan Island.Acta Oceanologica Sinica, 36(4): 37-45.Coastal lagoon deposits provide evidence for the magnitude and frequency of past tropical cyclones prior to instrumental records and historical documentation.In the present study,we attempt to analyze the sedimentary records containing typhoon information for the northern South China Sea region.For this purpose,sediment cores were collected from two coastal lagoons in the southeastern Hainan Island,and were analyzed in laboratory to derive the data sets about grain size,organic and inorganic carbon contents,and deposition rates.The grain size and organic-inorganic carbon data were used to formulate the proxies of typhoon events.The deposition rates,as calculated using the CRS 210 Pb method,are around 0.5 mm/a for both lagoons,on the basis of which an age model is established.Within the cores,sedimentary layers associated with 35 typhoon events have been identified.On such a basis,a 350 year history of local typhoon activities is reconstructed by incorporating the 210 Pb dating results,typhoon-induced sedimentation patterns and the historical documents.A comparison of the frequency of typhoon occurrence with the regional climate records indicates that the observed changes in tropical cyclone activity patterns,as revealed by the lagoon sedimentary records,may be related to El Ni?o,Pacific Decadal Oscillation(PDO),North Atlantic Oscillation(NAO),sunspot,and other potential climate drivers that affect the tropical cyclone variability.This study demonstrates that the sedimentary record of storms can be analyzed in combination with historical documents,to provide meaningful information on past storm activities and their long-term variability.

DOI

Outlines

/