Research Articles

A comprehensive analysis of phenological changes in forest vegetation of the Funiu Mountains, China

  • ZHU Wenbo ,
  • ZHANG Xiaodong ,
  • ZHANG Jingjing ,
  • ZHU Lianqi
Expand
  • College of Environment and Planning, Henan University, Kaifeng 475004, Henan, China

Author: Zhu Wenbo (1989-), PhD, specialized in the mountain ecosystem service, development and utilization of regional natural resources. E-mail:

Received date: 2018-04-17

  Accepted date: 2018-06-20

  Online published: 2019-01-25

Supported by

National Natural Science Foundation of China, No.41671090

National Basic Research Program (973 Program), No.2015CB452702

Copyright

Journal of Geographical Sciences, All Rights Reserved

Abstract

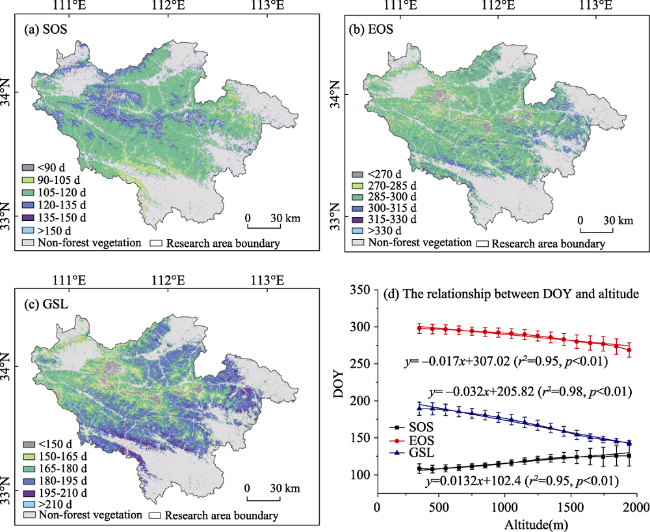
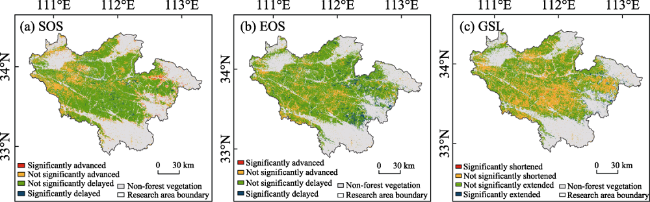
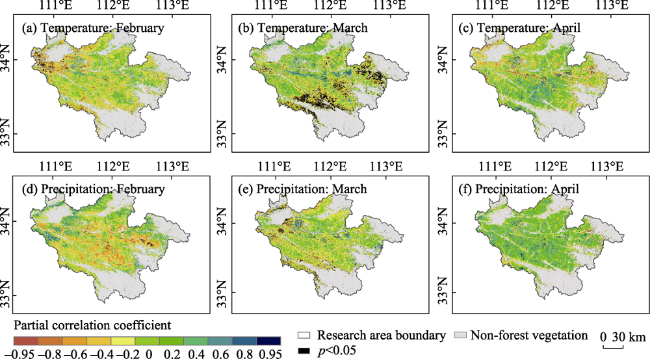
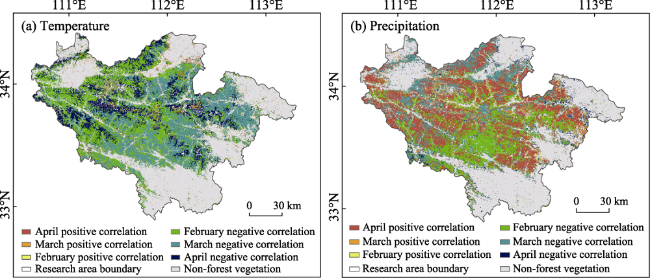
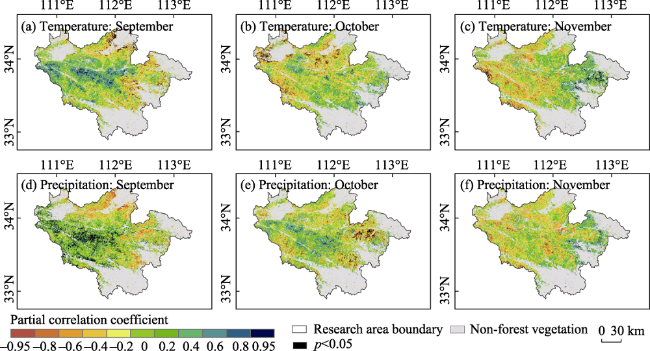
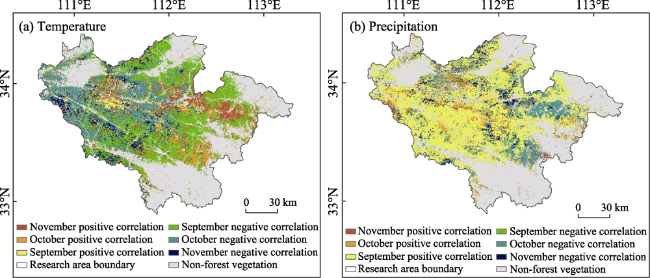
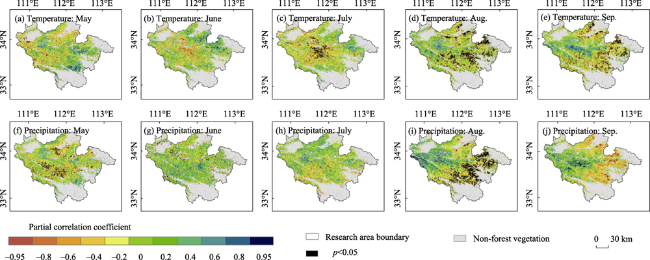
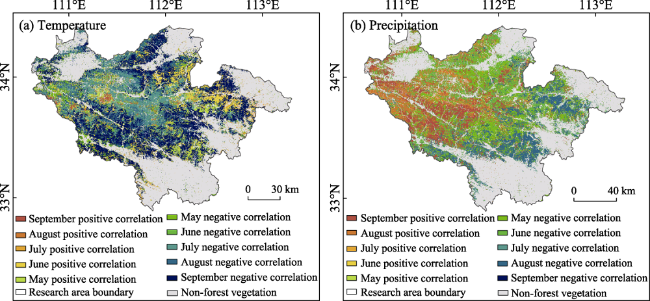
This paper reports the phenological response of forest vegetation to climate change (changes in temperature and precipitation) based on Moderate Resolution Imaging Spectroradiometer (MODIS) Enhanced Vegetation Index (EVI) time-series images from 2000 to 2015. The phenological parameters of forest vegetation in the Funiu Mountains during this period were determined from the temperature and precipitation data using the Savitzky-Golay filter method, dynamic threshold method, Mann-Kendall trend test, the Theil-Sen estimator, ANUSPLIN interpolation and correlation analyses. The results are summarized as follows: (1) The start of the growing season (SOS) of the forest vegetation mainly concentrated in day of year (DOY) 105-120, the end of the growing season (EOS) concentrated in DOY 285-315, and the growing season length (GSL) ranged between 165 and 195 days. There is an evident correlation between forest phenology and altitude. With increasing altitude, the SOS, EOS and GSL presented a significant delayed, advanced and shortening trend, respectively. (2) Both SOS and EOS of the forest vegetation displayed the delayed trend, the delayed pixels accounted for 76.57% and 83.81% of the total, respectively. The GSL of the forest vegetation was lengthened, and the lengthened pixels accounted for 61.21% of the total. The change in GSL was mainly caused by the decrease in spring temperature in the region. (3) The SOS of the forest vegetation was significantly partially correlated with the monthly average temperature in March, with most correlations being negative; that is, the delay in SOS was mainly attributed to the temperature decrease in March. The EOS was significantly partially correlated with precipitation in September, with most correlations being positive; that is, the EOS was clearly delayed with increasing precipitation in September. The GSL of the forest vegetation was influenced by both temperature and precipitation throughout the growing season. For most regions, GSL was most closely related to the monthly average temperature and precipitation in August.

Cite this article

ZHU Wenbo , ZHANG Xiaodong , ZHANG Jingjing , ZHU Lianqi . A comprehensive analysis of phenological changes in forest vegetation of the Funiu Mountains, China[J]. Journal of Geographical Sciences, 2019 , 29(1) : 131 -145 . DOI: 10.1007/s11442-019-1588-z

1 Introduction

Climate change has important effects on terrestrial ecosystems by altering plant photosynthesis, growth phases, soil formation processes, and nutrient availability (Ivan et al., 2018). The impacts of climate change are amplified in fragile ecosystems, especially in mountainous and coastal areas (King, 2004; Wang et al., 2011; Zhang et al., 2016; Zhu et al., 2016; Jordan et al., 2017). As an important component of mountain ecosystems, forest vegetation is sensitive to climate change. The phenology of mountain forest vegetation, which is a significant indicator of climate change, can reveal the dynamics of mountain vegetation growth processes and reflect the response and adaption of mountain ecosystems to global change; thus, phenology has become the focus of many mountain geography and ecology investigations (Jong et al., 2011; Zhu et al., 2011; Mu et al., 2012). Studying the phenological feedback of different types of forest vegetation to climate change and analyzing the dominant factors that influence phenological changes can help determine the mechanisms of geographical environmental changes in mountain areas and the functional consequences of such changes.
Forest vegetation phenology is the timing of developmental stages in its cycle, including bud burst, flowering, and senescence, which are closely linked to various environmental factors (Zhu et al., 1999; Kong et al., 2017; Luo et al., 2017). Long-term field observations have indicated that vegetation phenology has changed significantly with global warming. In particular, changes in spring temperatures have directly affected germination and flowering time. When spring temperature in Europe increased by 1°C, flowering time advanced by four days, and germination time advanced by 3.2-3.6 days; when the annual average temperature of the broad-leaved deciduous forest areas in the Eastern United States increased by 1°C, its growing season increased by 5 days (Zhang et al., 2004). At the hemispheric scale, although the National Oceanic and Atmospheric Administration has used remote sensing satellites such as the Advanced Very High Resolution Radiometer (AVHRR) to conduct a 20-year observation and found evidence of afforestation changes in the Northern Hemisphere, the regional observation of vegetation phenological changes in the context of global warming remains insufficient (Zhou et al., 2001; Nemani et al., 2003). The monitoring of regional vegetation phenology primarily involves traditional field observations and remote sensing. In the context of global warming, Xu et al. (2015) analyzed the phenological changes in different types of vegetation in Harbin and found that the germination date was substantially affected by an increase in average spring temperature (Xu et al., 2015). Ma et al. (2016) applied the dynamic threshold method to Global Inventory Modeling and Mapping Studies (GIMMS) Normalized Difference Vegetation Index (NDVI) remote sensing data to study the pattern of phenological change in the Tibetan Plateau from 1982 to 2005. The results showed that temperature played a more influential role in phenological change than precipitation (Ma et al., 2016). Zu et al. (2016) used GIMMS AVHRR remote sensing data to analyze the phenological response to climate change in northeastern China. They reported that temperature was more important to vegetation growth in spring, whereas precipitation was more important in autumn. Most studies that have used remote sensing data analyses to investigate vegetation phenology obtained key parameters through NDVI. However, the accuracy of these determined parameters could be undermined because NDVI is easily saturated and sensitive to soil background and other noises. The enhanced vegetation index (EVI) can effectively improve the accuracy of the examined parameters.
At the hemispheric and continental scales, a number of studies have examined changes in vegetation phenology in response to global warming. However, due to the inherent high diversity in terrestrial ecosystems, there are variations in the phenological responses to global change. To study the pattern in these variations, the vegetation in the Funiu Mountains was investigated in this study. This region is located in the transition zone between the north subtropical zone and the warm temperate zone and is known for its large physical geographical gradient, complicated evolutionary processes, and fragile ecosystems (Ma, 2004; Ding et al., 2006; Fan et al., 2008; Zhang et al., 2016). Based on the Savitzky-Golay (S-G) filter algorithm, the phenology parameters of forest vegetation from 2000 to 2015 were extracted. Combined with temperature and precipitation data, these parameters were used to analyze the characteristics of phenological change in the various types of forest vegetation and their relationship to temperature and precipitation. The multidimensional changes in phenology in response to climate change in the Funiu Mountains were also examined.

2 Research area and data analyses

2.1 Research area

The Funiu Mountains are located in western Henan Province and lie at 110°30′ to 113°30′E, 32°45′ to 34°20′N (Figure 1). The study area includes eight counties: Luanchuan, Songxian, Lushan, Xixia, Neixiang, Zhenping, Lushi, and Nanzhao. The elevation ranges from 45 to 2150 m asl. The average annual temperature is between 12.1°C and 15.1°C, and the total precipitation fluctuates from 800 to 1100 mm, most precipitation falls during May to September. The mountains lie in the transitional zone from the second to the third step in Chinese topography; they have highly diverse physical geographic landscapes along with complex climatic and geomorphological conditions. Accordingly, the varied transition-type vegetation changes from southern warm-temperate deciduous broad-leaved forests to northern subtropical mixed evergreen and deciduous broad-leaved forests. The main soil types in this region are brunisolic, yellow brunisolic, and cinnamon. The thin soil layers, undulating terrain, and poor trees growing conditions result in a vulnerable ecosystem (Song et al., 1994).
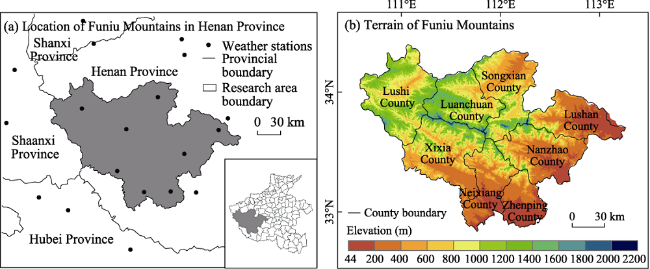
Figure 1 Location of the research area and topography

2.2 Data extraction and analyses

2.2.1 EVI data
The Moderate Resolution Imaging Spectroradiometer (MODIS) Enhanced Vegetation Index (EVI) data used in this study were obtained from the National Aeronautics and Space Administration MOD13Q1 datasets for 2000-2015 at a spatial resolution of 250 m and a temporal resolution of 16 d. The MODIS Reprojection Tool was used to extract the EVI data from the MOD13Q1 datasets and to perform the reprojection.
We used the dynamic threshold method in the TIMESAT program (Jönsson et al., 2002, 2004) to analyze the start of the growing season (SOS), the growing season length (GSL), and the end of the growing season (EOS) for forest vegetation in the Funiu Mountains from 2000 to 2015.
2.2.2 Meteorological data
Meteorological data of the research area and its surroundings, including monthly mean temperature and monthly precipitation from 2000 to 2015, were downloaded for 14 stations of the China Meteorological Administration (www.sci-data.cma.gov.cn). To more precisely analyze the fluctuations of hydrothermal conditions in the Funiu Mountains, data from five stations of the Henan Meteorological Bureau were acquired. Considering the phenological growth cycle of forest vegetation in the Funiu Mountains, an interpolation of the meteorological data was conducted for the period from February to November.
2.2.3 Other data
In this paper, elevation and other topographic features were extracted from a digital elevation model (DEM) at 30 m resolution (ASTER GDEM V2). Based on ENVI V5.1, the DEM images were mosaicked, and the resultant DEM data were then reprojected and resampled to 250 m. Finally, using ArcGIS (V10.1), we used the vector data of the study area boundary to extract the topographic feature attributes data of the Funiu Mountains.

2.3 Methodology

2.3.1 Remote sensing extraction method of forest vegetation phenology
First, the S-G filtering method in the TIMESAT package was used to smooth the EVI images from 2000 to 2015. Next, the date of EVI increase or decrease to 50% of the EVI amplitude was defined as the SOS or EOS, respectively. The parameters of forest vegetation phenology (SOS, EOS, and GSL) were extracted based on pixels from the study area from 2000 to 2015. GSL was defined as the difference between EOS and SOS. The conversion of forest vegetation phenological period adopted the Julian calendar; that is, the phenological period was the actual number of days from January 1.
2.3.2 Recognition method of forest vegetation
Huanjing satellites are widely used to obtain information on vegetation cover (Wang et al., 2013). Adopting an object-based method for vegetation classification avoids effects caused by the “same object with different spectrum”, “different objects with the same spectrum”, and “salt and pepper noise.” The vegetation in the Funiu Mountains was classified as evergreen broad-leaved forest, evergreen coniferous forest, deciduous broad-leaved forest, deciduous coniferous forest, mixed deciduous-coniferous forest, deciduous broad-leaved forest, and mixed evergreen-deciduous forest (Figure 2). To validate the classification accuracy, 120 random sample points were selected and assessed. The total accuracy reached 85% with a kappa coefficient of 0.8, which met the required standard. Due to the long cycles of regeneration and succession of forest vegetation in mountainous areas along with the limited scope of spatial variation in mountain areas, these classification data were considered appropriate for this investigation.
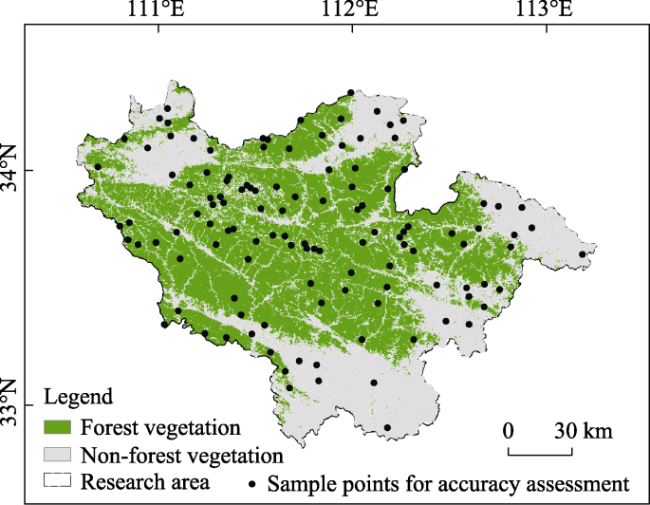
Figure 2 Forest vegetation types in the research area
2.3.3 Method of meteorological interpolation
Australian scholar Hutchinson developed the ANUSPLIN software, which can be used for the spatial interpolation of meteorological factors and is particularly suitable for processing time series of meteorological data (Liu et al., 2008). Under the complex mountain environment, the interpolation of temperature and precipitation data using ANUSPLIN is highly accurate (Yu et al., 2008). Tan used ANUSPLIN for temperature interpolation in the complex surface of the Tibetan Plateau and obtained a mean square error of only 0.82°C (Tan et al., 2016). Therefore, in this study, we selected ANUSPLIN for the interpolation of monthly average temperature and precipitation from February to November of 2000 to 2015. The spline number was 2, and the longitude, latitude and elevation were covariates.
2.3.4 Analysis of trend and correlation
In this study, the Theil-Sen (T-sen) estimator method was used to determine the variation in the SOS, EOS, and GSL of forest vegetation in the Funiu Mountains (Sen, 1968). T-sen > 0 indicates that the phenological parameter was delayed or extended, whereas T-sen < 0 indicates that the phenological parameter was advanced or shortened. Meanwhile, a Mann-Kendall (M-K) trend test was conducted (95% confidence level) (And et al., 2006). According to the results of the T-sen and M-K tests, the inter-annual variation in the forest vegetation phenology of the Funiu Mountains was classified as follows: significantly delayed or extended (T-sen > 0, p < 0.05); significantly advanced or shortened (T-sen < 0, p < 0.05); not significantly delayed or extended (T-sen > 0, P > 0.05); and not significantly advanced or shortened (T-sen < 0, p > 0.05).
The Pearson correlation, partial correlation and significance test, among response characteristics of forest vegetation phenology with monthly mean temperature, precipitation from February to November, in the Funiu Mountains were analyzed. The following correlations were evaluated: SOS with monthly mean temperature, precipitation in February, precipitation in March, and precipitation in April; EOS with monthly mean temperature, precipitation in September, precipitation in October, and precipitation in November; and GSL with monthly mean temperature, precipitation in May, precipitation in June, precipitation in July, precipitation in August, and precipitation in September. To analyze the effects of temperature and precipitation on Funiu forest phenology, ENVI/IDL procedures were used to compose the multiband correlation coefficient among forest vegetation phenology with temperature, precipitation in different months, recognize the largest absolute value month of correlation coefficient, and mark whether the pixel is a positive effect or negative effect on forest vegetation phenological period.

3 Results

3.1 Average phenological period of forest vegetation

To study the spatial pattern of forest vegetation phenological period in the Funiu Mountains, the spatial distributions and trends in the SOS, EOS, and GSL of forest vegetation over 16 years were evaluated (Figure 3). The SOS dates of forest vegetation at different elevations from 2000 to 2015 exhibited a delaying trend moving from the peripheral to the central areas in the Funiu Mountains; vegetation in the peripheral areas entered the growing season earlier from approximately day of year (DOY) 105 to 120 (around late April), while vegetation in the central areas entered the growing season later at approximately DOY 120 to 135 (around early May) (Figure 3a). In addition, areas with SOS in the range of DOY 90 to 105 were mostly distributed in the eastern and southern parts. From Figure 3b, it can be seen that the EOSs in the southern and eastern low-altitude areas are the latest, mainly from DOY 300 to 315, while DOY ranges from 285 to 300 d in other regions. The GSL of forest vegetation shortened from the peripheral to the central part of the Funiu Mountains (Figure 3c). The GSLs in the eastern and southern lowlands were mostly within 195 to 210 d, while those in the northwestern and central parts were mostly 165-180 and 150-165 d, respectively.
The changes in forest vegetation phenological parameters with altitude are shown in Figure 3d. With increasing altitude, SOS was significantly delayed at the rate of 1.3 d/100 m (R2 = 0.95, p < 0.01), EOS was lengthened at 1.7 d/100 m (R2 = 0.95, p < 0.01), and GSL was markedly shortened at 3.2 d/100 m (R2 = 0.98, p < 0.01).
Figure 3 Spatial distributions of annual mean forest phenological parameters averaged over years in the Funiu Mountains and their relationships with altitude from 2000 to 2015

3.2 Annual change in forest vegetation phenology

The SOS of forest vegetation showed a delaying trend in most pixels (76.57%), but the delaying area accounted for only 2.16% and was significantly scattered in the central part (Figure 4a). The pixels for which SOS was markedly lengthened were mainly concentrated in the southern, northern and eastern parts of the region, and those for which SOS was markedly delayed were primarily dispersed in the eastern part.
Figure 4 Spatial distributions of interannual variation in forest phenological parameters in the Funiu Mountains from 2000 to 2015
In most of the pixels, EOS was delayed (83.81%); among these, EOS was significantly delayed by 6.38%, which were mainly distributed in low-altitude areas in the southeastern part. The pixels for which EOS was not significantly delayed were concentrated in the central and northern regions, whereas the pixels in which EOS was significantly advanced were concentrated in the southern and eastern areas (0.04%; Figure 4b).
The changes in forest vegetation GSL were not significant; 60.85% of the pixels showed non-significant lengthening, and 36.25% showed non-significant shortening (Figure 4c). The areas in which GSL was insignificantly shortened were mainly concentrated in the central, southern and eastern parts of the region. The pixels in which GSL was significantly lengthened (0.36%) were mainly concentrated in the southeastern and northern parts.

3.3 Response of forest vegetation phenology to change of temperature and precipitation

3.3.1 Effects of temperature and precipitation on SOS
The spatial distributions of the partial correlation coefficients between SOS of forest vegetation and monthly average temperature and precipitation from February to April are shown in Figure 5. The partial correlation coefficients between SOS and monthly average temperature in February and March were mostly negative, indicating that SOS was delayed with decreasing temperature; however, the correlation coefficients became positive in April.
Figure 5 Spatial distributions of partial correlation coefficients between the start of the growing season (SOS) and February-April temperature and precipitation in the Funiu Mountains
In February, precipitation generally had a negative effect on SOS of forest vegetation at high elevations and a positive effect at lower elevations. The positive and negative partial correlation coefficients between SOS and precipitation exhibited uniform spatial distributions in March. In most regions, the partial correlation coefficients between SOS and precipitation were positive in April. The number of pixels with significant partial correlations between SOS and monthly average temperature was the greatest in March (13.94%), indicating that the monthly average temperature in March had a relatively great impact on SOS.
Figure 6 shows the relationship between temperature and precipitation for the month with the maximum impact on the SOS of forest vegetation. The SOS of forest vegetation was mainly affected by the monthly average temperature in February and March (37.24% and 37.25% of the pixels, respectively), and the decreasing monthly average temperature played a large role in delaying SOS. Furthermore, the eastern and southern parts were primarily influenced by temperature decreases in March, while the northwestern part was mainly influenced by temperature decreases in February. In 22.90% of the pixels, SOS of forest vegetation was affected by the monthly average temperature; in April, 2.93% of the pixels were positively affected, while 19.97% were negatively affected.
Figure 6 Spatial distributions of the start of the growing season (SOS) response to (a) temperature and (b) precipitation in the Funiu Mountains
The precipitation in April significantly affected SOS. In 37.25% of the pixels, SOS was delayed with increasing precipitation in April; in 4.6%, SOS was lengthened with increasing precipitation in April. In 28.96% and 26.11% of the pixels, SOS was significantly negatively affected by the precipitation in February and March, respectively.
3.3.2 Effects of temperature and precipitation on EOS
The spatial distributions of the partial correlation coefficients between EOS and monthly average temperature and precipitation from September to November are shown in Figure 7. EOS was positively affected by temperature in September and negatively affected by temperatures in October and November. For precipitation, EOS of forest vegetation in the Funiu Mountains displayed a positive partial correlation with precipitation in September, and a few areas displayed significant positive partial correlations with precipitation in October and November. In terms of statistical significance, less than 5% of the pixels exhibited partial correlations between EOS of forest vegetation and monthly temperature in September, October, and November (4.09%, 3.03% and 2.17% respectively). In September, 10.47% of the pixels exhibited significant partial correlations between EOS and precipitation, and these pixels were mainly distributed in the southwestern part of the study area. Only 2.88% and 1.30% of the pixels showed significant partial correlations between EOS and precipitation in October and November, respectively.
Figure 7 Spatial distributions of partial correlation coefficients between the end of the growing season (EOS) and September-November temperature and precipitation in the Funiu Mountains
From the correlation coefficients between EOS of forest vegetation and temperature and precipitation (Figure 8), the number of pixels that the EOS were most negatively affected by monthly average temperature accounted for 42.87% and 23.27% of the total in September and October, respectively. Precipitation affected EOS most significantly in September; EOS was positively affected by precipitation in 64.99% of the pixels, indicating that the increase in precipitation in September delayed the EOS of forest vegetation. EOS was most significantly affected by precipitation in the eastern low-altitude region (16.94% of the total area), and EOS was negatively correlated with precipitation in October.
Figure 8 Spatial distributions of the end of the growing season (EOS) response to (a) temperature and (b) precipitation in the Funiu Mountains
3.3.3 Response of GSL of forest vegetation to temperature and precipitation
The GSL was negatively correlated with monthly average temperature from May through July in the central region at higher elevation, while a positive correlation was found in the marginal area. The monthly average temperatures in August and September had a negative effect on GSL in the eastern part and a positive impact in the western (Figure 9). In terms of precipitation, the increase in precipitation from May to July increased the GSL in most areas. The effect of precipitation in August and September on GSL showed obvious spatial heterogeneity; GSL was mainly negatively correlated with precipitation in the northern, southern and eastern parts and positively correlated with precipitation in the northwestern parts.
Figure 9 Spatial distributions of partial correlation coefficients between the length of the growing season (GSL) and May-September temperature and precipitation in the Funiu Mountains
GSL was significantly correlated with monthly average temperature in August in 16.07% and September in 11.61% of the total pixels, respectively; these pixels were mainly distributed in the northern, eastern and southern parts. The GSL of forest vegetation was significantly correlated with precipitation in August in 18.14% of the total area, mainly distributed in the southern low-altitude region.
The relationship between the GSL of forest vegetation and the monthly average temperature and precipitation was more complex (Figure 10). The GSL in 40.46% of the total pixels was affected by monthly average temperature in September, and most were negatively correlated. The pixels that were significantly affected by the monthly average temperature in both June and July were similar, 11.61% and 18.68% of the total respectively. In the low-altitude marginal area, the GSL of forest vegetation increased with increasing temperature. The GSL of the northwestern part was mainly affected by precipitation in August and September positively, while that in the eastern was negatively correlated with precipitation in May and June. These results show that the effect of precipitation on GSL of forest vegetation had obvious spatial and temporal differences.
Figure 10 Spatial distribution of the length of the growing season (GSL) response to (a) temperature and (b) precipitation in the Funiu Mountains

4 Discussion

The results of this paper show that the SOS has been delayed during 2000-2015, consistent with the results of Xia et al. (2015) in other low-altitude areas in eastern Qinling Mountains. The delayed SOS may affect the growth of vegetation (Pau et al., 2011), decrease primary productivity (Richardson et al., 2013), and degrade forest ecosystem services; however, it can also have positive effects, including reducing the risk of spring frost (Dai et al., 2013). Compared to the advanced SOS in most of China’s temperate regions, the delayed SOS in forest vegetation of the Funiu Mountains has distinct regional characteristics, the particularity can be explained by the traits of regional climate.
The results of this study indicate that the SOS, EOS and GSL of forest vegetation in the Funiu Mountains were affected by changes in both monthly average temperature and precipitation. The SOS of forest vegetation was most strongly influenced by monthly average temperature in February and March; decreasing temperature in spring delayed the SOS of forest vegetation. In contrast, the effect of precipitation on SOS of forest vegetation exhibited significant spatial differences. SOS was negatively correlated with spring precipitation in 54.33% of the pixels and positively correlated in the remaining pixels. The increase in precipitation in some areas provided the vegetation with sufficient moisture, increased its growth, and advanced the phenological phase. However, in some areas of coniferous forest, the increase in precipitation led to a decrease in temperature, resulting in a delay in the phenological phase (Zu et al., 2016). In general, the relationships between the spring phenological phase of forest vegetation and temperature and precipitation in the Funiu Mountains are the same as those in other parts of China. However, the temperatures in February and March decreased significantly by 0.68°C/10a and 0.25°C/10a, respectively, in contrast to the spring warming observed in most parts of the country (Liu, 2015). This “abnormal” change in spring temperature was the main factor leading to the delay of the SOS of Funiu Mountains.
Compared to SOS, temperature and precipitation affected EOS differently in different months. The EOS of forest vegetation was positively correlated with temperature and precipitation in September; that is, EOS was delayed with increasing temperature and precipitation in September, consistent with results reported in northern China (Cong et al., 2013, Tao et al., 2017). However, this study also found that the increased precipitation in October and November led to advancement in EOS. This was attributed to the increased soil moisture, which affected the rate of photosynthesis of vegetation, promoted vegetation growth, and eventually caused EOS to advance (Ji et al., 2005). At the same time, the phenological changes in spring and autumn may be affected by other environmental factors besides temperature and precipitation, including optical cycle, radiation intensity and carbon concentration (Xia et al., 2013, Cui et al., 2013, Forkel et al., 2015, Gill et al., 2015). Although these environmental factors have little effect on vegetation phenology compared to temperature and precipitation, they cannot be ignored.
The phenological data extracted from MODIS EVI have been compared with observational data. This study collected SOS and EOS data for elm in Neixiang and simon poplar in Lushi from 2000 to 2015. The average SOS date of elm fell in the last ten-day period of March, while the annual average EOS fell in the first ten-day period of September. The annual average SOS of simon poplar was during the first ten-day period of April, and the average EOS was in the second ten-day period of September. These dates are consistent with this study, in which the SOS and EOS of forest vegetation were found to be between DOY 90-120 and 270-300, respectively. Although the remote sensing data reflect the phenology of vegetation on a large scale, which differ from plant phenology observed in the field, the dates of SOS and EOS are consistent. The scale conversion between phenological data based on remote sensing and field observations is the focus of ongoing research.

5 Conclusions

In this study, the SOS, EOS and GSL of forest vegetation in the Funiu Mountains were extracted from MODIS EVI data along with temperature and precipitation data from 2000-2015. The spatial and temporal changes in these phenological parameters were analyzed systematically, and the relationships between the phenological parameters and temperature, and precipitation were evaluated. The conclusions are as follows.
(1) Within the Funiu Mountains, SOS was mostly concentrated within DOY 105-120, while EOS was mostly concentrated within DOY 285-315. GSL primarily ranged between 165 and 195 d. Based on the annual trends in phenological parameters over the 16-year study period, areas with no significant delay in SOS and EOS accounted for 74.41% and 77.43% of the total area, respectively, and areas where EOS was not significantly lengthened accounted for 60.85% of the total area. Phenological period was closely related to elevation; SOS and EOS were delayed with increasing elevation, while GSL was increased.
(2) Over the past 16 years, the average temperature and precipitation in the Funiu Mountains have exhibited the following trends. Temperature in February and March has decreased significantly, while temperature in October has increased. Precipitation in June and October has decreased significantly. Between February and March, the temperature has mainly decreased, while the precipitation has primarily increased. Between May and September, the temperature has mainly increased, while precipitation has mainly decreased. Between September and November, the temperature primarily increased, while precipitation mainly decreased.
(3) In the Funiu Mountains, the delay in SOS was primarily attributed to the decreased temperature in March, and the delay in EOS was primarily attributed to the increased precipitation in September. The increase in GSL was primarily attributed to the increased temperature between July and September.

The authors have declared that no competing interests exist.

[1]
And D R H, Frans L M, 2006. Regional Kendall test for trend.Environmental Science & Technology, 40(13): 4066-4073.Trends in environmental variables are often investigated within a study region at more than one site. At each site, a trend analysis determines whether a trend has occurred. Yet often also of interest is whether a consistent trend is evident throughout the entire region. This paper adapts the Seasonal Kendall trend test to determine whether a consistent regional trend occurs in environmental variables.

DOI PMID

[2]
Chen X, Yu R, 2007. Spatial and temporal variations of the vegetation growing season in warm-temperate eastern China during 1982 to 1999.Acta Geographica Sinica, 62(1): 41-51. (in Chinese)

[3]
Cong N, Wang T, Nan H et al., 2013. Changes in satellite-derived spring vegetation green-up date and its linkage to climate in China from 1982 to 2010: A multi-method analysis.Global Change Biology, 19(3): 881-891.The change in spring phenology is recognized to exert a major influence on carbon balance dynamics in temperate ecosystems. Over the past several decades, several studies focused on shifts in spring phenology; however, large uncertainties still exist, and one understudied source could be the method implemented in retrieving satellite-derived spring phenology. To account for this potential uncertainty, we conducted a multimethod investigation to quantify changes in vegetation green-up date from 1982 to 2010 over temperate China, and to characterize climatic controls on spring phenology. Over temperate China, the five methods estimated that the vegetation green-up onset date advanced, on average, at a rate of 1.3 similar to +/-similar to 0.6 similar to days per decade (ranging from 0.4 to 1.9 similar to days per decade) over the last 29 similar to years. Moreover, the sign of the trends in vegetation green-up date derived from the five methods were broadly consistent spatially and for different vegetation types, but with large differences in the magnitude of the trend. The large intermethod variance was notably observed in arid and semiarid vegetation types. Our results also showed that change in vegetation green-up date is more closely correlated with temperature than with precipitation. However, the temperature sensitivity of spring vegetation green-up date became higher as precipitation increased, implying that precipitation is an important regulator of the response of vegetation spring phenology to change in temperature. This intricate linkage between spring phenology and precipitation must be taken into account in current phenological models which are mostly driven by temperature.

DOI PMID

[4]
Cui Y P, 2013. Preliminary estimation of the realistic optimum temperature for vegetation growth in China.Environmental Management, 52(1): 151-162.The estimation of optimum temperature of vegetation growth is very useful for a wide range of applications such as agriculture and climate change studies. Thermal conditions substantially affect vegetation growth. In this study, the normalized difference vegetation index (NDVI) and daily temperature data set from 1982 to 2006 for China were used to examine optimum temperature of vegetation growth. Based on a simple analysis of ecological amplitude and Shelford's law of tolerance, a scientific framework for calculating the optimum temperature was constructed. The optimum temperature range and referenced optimum temperature (ROT) of terrestrial vegetation were obtained and explored over different eco-geographical regions of China. The results showed that the relationship between NDVI and air temperature was significant over almost all of China, indicating that terrestrial vegetation growth was closely related to thermal conditions. ROTs were different in various regions. The lowest ROT, about 7.0 A degrees C, occurred in the Qinghai-Tibet Plateau, while the highest ROT, more than 22.0 A degrees C, occurred in the middle and lower reaches of the Yangtze River and the Southern China region.

DOI PMID

[5]
Dai J, Wang H, Ge Q, 2013. The decreasing spring frost risks during the flowering period for woody plants in temperate area of eastern China over past 50 years.Journal of Geographical Sciences, 23(4): 641-652.The temperate monsoon area of China is an important agricultural region but late spring frosts have frequently caused significant damage to plants there. Based on phenological data derived from the Chinese Phenological Observation Network (CPON), corresponding meteorological data from 12 study sites and phenological modeling, changes in flowering times of multiple woody plants and the frequency of frost occurrence were analyzed. Through these analyses, frost risk during the flowering period at each site was estimated. Results of these estimates suggested that first flowering dates (FFD) in the study area advanced significantly from 1963 to 2009 at an average rate of -1.52 days/decade in Northeast China (P < 0.01) and -2.22 days/decade (P < 0.01) in North China. Over the same period, the number of frost days in spring decreased and the last frost days advanced across the study area. Considering both flowering phenology and occurrence of frost, the frost risk index, which measures the percentage of species exposed to frost during the flowering period in spring, exhibited a decreasing trend of -0.37% per decade (insignificant) in Northeast China and -1.80% per decade (P < 0.01) in North China, implying that frost risk has reduced over the past half century. These conclusions provide important information to agriculture and forest managers in devising frost protection schemes in the region.

DOI

[6]
Ding S, Lu X, 2006. Comparison of plant flora of Funiu Mountain and Jigong Mountain natural reserves.Geographical Research, 25(1): 62-70. (in Chinese)The Funiu Mountain and Jigong Mountain naturalreserves are two famous forest reserves in Henan province.This paper compared the floras of these two natural reserves and calculated the comparability coefficients of the plants.The conclusion is as follows: the floras have certain comparability in the two regions,but they also differ to a certain extent.On the whole the transitionality in Funiu Mountain is stronger than Jigong Mountain,the flora of Funiu Mountain has a more tightness contact with Central China and North China,there are not only tropical and subtropical species but also many species of north temperate zone.Jigong Mountain is even more closely related to the north subtropical plant flora.The characteristics of these two regions are as follows:(1) the plant species and flora in Funiu Mountain are complex,dominated by tropical,subtropical and temperate zone components,while the plants in Jigong Mountain are mostly tropical and subtropical components, with temperate zone species in dominance to a certain extent.(2)Both regions are characterized by various geographical compositions,extensive flora contacts,association with east and west and transition between north and south.(3)There are many species proper to China.Funiu Mountain has close contact with floras of Central China,Southwest China and North China.Floras in Jigong Mountain are more closely related to Central China and East China.(4)Both are the unique species distributing centers of China in Henan Province,especially 80% of Henan unique species are concentrated in Funiu Mountain natural reserve.There are much more plant species in Funiu Mountain than in Jigong Mountain.This is propably related directly to their areas,the impacts of the human activities and the characteristics of transition.Furthermore,based on the comparative studies of the contact and characteristics of the floras in the two regions,we found that there are certain transitional characteristics in them,but the case of Funiu Mountain is clearer than that of Jigong Mountain.Since the two regions have an extremely higher comparability,it is suggested that these two regions should be put into one vegetation zone.However as there must be some differences between the northern slope and the southern slope of the Funiu Mountain,so whether there are close relations of vegetation between the two slopes of Funiu Mountain and Jigong Mountain need to be further studied.

DOI

[7]
Fan Y, Hu N, Ding S et al., 2008. A study on the classification of plant functional types based on the dominant herbaceous species in forest ecosystem at Funiu Mountain national natural reserve.Acta Ecologica Sinica, 28(7): 3092-3101. (in Chinese)

[8]
Forkel M, Migliavacca M, Thonicke K et al., 2015. Codominant water control on global interannual variability and trends in land surface phenology and greenness.Global Change Biology, 21(9): 3414-3435.Abstract Identifying the relative importance of climatic and other environmental controls on the interannual variability and trends in global land surface phenology and greenness is challenging. Firstly, quantifications of land surface phenology and greenness dynamics are impaired by differences between satellite data sets and phenology detection methods. Secondly, dynamic global vegetation models (DGVMs) that can be used to diagnose controls still reveal structural limitations and contrasting sensitivities to environmental drivers. Thus, we assessed the performance of a new developed phenology module within the LPJmL (Lund otsdam ena managed Lands) DGVM with a comprehensive ensemble of three satellite data sets of vegetation greenness and ten phenology detection methods, thereby thoroughly accounting for observational uncertainties. The improved and tested model allows us quantifying the relative importance of environmental controls on interannual variability and trends of land surface phenology and greenness at regional and global scales. We found that start of growing season interannual variability and trends are in addition to cold temperature mainly controlled by incoming radiation and water availability in temperate and boreal forests. Warming-induced prolongations of the growing season in high latitudes are dampened by a limited availability of light. For peak greenness, interannual variability and trends are dominantly controlled by water availability and land-use and land-cover change (LULCC) in all regions. Stronger greening trends in boreal forests of Siberia than in North America are associated with a stronger increase in water availability from melting permafrost soils. Our findings emphasize that in addition to cold temperatures, water availability is a codominant control for start of growing season and peak greenness trends at the global scale.

DOI PMID

[9]
Gill A L, Gallinat A S, Sanders-Demoot R et al., 2015. Changes in autumn senescence in northern hemisphere deciduous trees: A meta-analysis of autumn phenology studies.Annals of Botany, 116(6): 875-888.Many individual studies have shown that the timing of leaf senescence in boreal and temperate deciduous forests in the northern hemisphere is influenced by rising temperatures, but there is limited consensus on the magnitude, direction and spatial extent of this relationship. A meta-analysis was conducted of published studies from the peer-reviewed literature that reported autumn senescence dates for deciduous trees in the northern hemisphere, encompassing 64 publications with observations ranging from 1931 to 2010. Among the meteorological measurements examined, October temperatures were the strongest predictors of date of senescence, followed by cooling degree-days, latitude, photoperiod and, lastly, total monthly precipitation, although the strength of the relationships differed between high- and low-latitude sites. Autumn leaf senescence has been significantly more delayed at low (25 to 49 N) than high (50 to 70 N) latitudes across the northern hemisphere, with senescence across high-latitude sites more sensitive to the effects of photoperiod and low-latitude sites more sensitive to the effects of temperature. Delays in leaf senescence over time were stronger in North America compared with Europe and Asia. The results indicate that leaf senescence has been delayed over time and in response to temperature, although low-latitude sites show significantly stronger delays in senescence over time than high-latitude sites. While temperature alone may be a reasonable predictor of the date of leaf senescence when examining a broad suite of sites, it is important to consider that temperature-induced changes in senescence at high-latitude sites are likely to be constrained by the influence of photoperiod. Ecosystem-level differences in the mechanisms that control the timing of leaf senescence may affect both plant community interactions and ecosystem carbon storage as global temperatures increase over the next century.

DOI PMID

[10]
Ivan N B, Alexander A M, Mikhail Y et al., 2018. Climate warming as a possible trigger of Keystone Mussel population decline in Oligotrophic Rivers at the continental scale.Scientific Reports, 8: 35. doi: 10.1038/s41598-017-18873-yThe effects of climate change on oligotrophic rivers and their communities are almost unknown, albeit these ecosystems are the primary habitat of the critically endangered freshwater pearl mussel and its host fishes, salmonids. The distribution and abundance of pearl mussels have drastically decreased throughout Europe over the last century, particularly within the southern part of the range, but causes of this wide-scale extinction process are unclear. Here we estimate the effects of climate change on pearl mussels based on historical and recent samples from 50 rivers and 6 countries across Europe. We found that the shell convexity may be considered an indicator of the thermal effects on pearl mussel populations under warming climate because it reflects shifts in summer temperatures and is significantly different in viable and declining populations. Spatial and temporal modeling of the relationship between shell convexity and population status show that global climate change could have accelerated the population decline of pearl mussels over the last 100 years through rapidly decreasing suitable distribution areas. Simulation predicts future warming-induced range reduction, particularly in southern regions. These results highlight the importance of large-scale studies of keystone species, which can underscore the hidden effects of climate warming on freshwater ecosystems.

DOI PMID

[11]
Ji J, Huang M, Liu Q, 2005. Modeling studies of response mechanism of steppe productivity to climate change in middle latitude semiarid regions in China.Acta Meteorologica Sinica, 63(3): 257-266. (in Chinese)The impact of climate and environment on productivity of ecosystems is a complex process. Thorough understanding of these processes is helpful for estimation, prediction and management of productivity of ecosystems. The current coupled model of ecophysiological and physical transfer processes provides a useful tool for simulating response mechanism of ecosystem to climate and environment. It is possible to explore, to a certain extend, the formation process of ecosystem productivity in a changing climate. AVIM used in this study is a dynamical land surface process model that involves both physical transfer processes between soil, vegetation and the atmosphere and plant ecophysiological processes. Therefore, AVIM is capable of calculation of surface fluxes of energy and water and output of carbon flux and productivity. Semiarid steppe in middle latitude is transient climate-ecosystem zone that is sensitive to climate change. The response mechanism of steppe productivity (Net Primary Productivity, NPP) in semiarid areas to temperature and precipitation change was simulated with the AVIM. The results showed that changes of both temperature and precipitation had significant influence on NPP. The increasing of precipitation could increase NPP while the increasing of temperature could decrease NPP. The reason for this is thought that the increasing of precipitation could improve soil water stress and therefore enhance the photosynthesis rate. Increase in temperature could increase both photosynthesis and respiration rates on the one hand, on the other hand, it also decreases soil moisture due to increased evapotranspiration and thus results in the decrease in the photosynthesis rate. Since water condition plays a key role for plant the photosynthesis in semiarid region, so the total effects of temperature increasing caused a decrease in NPP. Sensitive tests show that for semiarid steppe in China, 2 temperature change could resulting in a variation of about 20% annual NPP and at least 30% above ground biomass. 50% change of precipitation could create 37% and 50% annual change of NPP and above ground biomass respectively.

DOI

[12]
Jordan R M, Nathan J S, Aimée T C et al., 2017. Elevation alters ecosystem properties across temperate treelines globally.Nature, 542: 91-95.Temperature is a primary driver of the distribution of biodiversity as well as of ecosystem boundaries(1,2). Declining temperature with increasing elevation in montane systems has long been recognized as a major factor shaping plant community biodiversity, metabolic processes, and ecosystem dynamics(3,4). Elevational gradients, as thermoclines, also enable prediction of long-term ecological responses to climate warming(5-7). One of the most striking manifestations of increasing elevation is the abrupt transitions from forest to treeless alpine tundra(8). However, whether there are globally consistent above-and belowground responses to these transitions remains an open question(4). To disentangle the direct and indirect effects of temperature on ecosystem properties, here we evaluate replicate treeline ecotones in seven temperate regions of the world. We find that declining temperatures with increasing elevation did not affect tree leaf nutrient concentrations, but did reduce ground-layer community-weighted plant nitrogen, leading to the strong stoichiometric convergence of ground-layer plant community nitrogen to phosphorus ratios across all regions. Further, elevation-driven changes in plant nutrients were associated with changes in soil organic matter content and quality (carbon to nitrogen ratios) and microbial properties. Combined, our identification of direct and indirect temperature controls over plant communities and soil properties in seven contrasting regions suggests that future warming may disrupt the functional properties of montane ecosystems, particularly where plant community reorganization outpaces treeline advance.

DOI PMID

[13]
Jong R D, Bruin S D, Wit A D et al., 2011. Analysis of monotonic greening and browning trends from global NDVI time-series.Remote Sensing of Environment, 115(2): 692-702.78 Phenological variation renders comparisons of NDVI by calendar date unsatisfactory. 78 Seasonal non-parametric model accounts for serial auto-correlation in NDVI data sets. 78 Photosynthetic intensity is helpful to disentangle drivers of greening or browning. 78 Forest biomes show reduced photosynthetic intensity, other biomes show increase. 78 Most-prominent greening (1981–2006) is found in shrub land, savanna and cropland.

DOI

[14]
Jönsson P, Eklundh L, 2002. Seasonality extraction by function fitting to time-series of satellite sensor data.IEEE Transactions on Geoscience and Remote Sensing, 40(8): 1824-1832.

DOI

[15]
Jönsson P, Eklundh L, 2004. Timesat: A program for analyzing time-series of satellite sensor data.Computers & Geosciences, 30(8): 833-845.Three different least-squares methods for processing time-series of satellite sensor data are presented. The first method uses local polynomial functions and can be classified as an adaptive Savitzky olay filter. The other two methods are more clear cut least-squares methods, where data are fit to a basis of harmonic functions and asymmetric Gaussian functions, respectively. The methods incorporate qualitative information on cloud contamination from ancillary datasets. The resulting smooth curves are used for extracting seasonal parameters related to the growing seasons. The methods are implemented in a computer program, TIMESAT, and applied to NASA/NOAA Pathfinder AVHRR Land Normalized Difference Vegetation Index data over Africa, giving spatially coherent images of seasonal parameters such as beginnings and ends of growing seasons, seasonally integrated NDVI and seasonal amplitudes. Based on general principles, the TIMESAT program can be used also for other types of satellite-derived time-series data.

DOI

[16]
Julien Y, Sobrino J A, 2009. Global land surface phenology trends from GIMMS database.International Journal of Remote Sensing, 30(13): 3495-3513.A double logistic function has been used to describe global inventory mapping and monitoring studies (GIMMS) normalized difference vegetation index (NDVI) yearly evolution for the 1981 to 2003 period, in order to estimate land surface phenology parameter. A principal component analysis on the resulting time series indicates that the first components explain 36, 53 and 37% of the variance for the start, end and length of growing season, respectively, and shows generally good spatial homogeneity. Mann endall trend tests have been carried out, and trends were estimated by linear regression. Maps of these trends show a global advance in spring dates of 0.38 days per year, a global delay in autumn dates of 0.45 days per year and a global increase of 0.8 days per year in the growing seasons validated by comparison with previous works. Correlations between retrieved phenological parameters and climate indices generally showed a good spatial coherence.

DOI

[17]
King D A, 2004. Environment-climate change science: Adapt, mitigate, or ignore?Science, 303(5655): 176-177.

DOI

[18]
Kong D, Zhang Q, Huang W et al., 2017. Vegetation phenology change in Tibetan Plateau from 1982 to 2013 and its related meteorological factors.Acta Geographica Sinica, 72(1): 39-52. (in Chinese)Using NDVI3 g vegetation index, we defined 18 phenological metrics to investigate phenology change in the Tibetan Plateau(TP). Considering heterogeneity of vegetation phenology, we divided TP into 8 vegetation clusters according to 1:1000000 vegetation cluster map. Using partial least regression(PLS) method, we investigated impacts of climate variables such as temperature, precipitation and solar radiation on vegetation phenology. Results indicated that:(1) Turning points of the date of the start of growing season(SOS) metrics are mainly observed during 1997-2000, before which SOS advanced 2-3 d/a. Turning points of the date of the end of growing season(EOS) and length of growing season(LOS) metrics are found during 2005 and 2004- 2007, respectively. Before the turning point, EOS has a delayed tendency of 1- 2 d/10 a, and LOS has a lengthening tendency of 1- 2 d/10 a. After the turning point, the tendency of SOS and EOS metrics is questionable. Meanwhile, lengthening of LOS is not statistically significant;(2) Alpine meadows and alpine shrub meadows are subject to the most remarkable changes. Lengthening LOS of alpine meadow is mainly due to advanced SOS and delayed EOS. Nevertheless, lengthening LOS of alpine shrub meadow is attributed mainly to advanced SOS;(3) Using PLS method, we quantified impacts of meteorological variables such as temperature, precipitation and solar radiation on phenology changes of alpine meadows and alpine shrub meadows, indicating that temperature is the dominant meteorological factor affecting vegetation phenology. In these two regions, autumn of last year and early winter temperature of last year have a positive effect on SOS. Firstly, increased temperature in this period would postpone last year's EOS, and hence indirectly delay SOS of the current year;Secondly, warming autumn and early winter have the potential to negatively impact fulfilment of chilling requirements, leading to delay of SOS. Except summer, minimum temperature has a similar effect on vegetation phenology, when compared to average and maximum temperature.Furthermore, precipitation effects on phenology fluctuate widely across different months.Precipitation of the autumn and winter/spring of the last year has a negative/positive effect on SOS. Besides, precipitation acts as the key driver constraining vegetation growth in August,during which precipitation has a positive impact on EOS. Therefore, solar radiation can exert impacts on vegetation phenology mainly during summer and early fall. Our research will provide a scientific support for the improvement of vegetation phenology model.

[19]
Liu F, 2015. Temporal-spatial variations of temperature in Chinese inland based on GIS and multivariate statistical method [D]. Lanzhou: Lanzhou University.

[20]
Liu Z, Li L, Mc Vicar T R et al., 2008. Introduction of the professional interpolation software for meteorology data: ANUSPLINN. Meteorological Monthly, 34(2): 92-100. (in Chinese)Spatial grid metrological data is an essential environmental factor for various geo-model and climate-model,and the interpolation software is a tool to make the data space-dependent.As a specially designed interpolation package for meteorological data,ANUSPLIN has advantages of its solid theory of thin plate spline function,high interpolation accuracy by the incorporation of parametric linear sub-model,in addition to the independent spline variables.Furthermore,it is more suitable for time series of meteorological data by processing one more surface layer one time.So many contents of ANUSPLIN,such as the interpolation theory,main data flows,parameters setting,model selection,statistic analyses and input-output formats are introduced through an example.It is expected that this paper is helpful for the researchers to use the ANUSPLIN more easily.

DOI

[21]
Luo Z, Yu S, 2017. Spatiotemporal variability of land surface phenology in China from 2001-2014.Remote Sens., 9: 65. doi: 10.3390/rs9010065.

[22]
Ma J, 2004. Laws of soil vertical variations on southern slope of Funiu Mt.: Simultaneous study on north boundary of subtropical zone.Acta Geographica Sinica, 59(6): 998-1011. (in Chinese)The vertical variations of soil compositions, properties, types according to genetic classification and taxonomic classification, and the north boundary of subtropical zone on the southern slope of Funiu Mountain were discussed in this paper based on soil survey in field and soil physical and chemical analysis in laboratory. There were some vertical varying laws of soil compositions and properties on the southern slope of Funiu Mountain. (1) The content of fulvic acid in soil humus exceeds that of humic acid in all profiles of soil (HA/FA1). The ratios of HA/FA in surface horizons are rising from foot to top of the mountain. The degree of humification in soil humic acid at 900 m asl is the lowest. (2) Along the altitude from foot to top of the mountain, both soil pH and base saturation percentage go down first, then go up. (3) Soils below 900 m asl have remarkable clayification horizon, argic horizon appears in each soil profile, and soils above 900 m asl have no clayification and argic horizons. (4) All of soils have higher degree of weathering and ferrallitization, average migration coefficients (Kmx) of most oxides and the values of in all of soil bodies are below 1, the values of "Saf" are smaller than 5.06, the contents of Fed in illuvial horizons are higher than 20 g kg-1, the percentage of Fed/Fet in illuvial horizons is higher than 40%, and many kinds of ferromanganese (concretion and coating) appear in all soil bodies below 900 m asl. But for soils with lower degree of weathering, no ferrallitization takes place, and no ferromanganese appears in all soil bodies above 900 m asl. The north boundary of subtropical zone on south slope of Funiu Mountain is in the area between S3 and S4, ranging from 900 m to 1000 m, the average height of which is at 950 m above sea level.

DOI

[23]
Ma X, Chen S, Deng J et al., 2016. Vegetation phenology dynamics and its response to climate change on the Tibetan Plateau.Acta Prataculturae Sinica, 25(1): 13-21. (in Chinese)

[24]
Mu S, Li J, Chen Y et al., 2012. Spatial differences of variations of vegetation coverage in Inner Mongolia during 2001-2010.Acta Geographica Sinica, 67(9): 1255-1268. (in Chinese)Global climate change has led to significant vegetation changes in the past half century.Inner Mongolia,most of which was located in arid and semi-arid areas,is undergoing a process of prominent warming and drying.It is necessary to investigate the response of vegetation to the climatic variations(temperature and precipitation) for a better understanding of the accumulated consequence of climate change.Vegetation coverage,which is an important indicator for evaluating terrestrial environment,is used to monitor vegetation change.MODIS-NDVI data and climate data were used to analyze the vegetation dynamics and its relationship with climate change on different spatial(forest,grassland and desert biome) and temporal(yearly and monthly) scales in Inner Mongolia during 2001-2010.It was found that vegetation coverage increased from west to east across Inner Mongolia with a change rate of 0.2/10 N.During 2001-2010,the mean vegetation coverage was 0.57,0.4 and 0.16 in forest,grassland and desert biome,respectively,exhibiting evident spatial heterogeneities.There is a slight increase of vegetation coverage over the study period.Across Inner Mongolia,the vegetation coverages with extremely significant and significant increase accounted for 11.25% and 29.13% of the total study area,respectively,while those with extremely significant and significant decrease were 7.65% and 26.61%,respectively.The correlation analysis between vegetation coverage and climate shows that annual vegetation coverage was better correlated with precipitation,while the change of monthly vegetation coverage is consistent with both the changes of temperature and precipitation,indicating that the vegetation growth within a year is more sensitive to the joint function of hydrothermal combination rather than either climate factor.The vegetation coverage of forest biome was mainly affected by temperature on both yearly and monthly scales,while that of desert biome was mainly influenced by precipitation on the two temporal scales.

DOI

[25]
Nemani R, Keeling C D, Hashimoto H et al., 2003. Climate-driven increases in global terrestrial net primary production from 1982 to 1999.Science, 300(5625): 1560-1563.Recent climatic changes have enhanced plant growth in northern mid-latitudes and high latitudes. However, a comprehensive analysis of the impact of global climatic changes on vegetation productivity has not before been expressed in the context of variable limiting factors to plant growth. We present a global investigation of vegetation responses to climatic changes by analyzing 18 years (1982 to 1999) of both climatic data and satellite observations of vegetation activity. Our results indicate that global changes in climate have eased several critical climatic constraints to plant growth, such that net primary production increased 6% (3.4 petagrams of carbon over 18 years) globally. The largest increase was in tropical ecosystems. Amazon rain forests accounted for 42% of the global increase in net primary production, owing mainly to decreased cloud cover and the resulting increase in solar radiation.

DOI

[26]
Pau S, Wolkovich E M, Cook B I et al., 2011. Predicting phenology by integrating ecology, evolution and climate science.Global Change Biology, 17(12): 3633-3643.Forecasting how species and ecosystems will respond to climate change has been a major aim of ecology in recent years. Much of this research has focused on phenology the timing of life-history events. Phenology has well-demonstrated links to climate, from genetic to landscape scales; yet our ability to explain and predict variation in phenology across species, habitats and time remains poor. Here, we outline how merging approaches from ecology, climate science and evolutionary biology can advance research on phenological responses to climate variability. Using insight into seasonal and interannual climate variability combined with niche theory and community phylogenetics, we develop a predictive approach for species reponses to changing climate. Our approach predicts that species occupying higher latitudes or the early growing season should be most sensitive to climate and have the most phylogenetically conserved phenologies. We further predict that temperate species will respond to climate change by shifting in time, while tropical species will respond by shifting space, or by evolving. Although we focus here on plant phenology, our approach is broadly applicable to ecological research of plant responses to climate variability.

DOI

[27]
Richardson A D, Keenan T F, Migliavacca M et al., 2013. Climate change, phenology, and phenological control of vegetation feedbacks to the climate system.Agricultural and Forest Meteorology, 169(3): 156-173.Vegetation phenology is highly sensitive to climate change. Phenology also controls many feedbacks of vegetation to the climate system by influencing the seasonality of albedo, surface roughness length, canopy conductance, and fluxes of water, energy, CO2 and biogenic volatile organic compounds. In this review, we first discuss the environmental drivers of phenology, and the impacts of climate change on phenology, in different biomes. We then examine the vegetation-climate feedbacks that are mediated by phenology, and assess the potential impact on these feedbacks of shifts in phenology driven by climate change. We finish with an overview of phenological modeling and we suggest ways in which models might be improved using existing data sets. Several key weaknesses in our current understanding emerge from this analysis. First, we need a better understanding of the drivers of phenology, particularly in under-studied biomes (e.g. tropical forests). We do not have a mechanistic understanding of the role of photoperiod, even in well-studied biomes. In all biomes, the factors controlling senescence and dormancy are not well-documented. Second, for the most part (i.e. with the exception of phenology impacts on CO2 exchange) we have only a qualitative understanding of the feedbacks between vegetation and climate that are mediated by phenology. We need to quantify the magnitude of these feedbacks, and ensure that they are accurately reproduced by models. Third, we need to work towards a new understanding of phenological processes that enables progress beyond the modeling paradigms currently in use. Accurate representation of phenological processes in models that couple the land surface to the climate system is particularly important, especially when such models are being used to predict future climate.

DOI

[28]
Sen P K, 1968. Estimates of the regression coefficient based on Kendall's Tau.Journal of the American Statistical Association, 63(324): 1379-1389.The least squares estimator of a regression coefficient 0205 is vulnerable to gross errors and the associated confidence interval is, in addition, sensitive to non-normality of the parent distribution. In this paper, a simple and robust (point as well as interval) estimator of 0205 based on Kendall''s [6] rank correlation tau is studied. The point estimator is the median of the set of slopes (Yj - Yi)/(tj-ti) joining pairs of points with ti 090902 ti, and is unbiased. The confidence interval is also determined by two order statistics of this set of slopes. Various properties of these estimators are studied and compared with those of the least squares and some other nonparametric estimators.

DOI

[29]
Song C, 1994. Scientific Survey of the Funiu Mountain Nature Reserve. Beijing: China Forestry Publishing House. (in Chinese)

[30]
Tan J, Li A, Lei G, 2016. Contrast on Anusplin and Cokriging meteorological spatial interpolation in southeastern margin of Qinghai-Xizang Plateau.Plateau Meteorology, 35(4): 875-886. (in Chinese)

[31]
Tao Z, Wang H, Liu Y, 2017. Phenological response of different vegetation types to temperature and precipitation variations in northern China during 1982-2012.International Journal of Remote Sensing, 38(11): 3236-3252.Plant phenology is influenced by various climatic factors such as temperature, precipitation, insolation, and humidity, etc. Among these factors, temperature and precipitation are proved to be the most important. However, the relative importance of these two factors is different among various phenophases and regions and is seldom discussed along environmental gradients. Based on normalized difference vegetation index (NDVI) data from the NDVI3g dataset and using the mid-point method, we extracted the start date of the growing season (SOG) and the end date of the growing season (EOG) in northern China during 1982 2012. To determine which climate factor was more influential on plant phenology, partial correlation analysis was applied to analyse the spatial difference between the response of SOG and EOG to temperature and precipitation. Finally, we calculated the temperature and precipitation sensitivities of the SOG and EOG. The results showed that: (1) SOG displayed an advancing trend in most regions, while EOG was delayed for all the vegetation types during 1982 2012. (2) SOG was mainly triggered by preseason temperature. The increase in temperature caused an overall advance in SOG. However, the relationship between SOG and precipitation varied among different vegetation types. Regarding EOG, precipitation had greater impacts than temperature in relatively arid environments, such as deserts, steppes and meadow biomes. (3) The response of vegetation phenology (both SOG and EOG) to temperature became stronger with increasing preseason precipitation across space. The response of EOG to precipitation became weaker from arid regions to relatively humid regions. These results provide a better understanding of the spatial pattern of the phenological response along the precipitation gradient and a reference for assessing impacts of future climate change on vegetation phenology, especially in transitional and fragile zones.

DOI

[32]
Wang G, Deng W, Yang Y et al., 2011. The advances, priority and developing trend of alpine ecology.Journal of Mountain Science, 29(2): 129-140. (in Chinese)The responses of alpine ecosystems to global change not only have serious impacts on the worldwide pattern and functions of terrestrial ecosystems,but also significantly restrict the sustainable development of human society.After indicating the importance and desires for studying the alpine ecology,the advances,priority and key science problems of alpine ecology were clarified in this study.Based on the description of the importance and eagerness for developing the alpine ecology in China,the current situation and issues in alpine ecology study were discussed.Due to the largest mountain country,to further develop and study the alpine ecology in China has an important implication for maintaining the safety of ecology and environment.

DOI

[33]
Wang Y, Tian Q, Huang Y, 2013. NDVI difference rate recognition model of deciduous broad-leaved forest based on HJ-CCD remote sensing data.Spectroscopy and Spectral Analysis, 33(4): 1018-1022. (in Chinese)The present paper takes Chuzhou in Anhui Province as the research area,and deciduous broad-leaved forest as the research object.Then it constructs the recognition model about deciduous broad-leaved forest was constructed using NDVI difference rate between leaf expansion and flowering and fruit-bearing,and the model was applied to HJ-CCD remote sensing image on April 1,2012 and May 4,2012.At last,the spatial distribution map of deciduous broad-leaved forest was extracted effectively,and the results of extraction were verified and evaluated.The result shows the validity of NDVI difference rate extraction method proposed in this paper and also verifies the applicability of using HJ-CCD data for vegetation classification and recognition.

DOI PMID

[34]
Xia H, Li A, Zhao W et al., 2015. Spatiotemporal variations of forest phenology in the Qinling zone based on remote sensing monitoring, 2001-2010.Progress in Geography, 34(10): 1297-1305. (in Chinese)植被物候是陆地生态系统对全球气候变化响应的最佳指示器,研究其时空变化对深入理解陆面水热过程、碳循环过程及预测陆地生态系统的时空变化具有重要意义。本文采用2001-2010年MODIS MOD09A1产品,通过引入MOD09A1的时间控制层DOY(Day of Year)提高EVI的时间精度;采用最大变化速率法和阈值法相结合提取秦岭森林物候期。结果表明,随着水热条件变化,由低海拔至高海拔,东南向西北,生长季始期(Start of Growth Season,SOG)逐渐推迟,集中在第81~120 d(即从3月下旬-4月末);生长季末期(End of Growth Season,EOG)逐渐提前,集中在第270~311 d(10月初-11月上旬);生长季长度(Length of Growth Season,LOG)逐渐缩短,集中在150~230 d。秦岭森林物候期与海拔关系密切,海拔每升高100 m,SOG推迟2 d,EOG提前1.9 d,LOG缩短3.9 d。2001-2010年,森林SOG提前、EOG延后和LOG延长主要分布于秦岭中高海拔区;SOG延后、EOG提前和LOG缩短主要分布在海拔1000 m以下部分区域。高海拔区物候的年际变化要比低海拔区复杂,2000 m以上区域SOG提前、EOG提前、LOG缩短。上述研究结果量化了不同海拔梯度森林的物候差异,揭示了近10年秦岭森林物候的时空格局,可为秦岭地区生态环境评价和保护提供科学依据。

DOI

[35]
Xia J, Chen J, Piao S et al., 2014. Terrestrial carbon cycle affected by non-uniform climate warming.Nature Geoscience, 7(3): 173-180.Feedbacks between the terrestrial carbon cycle and climate change could affect many ecosystem functions and services, such as food production, carbon sequestration and climate regulation. The rate of climate warming varies on diurnal and seasonal timescales. A synthesis of global air temperature data reveals a greater rate of warming in winter than in summer in northern mid and high latitudes, and the inverse pattern in some tropical regions. The data also reveal a decline in the diurnal temperature range over 51% of the global land area and an increase over only 13%, because night-time temperatures in most locations have risen faster than daytime temperatures. Analyses of satellite data, model simulations and in situ observations suggest that the impact of seasonal warming varies between regions. For example, spring warming has largely stimulated ecosystem productivity at latitudes between 30 and 90 N, but suppressed productivity in other regions. Contrasting impacts of day- and night-time warming on plant carbon gain and loss are apparent in many regions. We argue that ascertaining the effects of non-uniform climate warming on terrestrial ecosystems is a key challenge in carbon cycle research.

DOI

[36]
Xia J Y, Wan S Q, 2013. Independent effects of warming and nitrogen addition on plant phenology in the Inner Mongolian steppe.Annals of Botany, 111(6): 1207-1217.Phenology is one of most sensitive traits of plants in response to regional climate warming. Better understanding of the interactive effects between warming and other environmental change factors, such as increasing atmosphere nitrogen (N) deposition, is critical for projection of future plant phenology.A 4-year field experiment manipulating temperature and N has been conducted in a temperate steppe in northern China. Phenology, including flowering and fruiting date as well as reproductive duration, of eight plant species was monitored and calculated from 2006 to 2009.Across all the species and years, warming significantly advanced flowering and fruiting time by 064 and 072 d per season, respectively, which were mainly driven by the earliest species (Potentilla acaulis). Although N addition showed no impact on phenological times across the eight species, it significantly delayed flowering time of Heteropappus altaicus and fruiting time of Agropyron cristatum. The responses of flowering and fruiting times to warming or N addition are coupled, leading to no response of reproductive duration to warming or N addition for most species. Warming shortened reproductive duration of Potentilla bifurca but extended that of Allium bidentatum, whereas N addition shortened that of A. bidentatum. No interactive effect between warming and N addition was found on any phenological event. Such additive effects could be ascribed to the species-specific responses of plant phenology to warming and N addition.The results suggest that the warming response of plant phenology is larger in earlier than later flowering species in temperate grassland systems. The effects of warming and N addition on plant phenology are independent of each other. These findings can help to better understand and predict the response of plant phenology to climate warming concurrent with other global change driving factors.

DOI PMID

[37]
Xu Y, Dai J, Wang H et al., 2015. Variation characteristics of main phenophases of natural calendar and analysis of responses to climate change in Harbin in 1985-2012.Geographical Research, 34(9): 1662-1674. (in Chinese)According to the phenological data from Chinese Phenology Observation Network of Chinese Academy of Sciences, we compiled the natural calendar for 1985- 2012 with 21 plant species and 99 phenophases in Harbin, Heilongjiang Province. Comparing the calendar with the original one for 1963- 1984, the research revealed the variation characteristics of 99 phenophases. Correlation analysis and regression analysis were used to examine the relationships between changes of phenophases and climatic drivers. Since 1985, timing of phenological spring(represented by the timing of bud expansion of Ulmus pumila), summer(represented by the timing of 50% of full flowering of Syringa reticulate) and autumn(represented by the timing of fruit maturity of Lonicera maackii) have been advanced by 7days, 6 days and 19 days respectively, while timing of phenological winter(represented by the timing of end of leaf fall of Juglans mandshurica) has been delayed by 2 days. Meanwhile,compared with the original calendar, the average dates of phenophases have been advanced by3 to 11 days in spring, summer and autumn, but delayed by 3 days in winter. The earliest date of phenology showed advances mainly in all seasons, while the latest dates of phenology were delayed in summer and winter. The order of some phenophases in phenological seasons changed with different degrees. Temperature changes before the majority of phenophases is probably the main reason for the changes of phenological season in the last 30 years. Different sensibility of different species and phenophases may result in the change of phenophases order in seasons. The result that the phenological events in spring have been advanced in accordance with many other studies at home and abroad, showing the responses of ecosystems to a warming atmosphere.

[38]
Yu F, Zheng X, Gu X et al., 2008. Comparative study on spatial interpolation of climate elements precision in complex mountainous environment.Journal of Guizhou Meteorology, 32(3): 3-6. (in Chinese)

[39]
Zhang B, Yao Y, 2016. Implications of mass elevation effect for the altitudinal patterns of global ecology.Journal of Geographical Sciences, 26(7): 871-877.气候和植被的改变的高度的坡度由集体举起效果(MEE ) 是进一步复杂的,特别在高、广泛的山区域。然而,为山的这效果和它的含意高度的带一直不好直到最近学习了。这篇论文提供在过去的 5 年里执行的研究的概述。MEE 是几乎,山山岳和罐头的加热效果在在里面之间并且在一个山团外面的给定的举起上被定义为温度差别。它能数字地与 intra 山脉底举起(MBE ) 的三个因素被建模,纬度和测湿的陆性率;MBE 通常充当主要因素因为 MEE 并且,在很大程度上的大小能代表 MEE。MEE 比在山群众的外面在内部导致更高的 treelines。在 4800-4900 m 和 snowlines 成长在大约 6000 m 发展在做山区的森林南部的西藏的高原和中央安第斯山脉,和森林到的大区域在在世界的很多高山的 3500 m 上面实时。当考虑 MEE 时,全球 treelines 的高度的分发能与高精确被建模,结果证明 MEE 贡献大多数到 treeline 分发模式。没有 MEE,森林能仅仅发展对在生态的模式将多是的海水平和世界上面的大约 3500 m 最高更简单。MEE 的 quantification 应该进一步与更高的分辨率数据被改进,它的全球含意将进一步被表明。

DOI

[40]
Zhang C, Nan Y, Zhao Y, 2016. Study on vegetation classification based on multi-temporal HJ-1 CCD data: The Changbai Mountain area as a case.Geography and Geo-Information Science, 29(5): 41-44. (in Chinese)The Changbai Mountains area was selected as the research area to extract the information of vegetation coverage,applying unsupervised classification method based on data pre-processing and removal of cloud.In order to extract the information of vegetation coverage of Changbai Mountain,multi-temporal HJ-1CCD data were used in the research,and the extracted results had been verified by the way of precision test,and comparatively analyzed with the data of mono-temporal TM.The research shows that multi-temporal HJ-1CCD could extract the information of vegetation coverage rapidly and accurately,with overall accuracy of 84.67%and a Kappa coefficient of 0.82,which are higher than that of mono-temporal TM data.The multi-temporal HJ-1CCD is able to distinguish evergreen coniferous and deciduous coniferous with lower landscape fragmentation in the classification results.The study indicates that the dominated vegetation of Changbai Mountain is mixed coniferous accounting for40.84% of the total area.The vegetation of Changbai Mountain presents an overt distribution of vertical zonality with mixed coniferous mainly at the altitudes below 1 100m,evergreen coniferous mainly at the altitudes between 1 100mand 1 700m,meadow mainly at the altitudes between 1 700mand 2 000m,and alpine tundra mainly at the altitudes above 2 000m.

[41]
Zhang J, Wang Y, Zhu L et al., 2016. Study on change of northern subtropical border in mountainous regions in western Henan province.Journal of Henan University: Natural Science, 46(1): 40-49. (in Chinese)Based on the January average temperature during 1964 to 2013from 27 meteorological sites in the Yuxi Mountains and around,we built the spatial database of January average temperature by using space interpolation method-ANUSPLIN.Then,with ArcGIS10.0,we got January average temperature spatial distribution of the research area.At last,we extracted the 0 ℃ isothermal curve and examined the changes of the 0 ℃ isothermal curve in the Yuxi Mountains during the last 50 years.The changes of the 0 ℃isothermal curve represent the north boundary of subtropical zone.The results showed that:1In the 50 years,the January average temperature of study area showed a weak rising trend at a rate of about 0.0376℃/10 a,but during 1964-2004,the temperature tendency rate reached 0.233℃/10 a.2In the 50 years,the north boundary of subtropical zone of study area was fluctuating.The average altitude was 477.1m,and the altitudes of 5periods were 563.4 m,510.7 m,542.3 m,716.3 m,493.5m.3According to the 111°40′E longitude as a dividing line,the study area was divided into two sections-the east and the west.In west section,the north boundary of subtropical zone changed obviously along the vertical direction.During 1964-2003,the north boundary of subtropical zone rose by 152.9maveragely,but during 2004-2013,the height declined 222.8m.During the last 50 years,the north boundary of subtropical zone in study area declined 69.9m.In east section,the north boundary of subtropical zone fluctuated obviously along the longitude line.During 1964-2003,the north boundary of subtropical zone shifted northward by about 1.2latitudes,but during 2004-2013,shifted southward about 1.1latitudes.During the last 50 years,the north boundary of subtropical zone along the longitude line almost had no change.41986 was the mutations point that temperature rose more obviously,and we studyed the northern boundary of subtropical zone how to move before and after the mutations point in 1967-2007.The northern boundary of subtropical zone was raised by 165.5maveragely.In theeast,the northern boundary of subtropical zone shifted northward about 1.5latitudes,and the northernmost boundary has reached 35°N.

[42]
Zhang X, Friedl M C, Strahler A, 2004. Climate controls on vegetation phenological patterns in northern mid- and high latitudes inferred from MODIS data.Global Change Biology, 10(7): 1133-1145.Recent studies using both field measurements and satellite-derived-vegetation indices have demonstrated that global warming is influencing vegetation growth and phenology. To accurately predict the future response of vegetation to climate variation, a thorough understanding of vegetation phenological cycles and their relationship to temperature and precipitation is required. In this paper, vegetation phenological transition dates identified using data from the moderate-resolution imaging spectroradiometer (MODIS) in 2001 are linked with MODIS land surface temperature (LST) data from the northern hemisphere between 35°N and 70°N. The results show well-defined patterns dependent on latitude, in which vegetation greenup gradually migrates northward starting in March, and dormancy spreads southward from late September. Among natural vegetation land-cover types, the growing-season length for forests is strongly correlated with variation in mean annual LST. For urban areas, the onset of greenup is 4–9 days earlier on average, and the onset of dormancy is about 2–16 days later, relative to adjacent natural vegetation. This difference (especially for urban vs. forests) is apparently related to urban heat island effects that result in both the average spring temperature and the mean annual temperature in urban areas being about 1–3°C higher relative to rural areas. The results also indicate that urban heat island effects on vegetation phenology are stronger in North America than in Europe and Asia. Finally, the onset of forest greenup at continental scales can be effectively described using a thermal time-chilling model, which can be used to infer the delay or advance of greenup onset in relation to climatic warming at global scale.

DOI

[43]
Zhang X, Zhu W, Cui Y et al., 2016. The response of forest dynamics to hydro-thermal change in Funiu Mountain.Geographical Research, 35(6): 1029-1040. (in Chinese)The response of mountain ecosystem to global change is one of hot topics in the field of forest dynamics. As an important component of mountain ecosystems, to some degree,vegetation coverage change represents the change of land cover, and can provide indication to the global change. The result from the study on the relationship between climate change and forest coverage change within different vertical natural zones could enhance our understanding about the complexity and diversity of mountain ecosystem. It also can reveal the mechanism of mountain ecosystem changes. In recent years, many studies have been conducted to explore the relationship between mountain vegetation change and climatic factors, i.e., temperature,precipitation and so on. It should be noted that, the study area, Funiu Mountain is located at a transitional region between the north subtropical zone and warm temperate zone in China. The plant flora in the Funiu Mountain is complicated and very sensitive to the global climate change. In this study, the HJ-1 satellite data were used to extract forest cover types in the Funiu Mountain region. This paper adopted the S- G filtering algorithm to reconstruct the MODIS EVI(Enhanced Vegetation Index) time- series data form 2000 to 2013. Combined with the temperature with precipitation of the same study period, the response of different forest types to hydrothermal condition changes was analyzed based on the linear regression, correlation analysis, and ANUSPLIN interpolation. The results showed that:(1) the region of Funiu Mountain boasts high forest coverage, and mean EVI reached 0.48, which also showed a gradually ascending trend in recent 14 years. However, some variations were identified among different forest types. Broad- leaved deciduous forest, the dominant forest type in this region showed a noticeable growth trend.(2) There was an increasing trend in temperature in this region during the past 14 years. The increasing rate of temperature departure was about 0.27 /10 a, and the precipitation percentage displayed an ascending trend as well despite of fluctuations.(3) The correlation between EVI and temperature, and precipitation differed noticeably in different forest types. In particular, the evergreen broad-leaved forest showed the highest correlation between EVI and temperature, while the evergreen deciduous mixed forest had the least correlation. Almost all the forest coverage types showed a weak negative correlation between EVI and precipitation, except evergreen deciduous mixed forest, which displayed a weak positive correlation.(4) Generally speaking, the response lag in the mountain towards temperature and precipitation was not obvious, with half- a- month lag in evergreen deciduous mixed forest in some regions.

[44]
Zheng J, Ge Q, Hao Z et al., 2012. Changes of spring phenodate in Yangtze River Delta region in the past 150 years.Acta Geographica Sinica, 67(1): 45-52. (in Chinese)Based on phenological records extracted from Chinese historical dairies, the series of spring phenodate in the Yangtze River Delta region of China since 1834 is reconstructed. Together with the temperature and phenology observation data, the interpretation of the phenodate variation to temperature change is also analyzed. The results are shown as follows. (1) Spring phenology in the Yangtze River Delta region is gradually delayed during 1834-1893 and greatly advances after 1893; and exhibits inter-decadal fluctuation during 1900-1990 and greatly advances after 1990. The latest year of the spring phenodate is delayed by 27 days and occurs in 1893, while the earliest year is advanced by 17 days and occurs in 2007. (2) Correlation coefficient between spring phenodate in the Yangtze River Delta region and temperature (previous December to March and January to March) is higher significant up to the level at 99.9% with the value over -0.75 and -0.80, respectively. The variation of spring phenodate well indicates the change of temperature from previous winter to early spring, especially from January to March. These results will provide a data basis for the further study on temperature change reconstruction using multi-proxy data, including phenological records during historical times.

DOI

[45]
Zhou L, Tucker C J, Kaufmann R K et al., 2001. Variations in northern vegetation activity inferred from satellite data of vegetation index during 1981 to 1999.Journal of Geophysical Research Atmospheres, 106(D17): 20069-20084.

DOI

[46]
Zhu K, Wan M, 1999. Phenology. Changsha: Hunan Education Publishing House. (in Chinese)

[47]
Zhu L, Xu L, 2011. Analysis of effects of global change on terrestrial ecosystem. Areal Research and Development, 30(2): 161-164. (in Chinese)This paper introduces the facts of global change,e.g.,increasing of greenhouse gases concentration,climate warming,rising of sea level.On the basis of previous researches,proposed that global change is not only depended on physical variation,but also human activity is an important factor that can not be ignored,and also studied the effect of global change on grain production,husbandry,agricultural natural disasters,change of agroecosystem,forest ecosystem and biodiversity from hydro-thermal balance,climate change,rapid desertification and decrease of biodiversity,analyzed regional variation of global change's effect on terrestrial ecosystem,difference of terrestrial ecosystem's response to global change,and discussed the future situation and task of the research of global change's effects on terrestrial ecosystem.

[48]
Zhu Z, Piao S, Myneni R B et al., 2016. Greening of the earth and its drivers.Nature Climate Change, 6(8): 791-796.Global environmental change is rapidly altering the dynamics of terrestrial vegetation, with consequences for the functioning of the Earth system and provision of ecosystem services. Yet how global vegetation is responding to the changing environment is not well established. Here we use three long-term satellite leaf area index (LAI) records and ten global ecosystem models to investigate four key drivers of LAI trends during 1982 2009. We show a persistent and widespread increase of growing season integrated LAI (greening) over 25% to 50% of the global vegetated area, whereas less than 4% of the globe shows decreasing LAI (browning). Factorial simulations with multiple global ecosystem models suggest that CO2 fertilization effects explain 70% of the observed greening trend, followed by nitrogen deposition (9%), climate change (8%) and land cover change (LCC) (4%). CO2 fertilization effects explain most of the greening trends in the tropics, whereas climate change resulted in greening of the high latitudes and the Tibetan Plateau. LCC contributed most to the regional greening observed in southeast China and the eastern United States. The regional effects of unexplained factors suggest that the next generation of ecosystem models will need to explore the impacts of forest demography, differences in regional management intensities for cropland and pastures, and other emerging productivity constraints such as phosphorus availability.

DOI

[49]
Zu J, Yang J, 2016. Temporal variation of vegetation phenology in northeastern China.Acta Ecologica Sinica, 36(7): 2015-2023. (in Chinese)Climate change is a very important issue in the natural sciences,and has received much attention in various research fields. Vegetation phenology may be a good indicator of climate change at the regional or global scale,because of the close relationship between vegetation and climate. In this study,we analyzed the trend of vegetation phenology from1982 to 2006 and its driving climatic factors in northeastern China,which has experienced a rapid climate change in the past three decades partially due to its high latitude. We used a time series of 15-day averaged NDVI derived from the daily GIMMS AVHRR dataset to analyze the trend of vegetation phenology. We first used a Savitzky-Golay filter to reduce the noise in the NDVI curve to account for data contamination by random factors,then conducted a double logistic fitting to extract phonological parameters. To account for varied phenology responses to climate change among different vegetation types,we analyzed time series of those phonological parameters for the four major vegetation types in northeastern China,including broad-leaved forest,coniferous forest,steppe,and meadow. In addition,we performed a Partial Least Squares( PLS) regression to examine the relationship between vegetation phenology and climatic variables. Results showed that spring phenology exhibited an advancing trend followed by a delay for all four vegetation types,but different vegetation types had different turning points. In contrast,the autumn phenology was somewhat complicated with inconsistent patterns across the four vegetation types. Broad-leaved forest and coniferous forest had an overall delayed trend,but the other two typesshowed a delay-advancing-delay trend. During the study period of 25 years,the spring phenology advanced 11 days for meadow,7 days for coniferous forest,5 days for broad-leaved forest,and 3 days for steppe. Autumn phenology was delayed6 days for broad-leaved forest,4 days for coniferous forest,and 1 day for meadow,while the steppe showed an advance of 8days. Partial Least Squares( PLS) regressions indicated that spring temperature was negatively correlated with the spring phenology of broad-leaved forest,coniferous forest and meadow,while previous year winter temperature was positively correlated with the spring phenology of steppe. The relationship between precipitation and spring phenology was complex without any evident patterns. Except for steppe,the autumn phenology of all vegetation types had a negative correlation with summer precipitation. Spring phenology maybe mainly driven by temperature,while autumn phenology was mainly controlled by precipitation. Our study demonstrated strong effects of rapid climate warming on vegetation phenology in northeastern China,which may exert cascading influences on ecosystem processes and functions such as carbon sequestration and ecosystem productivity.

DOI

Outlines

/