Research Articles

Spatiotemporal characteristics of Qinghai Lakeice phenology between 2000 and 2016

  • QI Miaomiao ,
  • YAO Xiaojun , * ,
  • LI Xiaofeng ,
  • DUAN Hongyu ,
  • GAO Yongpeng ,
  • LIU Juan
Expand
  • College of Geography and Environment Sciences, Northwest Normal University, Lanzhou 730070, China
*Corresponding author: Yao Xiaojun (1980-), PhD and Associate Professor, specialized in research on GIS and cryospheric changes. E-mail:

Author: Qi Miaomiao (1993-), Masters Candidate, specialized in research on lake ice phenology. E-mail:

Received date: 2018-02-07

  Accepted date: 2018-03-28

  Online published: 2019-01-25

Supported by

Opening Foundation Project of the State Key Laboratory of Cryosphere Sciences, CAS, SKLCS-OP-2016-10

National Natural Science Foundation of China, No.41261016, No.41561016

Youth Scholar Scientific Capability Promoting Project of Northwest Normal University, No.NWNU-LKQN-14-4

Copyright

Journal of Geographical Sciences, All Rights Reserved

Abstract

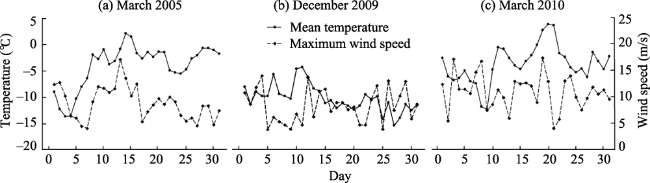
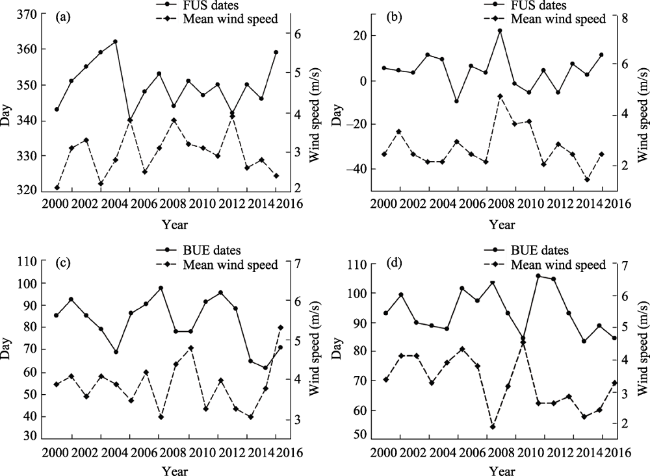
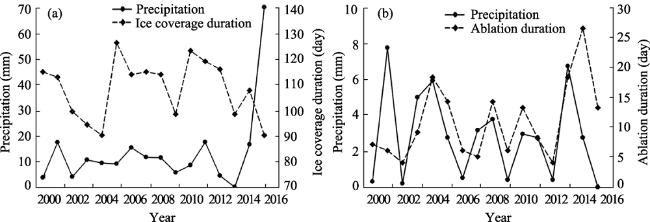
Lake ice phenology is considered a sensitive indicator of regional climate change. We utilized time series information of this kind extracted from a series of multi-source remote sensing (RS) datasets including the MOD09GQ surface reflectance product, Landsat TM/ETM+ images, and meteorological records to analyze spatiotemporal variations of ice phenology of Qinghai Lake between 2000 and 2016 applying both RS and GIS technology. We also identified the climatic factors that have influenced lake ice phenology over time and draw a number of conclusions. First, data show that freeze-up start (FUS), freeze-up end (FUE), break-up start (BUS), and break-up end (BUE) on Qinghai Lake usually occurred in mid-December, early January, mid-to-late March, and early April, respectively. The average freezing duration (FD, between FUE and BUE), complete freezing duration (CFD, between FUE and BUS), ice coverage duration (ICD, between FUS and BUE), and ablation duration (AD, between BUS and BUE) were 88 days, 77 days, 108 days and 10 days, respectively. Second, while the results of this analysis reveal considerable differences in ice phenology on Qinghai Lake between 2000 and 2016, there has been relatively little variation in FUS times. Data show that FUE dates had also tended to fluctuate over time, initially advancing and then being delayed, while the opposite was the case for BUS dates as these advanced between 2012 and 2016. Overall, there was a shortening trend of Qinghai Lake’s FD in two periods, 2000-2005 and 2010-2016, which was shorter than those seen on other lakes within the hinterland of the Tibetan Plateau. Third, Qinghai Lake can be characterized by similar spatial patterns in both freeze-up (FU) and break-up (BU) processes, as parts of the surface which freeze earlier also start to melt first, distinctly different from some other lakes on the Tibetan Plateau. A further feature of Qinghai Lake ice phenology is that FU duration (between 18 days and 31 days) is about 10 days longer than BU duration (between 7 days and 20 days). Fourth, data show that negative temperature accumulated during the winter half year (between October and the following April) also plays a dominant role in ice phenology variations of Qinghai Lake. Precipitation and wind speed both also exert direct influences on the formation and melting of lake ice cover and also cannot be neglected.

Cite this article

QI Miaomiao , YAO Xiaojun , LI Xiaofeng , DUAN Hongyu , GAO Yongpeng , LIU Juan . Spatiotemporal characteristics of Qinghai Lakeice phenology between 2000 and 2016[J]. Journal of Geographical Sciences, 2019 , 29(1) : 115 -130 . DOI: 10.1007/s11442-019-1587-0

1 Introduction

The global climate change has been profoundly influenced by both human development and survival and is one of the major challenges currently faced by the international community (Vaughan et al., 2013). It is well known that there is a strong link between climate change and the phenology of lake ice (Weber et al., 2016); as freeze-up and break-up durations accurately record changes in regional climate, lake ice phenology is considered to be a significant indicator of regional climate change (Johnson et al., 2006; Marszelewski et al., 2006; Qin, 2012; Benson et al., 2012; Vaughan et al., 2013). As lake ice is also an important component of the cryosphere, annual changes in this variable also influence the regional heat and energy balance and are also of important ecological and economic value (Weyhenmeyer et al., 2004; Duguay et al., 2006; Xin et al., 2008; Qin, 2012). The uplift of the Tibetan Plateau has also had a significant influence on the natural environmental evolution of the plateau and its adjacent areas, while regional climate change is known to be closely related to global climate change. Indeed, more local variations are often referred to as “the driver and amplifier of global climate change” (Pan, 1996). It is also the case that the Tibetan Plateau encompasses both the largest number of plateau lakes at the highest altitudes globally (Duguay et al., 2006); there are 1055 such lakes on the plateau that cover an area of 41,831.7 km2(Ma et al., 2011). As most areas on the Tibetan Plateau are inaccessible because of the harsh environment of this region, lakes are rarely influenced by human activities and largely remain in their natural states. This also means that the phenology of lake ice can be used as an accurate proxy for natural regional climate change. Analyses that address the spatiotemporal characteristics of lake ice phenology on the Tibetan Plateau in the context of global warming are therefore of great significance, not only to develop more accurate picture of these variations locally, but also to promote a deeper understanding of climate change in this region. The phenology of lake ice on the Tibetan Plateau has therefore attracted considerable national and international research attention in recent years (Kropáček et al., 2013).
At present, the research on the lake ice phenology has mostly extracted time and attribute parameters (Wei et al., 2010), which are usually collected using ground observations and remote sensing (RS) monitoring. The first of these approaches is high-precision but is also time-consuming and laborious, while RS monitoring can encompass a larger range of observations and has a higher update speed. These attributes compensate for the drawbacks inherent to ground-based observations including the potential use of artificial samples, weather stations, and other unevenly distributed data. As the development of RS techniques has enabled researchers to obtain lake ice phenology using automatic (or semi-automatic) approaches, this suite of methods has gradually become the most common for lake surface ice observations (Hall et al., 2002; Lenormand et al., 2002; Latifovic et al., 2007). Research around the world on lake ice phenology has so far mainly been carried out in central and northeastern North America and in northern Europe (Magnuson et al., 2000; Benson et al., 2012; Wang et al., 2012) and has focused on establishing datasets in this area, simulating the evolution of ice using mathematical models, and assessing the responses of these surfaces to global climate change (Wang et al., 2010; Dibike et al., 2012; Oveisy et al., 2014). Research in this area has therefore contributed important international data to the Intergovernmental Panel on Climate Change. In contrast, research on lake ice phenology within China has mainly focused on the great Tibetan Plateau lakes; previous research in this area has shown that reductions in lakefreezing durations on the Tibetan Plateau are due to delayed freeze-up times and the advance of break-up times (Che et al., 2009; Ke et al., 2013; Yao et al., 2015). One example, Qinghai Lake, is located at the junction between the East Asian and Indian monsoons and the westerlies (Ma et al., 2011) and so is very sensitive to climate change; the phenology of lake ice at this site has gradually attracted more and more attention from researchers. In early work, Chen et al. (1995) investigated changes in Qinghai Lake ice phenology using an inversion between 1958 and 1983 based on AVHRR satellite images, while Ying et al. (2005) later performed a water surface temperature inversion using EOS/MODIS satellite images to establish a monitoring model for this site. Che et al. (2009) developed a complete sequence for Qinghai Lake ice phenology between 1978 and 2006 using SSM/I data, revealed that ice cover duration has decreased by between 14 days and 15 days over this time, and showed that the date of ice break-up is most sensitive to changes in regional temperature. Although Cai et al. (2017) attempted to analyze ice phenology on Qinghai Lake between 1979 and 2016 using both SMMR and SSM/I data, the low spatial resolution and discontinuities in these data limited the extraction of relevant information. Thus, as the area of this lake is expanding and its water level is rising, it is increasingly important to determine how changes in the phenology of lake ice respond to climate change. We therefore established a series of Qinghai Lake ice phenology datasets for the period between 2000 and 2016 using both RS and GIS technology; these datasets enable us to provide references for winter tourism, lake navigation, and ice thickness inversionsas we analyze Qinghai Lake freeze-melt processes in detail.

2 Study area

Qinghai Lake (36.53°-37.25°N, 99.60°-100.78°E) is located on the northeastern Tibetan Plateau within the Tibetan Autonomous Prefecture of Hainan in Qinghai Province. This waterbody is the largest inland saltwater lake within China (Figure 1), and was formed as a result of a stratigraphic fault depression which means that its northwestern part is at a higher elevation than the southeastern. The Haixin Mountain and Three Stone islands are in the center of this lake, and the whole feature is surrounded by a series of sub-lakes, including Gahai, Haiyan Bay, and Shadao on the eastern shore and Erhai Lake on the southeastern margin. Data collected in 2013 shows that Qinghai Lake encompasses an area of 4294 km2 (Figure 1) and has an elevation of approximately 3200 m; this feature is slightly “convex” in overall shape, measuring about 109 km east-to-west and 65 km north-to-south with an average water depth of about 18.3 m. The water level of Qinghai Lake has been rising in recent years as the volume of glacial melt water from the Qilian Mountains has increased alongside precipitation within the Qinghai Lake Basin; these factors have also increased the area of the lake (Dong and Song, 2011; Wan et al., 2014). Measurements made over many years show that the lake basin is characterized by a cold and arid continental climate including a low annual temperature but large variations in daily average values that range between -1.4℃ and 1.7℃, gradually decreasing from southeast to northwest (Sun et al., 2007).Mean annual precipitation within the lake basin tends to be concentrated in the summer and is between 319 mm and 395 mm; these data also reveal that rainfall in the southwestern part of the basin is less than in the northeastern and that precipitation gradually is increasing from the center to the ambitus of the lake (Li et al., 2008). The major rivers that fed into the Qinghai Lake Basin include the Buha and Shaliu; these systems form an obviously asymmetric distribution such that the flow in the northwest is larger than that in the southeast. Alpine meadows and steppe are also widely distributed within the Qinghai Lake Basin; this region comprises an important biological center within the Tibetan Plateau because of an abundance of species and unique natural conditions, often referred to as the “Gene Pool of Tibetan Plateau”.
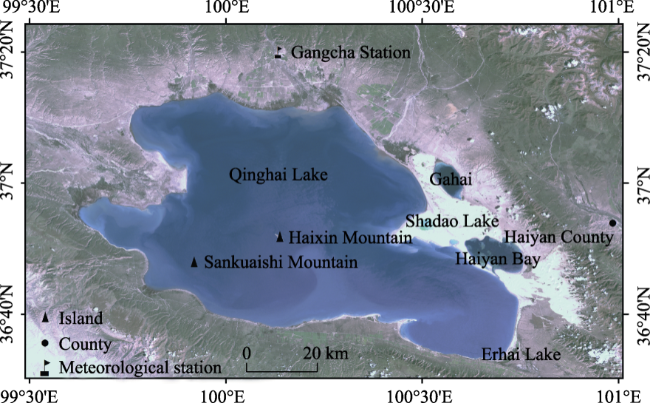
Figure 1 A Landsat TM image base map showing the study area discussed in this paper

3 Data and methods

3.1 Data

In order to accurately obtain data on the timing of Qinghai Lake ice formation and decay, MODIS MOD09GQ products at high temporal (one day) and moderate spatial resolutions (i.e., 250 m on bands 1 and 2 and 500 m on bands 3 and 4) were utilized in this study. A total of 12,410 scenes for the period between 2000 and 2016 were therefore downloaded from the website (https://data.giss.nasa.gov) of the National Aeronautics and Space Administration Land Surface Distributed Data Center and used to monitor Qinghai Lake freezing-ablation processes.We wrote a batch script in Python to perform geometric corrections of MODIS 1B data in order to deal with a large number of images, selected UTM projections and the WGS84 coordinate system, and calculated the area ratio between lake and ice by inputting multi-scene images. We statistically analyzed all images that were cloudless via visual interpretation one-by-one, focusing in particular on a series of 34 Landsat TM/ETM+ image scenes that had a spatial resolution of 30 m to verify the accuracy of lake ice phenology data extracted from MODIS MOD09GQ and Landsat data provided by the USGS and NASA (http://earthexplorer.usgs.gov).
In the absence of more widespread information, we utilized wind speed and temperature data collected at Gangcha meteorological station relatively close to Qinghai Lake as a reference for the regional climatic background. Because of the complexity of the Tibetan Plateau both in terms of terrain and changeable climate, we employed 0.5°×0.5° temperature and precipitation grid data as a supplement generated from observational records collected at all national meteorological stations and via a GTOPO30 digital elevation model. All these data were downloaded from the website of the Chinese Meteorological Information Center (http://data.cma.cn).

3.2 Automated lake ice extraction

Identifying lake ice using RS is dependent on the spectral characteristics of ice and water and is mainly assessed via artificial visual interpretation and use of the threshold and index methods (Reed et al., 2009; Choinski et al., 2010; Wei and Ye, 2010). The last of these, the index method, is an indirect approach that applies band calculations to distinguish the two, while the threshold method is more direct and synthetically takes into account reflectivity, temperature, the backward scattering coefficient, as well as other characteristics of lake ice and water. This approach can therefore provide a higher precision result by eliminating atmospheric influences and system errors (Wei and Ye, 2010). We therefore used the threshold method to extract lake ice phenology information in this study by defining a threshold between the red and near-infrared bands. The calculation equation used in this analysis is as follows (Yin and Yang, 2005):
$Results = \begin{cases}lake\ ice,\ \ if\ {\rho }_{red}-{\rho }_{NIR} > a and {{\rho }_{red}}>b \\{no\ lake\ ice,\ if\text{ }} {\rho }_{red}-{\rho }_{NIR}\ < a\ or {\rho }_{red}\ < b\\ \end{cases} (1)$
In this expression, ρredand ρNIR denote the reflectance of the red and near-infrared bands, respectively, and correspond with MODIS MOD09GQ Band 1 and Band 2. We combined with artificial visual interpretations and histogram distributions to determine appropriate thresholds using repeated human-computer interaction tests. Thus, two thresholds (a and b) were used to distinguish lake ice from surrounding water, 0.028 and 0.05, respectively.
The Landsat ETM+ and MODIS images presented in Figure 2 show the status of Qinghai Lake on February 22nd, 2014. These images estimated for ice cover area at this time of 4125.66 km2 (based on artificial visual interpretation of the Landsat ETM+ image) (Figure 2a) and 4092.17 km2 (using the threshold method applied to MODIS MOD09GQ data (Figure 2b). As the error of the latter estimate was only 0.8%, it is clear that the threshold method performed much better in this case.
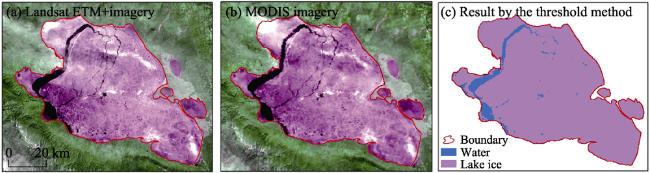
Figure 2 Images showing ice cover on Qinghai Lake on February 22nd, 2014

3.3 Automated identification of lake ice phenology

The ice coverage duration (ICD) over time period of this research was defined as the number of days between lake freeze-up start (FUS) and ice break-up end (BUE). Thus, ice ablation duration (AD) encompasses the period between break-up start (BUS) and BUE. As discrepancies exist in the definition of variables used to describe the duration of lake ice cover, comparisons between phenology records for different regions are often biased (Reed et al., 2009; Kropáček et al., 2013; Gou et al., 2015); we therefore used freezing duration (FD, between FUE and BUE) and complete freezing duration (CFD) to describe ice phenology on Qinghai Lake in this study. The former (FD) is defined as the time interval between lake freeze-up end (FUE) and ice BUE, while CFD refers to the time between lake FUE and ice BUS. As the lake generally freezes in the autumn or winter, and begins to melt during the following spring or summer each year (Che et al., 2009), these dates reflect changing trends in ice phenology. Thus, in order to accurately obtain the timing of formation and decay in ice cover, the freeze-up date was defined as the time point when ice cover is greater than, or equal to, 90% of lake area, while break-up date was defined as the time point when ice was less than, or equal to, 10% of total cover (Reed et al., 2009). These assumptions mean that lake ice phenology parameters could be automatically extracted, as follows:
$\text{Results}=\left\{ \begin{align} FUS,\text{ if }~IA\ge 0.1*LA & \\ FUE,\text{ if }~IA\ge 0.9*LA & \\ BUS,\text{ if }~IA\ge 0.9*LA & \\ BUE,\text{ if }~IA\ge 0.1*LA & \\ \end{align} \right.$ (2)
In this expression, LA and IA refer to lake and ice areas, respectively. IA value was calculated using GIS software from automatically extracted lake ice data (see above), while LA value was based on annual lake boundary results for the period between 2000 and 2016.

4 Results and discussion

4.1 Temporal characteristics of lake ice phenology

The ice phenology of Qinghai Lake between 2000 and 2016 are presented in Table 1. These data show that the temporal characteristics of lake ice phenology include a few diurnal scale inaccuracies for some years because of the influence of cloud cover; the maximum error over the period of this research was 3 days in the worst case. Dates for FUS were relatively concentrated over the study period, and mainly occurred in mid-December each year; while the average FUS date was December 16th each year (the 350th day of the year) this phenomenon occurred earliest on December 6th, 2005 (the 340th day of the year), and latest on December 28th, 2004 (the 362nd day of the year). The average time between FUS and FUE was about 20 days; the date of FUE was either at the end of December or in early January of the following year, while the average FUE date was January 5th (the 5th day of the year), and the earliest and latest FUE dates, respectively, occurred on December 23rd, 2005 (the 357th day of the year) and January 23rd, 2009 (the 23rd day of the year). Data show that BUE occurred in late March after two or three months CFD, the average BUS date was March 23rd (the 82nd day of the year), and the earliest and latest BUS dates, respectively, were on March 2nd, 2015 (the 62nd day of the year) and April 7th, 2008 (the 97th day of the year). The termination of lake ice break-up usually occurred between late March and early April within about ten days of AD, while the average BUE date was April 11th (the 93rd day of the year) with the earliest and latest dates occurring on March 24th, 2014 (the 83rd day of the year) and April 14th, 2011 (the 104th day of the year), respectively. Data also reveal considerable variation in the dates of both FD and CFD on Qinghai Lake between 2000 and 2016 as well as relatively little change in FUS times. The average lengths of FD and CFD recorded in this study were 88 days and 77 days, respectively; the longest FD was 108 days while the shortest was 69 days, and corresponding CFD values were 96 days and 55 days, respectively. It is noteworthy that the longest and shortest values for both FD and CFD were between 2010 and 2011 and between 2008 and 2009, respectively, while the average ICD for Qinghai Lake was 108 days between FUS and BUE. The longest ICD recorded was 125 days between 2005 and 2006, while the shortest was just 90 days between 2004 and 2005 and between 2015 and 2016. Data show an average AD of 10 days between BUS and BUE each year; the longest recorded AD was 26 days between 2014 and 2016, while the shortest was just four days between 2012 and 2013.
Table 1 Theice phenology of Qinghai Lake between 2000 and2016
Year FUS FUE BUS BUE ICD AD FD CFD
2000/2001 343 6* 85 92* 114 7 86 79
2001/2002 351 5 92* 98 112 6 93 87
2002/2003 355 4 85* 89* 99 4 85 81
2003/2004 359* 12 79* 88 94 9 76 67
2004/2005 362* 10 69* 87* 90 18 79 59
2005/2006 340 357 86* 100* 125 14 108 94
2006/2007 348 7 90* 96 113 6 89 83
2007/2008 353 4* 97* 102* 114 5 99 93
2008/2009 344 23* 78* 92 113 14 69 55
2009/2010 351 365 78 84* 98 6 84 78
2010/2011 347 361 91* 104 122 13 108 96
2011/2012 350 5* 95 103 118 8 98 90
2012/2013 342 361 88 92 115 4 97 92
2013/2014 350 8 65 83 98 18 75 57
2014/2015 346 3 62* 88* 107 26 85 59
2015/2016 359 12 71* 84* 90 13 72 59
Average 350 5 82 93 108 10 88 77
Range 22 31 35 21 35 22 39 41
Slope (d/a) -0.12 -0.08 -0.86 -0.29 -0.16 0.58 -0.22 -0.78

Notes: *, denotes error date (the maximum error in this study was 3 days); FUS, FUE, BUS, and BUE times are denoted in this table by the number of days in the year (e.g., December 9th is the 343rd day of the year).

4.2 Changes in lake ice phenology

The data collated in this study reveal significant variations of ice phenology on Qinghai Lake between 2000 and 2016, in particular relatively little change in the timing of FUS; this phenomenon usually occurred on the 350th day of the year apart from between 2003 and 2005 and between 2015 and 2016. Variation in FUE dates can be characterized by an initial advance in time followed by a subsequent trend towards delays with the largest variation recorded approximately one month. In contrast, BUS dates tended to show the opposite trend over the course of this study; the average BUS date recorded was the 85th day of the year subsequent to 2012 but fell on the 72nd day of the year prior to this point. Although the date of BUE fluctuated little between 2005 and 2012, this date advanced within the year between 2000 and 2005 apart from between 2001 and 2002) and between 2012 and 2016. Changes in ICD, FD, and CFD all remained basically consistent over the time period of this study; these dates all tended to initially extend within the year before falling back between 2005 and 2010, and gradually shortening in duration between 2000 and 2005 and between 2010 and 2016. Values for AD also tended to fluctuate over the course of this study, initially reducing in length before extending between 2000 and 2012. It is noteworthy that these values were always larger than average durations over the 17 years between 2012 and 2016 and they tended to advance in the year overall.
Although the results of this study are consistent with previous research, there are some differences. Trends of ice phenology in Qinghai Lake reported by Cai et al. (2016) are similar to those presented here, but the detailed dates recovered for FUS, FUE, BUS, and BUE vary for some years up to maximum differences of 9 days between 2008 and 2009), 19 days (between 2008 and 2009), 14 days (between 2014 and 2015), and 6 days (between 2006 and 2007), respectively, because of disparity in data sources and methods. Because Cai et al. (2016) used passive microwave SMMR and SSM/I data with low spatial resolution and the artificial visual interpretation method (their results are both difficult to verify and to some extent inconsistent due to the different experience of researcher). Data show that both the FD and CFD of Qinghai Lake have been shortened over time compared with other waterbodies on the Tibetan Plateau (Ke et al., 2013; Kropáèek et al., 2013; Yao et al., 2016); these changes were especially obvious subsequent to 2012 and are characterized by a lower rate of reduction than is the case for other high-altitude lakes in the plateau hinterland, including Nam Coand other examples in the Hoh Xil region. These results may be related to the geographical location of Qinghai Lake as well as other unique attributes such as its area, shape, water depth, and salinity.

4.3 Spatial characteristics of lake ice freeze and break processes

Spatial patterns in lake ice freeze-up and break-up can reflect differences in depth and salinity as revealed by the fact that ice begins to form in Nam Co and in the seven other lakes in the northern Hoh Xil region in shallow-water shoreline areas before gradually expanding into deep-water areas (Qu et al., 2012; Yao et al., 2016). The processes of ice freeze-up and break-up on Qinghai Lake follow a similar pattern; Figure 3 illustrates these changes between 2015 and 2016. Observations show that Qinghai Lake begins to freeze along its eastern edge close to Haiyan Bay (Figure 3a) before ice begins to form in the northeast and northwest; at the same time, lake ice gradually expands out from the shore into the center of this waterbody (Figures 3b, 3c and 3d) before a complete freeze is seen by around January 24th 2016 (Figure 3e). Observations show that the freezing process is relatively slow overall, and that the main component of Qinghai Lake ice has melted from the northeast and northwest by early March 2016 (Figures 3f and 3g); at the same time, ice is gradually ablated from the lakeshore to the center such that the bulk of surface coverage has completely melted (Figures 3h and 3i) by March 31st, 2016, at a faster speed compared to the freezing process. The spatial pattern of lake ice freeze-up was generally uniform over this period compared to break-up; in other words, the region in which ice first freezes also tends to be the region where it also melts first, a distinct difference from the patterns seen in Nam Co (Ke et al., 2013) and other lakes in the northern Hoh Xil region (Yao et al., 2016). Processes of lake freeze-up and ice break-up are known to be closely related to the spatial distribution of lake ice thickness (Zaikov, 1963), another key factor which should be taken into account, especially in the context of RS-based inversions of lake ice thickness and the future initiation of winter tourism on Qinghai Lake.
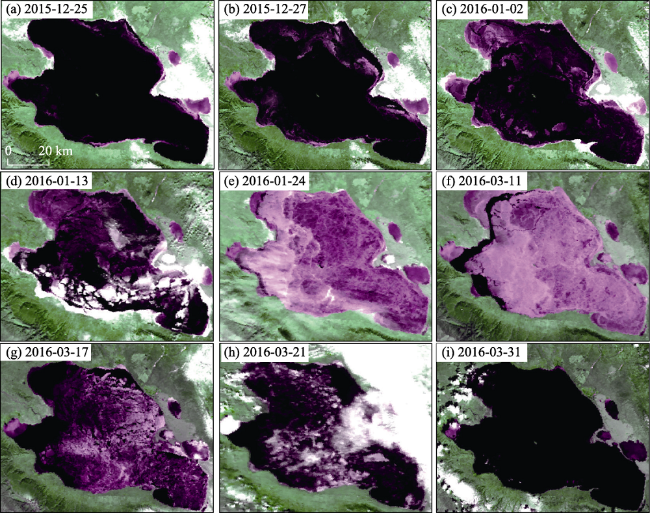
Figure 3 Images to illustrate freezing and melting processes on Qinghai Lake over time (the purple and white regions on these images are lake ice, while the black areas are water)
Observations show that the duration of lake freeze-up (between 18 days and 31 days) tends to be about 10 days longer than the duration of ice-break up (between 7 days and 20 days) overall (Figure 4). However, the lake freeze and break process were repeating and irregular in individual years. In one example, abnormal values for the ratio between ice and water areas were recorded on the 78th day of the year (Figure 4b) between 2004 and 2005; meteorological records (Figure 5a) for the same period show wind speeds of 8.8 m/s and 10.0 m/s on March 18th, 2005, and March 19th, 2005 (the 77th day of the year and the 78th day of the year), respectively, and reveal that temperatures began to decrease from March 18th 2005 onwards. We therefore conclude that abnormal values may have occurred in this year due to the re-freezing of already melted lake ice as temperatures suddenly dropped and wind speeds increased. This phenomenon was also seen between 2009 and 2010 when abnormal values for the area ratio of lake ice were recorded on the 359th day, including on the 362nd day in 2009 and on the 84th day in 2010 (Figure 4c); these discrepancies can be explained by either the re-melting (or re-freezing) of already melting (or frozen) lake ice due to fluctuations in temperature or wind speed (Figures 5b and 5c). In terms of physical freezing and ablation processes, ice crystals and new thin ice surfaces first appear initially in shallow water around the shore of Qinghai Lake. Observations show that wind also plays an important role in lake freeze-thaw processes to the exclusion of ice surface layer optical properties and the heat of bottom waterbodies.
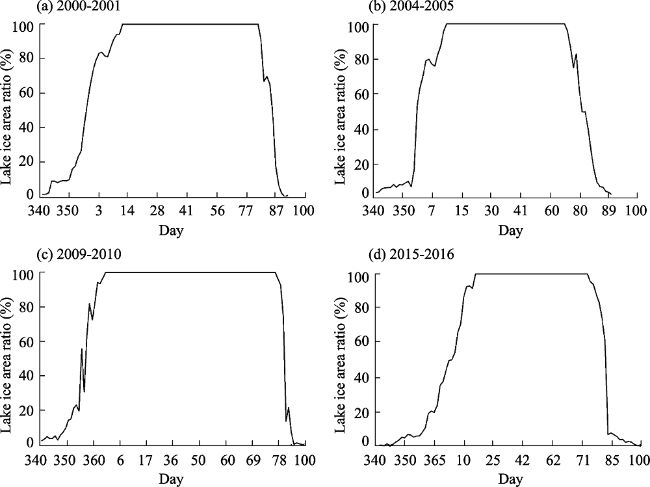
Figure 4 Qinghai Lake freeze-melt processes between 2000 and 2016
Figure 5 Daily variations in air temperature and wind speed measured at Gangcha meteorological station
As Qinghai Lake continues to cool, storms cause thinner ice to quickly crack and blow towards the shore as thin and transparent ice belts, called Shore Ice, form along the bank. The timing of continuous fixed ice formation along the margins of the lake is mainly related to the shape of the lakeshore and the local prevailing wind direction (Lei et al., 2011). Thus, as heat dissipation increases and fixed Shore Ice continues to form, this layer starts to extend out into the open water area of the lake; as the surface area of the open lake decreases, the formation of Shore Ice continues towards the center of the waterbody while the influence of surface wind is weakened and a continuous ice cap forms. The lake then starts to freeze in a stable fashion from the surface downwards via thermal conductivity if a constant low temperature is maintained and both ice thickness and freezing rate therefore also increase.As an ice cap forms, complete freezing of the lake is initiated even though this process is relatively slow and requires a sustained low temperature. Data show that the average temperature of Qinghai Lake remained continuously higher than 0℃ at the end of the March and into early April; at this point, the possibility of maintaining lake ice coverage is largely determined by existing heat storage within the waterbody. Lake ice subsequently begins to melt because of the influence of heat flow, while other key factors such as water level rise and wind driven ice layer breakup and increase of the contact surface area between the ice and the surrounding environment, accelerating the melting process (Duan et al., 2016; Weber et al., 2016). Observations show that wind speed and temperature at the water surface of Qinghai Lake gradually increase in March and April and also accelerate the melting process.

4.4 The influence of climatic factors on ice conditions

The data collated in this study reveal that the characteristics of lake ice phenology are influenced by both meteorological (e.g., temperature, solar radiation, humidity, and snow) and geographical (e.g., lake shape and location) factors. Observations show that temperature is the main factor underlying these changes over longer time scales (Dibike et al., 2012), an important result because the Tibetan Plateau is experiencing marked warming (Duan et al., 2016; You et al., 2016) at a significantly higher level than the average global rate (Kang et al., 2010). Data from 6 meteorological stations within the Qinghai Lake Basin also show that average temperature has risen significantly over the last 50 years (Sun et al., 2007); thus, changes in lake ice phenology provide a good indication of negative accumulated temperature over the course of the winter half year. In order to further discuss these changes, we defined the winter half year in the Qinghai Lake Basin as the time interval encompassing the period between October and April of the following year; as data show that daily average temperature over this time starts below 0℃ in mid-to-late October and then rises above this point in mid-April, we calculated the sum of daily mean temperatures below freezing throughout this period and used this value as negative accumulated temperature for the winter half year. We then analyzed correlations between accumulated negative temperature and the FD of Qinghai Lake between 2000 and 2016 (Figure 6); results show a negative correlation coefficient of -0.632 when a confidence level of 0.01 was applied. This implies that Qinghai Lake has a long FD when the level of negative accumulated temperature remains small during the winter half year and a short duration when the latter variable is large. Data show that the ice phenology of Qinghai Lake responds significantly to regional climate warming and that changes in FD are a good indication for temperature during the winter half year.
Figure 6 The relationship between winter half year negative accumulated temperature and the FD of Qinghai Lake ice between 2000 and 2016
Analysis of ice phenology on Qinghai Lake between 2000 and 2016 reveals clear correlations between the timing of FUS, FUE, BUS, BUE, and wind speed (Figure 7). As discussed above, we investigated these correlations by selecting average wind speeds that were measured during the week prior to lake freeze-up and break-up; the results of these comparisons reveal covariance values of -1.57, 0.57, -1.49, and -0.93 between the four wind speed time nodes and lake ice phenology, respectively. A non-zero covariance value indicates the presence of a correlation between two variables, while negative and positive signs are indicative of corresponding relationships according to the definition of covariance (Tao, 2014). Results show that average wind speed over a week exerts an important influence on variation in Qinghai Lake ice phenology and that onset of FUS was most sensitive to changes in regional speeds; data reveal that FUS advanced when the average wind speed during a week was larger and vice versa (Figure 7a). Higher speeds accelerate convection between the air and water surface during the initial stages of ice formation and cause the heat dissipation intensity of the lake to quickly reach freezing, promoting the formation of lake ice (Lei et al., 2011). Data also show that ice BUS date was most sensitive to changes in regional wind speeds (Figure 7c), especially between 2004 and 2015; this variable was also closely related to changes in mean wind speeds within a week which shows that when average speeds were larger, ice break-up started earlier and vice versa. Indeed, because larger wind speeds can more effectively mix the water surface and hotter deeper layers, this effect slows lake surface temperature reduction to freezing while also dynamically disturbing or destroying existing ice and accelerating break-up processes (You and Kang, 2016). Analyses also show that FUE and BUE dates were not very sensitive to mean wind speeds variations within a given week, but were very responsive to variation in this factor over different time periods. In particular, FUE date responded very significantly to changes in mean wind speeds between 2003 and 2008 and between 2011 and 2016; FUE dates shifted earlier when wind speeds increased over these periods (Figure 7b). Similarly, the BUE date proved more sensitive to changes in mean wind speed between 2007 and 2016; the dates shifted to earlier in the year when wind speeds were larger and vice versa (Figure 7d).
Figure 7 Graphs showing the relationship between mean weekly wind speed measured at Gangcha meteorological station and ice phenology on Qinghai Lake between 2000 and 2016
Changes in precipitation also play a key role in the formation and ablation of lake ice in addition to other weather conditions (e.g., air temperature and wind speed). We also analyzed correlations between timings of ICD, AD, and precipitation over the same time period as part of this study. This analysis yielded correlation coefficients of -0.31 and 0.36 for ICD and AD versus precipitation, respectively, and data that the latter exerted a different level of influence on the two former variables. These results show that ICD was shorter during years when precipitation was larger (Figure 8a) while AD was longer (Figure 8b) and vice versa; this is likely because the temperature of the water surface remained continuously below 0℃ between FUS and BUS while precipitation causes surface cooling and the development of crystal nuclei which are the basis of ice formation (Lei et al., 2011; Oveisy et al., 2014). As precipitation increased, ICD was shortened as faster nucleation accelerated the lake freezing process; however, the temperature of the water surface nevertheless remained lower between BUS and BUE because of increased precipitation and snowfall while the lake ice melting rate fell and ablation was prolonged.
Figure 8 Graphs showing the relationship between precipitation and ice variation (coverage and ablation) on Qinghai Lake between 2000 and 2016

5 Conclusions

The results of this study reveal spatiotemporal variations of ice phenology on Qinghai Lake and relationships with climatic variables between 2000 and 2016.
(1) The lake ice phenology datasets presented here for the period between 2000 and 2016 are based on MODIS MOD09GQ products. Comparisons suggest that FUS tended to occur in mid-December each year while BUS occurred in mid-to-late March of the following year. Data also show an average of 20 days between FUS and FUE with BUE occurring in early April. Average values for FD (between FUE and BUE), CFD (between FUE and BUS), ICD (between FUS and BUE), and AD (between BUS and BUE) were 88 days, 77 days, 108 days, and 10 days, respectively.
(2) Data reveal a great deal of diversity in the spatial characteristics of Qinghai Lake ice phenology between 2000 and 2016. The overall date of FUS changed relatively little over the time period of this study, while the dates of FUE and BUS trended in opposite directions. Results also show that the date for BUE between 2000 and 2005 (apart from between 2001 and 2002) and between 2012 and 2016 tended to advance within the year. Changes in ICD, FD, and CFD all remained basically consistent, these dates were initially advanced within the year but then fell back between 2005 and 2010. The durations of these periods also all gradually shortened between 2000 and 2005 and between 2010 and 2016, and AD has increased slightly over the last five years.
(3) Qinghai Lake is characterized by similar spatial patterns in freeze-up and break-up processes; observations show that ice begins to form from the eastern edge of the lake close to Haiyan Bay before the northeastern and northwestern sections of this waterbody start to freeze. At the same time, ice gradually expands out from the lakeshore into the center of lake and begins to melt from the northeast and northwest after77 days of CFD and is gradually ablated in the same direction. Observations show that areas of the water surface that froze earlier also started to melt first on Qinghai Lake, a distinct difference from other similar waterbodies on the Tibetan Plateau. An additional feature of Qinghai Lake ice phenology is that the duration of freeze-up (between 18 days and 31 days) is on average about ten days longer than the duration of break-up (between seven days and 20 days).
(4) The data presented in this study clearly show that the ice phenology of Qinghai Lake depends on a range of climatic factors. Winter negative accumulated temperature determines the length of lake FD, for example, Qinghai Lake is characterized by a long FD when winter half year negative accumulated temperature is smaller, while wind speeds and precipitation also exert significant effects on the formation and ablation of lake ice. Higher wind speeds can promote the formation of lake ice during early stages and can also accelerate melting at this time. The effect of precipitation on lake ice is most evident during years with high rainfall; lake ice coverage duration is shorter at these times while ablation durations are longer, and vice versa.

The authors have declared that no competing interests exist.

[1]
Benson B J, Magnuson J J, Jensen O P et al., 2012. Extreme events, trends, and variability in Northern Hemisphere lake ice phenology (1855-2005).Climatic Change, 112(2): 299-323.

DOI

[2]
Cai Y, Ke C Q, Duan Z, 2017. Monitoring ice variations in Qinghai Lake from 1979 to 2016 using passive microwave remote sensing data.Science of the Total Environment, 607: 120-131.Snow cover is one of the most important elements affecting regional and global water and energy cycle. This chapter mainly describes current snow cover mapping techniques with optical and active microwave remote sensing, respectively. The optical remote sensing of snow mapping methods is mainly on Moderate Resolution Imaging Spectroradiometer (MODIS) as a representative of moderate resolution... [Show full abstract]

DOI PMID

[3]
Che Tao, Li Xin, Jin Rui, 2009. Monitoring the frozen duration of Qinghai Lake using satellite passive microwave remote sensing low frequency data.Chinese Science Bulletin, 54(6): 787-791. (in Chinese)The Qinghai Lake is the largest inland lake in China. The significant difference of dielectric properties between water and ice suggests that a simple method of monitoring the Qinghai lake freeze-up and break-up dates using satellite passive microwave remote sensing data could be used. The freeze-up and break-up dates from the Qinghai Lake hydrological station and the MODIS L1B reflectance data were used to validate the passive microwave remote sensing results. The validation shows that passive microwave remote sensing data can accurately monitor the lake ice. Some uncertainty comes mainly from the revisit frequency of satellite overpass. The data from 1978 to 2006 show that lake ice duration is reduced by about 14 15 days. The freeze-up dates are about 4 days later and break-up dates about 10 days earlier. The regression analyses show that, at the 0.05 significance level, the correlations are 0.83, 0.66 and 0.89 between monthly mean air temperature (MMAT) and lake ice duration days, freeze-up dates, break-up dates, respectively. Therefore, inter-annual variations of the Qinghai Lake ice duration days can significantly reflect the regional climate variation.

DOI

[4]
Chen Xianzhang, Wang Guangyu, Li Wenjun et al., 1995. Lake ice and its remote sensing monitoring in the Tibetan Plateau.Journal of Glaciology and Geocryology, 17(3): 241-246. (in Chinese)The annual and interannual. changes of lake ice following the climatic changes were stu-died and the Qinghai Lake in Plateau was taken as an example in this paper.Lake ice condi-tion, change and relation with air temperature were analysed based on the observed data ofmeteorological stations.The lower the temperature,the thicker the ice;lake ice changes lagsbehind temperature's. The lake ice was monitored using NOAA/AVHRR data based on theimaging characteristics of lake ice, water and lake bank in the wavelengths of visible,nearinfrared and thennalinfrared from 1993 to 1994.The percentage of lake ice and the areawere caculated,and further analysis was made using observed data of meteorological station.

[5]
Choinski A, Kolendowicz L, Pociask K J et al., 2010. Changes in lake ice cover on the Morskie Oko Lake in Poland (1971-2007).Advances in Climate Change Research, 1(2): 71-75.Abstract On the basis of data from the period 1971–2007, and by applying trend analysis, a study on formation, disappearance and duration of lake ice cover on the Morskie Oko Lake in the Tatra Mountains in southern Poland was carried out. The results show decreasing trends in the maximum thickness of winter lake ice cover and in duration of lake ice phenomena, while air temperature recorded at the same period at the foot of the Tatra Mountains shows increasing trend. There are strong relationships between the course of lake ice phenomena and air temperature. Citation Choiński, A., L. Kolendowicz, J. Pociask-Karteczka, et al., 2010: Changes in lake ice cover on the Morskie Oko Lake in Poland (1971–2007). Adv. Clim. Change Res.,1, doi: 10.3724/SP.J.1248.2010.00071.

DOI

[6]
Dibike Y, Prowse T, Bonsal B et al., 2012. Simulation of North American lake-ice cover characteristics under contemporary and future climate conditions.International Journal of Climatology, 32(5): 695-709.Freshwater ice plays an important role in physical, biological, and chemical processes affecting cold-region lakes. To examine the potential magnitude of climate-change-related impacts in ice-cover characteristics, particularly its formation, duration, breakup, thickness, and structural composition over North America, this study employs a one-dimensional, process-based, lake simulation model, ‘MyLake’ (Multi-year simulation model for Lake thermo- and phytoplankton dynamics). The model is first calibrated and validated for Baker Lake, Nunavut, Canada, and then used to simulate patterns of ice conditions using a set of hypothetical lakes of varying depth (5, 20, and 40 m) located at a 2° latitude/longitude grid pattern for the major cold-region portion of North America between 40 and 75° latitude. The model is driven by gridded atmospheric forcing data from the North American Regional Reanalysis (NARR) and the Canadian Regional Climate Model (CRCM) with projections of future climate corresponding to the SRES A2 emissions scenario. The NARR-based simulation results for the period 1979–2006 are consistent with observations of lake-ice thickness and phenology obtained from the Canadian Ice Database. The CRCM-based lake-ice simulation results for the baseline (1961–1990) and future (2041–2070) time periods indicate that projected air-temperature warming will advance break-up by 10–20 days and delay freeze-up by 5–15 days, thereby reducing lake-ice duration by about 15–35 days. Lake depth is also found to have significant influence on lake-ice freeze-up dates and maximum thicknesses but not on the break-up dates. Such changes are accompanied by a reduction in ice thickness of 10–30 cm. Cover composition is also altered as a result of changes in ice thickness and snow loading resulting in somewhat greater thicknesses of white-ice (1–5 cm) over most areas except towards the east and west coasts, as well as more southerly latitudes where it slightly decreased. Implications of such cover changes are also discussed. Copyright 08 2011 Royal Meteorological Society and Crown in the right of Canada.

DOI

[7]
Dong H M, Song Y G, 2011. Shrinkage history of Lake Qinghai and causes during the last 52 years. In: International Symposium on Water Resource & Environmental Protection (ISWREP), 446-449.Lake Qinghai is the largest saline inland lake in China, and plays an important role on semi-arid ecosystem in Lake Qinghai basin, however, the lake has shrunk significantly during the last century. This study investigates water level and area changes of Lake Qinghai. The lake level and area decreased at the average rate of 5.28 cm/a and 4.38 km2/a, respectively, between 1959 and 2010. However, the lake area and level have increased slightly since 2004. The trend of warming climate in recent decades maybe the main reasons for the lake shrinkage, and human activities have little effect on it.

DOI

[8]
Duan Anmin, Xiao Zhixiang, Wu Guoxiong, 2016. Characteristics of climate change over the Tibetan Plateau under global warming during 1979-2014.Progressus Inquisitiones De Mutatione Climatis, 12(5): 374-381. (in Chinese)Global warming has been a hot issue during recent decades,while the global warming hiatus since1998 was detected as documented by many papers,meanwhile the Tibetan Plateau(TP) experiencing a rapid warming process.Based on previous studies,this paper mainly reviews the TP climate change under the global warming in four aspects:temperature,snow cover,precipitation and atmospheric apparent heat source,and points out that the accelerated warming over the TP results in the retreat of snow cover accompanied by the increase of precipitation.Though the TP heat source has been declined in recent decades whether based on observation or reanalysis datasets.it shows large uncertainties.

[9]
Duguay C R, Prowse T D, Bonsal B R et al., 2006. Recent trends in Canadian lake ice cover.Hydrological Processes, 20(4): 781-801.Recent studies have shown that ice duration in lakes and rivers over the Northern Hemisphere has decreased over the 19th and 20th centuries in response to global warming. However, lake ice trends have not been well documented in Canada. Because of its size, considerable variability may exist in both freeze-up and break-up dates across the country. In this paper, results of the analysis of recent trends (1951-2000) in freeze-up and break-up dates across Canada are presented. Trends toward earlier break-up dates are observed for most lakes during the time periods of analysis which encompass the 1990s. Freeze-up dates, on the other hand, show few significant trends and a low degree of temporal coherence when compared with break-up dates. These results are compared with trends in autumn and spring 0 00°C isotherm dates over the time period 1966-95. Similar spatial and temporal patterns are observed, with generally significant trends toward earlier springs/break-up dates over most of western Canada and little change in isotherm and freeze-up dates over the majority of the country in autumn. Strong correlations ( r > 000·5) between 0 00°C isotherm dates and freeze-up/break-up dates at many locations across the country reveal the high synchrony of these variables. These results are also consistent with more recent observations of other cryospheric and atmospheric variables that indicate, in particular, a general trend toward earlier springs in the latter part of the 20th century. The results of this study provide further evidence of the robustness of lake ice as a proxy indicator of climate variability and change. Copyright 0008 2006 John Wiley & Sons, Ltd.

DOI

[10]
Gou Peng, Ye Qinghua, Wei Qiufang, 2015. Lake ice change at the Namco Lake on the Tibetan Plateau during 2000-2013 and influencing factors.Progress in Geography, 34(10): 1241-1249. (in Chinese)湖冰物候事件是气候变化的敏感指示器。本文以西藏纳木错湖为研究对象,基于MODIS多光谱反射率产品数据监测了2000-2013年纳木错湖冰冻融日期,并结合多个气象站点的气象数据和实测湖面温度、湖面辐射亮温分析验证了湖冰变化的原因。纳木错湖冰变化较好地响应了区域气候变暖:开始冻结日期延迟和完全消融日期提前使湖冰存在期显著缩短(2.8 d/a)、湖冰冻结期增长、湖冰消融期缩短,其中消融期变化最为明显,平均每年缩短3.1 d。湖冰冻融日期的变化表明:2000年后纳木错湖冰冻结困难,消融加速,稳定性减弱。纳木错湖冰变化主要受湖面温度、湖面辐射亮温和气温变化的影响,它们可以作为气象因子来解释区域气候变化。

DOI

[11]
Hall D K, Riggs G A, 2002. MODIS snow-cover products.Remote Sensing of Environment, 83(1): 181-194.

DOI

[12]
Johnson S L, Stefan H G, 2006. Indicators of climate warming in Minnesota: Lake ice covers and snowmelt runoff. Climate Change, 75(4): 421-453.Records of hydrologic parameters, especially those parameters that are directly linked to air temperature, were analyzed to find indicators of recent climate warming in Minnesota, USA. Minnesota is projected to be vulnerable to climate change because of its location in the northern temperate zone of the globe. Ice-out and ice-in dates on lakes, spring (snowmelt) runoff timing, spring discharge values in streams, and stream water temperatures recorded up to the year 2002 were selected for study. The analysis was conducted by inspection of 10-year moving averages, linear regression on complete and on partial records, and by ranking and sorting of events. Moving averages were used for illustrative purposes only. All statistics were computed on annual data.All parameters examined show trends, and sometimes quite variable trends, over different periods of the record. With the exception of spring stream flow rates the trends of all parameters examined point toward a warming climate in Minnesota over the last two or three decades. Although hidden among strong variability from year to year, ice-out dates on 73 lakes have been shifting to an earlier date at a rate of 610.13 days/year from 1965 to 2002, while ice-in dates on 34 lakes have been delayed by 0.75 days/year from 1979 to 2002. From 1990 to 2002 the rates of change increased to 610.25 days/year for ice-out and 1.44 days/year for ice-in. Trend analyses also show that spring runoff at 21 stream gaging sites examined occurs earlier. From 1964 to 2002 the first spring runoff (due to snowmelt) has occurred 610.30 days/year earlier and the first spring peak runoff 610.23 days/year earlier. The stream water temperature records from 15 sites in the Minneapolis/St Paul metropolitan area shows warming by 0.11 66 C/year, on the average, from 1977 to 2002. Urban development may have had a strong influence. The analysis of spring stream flow rates was inconclusive, probably because runoff is linked as much to precipitation and land use as to air temperature.Ranking and sorting of annual data shows that a disproportionately large number of early lake ice-out dates has occurred after 1985, but also between 1940 and 1950; similarly late lake ice-in has occurred more frequently since about 1990. Ranking and sorting of first spring runoff dates also gave evidence of earlier occurrences, i.e. climate warming in late winter.A relationship of changes in hydrologic parameters with trends in air temperature records was demonstrated. Ice-out dates were shown to correlate most strongly with average March air temperatures shifting by 612.0 days for a 1 ° C increase in March air temperature. Spring runoff dates also show a relationship with March air temperatures; spring runoff dates shift at a rate of 612.5 days/1 ° C minimum March air temperature change. Water temperatures at seven river sites in the Minneapolis/St Paul metropolitan area show an average rise of 0.46 ° C in river temperature/1 ° C mean annual air temperature change, but this rate of change probably includes effects of urban development.In conclusion, records of five hydrologic parameters that are closely linked to air temperature show a trend that suggests recent climate warming in Minnesota, and especially from 1990 to 2002. The recent rates of change calculated from the records are very noteworthy, but must not be used to project future parameter values, since trends cannot continue indefinitely, and trend reversals can be seen in some of the long-term records.

DOI

[13]
Kang S C, Xu Y W, You Q L et al., 2010. Review of climate and cryospheric change on the Tibetan Plateau.Environmental Research Letters, 5(1): 015101. Doi: 10.1088/1748-9326/5/1/015101.

DOI

[14]
Ke C Q, Tao A Q, Jin X, 2013. Variability in the ice phenology of Nam Co Lake in central Tibet from scanning multichannel microwave radiometer and special sensor microwave/imager: 1978 to 2013.Journal of Applied Remote Sensing, 7(1): 073477. doi: 10.1117/1.JRS.7.073477.We used 35 years of brightness temperature data (1978 to 2013) from the scanning multichannel microwave radiometer (SMMR) and special sensor microwave/imager (SSM/I) to analyze the freezing, ablation, and duration time of ice on Nam Co Lake and validated the results using data from the advanced microwave scanning radiometer for Earth observation system and moderate resolution image spectroradiometer. The results indicate that the SMMR and SSM/I data can be applied to monitor lake ice phenology variability for a long time and the results are reliable. Since 1978, the duration of Nam Co lake ice has decreased by 19 to 20 days, with the freezing onset date delayed by 9 days and the ablation date advanced by 9 to 10 days. Between 1978 and 2010, there was a negative correlation between temperature and the duration of lake ice in Nam Co; after 2000, the temperature increased significantly in the Nam Co Basin. This caused a clear downward trend of lake ice duration. Therefore, the freezing onset date, ablation end date, and duration of lake ice are effective indicators of regional climate change.

DOI

[15]
Kropáček J, Maussion F, Chen F et al., 2013. Analysis of ice phenology of lakes on the Tibetan Plateau from MODIS data.Cryosphere, 7(1): 287-301.

DOI

[16]
Latifovic R, Pouliot D, 2007. Analysis of climate change impacts on lake ice phenology in Canada using the historical satellite data record.Remote Sensing of Environment, 106(4): 492-507.Variability and trends in lake ice dynamics (i.e. lake ice phenology) are related to climate conditions. Climate influences the timing of lake ice melt and freeze onset, ice duration, and lake thermal dynamics that feedback to the climate system initiating further change. Phenology records acquired in a consistent manner and over long time periods are required to better understand variability and change in climate conditions and how changes impact lake processes. In this study, we present a new technique for extracting lake ice phenology events from historical satellite records acquired by the series of Advanced Very High Resolution Radiometer (AVHRR) sensors. The technique was used to extend existing in-situ measurements for 36 Canadian lakes and to develop records for 6 lakes in Canada's far north. Comparison of phenology events obtained from the AVHRR record and in-situ measurements show strong agreement (20 lakes, 180 cases) suggesting, with high confidence especially in the case of break-up dates, the use of these data as a complement to ground observations. Trend analysis performed using the combined in-situ and AVHRR record 65021950–2004 shows earlier break-up (average — 0.1802days/year) and later freeze-up (average 0.1202days/year) for the majority of lakes analyzed. Less confidence is given to freeze-up date results due to lower sun elevation during this period making extraction more difficult. Trends for the 2002year record in the far north showed earlier break-up (average 0.9902days/year) and later freeze-up (average 0.7602days/year). The established lake ice phenology database from the historical AVHRR image archive for the period from 1985 to 2004 will to a certain degree fill data gaps in the Canadian in-situ observation network. Furthermore, the presented extraction procedure is not sensor specific and will enable continual data update using all available satellite data provided from sensors such as NOAA/AVHRR, MetOp/AVHRR, MODIS, MERIS and SPOT/VGT.

DOI

[17]
Lei Ruibo, Li Zhijun, Zhang Zhanhai et al., 2011. Comparisons of thermodynamic processes between lake ice and landfast sea ice around Zhongshan Station, East Antarctica.Chinese Journal of Polar Research, 23(4): 289-298. (in Chinese)Thermodynamic processes of lake ice in three lakes and landfast sea ice around Zhongshan Station,east Antarctica were investigated in 2006.The growth and decay processes of lake ice were compared with those of landfast sea ice on the basis of in situ data.The responses of lake-ice and landfast sea-ice temperatures at varying depths relative to the time series of the local surface air temperature were explored.The vertical conductive heat fluxes at varying depths of lake ice and sea ice were derived from the vertical ice temperature profiles.The freeze-up of lake ice and landfast sea ice occurred from late February to early March.The maximum lake-ice thicknesses occurred from late September to early October,with values of 156 177 cm.The maximum sea-ice thicknesses occurred later,from late October to late November,with values of 167 174 cm.The temporal variations in internal temperatures for both lake ice and landfast sea ice lagged those of local surface air temperatures.The high-frequency fluctuation of the local surface air temperature was evidently attenuated by ice cover.The temporal lag and the high-frequency attenuation were greater for sea ice than for lake ice,and more distinct for the lower ice layer than for the upper ice layer,which induced less conductive heat flux for sea ice than for lake ice,and less fluctuation in the conductive heat flux for the lower ice layer than for the upper ice layer.The enhanced desalination during the melt season consequently led to higher melt point temperature for sea ice,than for fresh-lake ice.

DOI

[18]
Lenormand F, Duguay C R, Gauthier R, 2002. Development of a historical ice database for the study of climate change in Canada.Hydrological Processes, 16(18): 3707-3722.The Canadian government has been compiling various observations on freshwater and coastal sea ice conditions for many years. However, the records are not easily accessible and are dispersed within different government departments. Given this, a major effort was undertaken in order to gather all available observations into a common database - the Canadian Ice Database (CID). This database will respond to the needs for climate monitoring in Canada, the validation and improvement of numerical ice models and the development of new remote-sensing methods. Indeed, several studies have shown that freshwater ice and sea ice are good proxy indicators of climate variability and change.The first version of CID contains in situ observations from 757 sites distributed across Canada, which were originally kept on digital or paper records at the Meteorological Service of Canada Headquarters and the Canadian Ice Service (CIS). The CID holds 63 546 records covering the period from ice season 1822-23 to 2000-01. An analysis of the database allows one to trace the temporal evolution of the ice networks. The freeze-up/break-up network of 2000-01 only represents 4% of what it was in 1985-86. A drastic decline of the ice thickness and the snow on ice network is also observable. In 1997-98, it represented only 10% of the network that existed in 1984-85. The major budget cuts in Canadian government agencies during the late 1980s and the 1990s offer the most plausible explanation for the drastic decline in the ice observation networks. Weekly ice coverage determination on large lakes from satellite imagery by the CIS and the national volunteer ice monitoring program, IceWatch, may provide a means of reviving, at least, the freeze-up/break-up network.

DOI

[19]
Li Fengxia, Fu Yang, Yang Qing et al., 2008. Climate change and its environmental effects in the surrounding area of Qinghai Lake.Resources Sciences, 30(3): 348-353. (in Chinese)Through quantitative analysis of annual mean temperature,annual precipitation,annual evaporation amount,wind speed,windy days,grassland change,lake transition and land desertification trend in recent 44 years in the surrounding area of Qinghai Lake,this paper reveals the effects of regional ecological environment resulted from climate change.1) During the last 44 years,annual and seasonal mean temperatures(at the speed of 0.262 /10a) represent a trend of evident increase.Annual precipitation decreased 3.8% in the 1960s and 5.2% in the 1970s,but increased by 1.37mm/10a in the 1980s,reaching the average value in the 1990s and beginning of 21st century.Annual evaporation amounts in spring, summer and winter reduced with a rate of 66.53mm/10a.Average wind speed decreased with a rate of 0.01(m/s)/10a,while windy days decreased with a rate of 4.5 d/10a;2) The regional forage biomass and precipitation is positively correlated.Significant increase of temperature and strong variation of seasonal precipitation affected the forage's growth period,and posed a fluctuation of pasture biomass;3) Coverage area of water in Qinghai Lake is significantly negatively correlated with annual mean temperature and seasonal temperatures in autumn and winter,while positively correlated with water surface evaporation of the lake.During the 1960s and the 1970s,a positive correlation existed between water coverage area of the lake and spring precipitation.Since the 1990s,with the warming of climate,the temperature has been playing a dominant role on the impact of the water coverage area of Qinghai Lake;4) Warming and drying climate in the surrounding area of Qinghai Lake is the dominant factor that resulted in rapid development of desertification.

DOI

[20]
Ma R, Yang G, Duan H et al., 2011. China’s lakes at present: Number, area and spatial distribution.Science China Earth Sciences, 54(2): 283-289.

DOI

[21]
Ma Yuwei, Zhang Jingran, Liu Xiangjun et al., 2011. Lake level fluctuations in Qinghai Lake since the Last Deglaciation.Journal of Salt Lake Research, 19(3): 19-25. (in Chinese)Qinghai Lake,on the northeastern Qinghai Tibetan Plateau,is China's largest extant closed-basin lake. Its proximity to the junction of three major climate systems(the East Asian monsoon,the Indian monsoon,and the Westerly) makes it one of the most sensitive regions to palaeoenvironmental changes and it has been the subject of numerous lake level fluctuations investigations,most involving climatic proxies derived from sediment cores, lacustrine terrace and alluvium overlying ripple laminated,shoreline deposits.However,due to different dating methods and different dating materials,controversies still exist regarding to the timing of the high lake levels since the Last Deglaciation.In the present paper,the anthors built a curve about lake level fiuctuations since the Last Deglaciation based on previous research and the record of 未18O in the core QH-2000.Between 14~12 ka BP,the elevation was 12.3 m higher than today(3 193.4 m);12~10 ka BP,the lake level dropped sharply to about 3 165m;10~9 ka BP, the lake level began to rise,but not exceeding 3 173 m;9~6 ka BP,the lake level was relatively stable at about 3 213 m;6~4 ka BP,the lake level may droped below the modern lake;4~1 ka BP,the lake level was relative stable at about 3 193.7 m;and from 1 ka BP to now,the lake level showed a declining trendency.

DOI

[22]
Magnuson J J, Robertson D M, Benson B J et al., 2000. Historical trends in lake and river ice cover in the Northern Hemisphere.Nature, 289(5485): 1743-1746.Freeze and breakup dates of ice on lakes and rivers provide consistent evidence of later freezing and earlier breakup around the Northern Hemisphere from 1846 to 1995. Over these 150 years, changes in freeze dates averaged 5.8 days per 100 years later, and changes in breakup dates averaged 6.5 days per 100 years earlier; these translate to increasing air temperatures of about 1.2 C per 100 years. Interannual variability in both freeze and breakup dates has increased since 1950. A few longer time series reveal reduced ice cover (a warming trend) beginning as early as the 16th century, with increasing rates of change after about 1850.

DOI PMID

[23]
Marszelewski W, Skowron R, 2006. Ice cover as an indicator of winter air temperature changes: Case study of the Polish Lowland lakes. Hydrological Sciences Journal, 51(2): 336-349.Observations of ice cover and winter air temperature measurements were carried out on six lakes in northern Poland during the period 19610900092000. Detailed analyses of the dates of formation and termination of the ice cover, the duration of maximum thickness and ice-free period during winter were carried out. Various tendencies were found in the time series of the earliest freeze-up dates, whereas the latest ice break-up dates were recorded to occur much earlier than in the past on all the lakes, with time advance being on average from 0.6 to 0.8 day year0908081. The period with ice cover has been getting shorter at the rate of 0.8 to 0.9 day year0908081, with the exception of Lake Ha01±cza, the deepest lake in the European Lowland, where the rate of 0.4 day year0908081 was recorded. Similarly, there was a decreasing tendency in the maximum thickness of the ice cover, at the rate of 0.26 to 0.60 cm year0908081. Despite similar tendencies, all those changes showed diverse dynamics in particular lakes. The proposed indicator of the ice cover stability confirms the above statements, and thus, the undergoing climatic changes.

DOI

[24]
Oveisy A, Boegman L, Imberger J, 2014. One-dimensional simulation of lake and ice dynamics during winter.Journal of Limnology, 73(3): 43-57.lt;br /><div>An ice formation model, based on the solution of the heat conduction equation across blue ice, white ice and snow cover, is integrated into the Dynamic Reservoir Simulation Model (DYRESM) to allow for one-dimensional (vertical) winter simulation of lake dynamics during periods of ice cover. This is an extension of a previous three-layer snow and ice model to include two-way coupling between the ice and the water column. The process-based ice formation is suitable for application to mid-latitude regions and includes: snowmelt due to rain; formation of white ice; and variability in snow density, snow conductivity, and ice and snow albedo. The model was validated against published observations from Harmon lake, British Columbia, and new observations from Eagle lake, Ontario. The ice thickness and water column temperature profile beneath the ice were predicted with Root Mean Square Deviations (RMSD) of 1 cm and 0.38??C, respectively, during the winter of 1990-91in Harmon lake. In Eagle lake the 2011-12 year-round water column temperature profile was predicted with an RMSD of 1.8??C. Improved prediction of under-ice lake temperature, relative to published results from simpler models, demonstrates the need for models that accurately capture ice-formation processes, including ice to water column coupling, formation of both blue and white ice layers, and process-based ice and snow parameters (density, conductivity and albedo).

DOI

[25]
Pan Baotian, Li Jijun.Qinghai-Tibetan Plateau: A driver and amplifier of the global climatic change III. The effects of the uplift of Tibetan Plateau on climate changes.Journal of Lanzhou University (Natural Sciences), 1996, 32(1): 108-115. (in Chinese)

[26]
Qin Dahe.Climate and Environment Change in China: 2012 Comprehensive Volume. Beijing: China Meteorological Press, 2012. (in Chinese)

[27]
Qu Bin, Kang Shichang, Chen Feng et al., 2012. Lake ice and its effect factors in the Nam Co basin, Tibetan Plateau.Progressus Inquisitiones de Mutatione Climatis, 8(5): 327-333. (in Chinese)Lake ice is a good indicator of climate change.In order to analyse the impact of climate on lake ice,we use in situ data as well as remote sensing images to determine the dates of freeze-up and break-up,thickness of lake ice of the Nam Co(2000 km2) and Baima Nam Co(1.45 km2) in the Tibetan Plateau from 2006 to 2011.Combined with meteorological parameters,we found that lake ice in Nam Co is mainly influenced by air temperature,and wind speed also plays an important role in this process.Date of freeze-up and break-up for Nam Co is in February and mid-May,respectively,with an average of 90 days for freeze-up period.Lake ice exhibits relatively larger variability in Baima Nam Co with an average of 124 days for freeze-up period.There is a close relationship between freeze-up period and the negative accumulated temperature.Maximum thickness of the lake ice in the Nam Co occurs in March ranging 58-65 cm.

DOI

[28]
Reed B, Budde M, Spencer P et al., 2009. Integration of MODIS-derived metrics to assess interannual variability in snowpack, lake ice, and NDVI in southwest Alaska.Remote Sensing of Environment, 113(7): 1443-1452.Impacts of global climate change are expected to result in greater variation in the seasonality of snowpack, lake ice, and vegetation dynamics in southwest Alaska. All have wide-reaching physical and biological ecosystem effects in the region. We used Moderate Resolution Imaging Spectroradiometer (MODIS) calibrated radiance, snow cover extent, and vegetation index products for interpreting interannual variation in the duration and extent of snowpack, lake ice, and vegetation dynamics for southwest Alaska. The approach integrates multiple seasonal metrics across large ecological regions. Throughout the observation period (2001–2007), snow cover duration was stable within ecoregions, with variable start and end dates. The start of the lake ice season lagged the snow season by 2 to 302months. Within a given lake, freeze-up dates varied in timing and duration, while break-up dates were more consistent. Vegetation phenology varied less than snow and ice metrics, with start-of-season dates comparatively consistent across years. The start of growing season and snow melt were related to one another as they are both temperature dependent. Higher than average temperatures during the El Ni09o winter of 2002–2003 were expressed in anomalous ice and snow season patterns. We are developing a consistent, MODIS-based dataset that will be used to monitor temporal trends of each of these seasonal metrics and to map areas of change for the study area.

DOI

[29]
Sun Yongliang, Li Xiaoyan, Xu Heye, 2007. Daily precipitation and temperature variations in Qinghai Lake watershed in recent 40 years.Arid Meteorology, 25(1): 7-13. (in Chinese)The daily precipitation(P) and temperature changes in the Qinghai Lake watershed from 1958 to 2001 were analyzed using the records from Gangcha Meteorological Station.Results show that the yearly total rainfall of 0P5 mm decreased significantly from 130.8 mm/a in 1960s to 116.2 mm/a in 1990s at a rate of-9 mm/10 a,whereas the yearly total rainfall of P≥20 mm increased from 29.7 mm/a in 1960s to 36.9 mm/a in 1990s at a rate of 9 mm/10 a.The longest dry period expanded from 32 d/a in 1960s to 45 d/a in 1990s,and the total days for more than 10 successive no-rainfall days changed from 103 d/a to 145 d/a.The average annual temperature increased from-0.7 ℃ in 1960s to 0.1 ℃ in 1990s,and closely connected with the extreme low temperature changes.The daily temperature in 1990s was much higher than that in 1960s,and its increase mainly occurred in winter.These climatic changes had great impacts on Qinghai Lake level and runoffs in this watershed.

[30]
Tao Anqi, 2014. Research on the variation of Namco Lake ice by passive microwave remote sensing [D]. Nanjing: Nanjing University. (in Chinese)

[31]
Vaughan D G, Comiso J C, Allison I et al., 2013. Observations: Cryosphere. In: Stocker T F, Qin D, Plattner G K et al., Climate Change 2013: The Physical Science Basis. Contribution of Working Group I to the Fifth Assessment Report of the Intergovernmental Panel on Climate Change. Cambridge: Cambridge University Press.

[32]
Wan W, Xiao P F, Feng X Z et al., 2014. Monitoring lake changes of Qinghai-Tibetan Plateau over the past 30 years using satellite remote sensing data.Chinese Science Bulletin, 59(10): 1021-1035.During the years 2006 2009,lakes in the Qinghai-Tibetan Plateau(QTP)were investigated using satellite remote sensing strategies.We report the results of this investigation as well as follow-up research and expanded work.For the investigation,we mainly focused on lakes whose areas are more than 1 km2.The remote sensing data that we used included 408 scenes of CBERS CCD images and 5 scenes of Landsat ETM?images in Qinghai Province and Tibet Autonomous Region.All these data were acquired around years 2005 2006.Besides remote sensing images,we also collected 1,259 topographic maps.Numbers and areas of lakes were analyzed statistically,which were then compared with those coming from the first lake investigation(implemented between the1960s and 1980s).According to our investigation,up to and around year 2005 2006,the total number of lakes in the QTP was 1,055(222 in Qinghai and 833 in Tibet),accounting for more than 30%of that of China.Thirty newborn lakes with area[1 km2were found,and 5 dead lakes with initial area[1 km2were also found.Among those 13 big lakes([500 km2),Yamzhog Yumco had seriously shrunk,and it has continued to shrink in recent years;Qinghai Lake had shrunk during the period,but some new researches indicated that it has been expanding since the year 2004;Siling Co,Nam Co,and Chibuzhang Co had expanded in the period.We divided the newborn lakes into six categories according to their forming reasons,including river expansion,wetland conversion,etc.The changes of natural conditions led to the death of four lakes,and human exploitation was the main reason for the death of Dalianhai Lake in Qinghai.We picked out three regions which were sensitive to the change of climate and ecological environment:Nagqu Region,Kekexili Region,and the source area of the Yellow River(SAYR).Lakes in both Nagqu and Kekexili have been expanded;meanwhile,most lakes in the SAYR have obviously been shrunk.These regional patterns of lake changes were highly related to variations of temperature,glacier,precipitation,and evaporation.Our investigation and analysis will provide references for researches related to lake changes in the QTP and the response to climate fluctuations.

DOI

[33]
Wang J, Bai X, Hu H et al., 2012. Temporal and spatial variability of Great Lakes ice cover, 1973-2010.Journal of Climate, 25(4): 1318-1329.

DOI

[34]
Wang J, Hu H, Schwab D et al., 2010. Development of the great lakes ice-circulation model (GLIM): Application to Lake Erie in 2003-2004.Journal of Great Lakes Research, 36(3): 425-436.To simulate ice and water circulation in Lake Erie over a yearly cycle, a Great Lakes Ice-circulation Model (GLIM) was developed by applying a Coupled Ice-Ocean Model (CIOM) with a 2-km resolution grid. The hourly surface wind stress and thermodynamic forcings for input into the GLIM are derived from meteorological measurements interpolated onto the 2-km model grids. The seasonal cycles for ice concentration, thickness, velocity, and other variables are well reproduced in the 2003/04 ice season. Satellite measurements of ice cover were used to validate GLIM with a mean bias deviation (MBD) of 7.4%. The seasonal cycle for lake surface temperature is well reproduced in comparison to the satellite measurements with a MBD of 1.5%. Additional sensitivity experiments further confirm the important impacts of ice cover on lake water temperature and water level variations. Furthermore, a period including an extreme cooling (due to a cold air outbreak) and an extreme warming event in February 2004 was examined to test GLIM's response to rapidly-changing synoptic forcing.

DOI

[35]
Weber H, Riffler M, Nõges T et al., 2016. Lake ice phenology from AVHRR data for European lakes: An automated two-step extraction method.Remote Sensing of Environment, 174: 329-340.Highlights 61 A novel automated two-step extraction method for lake ice phenology is proposed. 61 The first step makes use of NIR and the second step uses TIR derived LSWT data. 61 LSWT thresholds are derived from the data itself. 61 This avoids the definition of arbitrary or lake specific thresholds. 61 The method was validated for European lakes located in different climate regimes. Abstract Several lake ice phenology studies from satellite data have been undertaken. However, the availability of long-term lake freeze-thaw-cycles, required to understand this proxy for climate variability and change, is scarce for European lakes. Long time series from space observations are limited to few satellite sensors. Data of the Advanced Very High Resolution Radiometer (AVHRR) are used in account of their unique potential as they offer each day global coverage from the early 1980s expectedly until 2022. An automatic two-step extraction was developed, which makes use of near-infrared reflectance values and thermal infrared derived lake surface water temperatures to extract lake ice phenology dates. In contrast to other studies utilizing thermal infrared, the thresholds are derived from the data itself, making it unnecessary to define arbitrary or lake specific thresholds. Two lakes in the Baltic region and a steppe lake on the Austrian–Hungarian border were selected. The later one was used to test the applicability of the approach to another climatic region for the time period 1990 to 2012. A comparison of the extracted event dates with in situ data provided good agreements of about 10&nbsp;d mean absolute error. The two-step extraction was found to be applicable for European lakes in different climate regions and could fill existing data gaps in future applications. The extension of the time series to the full AVHRR record length (early 1980 until today) with adequate length for trend estimations would be of interest to assess climate variability and change. Furthermore, the two-step extraction itself is not sensor-specific and could be applied to other sensors with equivalent near- and thermal infrared spectral bands.

DOI

[36]
Wei Qiufang, Ye Qinghua, 2010. Review of lake ice monitoring by remote sensing. Progress in Geography, 29(7): 803-810. (in Chinese)This paper summarized and compared several methods of monitoring lake ice freezingon and breaking up and ice thickness by multi-spectral and microwave remote sensing data. Finally, we monitored the lake ice in Nam Co by two methods during the winter half year of 2007/ 2008. Generally, researchers usually take threshold and index methods to monitor lake ice. According to the differences between ice and water, such as their reflectivity, temperature and backward scattering coefficients, the threshold model can distinguish ice and water directly. It has a high precision with an error of less than 5 days. While the index method recognizes ice and water indirectly by calculations based on spectral and polarization characteristics of ice and water. Additionally, researchers use empirical correlations between ice thickness and its reflectivity, polarization, temperature brightness or other properties to invert thickness. Ice thickness recognition is difficult in lake ice monitoring. Active microwave data is more suitable for ice thickness monitoring than multi-spectral data. Data with high time resolution such as thermal infrared and passive microwave data is more suitable for monitoring lake ice with large areas than the data with high spatial resolutions such as visible, near infrared and active microwave data. Based on multi - source remote sensing data, automatic inversion algorithm will be one of the development trends of lake ice monitoring by remote sensing.

DOI

[37]
Weyhenmeyer G A, Meili M, Livingstone D M, 2004. Nonlinear temperature response of lake ice breakup.Geophysical Research Letters, 31(31): 157-175.A uniquely comprehensive set of four decades of ice breakup data from 196 Swedish lakes covering 13° of latitude (55.7°N to 68.4°N) shows the relationship between the timing of lake ice breakup and air temperature to be an arc cosine function. The nonlinearity inherent in this relationship results in marked differences in the response of the timing of lake ice breakup to changes in air temperature between colder and warmer geographical regions, and between colder and warmer time periods. The spatial and temporal patterns are mutually consistent, suggesting that climate change impacts on the timing of lake ice breakup will vary along a temperature gradient. This has potentially important ramifications for the employment of lake ice phenologies as climate indicators and for the future behavior of lacustrine ecosystems.

DOI

[38]
Xin Yufei, Bian Lingen, 2008. Progress of prediction of the global cryosphere change.Chinese Journal of Polar Research, 20(3): 671-682. (in Chinese)The modeling simulation and modeling prediction of each component (sea ice,snow and frozen ground,ice sheet and shelves,glacier and ice cap,lake and river ice) of the Cryosphere is reviewed. Firstly,the ability of the modeling simulation to reproduce each component changes observed during the last decades is investigated. Secondly,the reliability of the modeling prediction to project over the 21st century is assessed. The conclusion is drawn: the seasonal and interannual variability of some components (eg. sea ice) observed on the large scale is successfully reproduced by current models,and the ability of simulation is greatly improved. On the other hand,the dynamical and thermal process of some components (eg. ice sheet) is not well represented in models,even some components' (eg. river ice) models are based on statistics. The development of models is not equivalent among the cryosphere components. The uncertainty of current simulation and prediction of global cryosphere by models always exist. All the uncertainty is mainly from the detail of physical process which is poorly understood. The physical process and observation research on cryosphere components is urgently needed.

[39]
Yao Xiaojun, Li Long, Zhao Jun et al., 2016. Spatial-temporal variations of lake ice in the Hoh Xil region from 2000 to 2011. Journal of Geographical Sciences, 26(1): 70-82.湖冰物候学,即预定冰冻期和分散和冰盖子的持续时间,在地区性的气候被认为是变化的重要指示物。基于湖,包括 MODIS 的一些中等高度的分辨率遥感数据集和 Landsat TM/ETM+ 图象的边界数据和气象学的数据,在 Hoh Xil 区域的湖冰物候学的空间时间的变化在时期期间, 20002011 被使用 RS 和 GIS 技术分析。并且影响湖冰物候学的因素也被识别。一些结论能如下被得出。(1 ) 冰冻期开始(FUS ) 和湖冰的冰冻期结束(FUE ) 的时间出现了在迟了 Octoberearly 11 月, mid-Novemberearly 12 月分别地。湖冰冰冻期的持续时间是大约半个月。分散开始(公共汽车) 和湖冰的分散结束(BUE ) 的时间相对被驱散,并且出现在早 Februaryearly 6 月,早 Mayearly 6 月分别地。平均的冰持续时间(标志) 和湖的完全的冰持续时间(首领) 分别地是 196 天和 181 天。(2 ) 在 Hoh Xil 区域的湖冰的物候学在最后 10 年里戏剧性地变化了。明确地,湖冰的 FUS 和 FUE 时间显示出一个逐渐地推迟的趋势。相反,公共汽车和湖冰的 BUE 时间介绍了进展。这导致了湖的标志和首领的减小。一般水准分别地标志和首领 were2.21 d / a and1.91 d / a 评价。(3 ) 物候学的变化和湖冰的进化是本地、气候的因素的结果。海岸线的温度,湖区域,咸度和形状是影响湖冰的物候学的主要因素。然而,象热能力那样的另外的因素和湖的地质的结构不应该也被忽略。(4 ) 湖冰冰冻期的空间过程与它的分散过程相反。从湖岸的一个方面延长到相反的方面的湖冰的类型是在 Hoh Xil 区域的大多数。

DOI

[40]
Yin Qingjun, Yang Yinglian, 2005. Remote sensing monitoring of Qinghai Lake based on EOS/MODIS data. Journal of Lake Sciences, 17(4): 356-360. (in Chinese)MODIS data has the characteristic of high spatial and spectral resolution.The study on monitoring and predicting the po- tential change of earth resources based on EOS/MODIS data have become a heated issue.This paper introduced the principle and method of using EOS/MODIS data to distinguish water body from background,to extract ice from water body ,to monitor the dynamic process of freeze-thaw,to calculate the area of water body and ice extent,as well as the water surface temperature.Furthermore,the study took the Lake QingHai for example,using the MODIS data completed the dynamic monitoring the process of freeze-thaw,and at the same time,compared the real data of water surface temperature at fixed location of Jun.to Jul.2003 with the result derived from the MODIS data of same period.At present,the model of monitoring inland lake described in this article has already applied to the operational work of Qingbai Remote Sensing Center.

DOI

[41]
You Q, Min J, Kang S, 2016. Rapid warming in the Tibetan Plateau from observations and CMIP5 model in recent decades.International Journal of Climatology, 36(6): 2660-2670.ABSTRACT <p>On the basis of mean temperature, maximum temperature and minimum temperature from the updated China Homogenized Historical Temperature Data Sets, the recent warming in the Tibetan Plateau (TP) during 1961–2005 and global warming hiatus period are examined. During 1961–2005, the mean temperature, maximum temperature and minimum temperature in the whole TP show a statistically increasing trend especially after the 1980s, with the annual rates of 0.27, 0.19 and 0.36 °C decade611, respectively. The performance of 26 general circulation models (GCMs) available in the fifth phase of the Coupled Model Intercomparison Project (CMIP5) is evaluated in the TP by comparison with the observations during 1961–2005. Most CMIP5 GCMs can capture the decadal variations of the observed mean temperature, maximum temperature and minimum temperature, and have significant positive correlations with observations ( R > 0.5), with root mean squared error

DOI

[42]
Zaikov, 1963. Introduction to Lake Science. Beijing: The Commercial Press. (in Chinese)

Outlines

/