Orginal Article

Spatiotemporal characteristics of seasonal precipitation and their relationships with ENSO in Central Asia during 1901-2013

  • CHEN Xi , 1 ,
  • WANG Shanshan 2 ,
  • HU Zengyun 1, 3 ,
  • ZHOU Qiming 3 ,
  • HU Qi 4
Expand
  • 1. State Key Laboratory of Desert and Oasis Ecology, Xinjiang Institute of Ecology and Geography, CAS, Urumqi 830011, China
  • 2. Key Open Laboratory of Arid Climate Change and Disaster Reduction of CMA, Institute of Arid Meteorology, CMA, Lanzhou 730000, China
  • 3. Department of Geography, Hong Kong Baptist University, Kowloon Tong, Kowloon, Hong Kong, China
  • 4. School of Natural Resources and Department of Earth and Atmospheric Sciences, University of Nebraska-Lincoln, Lincoln, Nebraska

Author: Chen Xi, Professor, specialized in hydrology and water resource, as well as environmental remote sensing. E-mail:

Received date: 2018-01-05

  Accepted date: 2018-03-20

  Online published: 2018-09-25

Supported by

International Cooperation Fund of Ecological Effects of Climate Change and Land Use/Cover Change in Arid and Semiarid Regions of Central Asia in the Most Recent 500 Years, No.41361140361

The Western Scholars of the Chinese Academy of Sciences, No.2015-XBQN-B-20

National Natural Science Foundation of China, No.41471340, No.41605055

Hong Kong Baptist University Faculty Research, No.FRG2/17-18/030

Copyright

Journal of Geographical Sciences, All Rights Reserved

Abstract

The vulnerable ecosystem of the arid and semiarid region in Central Asia is sensitive to precipitation variations. Long-term changes of the seasonal precipitation can reveal the evolution rules of the precipitation climate. Therefore, in this study, the changes of the seasonal precipitation over Central Asia have been analyzed during the last century (1901-2013) based on the latest global monthly precipitation dataset Global Precipitation Climatology Centre (GPCC) Full Data Reanalysis Version 7, as well as their relations with El Niño- Southern Oscillation (ENSO). Results show that the precipitation in Central Asia is mainly concentrated in spring and summer seasons, especially in spring. For the whole study period, increasing trends were found in spring and winter, while decreasing trends were detected in summer and fall. Inter-annual signals with 3-7 years multi-periods were derived to explain the dominant components for seasonal precipitation variability. In terms of the dominant spatial pattern, Empirical orthogonal function (EOF) results show that the spatial distribution of EOF-1 mode in summer is different from those of the other seasons during 1901-2013. Moreover, significant ENSO-associated changes in precipitation are evident during the fall, winter, spring, and absent during summer. The lagged associations between ENSO and seasonal precipitation are also obtained in Central Asia. The ENSO-based composite analyses show that these water vapor fluxes of spring, fall and winter precipitation are mainly generated in Indian and North Atlantic Oceans during El Niño. The enhanced westerlies strengthen the western water vapor path for Central Asia, thereby causing a rainy winter.

Cite this article

CHEN Xi , WANG Shanshan , HU Zengyun , ZHOU Qiming , HU Qi . Spatiotemporal characteristics of seasonal precipitation and their relationships with ENSO in Central Asia during 1901-2013[J]. Journal of Geographical Sciences, 2018 , 28(9) : 1341 -1368 . DOI: 10.1007/s11442-018-1529-2

1 Introduction

The variations of seasonal precipitation are widely regarded as key indicators of climate variations (Sorg et al., 2012; Chou et al., 2013; Bintanja and Selten, 2014). And these changes of precipitation in both space and time have significant influences on the spatiotemporal distributions of water resources and result in floods or droughts, which will impact on the natural ecosystem and human society seriously (Smith et al., 2012; Chou et al., 2013). Under the global warming, the seasonal precipitation has been experienced large changes at regional and global scales, such as the increase in the range between wet and dry season precipitation (Chou et al., 2013). Therefore, it is urgent and necessary to explore the spatiotemporal changes of the seasonal precipitation.
Recently, more and more attention has been focused on the variations of the seasonal precipitation by observed datasets (e.g. Aizen and Aizen, 1997; Hu, 1997; Zveryaev, 2004; Wang and Zhou 2005; Zhang et al., 2011; Rudolph and Friedrich 2013) and climate models (e.g. Hu et al., 2003; Russo and Sterl, 2012; Maussion et al., 2014). During 1952-1999, increased seasonal precipitation is examined over northern mid to high latitudes from observed datasets and simulated models (Noake et al., 2012). For the period of 1979-2010, the wet seasons become much wetter and dry seasons become much drier, and this tendency is also obtained using a number of global observational datasets (Chou et al., 2013). The seasonal rainfall patterns between China, Korea and Japan are different, and the 850 hPa circulation controlled the seasonal rainfall oscillation in Korea, eastern China and Japan (Qian et al., 2002). Over China, the increasing trend of winter precipitation occurred in most of China and northwest China experienced the increasing trends in all seasons during the past half century (Wang and Zhou, 2005; Wang and Yan, 2009; Zhang et al., 2011). Large spatial difference with the summer precipitation climatology and variability lower than those of winter precipitation were founded over Eastern Europe during 1958-1998 (Zveryaev, 2004).
El Niño-Southern Oscillation (ENSO) is the most dominant inter-annual signal of climate variability on Earth, and is known to influence the climate changes at the regional and global scales through the atmosphere-ocean coupling (Ropelewski and Halpert, 1987; Dai et al., 1997; Xie and Arkin 1997; Ward et al., 2014; Emerton et al., 2017). Particularly, previous studies (Dai and Wigley 2000; Chen et al., 2017; Dai and Arkin 2017; Jia and Ge 2017) pointed out that ENSO plays very important roles on the variability, magnitude, and distributions of the seasonal precipitation. Dai and Wigley (2000) reported that the ENSO-induced precipitation have different patterns at different seasons which are related to large-scale atmospheric circulation changes caused by sea surface temperature (SST) and wind anomalies. The spring precipitation of Europe is strongly influenced by ENSO (Hughes and Saunders 2002), while summer and winter precipitation are associated with the North Atlantic Oscillation (NAO) (Zveryaev, 2004). Some ENSO-related changes in storm activity are also evident during fall and winter over Europe. These seasonal teleconnections over Europe appear to be mediated by the changes in upper tropospheric conditions along the coast of Europe which produce onshore or offshore moisture flux anomalies (Shaman, 2014). The circulation anomaly induced by warming in the tropical Indian Ocean enhances the relationship between ENSO and summer precipitation over northeastern China (Han et al., 2017). ENSO also has large impacts on the seasonal at different timescales, such as the transition seasons over the southwest Central Asia (Mariotti, 2007), the intra-seasonal precipitation over southwestern Asia (Hoell et al., 2012, 2015;2017) and the inter-decadal changes of the winter precipitation over China (Jia and Ge, 2017).
As one of the largest arid and semiarid regions, Central Asia has experienced rising temperature and increased precipitation during the last century (Hu et al., 2014; Hu et al., 2016b; Hu et al., 2017). The changes of the precipitation have large influences on the ecosystem over this arid and semiarid region (Hu et al., 2014). Although some studies are applied on precipitation over Central Asia (Aizen et al., 2001; Schiemann et al., 2008; Chen et al., 2011; Hu et al., 2016a, 2016b), the spatiotemporal analysis of the seasonal precipitation is limited. For example, whether the seasonal precipitation has increased trend during the last century, and among the four seasons which one has the largest change? The annual precipitation has the obvious spatial differences between Xinjiang and the five states of Central Asia (Xu et al., 2015; Hu et al., 2017). Then, whether the differences still existed for the seasonal precipitation. Moreover, what are the relationships between the seasonal precipitation and ENSO over this region?
In order to address the above challenges and complexities, in this study, we systematically examine the evolutions of the seasonal precipitation over Central Asia during the last century. Because of the high ability to capture the temporal variations and spatial patterns of the seasonal precipitation climate over this region (Hu et al., 2018), the latest version of GPCC Full Data Reanalysis Version 7 (GPCC V7) dataset with the period 1901-2013 is adopted as in Hu et al. (2017). The first objective is to analyze the temporal features of the seasonal precipitation during 1901-2013, including the linear trend and multi-periods. The spatial features including the spatial distributions of the linear trends and identifying the dominant spatial pattern are explored as the second objective. Since the significantly positive correlation between the annual precipitation and ENSO is obtained (Hu et al., 2017), the third objective is to examine the correlations between the seasonal precipitation and ENSO, and the influence of ENSO on the precipitation is detected through the composite method.

2 Study area, datasets and analysis methods

2.1 Study area

This study area encompasses five countries: Kazakhstan, Kyrgyzstan, Tajikistan, Turkmenistan, Uzbekistan (hereafter ‘CAS5’), and Xinjiang Uygur Autonomous Region of China (Figure 1). This arid and semiarid region is located in the hinterland of the Eurasian continent, and is primarily dominated by the westerly winds (Lioubimtseva and Cole, 2006; Chen and Zhou, 2015). It has been experienced a significant increasing trend of the surface temperature (Hu et al., 2014) and an overall increasing trend of the annual precipitation during the last century (Hu et al., 2017).
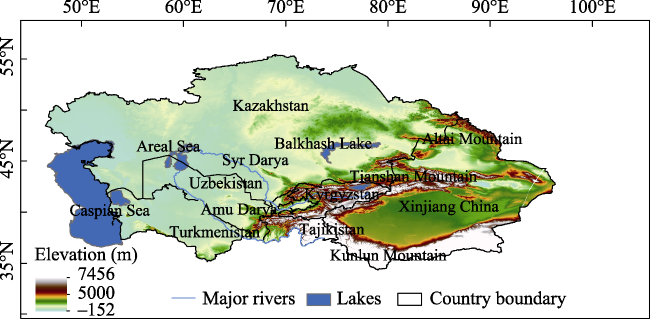
Figure 1 Study area and orographic features in Central Asia

2.2 Datasets

The global monthly land-surface precipitation dataset GPCC V7 (Schneider et al., 2015) with a spatial resolution of 0.5°×0.5° for the period 1901-2013 is used (ftp://ftp.dwd.de/pub/data/gpcc/html/fulldata_v7_doi_download.html). This gridded dataset is based on 75,000 meteorological stations world-wide with record durations of 10 years or longer and it has been widely used to support regional climate monitoring, model validation, climate variability analysis and water resources assessment studies (Becker et al., 2013; Schneider et al., 2014). Recent studies (Hu et al., 2016a; Hu et al., 2017; Hu et al., 2018) also suggest that the correlation coefficient of the annual precipitation between the observed stations over this region and GPCC is larger than 0.88 and the obsolete error is only 5 mm which indicate that this dataset can well describe the spatiotemporal patterns of the precipitation climate over Central Asia.
ENSO is indicated by Niño 3.4 index, derived from SST anomaly estimated in the Niño 3.4 region (5°N-5°S, 120°-170°W). This Niño 3.4 index with the period of 1950 to present is obtained from the Climate Prediction Center of National Oceanic and Atmospheric Administration (NOAA) (http://www.cpc.ncep.noaa.gov/data/indices/ersst4.nino.mth.81-10.ascii). In order to investigate the moisture flux sources and the moisture flux transport paths of the seasonal precipitation over Central Asia, the water vapor flux (vertical integral of eastward water vapor flux and vertical integral of northward water vapor flux), vertical integral of divergence of moisture flux from the monthly ERA-20C with a spatial resolution of 1.0°×1.0° for the period 1900-2010 (Poli et al., 2016) were used (http://apps.ecmwf.int/datasets/data/era20c-moda/). Moreover, the geopotential height (HGT), U component of wind and V component of wind at 200 hPa and 850 hPa levels of ERA-20C were applied to explore the upper and lower tropospheric response to ENSO which can provide a better understanding of the physical mechanisms from the atmospheric circulations.

2.3 Analysis methods

In this study, the four seasons are defined as spring [March-May (MAM)], summer [June-August (JJA)], fall [September-November (SON)] and winter [December-February (DJF)]. Comparing with a previous study on Central Asia annual precipitation (Hu et al., 2017), three periods: 1901-2013, 1951-2013 and 1979-2013 are considered for the temporal variations and spatial patterns of the seasonal precipitation. Since the coefficient of variation (CV) defined as the ratio of the standard deviation (STDV) to the mean can well assessing the variability of the time series and apparently permits the comparison of variates free from scale effects (Brown 1998), therefore, it is used to measure the year to year variabilities of the seasonal precipitation. The linear trend K is used to quantify the tendency of the seasonal precipitation which is obtained by the linear least square method and the significance is identified by the Student’s t test at 95% confidence levels (p<0.05).
In order to extract the multi-period characteristics of the seasonal precipitation and the Niño 3.4 index, the Ensemble Empirical Mode Decomposition (EEMD) method (Wu and Huang, 2009; Ji et al., 2014) is applied. For a time series X(t) is decomposed in the instrinsic mode functions (IMFs) and the residue term r. The IMFs display the different multi-periods and r is the nonlinear trend (Ji et al., 2014). The added white noise in each EEMD ensemble member has a standard deviation of 0.2 and an ensemble size of 100 is used. The significance of the periodicity for each EEMD component is detected at a 95% confidence level (Wu and Huang 2004). The detailed description of the EEMD method can be found in Wu and Huang (2009).
The spatiotemporal structures of the long-term variations of seasonal precipitation are examined by the empirical orthogonal function (EOF) analyses (Lorenz, 1956). EOF analyses can identify the dominant spatial pattern according to the spatial mode (EOF mode) and obtain the corresponding time coefficients which explain the magnitude of the variation of each EOF model of the seasonal precipitation. Before the EOF analysis, the annual cycle was removed from all grid point time series by subtracting from each seasonal value the respective season’s long-term mean. Following North et al. (1982), a significance test is applied to distinguish the physical signal from the noise in the EOF.
Correlation coefficient (CC) values between the inter-annual signals of the seasonal precipitation and ENSO are computed to quantify the inter-annual correlations between the seasonal precipitation and ENSO. According to the definition of Qian et al. (2011), the inter-annual signals of ENSO and precipitation are obtained by EEMD method: combining the components with their periods smaller than 10-year as the inter-annual timescale component. CC values are determined by an effective degree of freedom when considering the first-order autocorrelations at 95% and 99% confidence levels (Bretherton et al., 1999). In this study, two types of CC values are defined: the first CC is computed from the time series with the different periods from i year (starting year) to 2013. Considering the statistical significance, the starting year i is from 1901 to 1984. The second type CC is computed by the 30-yr moving of inter-annual time series between the seasonal precipitation and ENSO (named 30-yr moving CC) which is used to investigate the stable (or robust) of the correlation in time.
At last, the seasonal ENSO-based composite analyses (using El Niño minus La Niña years) are conducted to discuss the possible physical process. In this study, the Niño 3.4 indices are normalized by the mean value and STDV. Then, the El Niño year is defined when the normalized Niño 3.4 indices are not smaller than one STDV and the La Niña is defined as the normalized Niño 3.4 indices are smaller than -STDV (Shaman, 2014; Hu et al., 2017).

3 Results

3.1 Temporal changes over the entire study area (Central Asia)

For 1901-2013, MAM (Mean=59 mm) and JJA (Mean=57 mm) have larger precipitation than SON (Mean=43 mm) and DJF (Mean=41 mm) which indicates that the precipitation mainly occurs in spring and summer over Central Asia, especially in spring (Table 1). The CV (25%) of SON shows the largest variabilities of the precipitation than those of the other seasons (Table 1 and Figure 2). Figures 2c and 2d show that sharp drops are occurred from 1901 to the early 1940s for SON and DJF, and flowed by a rise till the 1980s which is consistent with the variability of the annual precipitation (Hu et al., 2016a). Moreover, positive anomalies of JJA mainly occurred from 1901 to 1970 (Figure 2b). From the 1930s to 1960s, SON and DJF have largely negative anomalies which imply that drought events may occur in these two seasons (Figures 2c and 2d). On the whole, increasing trends are found for MAM and DJF with the values of 0.41 mm/10a and 0.39 mm/10a over Central Asia (Table 1). JJA and SON have slightly decreasing trends.
Table 1 Mean (mm), coefficient of variation (CV: %) and linear trend (K: mm/10a) of the seasonal precipitation over mountainous area, plain area and Central Asia during 1901-2013, 1951-2013 and 1979-2013
Study area Season 1901-2013 1951-2013 1979-2013
Mean CV K Mean CV K Mean CV K
Central Asia MAM 59 21 0.41 61 22 0.49 61 20 0.42
JJA 57 20 -0.09 57 19 0.4 58 19 1.62
SON 43 25 -0.1 43 22 0.23 44 21 -1.97
DJF 41 20 0.39 42 18 0.77 43 17 0.24
Mountainous area MAM 79 21 0.22 81 20 -0.62 80 20 -1.47
JJA 77 18 -0.16 77 18 1.23 79 18 2.66
SON 46 29 -0.16 45 25 0.68 47 25 0.3
DJF 42 22 0.31 43 23 0.78 43 22 2.54
Plain area MAM 55 23 0.44 56 24 0.73 57 22 0.84
JJA 53 23 -0.09 53 22 0.21 53 22 1.37
SON 42 26 -0.1 42 23 0.12 43 22 -2.48
DJF 40 22 0.4 42 18 0.75 43 17 -0.29
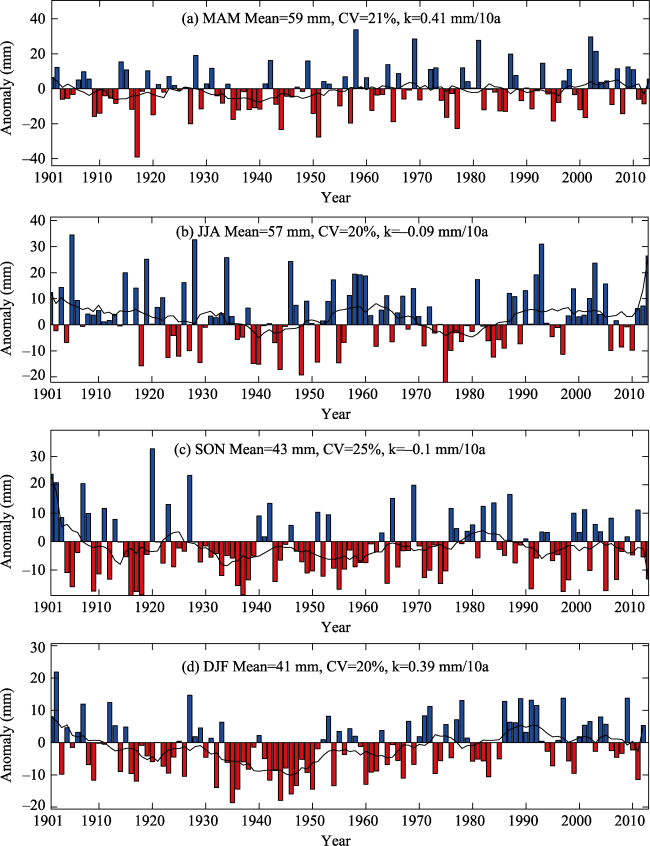
Figure 2 Seasonal precipitation anomalies (a: MAM; b: JJA; c: SON and d: DJF) averaged over Central Asia during 1901-2013, where the reference period is 1961-1990. The thick curve line is the 11-year moving average result.
During the other two periods (1951-2013 and 1979-2013), MAM and JJA also account for the larger part of the total annual precipitation than SON and DJF (Table 1). The seasonal precipitation has the increasing trends with the largest trend in DJF (0.77 mm/10a) for 1951-2013. For the last three decades (1979-2013), the increasing trend of MAM is equal to those of the other two periods (Table 1). JJA has the largest increasing trend (1.62 mm/10a) which is four times than that of 1951-2013.While a strong decreasing trend (-1.97 mm/10a) is found in SON during 1979-2013. The increasing trend of DJF is the smallest than those of the other periods which is less than one third of that in 1951-2013.
!!!Figure 3 displays the EEMD results of the seasonal precipitation over Central Asia during 1901-2013. For each EEMD component of MAM, it appears a relatively stable quasi-period, with the mean periods of 3 years for c1, 6 years for c2, 10 years for c3, 26 years for c4 and 54 years for c5 (Figure 3a and Table 2). c1 and c2 display the interannual timescale components of the MAM precipitation with 69% and 20% variance contribution, respectively, indicating that the inter-annual signal is the dominant component of the MAM precipitation over Central Asia. According to the residual term r, an increasing nonlinear trend with an increment of 8.45 mm is obtained from 1901-2013 which is consistent with the increasing linear trend. For the other seasons, the inter-annual timescale components have 3-6 years mean periods (Figures 3b-3d, Table 2). The inter-annual signal of JJA and SON has 84% and 87% variance contribution, respectively. It is only 59% variance contribution for the variations of the DJF precipitation. Moreover, both JJA and SON have decreasing nonlinear trends based on the residual terms with the values of -3.66 mm and -7.3 mm, respectively (Figures 3b, 3c and Table 2). Contradicting with the increasing linear trend, a decreasing nonlinear trend of DJF is found with the value of -8.83 mm. During 1951-2013 and 1979-2013, 3-6 years means periods of the seasonal precipitation are also obtained with more than 70% variance contribution which shows that the inter-annual signals are the dominant signal in the variations of the seasonal precipitation (not shown).
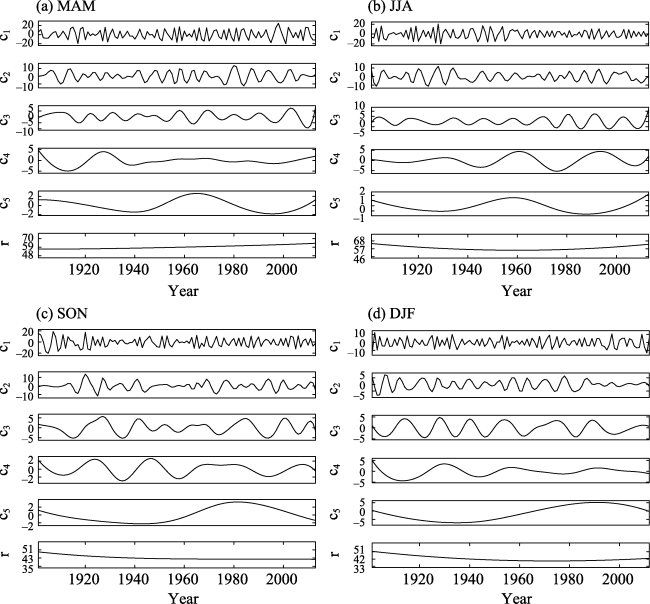
Figure 3 The decomposition results of annual precipitation time series over Central Asia, (a): MAM; (b): JJA; (c): SON and (d): DJF during the period of 1901-2013. The IMF1-IMF5 indicate the different periods of the annual precipitation time series, and the residue term r is the nonlinear trend obtained by the EEMD method.
Table 2 Hurst Index (H) of the seasonal precipitation over mountainous area, plain area and Central Asia during 1901-2013, 1951-2013 and 1979-2013
Study area Season 1901-2013 1951-2013 1979-2013
Central Asia MAM 0.56 0.62 0.66
JJA 0.68 0.81 0.75
SON 0.63 0.76 0.82
DJF 0.86 0.82 0.92
Mountainous area MAM 0.58 0.60 0.72
JJA 0.75 0.86 0.79
SON 0.55 0.66 0.80
DJF 0.59 0.74 0.82
Plain area MAM 0.56 0.63 0.69
JJA 0.66 0.77 0.73
SON 0.65 0.78 0.81
DJF 0.89 0.81 0.98

3.2 Temporal changes over mountainous area and plain area

As the water tower of Central Asia, the mountainous precipitation provides large runoff to the rivers in this region (Chen et al., 2012). It also plays an important role on the water resource to the agriculture and animal husbandry of the arid and semiarid ecosystem. In addition, the seasonal variations of the precipitation over mountainous area can result in extreme climate events, such as flood and drought. Therefore, it is necessary to split the entire region into mountainous area and plain area, and then to explore the temporal changes of the seasonal precipitation over the two areas, respectively. In this study, the definition of mountainous area by the United Nations Environment Programme (UNEP) was used; a mountainous area should have elevation >2500 m, or between 1500 m and 2500 m and with a slope >2º, or between 1000 m and 1500 m and with a slope >5º or local elevation >300 m (Blyth et al., 2002). Area outside of the mountainous area was treated as plain area.
The mountainous area certainly has the larger mean values of the seasonal precipitation than those of the plain area during the three periods (Table 1). MAM and JJA also have the larger precipitation than SON and DJF over the two separate areas. In 1901-2013, MAM and DJF have the increasing trends both in mountainous area and plain area. It should be noted that the increasing trends of plain area are larger than those of mountainous area, such as 0.44 mm/10a vs 0.22 mm/10a (Table 1). During 1951-2013, except the negative rate of MAM, mountainous area has the positive rates for the other seasons with the largest value in JJA (1.23 mm/10a). In plain area, all the seasonal precipitation has positive trends and DJF has the largest trend (0.75 mm/10a). During the last three decades (1979-2013), in mountainous area MAM has a larger decreasing trend (-1.47 mm/10a) than that of 1951-2013. While the increasing trends of JJA and DJF become larger, such as the DJF with more than three times value from 1979 to 2013 (2.54 mm/10a) than that of 1979-2013 (0.78 mm/10a). Over plain area, the positive trends are found in MAM and JJA, and negative trends appear in SON and DJF.

3.3 Spatial distributions of the linear trends

In this section, the regional differences of the seasonal precipitation are explored by the linear trends of the three different periods (1901-2013, 1951-2013 and 1979-2013) in Figures 4-6. For the MAM precipitation in 1901-2013, more than 60% areas have the increasing trends with the statistically significant at 95% confidence level (p<0.05) in 18.87% areas (Table 3). The positive centers mainly occur in northwestern Central Asia and mountainous area, and the decreasing trend centers (p<0.05) appear at part of the central Kazakhstan and most parts of Xinjiang (Tarim Basin and Turpan) (Figure 4a). Unlike the spatial distributions of MAM, the increasing trend centers of JJA occur in the mountainous area between Kyrgyzstan and Xinjiang, and small part of northern Kazakhstan (Figure 4b). The areas (such as part of northeast and west of Kazakhstan, northern Xinjiang) with the increasing trend of MAM precipitation become a decreasing trend for the JJA precipitation which result in the equate areas in the liner trends (increasing 50.37% vs decreasing 49.63 in Table 3). Similar spatial distributions are found for SON and DJF (Figures 4c and 4d). Moreover, the increasing trend centers (bigger than 2 mm/10a) of DJF appear in part of northern Kazakhstan and the area between Kazakhstan and Kyrgyzstan which are significant at 95% confidence level (Figure 4d). Besides the significant decreasing trend in most parts of south and east Xinjiang as MAM, SON and DJF also have the significant decreasing trend in part of the northern Kazakhstan (Figures 4c-4d). Overall, the increasing areas are larger than the decreasing areas for SON and DJF in Table 3.
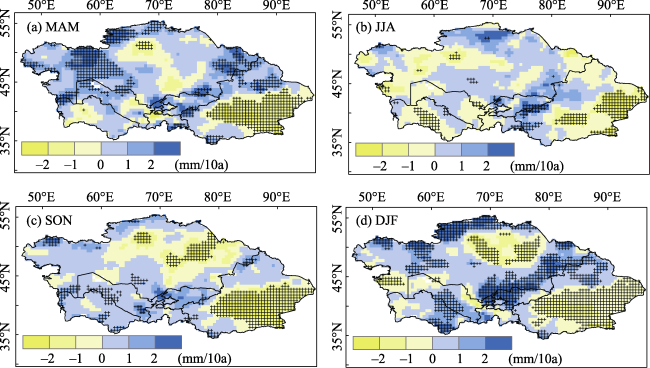
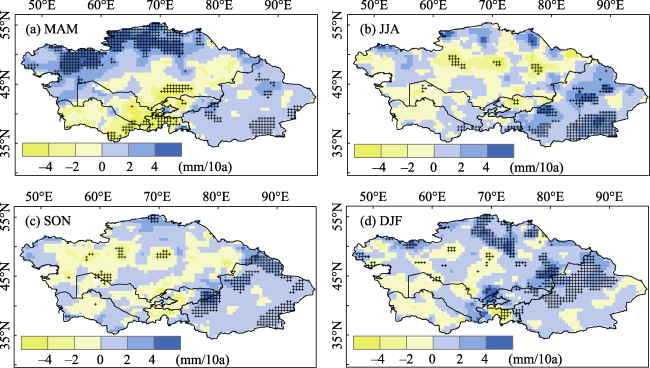
Figure 4 Spatial distributions of the linear trends of the seasonal precipitation over Central Asia during the period of 1901-2013. Statistically significant linear trends at the 95% confidence level are indicated by cross (p<0.05).
Table 3 Percentage areas (%) with the increasing trend, decreasing trend, significant increasing trend (SIT) and significant decreasing trend (SDT) at 95% confidence level of the four seasonal precipitation during 1901-2013, 1951-2013 and 1979-2013
Period Season Increase Decrease SI SD
1901-2013 MAM 69.00 31.00 18.78 11.83
JJA 50.37 49.63 3.01 9.06
SON 57.40 42.60 6.60 16.48
DJF 60.99 39.01 26.67 20.34
1951-2013 MAM 66.50 33.50 17.22 3.71
JJA 57.75 42.25 9.25 1.72
SON 60.95 39.05 9.57 1.87
DJF 71.26 28.74 16.56 1.95
1979-2013 MAM 61.07 38.93 4.22 1.87
JJA 63.30 36.70 3.44 0.86
SON 32.57 67.43 4.49 10.39
DJF 58.53 41.47 17.77 6.21
For 1951-2013, Xinjiang experienced the increasing trend of the four seasons which is contradicted with the decreasing trend during 1901-2013 (Figures 4 and 5). The decreasing trend mainly appears in CAS5 for the other three seasons (e.g. MAM, JJA and SON, Figures 5a-5c) which explain the drying trend in CAS5 and the wetting trend in Xinjiang. Moreover, MAM has the largest significant increasing trend center areas (over the northern Kazakhstan) than those of the other three seasons. The four seasons have the increasing trend areas larger than the decreasing trend areas with the largest increasing trend areas in DJF (71.26%) (Table 3).
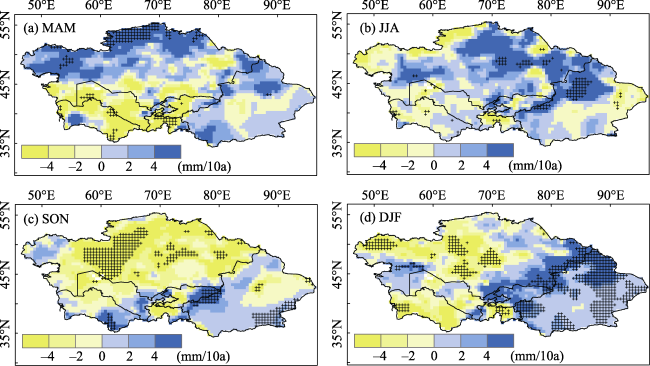
Figure 5 Same as Figure 4, but for the period of 1951-2013
For the last three decades, the spatial distributions of the linear trends have large differences among the four seasons (Figure 6). Except SON, the other seasons have the increasing trend areas larger than the decreasing trend areas from Table 3. The increasing trend center (bigger than 4 mm/10a) of MAM is expanded compared with the result in 1951-2013 (Figure 6a). The decreasing trend center still occurs in the middle and south areas of CAS5. The increasing trend center of MAM is shifted to central Kazakhstan and northern Xinjiang at JJA (Figure 6b). For SON and DJF, almost all the CAS5 regions experience a decreased precipitation during 1979-2013 (Figures 6c-6d). The increasing trend centers of DJF appear in mountainous area and northern Xinjiang with the change rate bigger than 4 mm/10a (Figure 6d). It should be noted that considerable parts of Xinjiang have the decreasing trends in the four seasons except DJF.
Figure 6 Same as Figure 4, but for the period of 1979-2013

3.4 Leading modes of the inter-annual variations of the seasonal precipitation

In order to further reveal the leading modes of inter-annual variability of the seasonal precipitation over Central Asia, we performed EOF analyses on the seasonal precipitation for the period of 1901-2013. Spatial patterns of the first EOF mode (EOF-1) and the corresponding time coefficients results are shown in Figure 7.
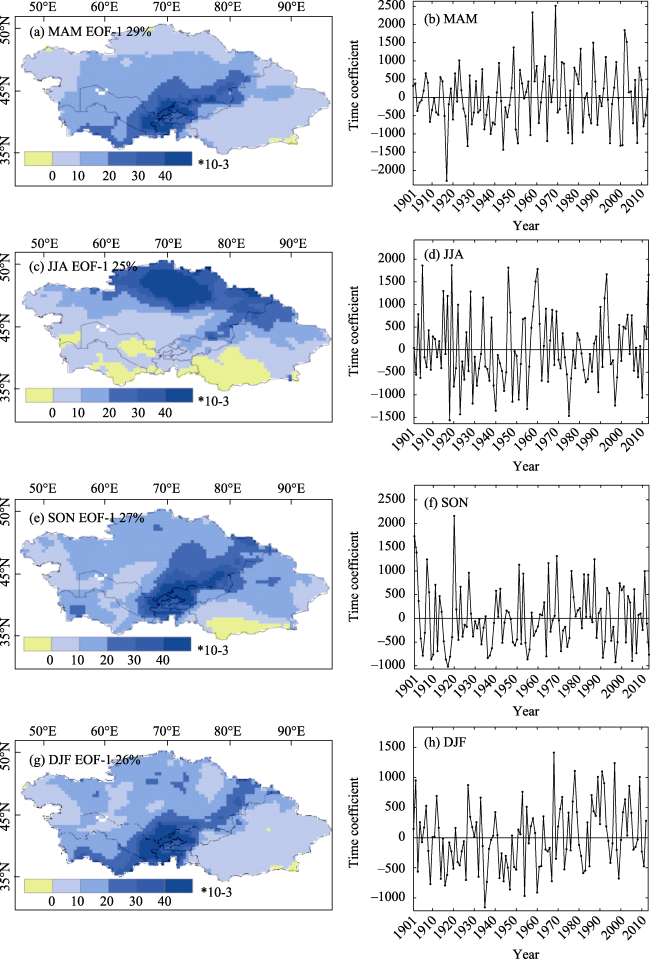
Figure 7 EOF-1 (left panel) of the seasonal precipitation anomalies (mm) and the corresponding time coefficients (right panel) over Central Asia during 1901-2013
The first EOF mode accounts for 29%, 25%, 27% and 26% of the total variance of MAM, JJA, SON and DJF precipitation, respectively (Figures 7a, 7c, 7e and 7g). Furthermore, these EOF modes are statistically significant at 95% confidence level by the method of North et al. (1982). The first EOF modes of MAM and DJF have the similar spatial patterns with the positive values nearly over all Central Asia (Figures 7a and 7g) which indicates that the precipitation have the uniform variations for the two seasons. Moreover, the positive centers occur in mid-southern Central Asia (such as Kyrgyzstan and Tajikistan), and which shows that these regions have the strongest variations of MAM and DJF precipitation. For JJA, small parts of southwestern Kazakhstan, eastern Uzbekistan, southern Turkmenistan and southwestern Xinjiang have the negative values and the other regions have the positive values which suggest the opposite variations of the precipitation during 1901-2013 (Figure 7c). The positive centers appear in northern Central Asia (e.g. northern Kazakhstan and part of northern Xinjiang). For SON, Figure 7e displays that most regions of Central Asia have positive EOF-1 with the centers occurring in eastern Kazakhstan, Kyrgyzstan and Tajikistan. In general, compared with the other three seasons, JJA has the different variability centers. Figures 7b, 7d, 7f and 7h show the corresponding time coefficients have the similar variabilities as those of the seasonal precipitation in Figure 2. They can capture the wet (dry) years for the seasonal precipitation, such as wet years in 1958, 1969 and 2002 for MAM (Figure 7b) and dry years in 1918, 1923, 1929, 1955 and 1975 for JJA (Figure 7d).

3.5 Relationships between the seasonal precipitation and ENSO

Recent studies (Mariotti, 2007; Hu et al., 2017) suggested that ENSO has strong influences on the magnitude and variability of the precipitation over Central Asia according to the southwesterly water vapor flux coming from the Arabian Sea and tropical Africa. Therefore, in this section, we explore the relationships between the seasonal precipitation and ENSO during 1951- 2013. The correlation coefficients and the time lag correlation coefficients will be explored.
With the similar inter-annual variabilities, the seasonal precipitation is significantly positively correlated with the ENSO at MAM (CC=0.35, p<0.01), SON (CC=0.27, p<0.05) and DJF (CC=0.5, p<0.01) during 1951-2013 (Figure 8 and Table 4), respectively. It indicates that ENSO has the largest impact on the precipitation in winter, followed by spring. For JJA, the correlation value is only 0.03 which shows that there is no (or slightly) correlation between the precipitation and ENSO. ENSO has the positive impacts on the seasonal precipitation at MAM and DJF with significant correlations (p<0.05), especially after 1970s (Figure 9a), while the precipitation of JJA and SON has no significant correlation with ENSO except the CC in 1951 for SON. In order to further reveal the correlations between the seasonal precipitation and ENSO, the 30-yr moving CC values are computed in Figure 9b. The results show that the positive correlation coefficients of MAM and DJF increase with time, while it is decreasing for JJA and SON. Moreover, almost of the 30-yr moving CC values of DJF are significant at 95% confidence level, and for MAM the CC values are only significant after 1978 for (p<0.05). It is interesting that the positive CC values of SON are the largest than those of MAM and DJF for the starting years of 30-yr moving CC from 1951 to 1965 (Figure 9b). Obviously, these CC values of SON are significant at 95% confidence level. This can be well explained by the temporal variabilities of the seasonal precipitation and ENSO (Figures 8a, 8c and 8d). In general, from the above analyses, it can be concluded that the strongly positive correlations identified between the precipitation and ENSO in DJF are stable (or robust) in time.
Figure 8 Inter-annual signals of the seasonal precipitation and Niño 3.4 index obtained by EEMD method during 1951-2013
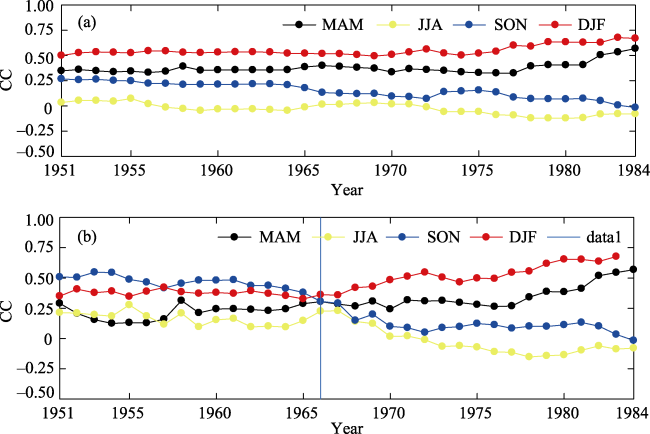
Figure 9 CC results of the inter-annual signals between seasonal precipitation and Niño 3.4 index during 1951-2013, (a) CC of the periods from year i to 2013 (i = 1951, …, 1984) and (b) 30-yr moving CC, where the vertical blue line is in the year 1966
Moreover, we further explore the lag season relationships between the precipitation and Niño 3.4 index during 1951-2013 in Table 4. The lag-i (i=0, 1, 2, 3, 4) is computed to reveal the effects of ENSO on the precipitation. Taking the CC values of MAM in the first row as an example, lag-0 CC is obtained between the MAM precipitation and MAM Niño 3.4 index at the same year during the period of 1950-2013. The lag-1, lag-2, and lag-3 CC of MAM is computed between the MAM precipitation and the JJA, SON and DJF Niño 3.4 index at the same year, respectively. The last value lag-4 CC of MAM is obtained between the MAM precipitation and the next year MAM Niño 3.4 index. The lag-i (i=0, 1, 2, 3, 4) values of the other seasons are obtained by the same approach. The results in Table 4 show that the significant influences of ENSO are persistent till the JJA precipitation with CC=0.31. Although there is no relationship between the JJA precipitation and JJA Niño 3.4 index, ENSO has the great influences on the SON and DJF precipitation of the same year, and the MAM and JJA precipitation of the next year with the significant positive CC values in Table 4. ENSO has significant positive impact on the SON (CC=0.27) and DJF (CC=0.47) precipitation in the present year and this influence will last until the JJA precipitation in the next year. The significantly positive effects of ENSO on the precipitation are from DJF in the same year to JJA in the next year from the lag CC values in Table 4. These results indicate that the time lags are obtained between the seasonal precipitation and ENSO.
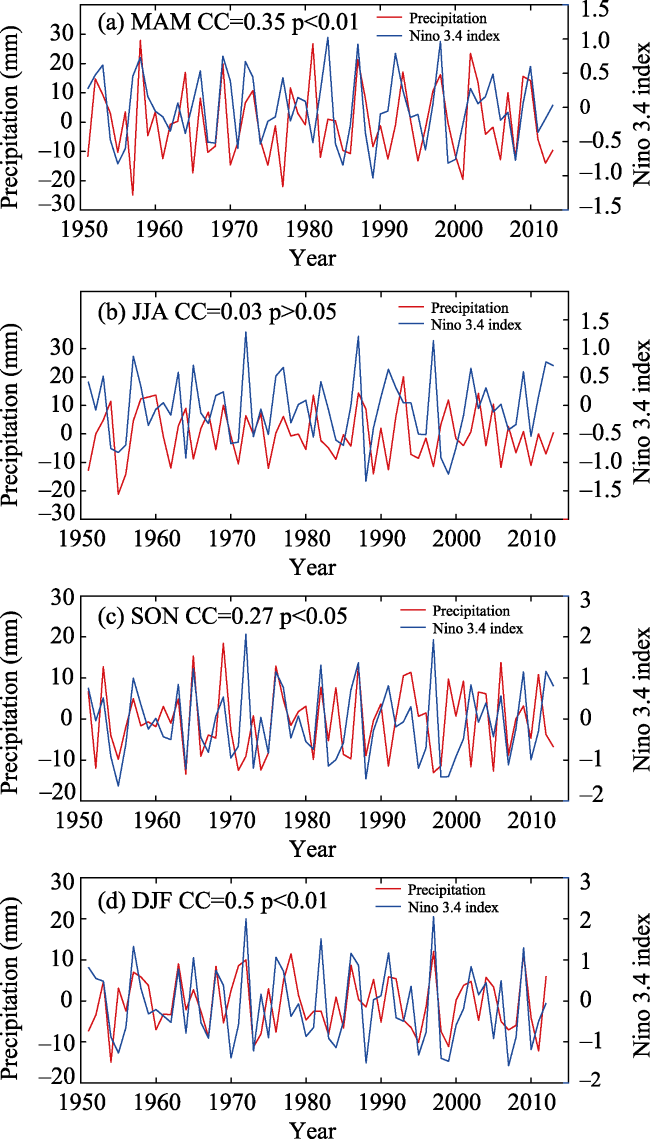
Table 4 CC results of the seasonal lags time series between the precipitation and Niño 3.4 index during 1951-2013, lag-i (i=0, 1, 2, 3, 4) means lag i seasons
Seasonal lag MAM JJA SON DJF
lag-0 0.35* 0.03 0.27* 0.5**
lag-1 0.31* 0.27* 0.47** 0.42**
lag-2 0.12 0.44** 0.38** 0.32*
lag-3 0.11 0.44** 0.32* -0.12
lag-4 0.22 0.36** -0.21 0.11
In order to display the spatial relationships between the seasonal precipitation and ENSO, the spatial patterns of the seasonal correlation coefficient results are provided in Figure 10. In this paper, we should note that we only provide the spatial patterns of lag-0 CC results for each season and the other lag CC patterns are not considered. For MAM, except the parts of northwestern Kazakhstan, the CC values are positive in Central Asia during 1951-2013 (Figure 10a). More than 30% regions have the significant CC values which mainly occur in eastern Kazakhstan, Kyrgyzstan, Tajikistan and most parts of Xinjiang (such as Junggar Basin, Turfan Depression and southeastern Xinjiang). Figure 10b shows that the CC values are disorderly distributed over the entire region with positive or negative values for JJA, and the area with significant values is less than 5%. From Figure 10c, most areas of Central Asia (71%) have positive correlations between the SON precipitation and ENSO, and the areas (12%) with significantly positive values mainly appear in eastern and southern CAS5. The negative values occur in parts of western Kazakhstan, Turfan Depression and Tarim Basin. For DJF, except the negative values in southwestern Xinjiang, more than 92% regions have the positive values and the significant regions mainly appeared over CAS5 (Figure 10d).
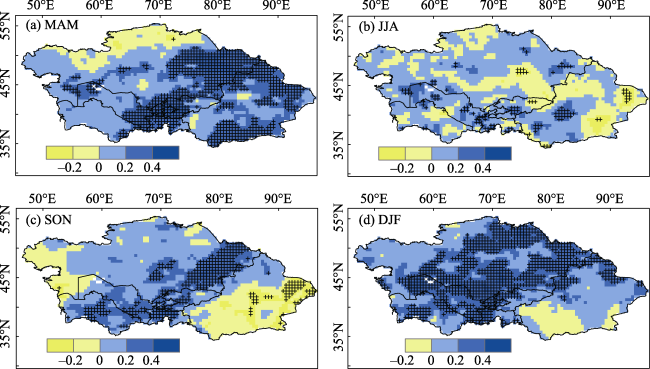
Figure 10 Spatial distributions of the correlation coefficients of the inter-annual signals between the seasonal precipitation and Niño 3.4 during 1951-2013, where the cross symbols are the correlation coefficient values significantly at 95% confidence level
In summary, ENSO has significantly positive impact on the precipitation in MAM, SON and DJF during 1951-2013, although the impact on SON becomes weak after 1966. However, the influence of ENSO on JJA precipitation is weak. In addition, the main affected regions by ENSO are different for the three seasons which suggests that the precipitation of MAM, SON and DJF may be controlled by different atmospheric circulations during ENSO events. Therefore, the possible physical mechanisms associated with the seasonal precipitation should be discussed from the perspective of ENSO events.

3.6 Composite analysis based on ENSO events

Composite analyses of precipitation and water vapor flux fields using El Niño minus La Niña years (Table 5) are conducted to discuss the possible physical processes during 1951-2013. Because of the weak influence of ENSO on the JJA precipitation, in this section, we only consider MAM, SON and DJF. During El Niño, there are more precipitation than the normal ENSO and La Niña over most parts of Central Asia, especially the middle southern region (Figure 11). For MAM, most of the areas with the positive anomalies are significant at 95% confidence level (Figure 11a). While only few areas have significant differences for SON and DJF (Figures 11b and 11c) which may be caused by their little precipitation. Furthermore, the composite differences of the three seasons have similar spatial distributions as the correlation coefficients between the seasonal precipitation and Niño 3.4 (Figures 10 and 11).
Table 5 El Niño and La Niña years used in the composite analyses
Season El Niño La Niña
MAM 1958, 1969, 1983, 1987, 1992,
1993, 1998, 2005, 2010
1955, 1956, 1967, 1968, 1971, 1974,
1975, 1985, 1989, 1999, 2000, 2008
JJA 1957, 1965, 1972, 1982, 1987, 1991,
1992, 1997, 2002, 2004, 2009
1954, 1955, 1956, 1964, 1970, 1973,
1974, 1975, 1988, 1999, 2010
SON 1965, 1972, 1982, 1987, 1991,
2002, 2004, 2006, 2009
1954, 1955, 1964, 1970, 1973, 1975,
1988, 1998, 1999, 2010
DJF 1957, 1965, 1972, 1982, 1986,
1991, 1994, 1997, 2002, 2009
1955, 1970, 1973, 1975, 1988, 1998,
1999, 2007, 2010
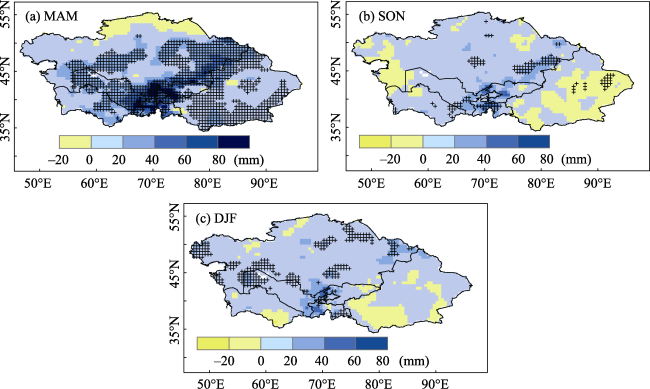
Figure 11 The El Niño minus La Niña composite difference in seasonal precipitation: (a) MAM, (b) SON and (c) DJF during 1951-2013, where the cross symbols are the different values significantly at 95% confidence level
From the composite result of the water vapor flux, southwesterly water vapor fluxes generated in Indian and western Pacific Oceans enhanced the MAM precipitation over middle and south Central Asia during warm ENSO events (Figure 12a). Particularly, the above water vapor fluxes have the following major paths: Saudi Arabia (sourced in Indian Ocean)→Iraq→Iran→Central Asia and the Mediterranean Sea (sourced in western Atlantic Ocean)→Libya→Iraq→Iran→Central Asia. In addition, a northeastern water vapor flux from Russia (sourced in the Arctic Ocean) increased the MAM precipitation over north Central Asia. For the SON precipitation, the southwesterly flux brings moisture to middle and south Central Asia across the Arabian Peninsula (Figure 12a). Compared with the water vapor flux of MAM and SON, there are two major water vapor flux transport paths for the DJF precipitation: one path (generated in Indian and western Pacific Oceans) is the Arabic Sea→India→Pakistan→Afghanistan→Central Asia; the other path is the Mediterranean Sea→Turkey→the Black Sea→Central Asia (Figure 12c). It should be noted that MAM has more water vapor fluxes than SON and DJF which is agreed with the more precipitation in MAM over Central Asia. Moreover, the north water vapor fluxes are only detected in MAM. Overall, the above analyses suggest that the southwesterly water vapor flux from the Arabic Sea and Africa is the source of Central Asia precipitation during El Niño. Among the seasons, MAM has the largest precipitation which is associated with the largest water vapor flux. Furthermore, these water vapor fluxes are mainly generated in Indian and western Pacific Oceans. These results are consistent with previous studies by Mariotti (2007) and Hu et al. (2017).
Figure 12 The El Niño minus La Niña composite difference in moisture flux: (a) MAM, (b) SON and (c) DJF during 1951-2010
The corresponding seasonal divergence of the total moisture fluxes (only including the region: 30°-120°E and 30°-90°N) are displayed in Figure 13. The MAM divergences of the total moisture fluxes have the negative anomalies across most areas of Central Asia with the center in the middle southern regions (Figure 13a) which indicate the water vapor convergence and result in the more precipitation in El Niño years than La Niña years (Figure 11a). Furthermore, the negative anomaly center of the MAM moisture divergences over the middle southern regions is statistically significant at 95% confidence level (p<0.05). For the other two seasons (SON and DJF in Figures 13b and 13c), the negative anomalies mostly occur over CAS5 and the positive anomalies appear in large areas of Xinjiang which superimpose with the total moisture flux anomalies to illustrate the spatial patterns of the precipitation in Figures 11b and 11c.
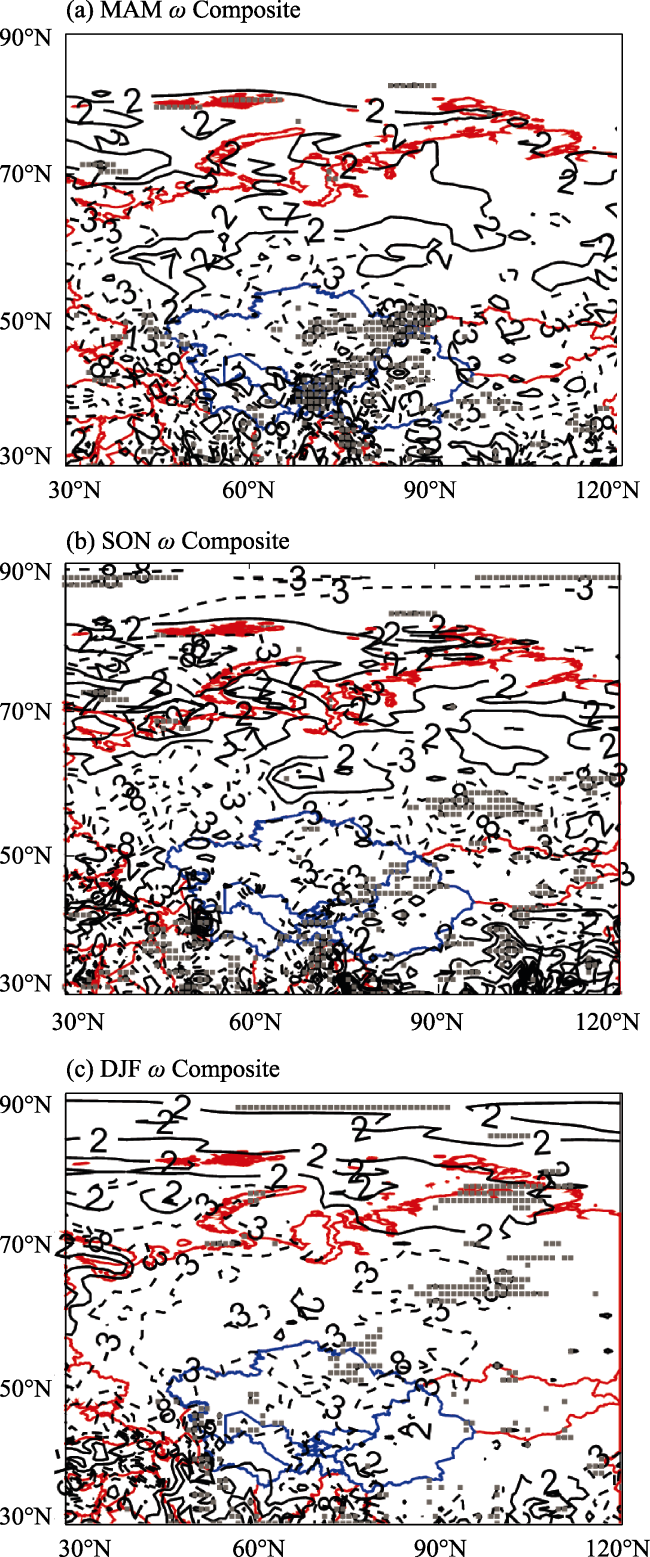
Figure 13 ENSO-based composites of divergences of the total moisture fluxes for MAM, SON and DJF during 1950-2013. The contour interval is 5×10⁻⁶ kg/m2/s and the gray areas denote regions significant at the 95% level (p<0.05) by the student’s t-test. The zero contour is omitted and dashed lines are negative.

3.7 Atmospheric circulation response to ENSO

Comparing with La Niña, most of the low-latitude region south of 40°N is dominated by significantly anomalous high pressure when El Niño occurs in spring. North of this abnormal high pressure, there is a weak low pressure anomaly center across Eastern Europe to the western part of Central Asia, with a deeper trough around the Mediterranean Sea and a high pressure ridge in Middle East region (Figure 14a). Such atmospheric circulation pattern enhances the westerly (Figure 14b) and thus is favorable for transporting lager amount of water vapor from the Mediterranean Sea and Indian Ocean to Central Asia (Wang et al., 2014; Huang et al., 2015). That is the southwestern and western water vapor path for Central Asia reinforces during El Niño. In addition, another significant high pressure centre exists over Barents Sea and cooperates with the anomalous low pressure center, and then results in enhanced northeastlies and cold moisture from Arctic Ocean (northern moisture path). The similar pattern is also found in the upper troposphere (Figures 14a and 14b). The cold and warm moisture air flow meet around Central Asia and thereby causes a rainy spring during El Niño.
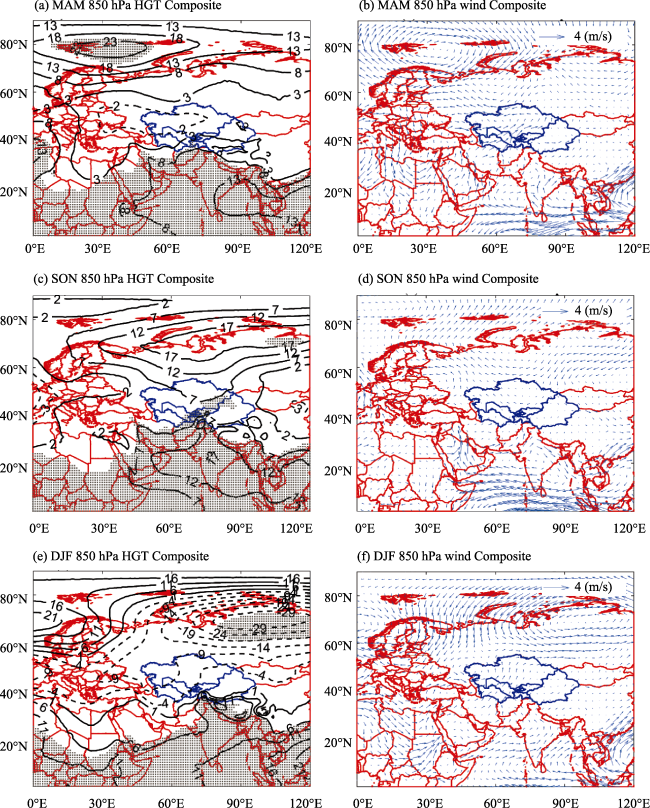
Figure 14 ENSO-based composites of geopotential height (HGT) (left column) and wind for MAM, SON and DJF at 850 hPa during 1950-2013. The contour interval is 5 m for HGT and the gray areas denote regions significant at the 95% level (p<0.05) by the student’s t-test. The zero contour is omitted and dashed lines are negative.
In autumn, vast range of positive anomalies in geopotential height still appears south of 40°N when El Niño occurs, and thereby strengthening the warm and moist southwesterly to Central Asia and thus more precipitation. While there is no negative pressure anomalies over Central Asia and at the same time an abnormal high pressure dominates the whole region of Eurasia mid-high latitude, with an anomalous anticyclonic ridge in the lower troposphere around Central Asia (Figure 14c). In front of such anticyclonic ridge, anomalous northeasterly meets with moist southwesterly and thereby enhancing the convergence and upward motion in eastern and southern CAS5 (Figure 14d), which explains well the abundant precipitation particularly in these regions during El Niño autumn. In the upper troposphere, there is an obvious tripole structure in the meridional direction, and Central Asia is between the anomalous high- and low-pressure center (Figure 15c) and thus experiences a weakened westerly jet (Figure 15d). It implies the western water vapor path fails in autumn when El Niño occurs, which explains to some extent why the El Niño-induced precipitation in autumn is less than that in spring.
Figure 15 Same as Figure 14 but for 200 hPa
As for wintertime, the southeastern water vapor path sourced in Indian Ocean is stronger because of the significantly positive geopotential height in the low latitudes. Meanwhile, most of middle-high latitudes is under the control of abnormal low pressure, with the center around the Siberia (Figures 14e and 14f). Above atmospheric circulation pattern also results in a much stronger westerly and thus strengthens the western water vapor path for Central Asia (Wang et al., 2014). At the same time, the anomalous high pressure center in upper troposphere cooperates with the anomalous low pressure center in lower troposphere over Central Asia (Figures 15e and 15f), which promote the water vapor convergence upward movement and causes the winter more precipitation in these regions.

4 Discussion

4.1 Comparison of this study with prior studies

Our results show that the precipitation experienced increasing trend in MAM and DJF over Central Asia during 1901-2013, which is consistent with the rising trend at the same seasons in Pacific Northwest of the United States (Abatzoglou et al., 2014, Table 6). In consistent with the increased seasonal precipitation over mid to high latitudes of Northern Hemisphere during the past half century (Sarojini et al., 2012; Noake et al., 2012), Central Asia has the increasing trends at seasonal scales during 1951-2013 (Table 6). Of which, the predominantly increased areas occurred in Xinjiang, which is obtained by recent studies based on the precipitation recording from stations (Wang and Yan, 2010; Li et al., 2011). But it is decreased for the seasonal precipitation over Iberian Peninsula (De Luis et al., 2009; De Luis et al., 2010) during 1946-2005 and 1951-2000. For the period of 1979-2013, JJA precipitation has increasing trend over Central Asia and this increasing trend of JJA is also detected over southeastern and northwestern China during 1978-2002 (Yao et al., 2008). Furthermore, among the four seasons MAM and DJF have the largest trends during the three periods.
Table 6 Comparison of decadal seasonal precipitation change rate (mm/10a or %/10a) of Central Asia from 1901 to 2013 from this study to rates reported in other studies, where + means increasing trend, - means decreasing trend, CMIP5 (Coupled Model Intercomparison Project, phase 5), MOPREDAS (Monthly Precipitation Database of Spain), USHCN v2.5 (U.S. Historical Climate Network, version 2.5), Climatic Research Unit (CRU) TS3.21 dataset, NH (Northern Hemispheres)
Studies Study
area
Study
period
Data MAM JJA SON DJF
Abatzoglou
et al. (2014)
Pacific
Northwest
of the United
States
1901-2012 USHCN v2.5, PRISM, CRU TS3.21 and U.S. climate division
dataset
1.8%/10a 1.3%/10a 0 0.2%/10a
Noake et al.
(2012)
Globe 1952-1999 VASClimO, Zhang, CRU
and CMIP3
+mid to high
latitude of NH
+ mid to high
latitude
of NH
+ mid to
high
latitude
of NH
+mid to
high
latitude
of NH
Sarojini et al.
(2012)
Globe 1951-2005 Zhang and
CMIP5
+ high latitude
of NH
+ high latitude
of NH
+ high
latitude
of NH
+ high
latitude
of NH
Yao et al.
(2008)
Asia 1978-2002 Gridded dataset
from Xie et al.
(2007)
+ southeastern
and northwestern
China
Wang and
Yan (2009)
China 1961-2007 587 stations + northwestern China + northwestern
China
+ northwestern China + north-
western
China
De Luis et al.
(2010)
Iberian
Peninsula
1946-2005 MOPREDA - + -
De Luis et al.
(2009)
Mediter-
ranean
Iberian
Peninsula
1951-2000 MOPREDA -5.5
mm/10a
-4.4 mm/10a -1.8 mm/10a -2.2 mm/10a
Li et al.(2011) Xinjiang 1961-2005 65 stations -1.08 mm/10a 1.8 mm/10a 2.1 mm/10a
Our study Central
Asia
1901-2013 GPCC V7 0.41 mm/10a -0.09 mm/10a -0.1 mm/10a 0.39 mm/10a
1951-2013 0.49 mm/10a 0.4 mm/10a 0.23 mm/10a 0.77 mm/10a
1979-2013 0.42 mm/10a 1.62 mm/10a -1.97 mm/10a 0.24 mm/10a
As for the ENSO-related precipitation in other regions, ENSO also has large impacts on the variations of the seasonal precipitation over Central Asia. Specially, precipitation in MAM, SON and DJF over Central Asia are significantly positively correlated with ENSO which agree with the results obtained in southwest Central Asia (Mariotti, 2007), southwest Asia (Hoell et al., 2012, 2015, 2017), Yangtze River basin, China (Xiao et al., 2015) and northwestern China (Li et al., 2016). In Europe, significant ENSO-associated changes in precipitation are evident during the boreal spring and fall seasons, marginal during boreal summer, and absent during boreal winter (Shaman, 2014). The strong links between ENSO and MAM precipitation also existed in the region 47.5°-52.5°N, 35°E-5°W of Europe from 1851 to 1993 (Van Oldenborgh et al., 2000). During summer and fall increased precipitation over southern Europe occurs when El Niño conditions prevail in the equatorial Pacific (Park, 2004). It has been found that wintertime precipitation increased over Britain, France, and Germany during the El Niño events, but precipitation decreased over Scandinavia (Zanchettin et al., 2008).
These ENSO teleconnections to seasonal precipitation can provide an approach to predict the precipitation at regional and global scales (Van Oldenborgh et al., 2000; Chiodi and Harrison 2015), and obviously can be applied to the seasonal precipitation over Central Asia.Moreover, according to the composite analyses of our results, Mariotti (2007) suggested that enhanced precipitation in southwest Central Asia during warm ENSO events results from an anomalous southwesterly water vapor flux across the Arabian Peninsula coming from the Arabian Sea and tropical Africa, which is generated along the northwestern flank of the high pressure anomaly over the Indian and western Pacific Oceans, part of the ENSO see pressure anomalies.
Furthermore, the lagged associations between the seasonal ENSO and seasonal precipitation are detected over Central Asia, especially the persistent influences of ENSO in SON and DJF on the following JJA precipitation. Although the ENSO signals in JJA have little influence on the synchronous precipitation over Central Asia, it has significant positive lag-impact on the September-August precipitation in these regions (Table 4). Evidence for lagged correlations between Northern Hemisphere wintertime ENSO conditions and precipitation the following spring has also observed in many other regions, including southwestern Europe (Knippertz et al., 2003), central Europe (Lloyd-Hughes and Saunders, 2002), and Scandinavia (Feddersen, 2003). These lag associations may be caused by the seasonal persistence of SST anomalies in the tropical Pacific (Shaman, 2014).

4.2 Relationships between the seasonal precipitation, temperature and NDVI

It is known that there exist strong relationships between precipitation and temperature at global and regional scales (e.g. Madden and Williams, 1978; Zhao and Khalil, 1993; Trenberth and Shea, 2005; Berg et al., 2009) due to the close links between the air’s moisture-holding capacity and the temperature. Over land, negative correlations dominate because the dry conditions favor more sunshine and less evaporative cooling, while wet summers are cool. Positive correlations dominate over high latitudes in winter because warm moist advection in extratropical cyclones favors precipitation and the water holding capacity of the atmosphere limits precipitation amounts in cold conditions (Trenberth and Shea, 2005).
For Central Asia, increasing trend of the surface temperature has been detected in the 20th century, especially for MAM during 1979-2013 (Hu et al., 2014). In this section, we explore the relationship between the seasonal precipitation and temperature. The temperature is from the global monthly CRU TS 3.24 dataset with the spatial resolution of 0.5°×0.5° during 1901-2015 (https://crudata.uea.ac.uk/cru/data/hrg/cru_ts_3.24/). Negative correlations are obtained between the precipitation and temperature in MAM and JJA during the three periods (Table 7), especially for JJA (CC=-0.24) during 1901-2013 which is consistent with the dry conditions following more sunshine and wet summers being cool (Trenberth and Shea 2005). The SON precipitation is positively correlated with the temperature during 1901-2013 and 1951-2013, and it is a negative correlation for 1979-2013. In DJF, the precipitation is positively correlated with the temperature for the three periods, and which is caused by the warm moist advection in extratropical cyclones favors precipitation and the water holding capacity of the atmosphere limits precipitation amounts in cold conditions (Trenberth and Shea, 2005).
Moreover, we detect the relationships between the seasonal precipitation and the normalized difference vegetation index (NDVI) over Central Asia during 1982-2012. The NDVI data with a spatial resolution of 8 km × 8 km and 15-day interval are downloaded from the Global Inventory Monitoring and Modeling Studies (GIMMS) group derived from the advanced very high-resolution radiometer (AVHRR) of the National Oceanic and Atmospheric Administration (NOAA) Land dataset for the period January 1982 to December 2012 (ftp://ftp.glcf.umiacs.umd.edu/glcf/GIMMS/, Tucker et al., 2005). NDVI is resampled to the same spatial resolution of GPCC using the bilinear interpolation method. Table 7 displays that the NDVI of MAM and JJA are positively correlated with the precipitation and it is significant at 99% confidence level for JJA (CC=0.57, p<0.01). Negative correlations are detected for SON and DJF. Furthermore, strong positive correlations are found between MAM precipitation and JJA NDVI (CC=0.65, p<0.01), and between JJA precipitation and SON NDVI (CC=0.49, p<0.01) which indicates the time lags of the influence of the precipitation on NDVI. These results suggested that the vegetation NDVI in Central Asia is mainly controlled by the precipitation during 1982-2012. The increasing precipitation and warming temperature of MAM and JJA provide favorable water-heat condition to improve the vegetation over Central Asia.
Table 7 Correlation coefficient (CC) results between the seasonal precipitation and temperature during the three periods, and between the seasonal precipitation and the normalized difference vegetation index (NDVI) during 1982-2012, where the CC values are obtained by the linear least square method and ** significant at a 99% confidence level by student’s t test
Variable Period MAM JJA SON DJF
Temperature 1901-2013 -0.06 -0.24 0.15 0.27
1951-2013 -0.13 -0.15 0.01 0.1
1979-2013 -0.05 -0.13 -0.17 0.14
NDVI 1982-2012 0.18 0.57** -0.32 -0.01

5 Conclusions

The evolutions of the seasonal precipitation of Central Asia were comprehensively analyzed during the last century based on the latest global monthly precipitation dataset GPCC V7. The spatiotemporal features of the seasonal precipitation were discussed using the linear least square method, EEMD method and EOF method. Furthermore, the relationships between the seasonal precipitation and ENSO over Central Asia were explored to reveal the influences of the ENSO on the seasonal precipitation variabilities. The ENSO-based composites of HGT, U- and V-wind field, and the total moisture fluxes and their divergences were analyzed to explain the possible physical mechanisms about the ENSO-related seasonal precipitation over Central Asia.
Among the four seasons, MAM and JJA have the main contribution to the annual precipitation with the largest precipitation in MAM (mean=59 mm) over Central Asia. For the last century (1901-2013), increasing trends are found in MAM and DJF with the rates of 0.41 mm/10a and 0.39 mm/10a, while decreasing trends are for JJA and SON. During 1951-2013, four seasons have the increasing precipitation with the largest trend in DJF (k=0.77 mm/10a). For 1979-2013, except the decreasing trend in SON, the other seasons have the increased precipitation, and the largest increasing trend appears in JJA (k=1.62 mm/10a). In addition, EEMD results show that the inter-annual signals with 3-7 years multi-periods are the dominant components for all the seasonal precipitation during 1901-2013. Compared with the entire region, the precipitation in the mountainous area has obvious seasonal variation in terms of the variability but also the change rates, relatively to that in the plain area.
Spatial distributions of the linear trends suggested that Xinjiang has been experienced the decreasing seasonal precipitation during 1901-2013 and increasing seasonal precipitation during 1951-2013. But for the period of 1979-2013, the spatial features of the linear trends over Xinjiang appear large difference with almost all positive trends in DJF. For CAS5, the linear trends of the four seasons have different spatial distributions during our study periods. But it is confirmed that over northern Kazakhstan the precipitation has positive trends in MAM and JJA and negative trends in SON and DJF during the last three decades (1979-2013). EOF results show that the spatial distribution of EOF-1 mode in JJA is different from those of the other seasons during 1901-2013 which may be caused by different climate systems.
Furthermore, the relationships between the seasonal precipitation and ENSO show that ENSO has significantly positive influence on the variations of the seasonal precipitation (p<0.05) except JJA during 1951-2013. The composite analysis results suggest that during El Niño, there are more precipitation than the normal ENSO and La Niña over most parts of Central Asia, especially over the middle southern region. Southwesterly water vapor flux from the Arabic Sea and Africa is the source of Central Asia precipitation during El Niño. These water vapor fluxes are mainly generated in Indian and North Atlantic Oceans. The corresponding ENSO-based composites illustrated the possible physical mechanisms about the ENSO-related seasonal precipitation over Central Asia.
Finally, the relationships between the seasonal precipitation and temperature show that negative correlation is found in JJA, and positive correlation is found in DJF which are agree with the result in Trenberth and Shea (2005). For the arid and semiarid region over Central Asia, the precipitation in MAM and JJA is one major controller on the vegetation growth.

The authors have declared that no competing interests exist.

[1]
Abatzoglou J, Rupp D, Mote P, 2014. Seasonal climate variability and change in the Pacific northwest of the United States.Journal of Climate, 27: 2125-2142.Observed changes in climate of the U.S. Pacific Northwest since the early twentieth century were examinedusing four different datasets. Annual mean temperature increased by approximately 0.6掳-0.8掳C from 1901 to2012, with corroborating indicators including a lengthened freeze-free season, increased temperature of thecoldest night of the year, and increased growing-season potential evapotranspiration. Seasonal temperaturetrends over shorter time scales (<50 yr) were variable. Despite increased warming rates in most seasons overthe last half century, nonsignificant cooling was observed during spring from 1980 to 2012. Observations showa long-term increase in spring precipitation; however, decreased summer and autumn precipitation and increasedpotential evapotranspiration have resulted in larger climatic water deficits over the past four decades.A bootstrapped multiple linear regression model was used to better resolve the temporal heterogeneity ofseasonal temperature and precipitation trends and to apportion trends to internal climate variability, solarvariability, volcanic aerosols, and anthropogenic forcing. The El Ni o-Southern Oscillation and the Pacific-North American pattern were the primary modulators of seasonal temperature trends on multidecadal timescales: solar and volcanic forcing were nonsignificant predictors and contributed weakly to observed trends.Anthropogenic forcing was a significant predictor of, and the leading contributor to, long-term warming;natural factors alone fail to explain the observed warming. Conversely, poor model skill for seasonal precipitationsuggests that other factors need to be considered to understand the sources of seasonal precipitationtrends.

DOI

[2]
Aizen V, Aizen E, Melack Jet al., 1997. Climatic and hydrologic changes in the Tien Shan, Central Asia.Journal of Climate, 10: 1393-1404.The authors analyze climatic hydrologic data from 110 sites collected from the middle of the twentieth century to the present in the Tien Shan, one of the largest mountain systems of central Asia. In spite of a few confounding interregional variations in the temporal changes of surface air temperature, precipitation, runoff, glacier mass, and snow thickness in the Tien Shan, it has been possible to establish statistically significant long-range, with slightly lower values below 2000-m elevation. The precipitation in the Tien Shan increased 1.2 mm yr{sup -1} over the past half-century. The precipitation increase is larger at low altitudes in the northern and western regions than at altitudes above 2000 m. A decrease in snow resources occurred almost everywhere in the Tien Shan; the maximum snow thickness an snow duration have decreased on average 10 cm and 9 days, respectively. The annual runoff is the type of precipitation (liquid or solid). Over the last few decades, periods of glacier decline have coincided with declining river runoff. 45 refs., 8 figs., 2 tabs.

DOI

[3]
Aizen E, Aizen V, Melack Met al., 2001. Precipitation and atmospheric circulation patterns at mid-latitudes of Asia.International Journal of Climatology, 21: 535-556.Analyses of the coupling between large-scale atmospheric patterns and modifications of regional precipitation regimes at seasonal and annual time scales in different terrain of mid-latitudes in Asia, including western Siberia, Tien Shan and Pamir mountains, and plains of middle Asia and Japanese Islands, were examined based on data from 57 and 88 hydro-climatic stations with 100 and 60 year records, respectively. For the past 100 years, a positive trend in precipitation was revealed in western Siberia, northern regions of Tien Shan and Japanese Islands. North Atlantic Oscillation (NAO) and West Pacific Oscillation (WPO) indices have inverse associations, with average amount of precipitation in western Siberia and in mountains and plains of middle Asia, and positive correlation in central and western regions of Japanese Islands. The Pacific North American (PNA) index is positively correlated with annual precipitation over most of the Japanese Islands. Northern Asian (NA) positive anomalies lead to decrease in winter precipitation in the western and eastern regions of Japanese Islands. We did not find significant impact of PNA or NA on precipitation in middle Asia. We suggest that during the last century, impacts of the western jet stream increased in the northern regions of Tien Shan and Japanese Islands, and weakened in the eastern Japanese Islands. There is a suggestion that conditions are more favourable for precipitation development over continental regions of Asia when the Siberian High is positioned further to the east than further to the west. During dominant development of a zonal atmospheric pattern, the annual and seasonal precipitation decreased over most regions in continental Asia and central Japan.

DOI

[4]
Becker A, Finger P, Meyer-Christoffer Aet al., 2013. A description of the global land-surface precipitation data products of the Global Precipitation Climatology Centre with sample applications including centennial (trend) analysis from 1901-present.Earth System Science Data, 5: 71-99.

[5]
Berg P, Haerter J, Thejll Pet al., 2009. Seasonal characteristics of the relationship between daily precipitation intensity and surface temperature.Journal of Geophysical Research, 114: D18102.1] Past studies have argued that the intensity of extreme precipitation events should increase exponentially with temperature. This argument is based on the principle that the atmospheric moisture holding capacity increases according to the Clausius-Clapeyron equation and on the expectation that precipitation formation should follow accordingly. We test the latter assumption by investigating to what extent a relation with temperature can be observed intraseasonally in present-day climate. For this purpose, we use observed and simulated daily surface temperature and precipitation over Europe. In winter a general increase in precipitation intensity is indeed observed, while in summer we find a decrease in precipitation intensity with increasing temperature. We interpret these findings by making use of model results where we can distinguish separate precipitation types and investigate the moisture content in the atmosphere. In winter, the Clausius-Clapeyron relationship sets a limit to the increase in the large-scale precipitation with increasing temperature. Conversely, in summer the availability of moisture, and not the atmosphere's capacity to hold this moisture, is the dominant factor at the daily timescale. For convective precipitation, we find a peak like structure which is similar for all subregions, independent of the mean temperature, contrary to large-scale precipitation which has a more monotonic dependence on temperature.

DOI

[6]
Bintanja R, Selten F, 2014. Future increase in Arctic precipitation linked to local evaporation and sea-ice retreat.Nature, 509: 479-482.Precipitation changes projected for the end of the twenty-first century show an increase of more than 50 per cent in the Arctic regions. This marked increase, which is among the highest globally, has previously been attributed primarily to enhanced poleward moisture from lower latitudes. Here we use state-of-the-art global climate models to show that the projected increases in Arctic precipitation over the twenty-first century, which peak in late autumn and winter, are instead due mainly to strongly intensified local surface evaporation (maximum in winter), and only to a lesser degree due to enhanced moisture inflow from lower latitudes (maximum in late summer and autumn). Moreover, we show that the enhanced surface evaporation results mainly from retreating winter sea ice, an amplified Arctic hydrological cycle. This demonstrates that increases in Arctic precipitation are firmly linked to Arctic warming and sea-ice decline. As a result, the Arctic mean precipitation sensitivity (4.5 per cent increase per degree of temperature warming) is much larger than the global value (1.6 to 1.9 per cent per kelvin). The associated seasonally varying increase in Arctic precipitation is likely to increase river discharge and snowfall over ice sheets (thereby affecting global sea level), and could even affect global climate through freshening of the Arctic Ocean and subsequent modulations of the Atlantic meridional overturning circulation.

DOI PMID

[7]
Brown C, 1998. Applied Multivariate Statistics in Geohydrology and Related Sciences. Berlin Heidelberg: Springer, 155-157.

[8]
Chen F, Huang W, Jin Let al., 2011. Spatiotemporal precipitation variations in the arid Central Asia in the context of global warming,Science China Earth Sciences, 54: 1812-1821.This study analyzed the temporal precipitation variations in the arid Central Asia (ACA) and their regional differences during 1930-2009 using monthly gridded precipitation from the Climatic Research Unit (CRU). Our results showed that the annual precipitation in this westerly circulation dominated arid region is generally increasing during the past 80 years, with an apparent increasing trend (0.7 mm/10 a) in winter. The precipitation variations in ACA also differ regionally, which can be divided into five distinct subregions (I West Kazakhstan region, II East Kazakhstan region, III Central Asia Plains region, IV Kyrgyzstan region, and V Iran Plateau region). The annual precipitation falls fairly even on all seasons in the two northern subregions (regions I and II, approximately north of 45N), whereas the annual precipitation is falling mainly on winter and spring (accounting for up to 80% of the annual total precipitation) in the three southern subregions. The annual precipitation is increasing on all subregions except the southwestern ACA (subregion V) during the past 80 years. A significant increase in precipitation appeared in subregions I and III. The long-term trends in annual precipitation in all subregions are determined mainly by trends in winter precipitation. Additionally, the precipitation in ACA has significant interannual variations. The 2-3-year cycle is identified in all subregions, while the 5-6-year cycle is also found in the three southern subregions. Besides the inter-annual variations, there were 3-4 episodic precipitation variations in all subregions, with the latest episodic change that started in the midto late 1970s. The precipitations in most of the study regions are fast increasing since the late 1970s. Overall, the responses of ACA precipitation to global warming are complicated. The variations of westerly circulation are likely the major factors that influence the precipitation variations in the study region.

DOI

[9]
Chen L, Dool H, Becker Eet al., 2017. ENSO Precipitation and temperature forecasts in the North American multimodel ensemble: Composite analysis and validation.Journal of Climate, 30: 1103-1125.Figure 1 shows the La Nina P anomaly composites for NDJFM based on 1982-2010 and 1950-2010 observations, NMME, and the six models. All model and the 1950-2010 observed composites present drier than normal conditions over the southern U.S. and enhanced rainfall over the Pacific Northwest, consistent with the pattern suggested by Ropelewski and Halpert (1986, 1987). The 1982-2010 observed NDJFM P anomaly composite also displays similar La Nina pattern to the 1950-2010 observed. In contrast to the NMME and 1950-2010 observed composites, the 1982-2010 observed has below-normal rainfall over the Pacific Northwest, likely a sampling error due to small sample size. There are some variations among the six models but all models are reasonably good. CFSv2 has the biggest North-South contrast in the anomalies and its dry area is spread farther into central Mexico, while both CanCM models produce large negative deviation over the southeastern U.S. Despite the subtle differences, the remarkable similarity between the NMME and observed P anomaly composites under both El Nino (not shown) and La Nina conditions demonstrates the

DOI

[10]
Chiodi A, Harrison D, 2015. Global seasonal precipitation anomalies robustly associated with El Niño and La Niña Events: An OLR perspective.Journal of Climate, 28: 6133-6159.

[11]
Chou C, Chiang J, Lan Cet al., 2013. Increase in the range between wet and dry season precipitation.Nature Geoscience, 6: 263-267.Global temperatures have risen over the past few decades. The water vapour content of the atmosphere has increased as a result, strengthening the global hydrological cycle(1-4). This, in turn, has led to wet regions getting wetter, and dry regions drier(1-6). Climate model simulations suggest that a similar intensification of existing patterns may also apply to the seasonal cycle of rainfall(7). Here, we analyse regional and global trends in seasonal precipitation extremes over the past three decades, using a number of global and land-alone observational data sets. We show that globally the annual range of precipitation has increased, largely because wet seasons have become wetter. Although the magnitude of the shift is uncertain, largely owing to limitations inherent in the data sets used, the sign of the tendency is robust. On a regional scale, the tendency for wet seasons to get wetter occurs over climatologically rainier regions. Similarly, the tendency for dry season to get drier is seen in drier regions. Even if the total amount of annual rainfall does not change significantly, the enhancement in the seasonal precipitation cycle could have marked consequences for the frequency of droughts and floods.

DOI

[12]
Dai A, Fung I, Del Genio A, 1997. Surface observed global land precipitation variations during 1900-1988.Journal of Climate, 10: 2943-2962.

[13]
Dai A, Wigley T, 2000. Global patterns of ENSO-induced precipitation.Geophysical Research Letters, 27: 1283-1286.Although there have been many analyses of El Ni o/Southern Oscillation (ENSO) induced precipitation anomalies, global patterns from these analyses remain incomplete. Here we combine recent satellite estimates of oceanic precipitation and historical rain-gauge records to derive a global climatology of ENSO-induced precipitation anomalies using empirical orthogonal function (EOF) analyses. The patterns suggest that the re-arrangement of convection centers of the Walker circulation during ENSO events induces large precipitation anomalies in the tropics, while associated changes in the monsoon systems (through the Hadley cell) over the Pacific, Indian and Atlantic Oceans, and their interactions with midlatitude westerlies generate coherent anomaly patterns over the extratropics. Our results can be used to evaluate climate models and forecast ENSO-induced precipitation anomalies.

DOI

[14]
Dai N, Arikin P, 2017. Twentieth century ENSO-related precipitation mean states in twentieth century reanalysis, reconstructed precipitation and CMIP5 models.Climate Dynamics, 48: 3061-3083.

[15]
De Luis M, Brunetti M, Gonzalez-Hidalgo Jet al., 2010. Changes in seasonal precipitation in the Iberian Peninsula during 1946-2005.Global and Planetary Change, 74: 27-33.The spatial variability of seasonal precipitation regimes in the Iberian Peninsula is overlapped by complex patterns of temporal variability. Consequently, traditionally described space domains of seasonal rainfall regimes in Spain may be changing. In this paper we evaluate seasonal precipitation trends over Spanish conterminous land to determine how these trends are modifying traditionally described seasonal rainfall regimes in the study area. To this end, we used a recently developed high resolution grid (1/10 degree longitude and latitude) derived from the MOPREDAS database, comprising 2670 complete and homogeneous monthly precipitation series for the 1946–2005 period, and calculated and compared the seasonal precipitation regimes observed in two consecutive 30-year periods (1946–1975 and 1976–2005). We found that, from the total of 24 possible permutations between winter, spring, summer and autumn as dominant and subdominant precipitation seasons, 12 coexist over Spanish conterminous land. Moreover, there have been notable changes in the last 30 years, affecting not only the most prominent season, but also the variant within each regime. The trends observed therefore indicate that, on comparing the two 30-year subperiods, the percentage of territory in which winter constitutes the dominant precipitation season decreases from 51.1% to 42.7% of the total study area. Similarly, spring was the dominant precipitation season in 36.1% of the territory in the 1946–1975 period, whereas in the 1976–2005 period, it is the dominant one in less than half (15.1%) the territory. This contrasts with areas where autumn constituted the main precipitation season, which increased from 10.8% (restricted to the Mediterranean coast) to 41.4% of the territory. Within the context of climate change, these variations among seasonal precipitation patterns can be explained by (1) a subtropicalization of the IP climate with a reduction of rainfall amounts from winter to summer and (2) an increase in the autumn rainfall percentage.

DOI

[16]
De Luis M, Gonzalez-Hidalgo J, Longares Let al., 2009. Seasonal precipitation trends in the Mediterranean Iberian Peninsula in second half of 20th century.International Journal of Climatology, 29: 1312-1323.This is a study of the changes in annual and seasonal precipitation amounts and variability, during the period 1951-2000, using MOPREDAMES. This dataset includes 1113 complete and homogeneous monthly precipitation time series from the Mediterranean Iberian Peninsula (IP), and corresponds to the five official Spanish hydrological divisions which drain into the Mediterranean Sea. The time series of annual and seasonal precipitation were used to test for trends. The absolute value of the anomaly time series was also tested for trends to identify changes in interannual variability of precipitation. The significance of these changes was assessed using the non-parametric Spearman rank test. The intensities of observed changes, both on mean values and variability, were estimated by using linear regression techniques. Finally, we analysed the area affected by different trends by using raster maps and spatial statistics, in addition to calculating the global balances for the five hydrological divisions. We detected high variability in precipitation regimes and conditions in the study area; nevertheless, a decrease in seasonal and annual precipitation has predominated in the east of the IP during the second half of the 20th century. On an annual scale, precipitation has diminished over 90.1% of the study area. Additionally, a high percentage of the territory was affected by diminishing precipitation at a seasonal level: 85% (of territory) in summer, 82% in spring, 64% during winter and 61% in autumn. Taking the study area as a whole, seasonal precipitation decreases are ranked as follows: summer (-22.5%), spring (-19.3%), winter (-7.3%), and autumn (-5.2%), with a decrease in the value of the global mean annual precipitation - 12.4%. We also detected an increase of precipitation variability in winter (+23.5%) and summer (+11.4%), and a decrease in autumn and spring (-14.9 and - 16.8%, respectively) with a global mean value of + 7.8%. Copyright 2008 Royal Meteorological Society

DOI

[17]
Deflorio M, Pierce D, Cayan Det al., 2013. Western U.S. extreme precipitation events and their relation to ENSO and PDO in CCSM4.Journal of Climate, 15: 4231-4243.Water resources and management over the western United States are heavily impacted by both local climate variability and the teleconnected responses of precipitation to the El Nino-Southern Oscillation (ENSO) and Pacific decadal oscillation (PDO). In this work, regional precipitation patterns over the western United States and linkages to ENSO and the PDO are analyzed using output from a Community Climate System Model version 4 (CCSM4) preindustrial control run and observations, with emphasis on extreme precipitation events. CCSM4 produces realistic zonal gradients in precipitation intensity and duration over the western United States, with higher values on the windward side of the Cascade Mountains and Sierra Nevada and lower values on the leeward. Compared to its predecessor CCSM3, CCSM4 shows an improved teleconnected signal of both ENSO and the PDO to large-scale circulation patterns over the Pacific-North America region and also to the spatial pattern and other aspects of western U.S. precipitation. The so-called drizzle problem persists in CCSM4 but is significantly improved compared to CCSM3. In particular, it is found that CCSM4 has substantially less precipitation duration bias than is present in CCSM3. Both the overall and extreme intensity of wintertime precipitation over the western United States show statistically significant linkages with ENSO and PDO in CCSM4. This analysis provides a basis for future studies using greenhouse gas (GHG)-forced CCSM4 runs.

DOI

[18]
Emerton R, Cloke H, Stephens Eet al., 2017. Complex picture for likelihood of ENSO-driven flood hazard.Nature Communications, 8: 14796.

[19]
Feddersen H.,2003. Predictability of seasonal precipitation in the Nordic region.Tellus, 55A: 385-400.Predictability of seasonal precipitation in the Nordic countries (Denmark, Finland, Iceland, Norway and Sweden) is investigated using a nine-member ensemble of atmospheric general circulation model simulations with prescribed sea-surface temperature from October 1950 until March 1999. The simulations and corresponding observations from 65 stations in the Nordic countries are used to identify large-scale patterns of seasonal precipitation, the predictability of which is investigated. Subsequently, the identified large-scale patterns are used in a statistical downscaling of the model simulated precipitation. The downscaling, which is of the model output statistics type, yields seasonal predictions for the individual stations. The model simulations of precipitation are compared to predictions of precipitation directly from observed sea-surface temperature using a statistical prediction method and no dynamic model. The two different methods give consistent results. It is demonstrated that seasonal precipitation in the Nordic region contains a weak predictable signal in several seasons. The most skilful predictions can be made in spring, especially in the April June season when precipitation appears to be influenced both by tropical and North Atlantic sea surface temperature. In particular, the North Atlantic Oscillation in winter appears to influence the North Atlantic sea-surface temperature in spring, which in turn has an effect on precipitation in Scandinavia.

DOI

[20]
Han T, Wang H, Sun J, 2017. Strengthened relationship between eastern ENSO and summer precipitation over northeastern China.Journal of Climate, 30: 4497-4512.react-text: 149 This paper investigates the variability of the break-up dates of the rivers in Northeast China from their icebound states for the period of 1957–2005 and explores some potential explanatory mechanisms. Results show that the break-up of the two major rivers (the Heilongjiang River and Songhuajiang River) was about four days earlier, and their freeze-up was about 4–7 days delayed, during... /react-text react-text: 150 /react-text [Show full abstract]

DOI

[21]
Harris I, Jones P, Osborn Tet al., 2014. Updated high-resolution grids of monthly climatic observations: The CRU TS3.10 Dataset.International Journal of Climatology, 34: 623-642.

[22]
Hoell A, Barlow M, Saini R, 2012. The leading pattern of intraseasonal and interannual Indian Ocean precipitation variability and its relationship with Asian circulation during the boreal cold season.Journal of Climate, 25: 7509-7526.ABSTRACT The leading pattern of precipitation for the Indian Ocean, one of the most intense areas of rainfall on the globe, is calculated for November–April 1979–2008. The associated regional circulation and thermodynamic forcing of precipitation over Asia are examined at both intraseasonal and interannual time scales. The leading pattern is determined using both empirical orthogonal function analysis of monthly precipitation data and a closely related index of daily outgoing longwave radiation filtered into intraseasonal (33–105 days) and interannual (greater than 105 days) components. The leading pattern has a maximum in the tropical eastern Indian Ocean, and is closely associated with the Madden–Julian oscillation at intraseasonal time scales and related to the El Ni09o–Southern Oscillation at interannual time scales. Both time scales are associated with baroclinic Gill–Matsuno-like circulation responses extending over southern Asia, but the interannual component also has a strong equivalent barotropic circulation. Thermodynamically, both time scales are associated with cold temperature advection and subsidence over southwest Asia, with advection of the mean temperature by the anomalous wind more important at lower and midlevels and advection of the anomalous temperature by the mean wind more important at upper levels. For individual months, the intraseasonal variability can overwhelm the interannual variability. Enhanced Indian Ocean convection persisted for almost the entire 2007/08 season in association with severe drought over southwest Asia, but a strong intraseasonal signal in January 2008 reversed the pattern, resulting in damaging floods in the midst of drought.

DOI

[23]
Hoell A, Barlow M, Cannon Fet al., 2017. Oceanic origins of historical Southwest Asia precipitation during the boreal cold season.Journal of Climate, 30: 2885-2903.While a strong influence on cold season southwest Asia precipitation by Pacific sea surface temperatures (SSTs) has been previously established, the scarcity of southwest Asia precipitation observations prior to 1960 renders the region’s long-term precipitation history largely unknown. Here a large ensemble of atmospheric model simulations forced by observed time-varying boundary conditions for 1901–2012 is used to examine the long-term sensitivity of November–April southwest Asia precipitation to Pacific SSTs. It is first established that the models are able to reproduce the key features of regional variability during the best-observed 1960–2005 period and then the pre-1960 variability is investigated using the model simulations. During the 1960–2005 period, both the mean precipitation and the two leading modes of precipitation variability during November–April are reasonably simulated by the atmospheric models, which include the previously identified relationships with El Ni09o–Southern Oscillation (ENSO) and the multidecadal warming of Indo-Pacific SSTs. Over the full 1901–2012 period, there are notable variations in precipitation and in the strength of the SST influence. A long-term drying of the region is associated with the Indo-Pacific warming, with a nearly 10% reduction in westernmost southwest Asia precipitation during 1938–2012. The influence of ENSO on southwest Asia precipitation varied in strength throughout the period: strong prior to the 1950s, weak between 1950 and 1980, and strongest after the 1980s. These variations were not antisymmetric between ENSO phases. El Ni09o was persistently related with anomalously wet conditions throughout 1901–2012, whereas La Ni09a was not closely linked to precipitation anomalies prior to the 1970s but has been associated with exceptionally dry conditions thereafter.

DOI

[24]
Hoell A, Funk C, Barlow M, 2015. The forcing of Southwestern Asia teleconnections by low-frequency sea surface temperature variability during boreal winter.Journal of Climate, 28: 1511-1526.Southwestern Asia, defined here as the domain bounded by 20°–40°N and 40°–70°E, which includes the nations of Iraq, Iran, Afghanistan, and Pakistan, is a water-stressed and semiarid region that receives roughly 75% of its annual rainfall during November–April. The November–April climate of southwestern Asia is strongly influenced by tropical Indo-Pacific variability on intraseasonal and interannual time scales, much of which can be attributed to sea surface temperature (SST) variations. The influences of lower-frequency SST variability on southwestern Asia climate during November–April Pacific decadal SST (PDSST) variability and the long-term trend in SST (LTSST) is examined. The U.S. Climate Variability and Predictability Program (CLIVAR) Drought Working Group forced global atmospheric climate models with PDSST and LTSST patterns, identified using empirical orthogonal functions, to show the steady atmospheric response to these modes of decadal to multidecadal SST variability. During November–April, LTSST forces an anticyclone over southwestern Asia, which results in reduced precipitation and increases in surface temperature. The precipitation and tropospheric circulation influences of LTSST are corroborated by independent observed precipitation and circulation datasets during 1901–2004. The decadal variations of southwestern Asia precipitation may be forced by PDSST variability, with two of the three models indicating that the cold phase of PDSST forces an anticyclone and precipitation reductions. However, there are intermodel circulation variations to PDSST that influence subregional precipitation patterns over the Middle East, southwestern Asia, and subtropical Asia. Changes in wintertime temperature and precipitation over southwestern Asia forced by LTSST and PDSST imply important changes to the land surface hydrology during the spring and summer.

DOI

[25]
Hu Z, 1997. Interdecadal variability of summer climate over East Asia and its association with 500 hPa height and global sea surface temperature.Journal of Geophysical Research, 102: 403-412.Interdecadal variability of summer climate (rainfall and temperature) in East Asia (China and Japan) and its association with the anomalies of geopotential heights at 500 hPa over the Northern Hemisphere (NH), global sea surface temperature (SSTA), and outgoing longwave radiation (OLR) were examined. An abrupt change was found in the middle and by the end of the 1970s in the variations of time coefficients of the second mode of singular value decomposition (SVD2) for the summer rainfall and temperature in China. The rainfall anomaly around 19770900091979 changes from above normal to below normal, and the temperature changes from below normal to above normal in the southern and southwestern parts of China. A similar interdecadal variability was also found in the summer climate variations in the Southwest Islands of Japan. The 500 hPa height anomalies related to the spatial pattern of SVD2 shows a clear dipole pattern: the negative center is located in Mongolia and northeastern China, and the positive center is located in middle and southern China. The abrupt change of summer climate in the middle and by the end of the 1970s over the subtropical regions of East Asia is characterized with the intensification and westward and southward extension of the western Pacific subtropical high (WPSH). It is also observed in geopotential height variations over Eurasia around 19770900091978. An abrupt change of SST over the tropical Indian Ocean and tropical western Pacific was also found around 19760900091977. It is indicated that interdecadal variability of summer rainfall and temperature over East Asia is largely influenced by the change of SSTA and convective activity in the tropical Indian Ocean and tropical western Pacific. The convective activity over the tropical Indian Ocean and tropical western Pacific is usually enhanced when the SST is warmer than normal, so the subtropical high anomalies over the subtropical regions of East Asia are intensified through the enhancement of a Hadley cell. As a result the subtropical regions of East Asia, including southern and southwestern China and the Southwest Islands of Japan, are covered by a positive height anomaly at 500 hPa, where the temperature is above normal and the rainfall is below normal.

DOI

[26]
Hu Z, Hu Q, Zhang Cet al., 2016a. Evaluation of reanalysis, spatially-interpolated and satellite remotely-sensed precipitation datasets in Central Asia.Journal of Geophysical Research-Atmospheres, 121: 5648-5662.Abstract Accuracy of any gridded climatic datasets is as important as their availability for regional climate and ecological studies. In this study, the accuracy of estimated precipitation in Central Asia from three recently developed reanalysis datasets, MERRA, ERA-Interim and CFSR, is evaluated through comparisons with observations from 399 stations during 1979-2010. An interpolated precipitation dataset from station observations and a satellite remotely-sensed dataset, TRMM 3B42, are included in the evaluation. Major results show that MERRA data have higher accuracy than ERA-Interim and CFSR, although they all overestimate the observed precipitation especially in late spring and early summer months, suggesting errors in their ways of representing convective precipitation in that region. In comparison, the interpolated and satellite sensed data, which provide no upper air information/data, have higher accuracy. While all these datasets have difficulty in describing stations- precipitation in mountainous areas, the reanalysis datasets have particularly large discrepancies. In examining the discrepancy in the reanalysis data, a Precipitation-Topography Partial Least Square method is proposed to incorporate certain terrain/geographic effects on precipitation in mapping the gridded data to the station locations for comparison with the observation. The outcome suggests the estimated station precipitation by this new method is closer to the observed than the method without considering those factors. The improvement by this method and by possible other methods taking into account different details/aspects of the influences indicates that it is only meaningful to compare the accuracy or relevance of gridded datasets to station observations in a relative sense among various datasets.

DOI

[27]
Hu Z, Li Q, Chen Xet al., 2016b. Climate changes in temperature and precipitation extremes in an alpine grassland of Central Asia.Theoretical Applied Climatology, 126: 519-531.The knowledge about impacts of changes in precipitation regimes on terrestrial ecosystems is fundamental to improve our understanding of global environment change, particularly in the context that heavy precipitation is expected to increase according to the 5th Intergovernmental Panel on Climate Change (IPCC) assessment. Based on observed climate data and the Advanced Very High Resolution... [Show full abstract]

DOI

[28]
Hu Z, Yang S, Wu R, 2003. Long-term climate variations in China and global warming signals.Journal of Geophysical Research, 108(D19): 4614.1] In this work, the authors analyze the observed long-term variations of seasonal climate in China and then investigate the possible influence of increases in greenhouse gas concentrations on these variations by comparing the observations with the simulations of the second phase of the Coupled Model Intercomparison Project (CMIP2). The long-term variations of precipitation and temperature in China are highly seasonally dependent. The main characteristic of summer precipitation in China is a drying trend in the north and a wetting trend in the central part. The precipitation in winter shows an increasing trend in southern and eastern-central China. Interesting features have also been found in the transitional seasons. In spring, precipitation variations are almost opposite to those in summer. In autumn the precipitation decreases in almost the whole country except for the middle and lower reaches of the Yangtze River Valley. In addition, the seasonality of precipitation has become slightly weaker in recent decades in southern and eastern China. Pronounced warming is observed in the entire country in winter, spring, and autumn, particularly in the northern part of China. In summer a cooling trend in central China is particularly interesting, and cooling (warming) trends generally coexist with wetting (drying) trends. The correlativity between precipitation and temperature variations is weak in spring, autumn, and winter. It has also been found that the long-term climate variations in winter and summer in China may be connected to the warming trend in the sea surface temperature of the Indian Ocean. A comparison between the observed seasonal climate variations and the CMIP2 simulations of 16 models indicates that the observed long-term variations of winter, spring, and autumn temperature in China may be associated with increases in greenhouse gas concentrations. However, such a connection is not found for the summer temperature. The tremendous uncertainties among the models in precipitation simulations make it difficult to link the precipitation variations to global warming.

DOI

[29]
Hu Z, Zhang C, Hu Qet al., 2014. Temperature changes in Central Asia from 1979-2011 based on multiple datasets.Journal of Climate, 27: 1143-1167.The arid and semiarid region in central Asia is sensitive and vulnerable to climate variations. However, the sparse and highly unevenly distributed meteorological stations in the region provide limited data for understanding of the region’s climate variations. In this study, the near-surface air temperature change in central Asia from 1979 to 2011 was examined using observations from 81 meteorological stations, three local observation validated reanalysis datasets of relatively high spatial resolutions, and the Climate Research Unit (CRU) dataset. Major results suggested that the three reanalysis datasets match well with most of the local climate records, especially in the low-lying plain areas. The consensus of the multiple datasets showed significant regional surface air temperature increases of 0.36°–0.42°Cdecade-1 in the past 33 years. No significant contributions from declining irrigation and urbanization to temperature change were found. The rate is larger in recent years than in the early years in the study period. Additionally, unlike in many regions in the world, the temperature in winter showed no increase in central Asia in the last three decades, a noticeable departure from the global trend in the twentieth century. The largest increase in surface temperature was occurring in the spring season. Analyses further showed a warming center in the middle of the central Asian states and weakened temperature variability along the northwest–southeast temperature gradient from the northern Kazakhstan to southern Xinjiang. The reanalysis datasets also showed significant negative correlations between temperature increase rate and elevation in this complex terrain region.

DOI

[30]
Hu Z, Zhou Q, Chen Xet al., 2017. Variations and changes of annual precipitation in Central Asia over the last century.International Journal of Climatology, 37: 157-170.Abstract This study examines the temporal variations and spatial distributions of annual precipitation over Central Asia during the periods of 1901–2013, 1951–2013, and 1979–2013 using the latest version of Global Precipitation Climatology Centre (GPCC) full data reanalysis version 7 (GPCC V7) data set. The linear trend and multiperiods of the precipitation over the entire region and plain and mountainous area separately are analysed by linear least square method and ensemble empiricalmode decompositionmethod. An overall increasing trend [0.66mm(10 years)611] is found for the entire region during 1901–2013, which is smaller than that of 1951–2013. The regional annual precipitation exhibits multi-decadal variations, with a sharp decline during 1901–1944, followed by an increase until 1980s, and a fluctuation thereafter. During 1979–2013, the mountainous area shows a greater increasing trend than the entire region. Furthermore, the regional annual precipitation has exhibited high-frequency variations with 3-year and 6-year quasiperiods and a low-frequency variation with 28-year quasiperiods. In terms of the spatial distribution, increasing trend in the annual precipitation is found in Xinjiang and decreasing trends appear over the five countries of Central Asia during 1951–2013. Empirical orthogonal function results show that the mountainous area is the large variability centre of the annual precipitation. The dominant mode of interannual variability in Central Asia annual precipitation is related to El Ni09o-Southern Oscillation, which explains about 17% of the interannual variance during 1951–2013. The results of this study describe the long-term variation in the annual precipitation over Central Asia as well as its relationship with some key climate indices in great detail, which will benefit the understanding and the prediction of the climate variations in this region.

DOI

[31]
Hu Z, Zhou Q, Chen Xet al., 2018. Evaluation of three global gridded precipitation datasets in Central Asia based on rain gauge observations.International Journal of Climatology, doi: 10.1002/joc.5510.

[32]
Huang J, Ji M, Xie Yet al., 2016. Global semi-arid climate change over last 60 years.Climate Dynamics, 46: 1131-1150.This study analyzes areal changes and regional climate variations in global semi-arid regions over 61 years (1948-2008) and investigates the dynamics of global semi-arid climate change. The results reveal that the largest expansion of drylands has occurred in semi-arid regions since the early 1960s. This expansion of semi-arid regions accounts for more than half of the total dryland expansion. The area of semi-arid regions in the most recent 15 years studied (1990-2004) is 7 % larger than that during the first 15 years (1948-1962) of the study period; this expansion totaled 0.4 x 10(6) and 1.2 x 10(6) km(2) within the American continents and in the Eastern Hemisphere, respectively. Although semi-arid expansion occurred in both regions, the shifting patterns of the expansion are different. Across the American continents, the newly formed semi-arid regions developed from arid regions, in which the climate became wetter. Conversely, in the continental Eastern Hemisphere, semi-arid regions replaced sub-humid/humid regions, in which the climate became drier. The climate change in drying semi-arid regions over East Asia is primarily dominated by a weakened East Asian summer monsoon, while the wetting of semi-arid regions over North America is primarily controlled by enhanced westerlies.

DOI

[33]
Hughes B, Saunders M, 2002. Seasonal prediction of European spring precipitation from El Niño-Southern Oscillation and local sea-surface temperatures.International Journal of Climatology, 22: 1-14.The extent to which European seasonal precipitation is predictable is a topic of scientific and societal importance. Although the potential for seasonal prediction is much less over Europe than in the tropics, it is not negligible. Previous studies suggest that European seasonal precipitation skill may peak in the spring (March-April-May) period, this being the season when El Ni09o-Southern Oscillation (ENSO) teleconnections to the North Atlantic and European sector are at their strongest. Examination of the correlation significance and temporal stability of contemporaneous and lagged ENSO links to European and North African precipitation over 98 years confirms this to be the case. The strongest ENSO links are found across the central European region (45°N-55°N,35°E-5°W). These links are symmetric with the sign of ENSO. Using a linear statistical model employing temporally stable lagged ENSO and lagged local North Atlantic sea surface temperatures as predictors, we compute the forecast skill and significance of central European spring precipitation over 30 independent years. For early March forecasts our model skill is 14-18% better than climatology, which is significant at the 95% level.

DOI

[34]
Ji F, Wu Z, Huang Jet al., 2014. Evolution of land surface air temperature trend.Nature Climate Change, 4: 462-466.The global climate has been experiencing significant warming at an unprecedented pace in the past century(1,2). This warming is spatially and temporally non-uniform, and one needs to understand its evolution to better evaluate its potential societal and economic impact. Here, the evolution of global land surface air temperature trend in the past century is diagnosed using the spatial-temporally multidimensional ensemble empirical mode decomposition method(3). We find that the noticeable warming (>0.5 K) started sporadically over the global land and accelerated until around 1980. Both the warming rate and spatial structure have changed little since. The fastest warming in recent decades (>0.4 K per decade) occurred in northern mid-latitudes. From a zonal average perspective, noticeable warming (>0.2 K since 1900) first took place in the subtropical and subpolar regions of the Northern Hemisphere, followed by subtropical warming in the Southern Hemisphere. The two bands of warming in the Northern Hemisphere expanded from 1950 to 1985 and merged to cover the entire Northern Hemisphere.

DOI

[35]
Jia X, Ge J, 2017. Interdecadal changes in the relationship between ENSO, EAWM, and the wintertime precipitation over China at the end of the twentieth century.Journal of Climate, 30: 1923-1936.Abstract The current study investigates the interdecadal changes in the relationship between the winter precipitation anomalies in southeastern China, El Ni o-Southern Oscillation (ENSO), and the East Asian winter monsoon (EAWM) at the end of the twentieth century. It appears that the relationships between the interannual variability of the southeastern China winter precipitation and ENSO as well as EAWM are obviously weakened after 1998/99. The possible mechanisms accounting for this interdecadal change in the relationship have been examined by dividing the data into two subperiods [1980-98 (P1) and 1999-2015 (P2)]. The results indicate that, without the linear contribution of EAWM, ENSO only play a limited role in the variability of winter precipitation in southeastern China in both subperiods. In contrast, in P1, corresponding to an ENSO-independent weaker-than-normal EAWM, anomalous southerlies along coastal southeastern China associated with an anticyclone over the northwestern Pacific transport water vapor to China. However, in P2 the impact of EAWM on winter precipitation in southeastern China is weakened because of the regime shift of EAWM. The EAWM-related positive SLP anomalies over the North Pacific move eastward in P2, causing an eastward migration of the associated anomalous southerlies along its western flank and therefore cannot significantly contribute to the positive winter precipitation anomalies in southeastern China.

DOI

[36]
Knippertz P, Ulbrich U, Marques Fet al., 2003. Decadal changes in the link between El Niño and springtime North Atlantic Oscillation and European-North African rainfall.International Journal of Climatology, 23: 1293-1311.The link between El Ni o-southern oscillation (ENSO) variability in boreal winter (represented by the NI O3 index, i.e. East Pacific sea-surface temperature anomalies) and the large-scale circulation and weather conditions over Europe-northwest Africa in spring is explored, considering station reports of precipitation, sea-level pressure (SLP) anomalies and two North Atlantic oscillation (NAO) indices. It is found that these relations have undergone consistent and simultaneous changes in the 20th century. Three characteristic periods can be identified. During 1900-25 and 1962-87, positive NI O3 index values are associated with enhanced precipitation over central Europe and reduced rainfall in southern Europe and northern Africa. The ENSO influence on precipitation over Scotland and Norway is small. The rainfall anomalies can be explained from the advective and dynamical implications of a north-south dipole in SLP correlations (warm ENSO events followed by low pressure in northern Europe and high pressure over the Mediterranean Sea-North Africa). This dipole hardly projects on the commonly used NAO centres (Iceland and Azores/Gibraltar) and thus ENSO-NAO correlations are insignificant. During 1931-56 the NI O3 index reveals little influence on precipitation over the Iberian Peninsula and Morocco, but there are large negative correlations with precipitation over Scotland and Norway. This is related to an alteration of the NI O3-SLP correlation pattern, which implies high pressure over northern Europe and low pressure over central Europe after warm events, and thus a virtually inverted dipole with respect to the other two periods. The large westward extension of the dipole leads to a significant NAO-NI O3 correlation of r = -0.5. These alterations were accompanied by substantial large-scale circulation changes during the period 1931-56, as revealed by anomalously high pressure and dry conditions over central-western Europe, a change in precipitation-producing SLP patterns for Morocco and an anomalously low number of positive NAO and NI O3 index values. It is left for discussion as to whether the decadal variations described are due to a change in the physics of the teleconnection or to stochastic fluctuations.

DOI

[37]
Li B, Chen Y, Chen Zet al., 2016. Why does precipitation in northwest China show a significant increasing trend from 1960 to 2010?Atmospheric Research, 167: 275-284.Based on monthly precipitation data from 74 weather stations in the arid region of northwest China, we employed statistical methods to analyse the characteristics of precipitation and investigated the relationships between precipitation and 11 atmospheric circulations. The results showed that the precipitation in northwest China had a significantly increasing trend (P < 0.01), at a rate of 0.61 mm/year, which is higher than the average rate of China (- 0.16 mm/year) for the same period. Annual precipitation increased markedly after 1987, but the increase in precipitation gradually declined from north to south and from west to east. We found that the precipitation variation in spring, summer, autumn, and winter plays an important role in the yearly change, accounting for 21.6%, 42.4%, 18.4%, and 17.6%, respectively. The correlation analysis indicated that the annual precipitation revealed strong and significant associations with the West Pacific Subtropical High (WPSH, R = 0.60, P < 0.001) and the North America Subtropical High (NASH, R = 0.57, P < 0.001) from 1960 to 2010. We therefore suggest that the strengthening of the WPSH and NASH after the mid-1980s is probably the main cause for the significant increasing trend of precipitation in northwest China.

DOI

[38]
Li Q, Chen Y, Shen Yet al., 2011. Spatial and temporal trends of climate change in Xinjiang, China.Journal of Geographical Sciences, 21: 1007-1018.在 65 个气象学的车站的从 1961 ~ 2005 的系列数据集被用来揭示气候的空间、时间的趋势的温度和降水时间在 Xinjiang 变化,中国。年度、季节的吝啬的空气温度和全部的降水用 Mann-Kendall (MK ) 测试被分析,反的距离加权(IDW ) 插值,和 R/S 方法。结果显示那:(1 ) 在过去的 45 年里增加的温度和降水,而是温度的增加比降水的更明显;(2 ) 为温度增加,更高纬度并且更高举起更快增加,不过,纬度在增加以后有更大的影响。北 Xinjiang 显示出比南部的 Xinjiang 的更快的温暖,特别在夏天;(3 )降水的增加在南部的 Xinjiang 主要在冬季发生在北 Xinjiang 并且在夏天。Ili,在 Xinjiang 有大多数降水,显示出降水的弱增加;(4 ) 尽管温度和降水一般来说增加了,增加在 Xinjiang 内是不同的;(5 ) 林中小丘索引(H) 分析显示那个气候变化将继续当前的趋势。

DOI

[39]
Lloyd-Hughes B, Saunders M A, 2002. Seasonal prediction of European spring precipitation from El Niño-Southern Oscillation and local sea-surface temperatures.International Journal of Climatology, 22: 1-14.The extent to which European seasonal precipitation is predictable is a topic of scientific and societal importance. Although the potential for seasonal prediction is much less over Europe than in the tropics, it is not negligible. Previous studies suggest that European seasonal precipitation skill may peak in the spring (March-April-May) period, this being the season when El Ni09o-Southern Oscillation (ENSO) teleconnections to the North Atlantic and European sector are at their strongest. Examination of the correlation significance and temporal stability of contemporaneous and lagged ENSO links to European and North African precipitation over 98 years confirms this to be the case. The strongest ENSO links are found across the central European region (45°N-55°N,35°E-5°W). These links are symmetric with the sign of ENSO. Using a linear statistical model employing temporally stable lagged ENSO and lagged local North Atlantic sea surface temperatures as predictors, we compute the forecast skill and significance of central European spring precipitation over 30 independent years. For early March forecasts our model skill is 14-18% better than climatology, which is significant at the 95% level.

DOI

[40]
Lorenz E N, 1956. Empirical Orthogonal Functions and Statistical Weather Prediction. Statistical Forecast Project Rep. 1, MIT. Department of Meteorology, Cambridge, MA, 49 pp.

[41]
Mann M, 2011. On long range dependence in global surface temperature series.Climatic Change, 107: 267-276.Long Range Dependence (LRD) scaling behavior has been argued to characterize long-term surface temperature time series. LRD is typically measured by the so-called “Hurst” coefficient, “ H ”. Using synthetic temperature time series generated by a simple climate model with known physics, I demonstrate that the values of H obtained for observational temperature time series can be understood in terms of the linear response to past estimated natural and anthropogenic external radiative forcing combined with the effects of random white noise weather forcing. The precise value of H is seen to depend on the particular noise realization. The overall distribution obtained over an ensemble of noise realizations is seen to be a function of the relative amplitude of external forcing and internal stochastic variability and additionally in climate “proxy” records, the amount of non-climatic noise present. There is no obvious reason to appeal to more exotic physics for an explanation of the apparent scaling behavior in observed temperature data.

DOI

[42]
Maussion F, Scherer D, Molg Tet al., 2014. Precipitation seasonality and variability over the Tibetan Plateau as resolved by the High Asia reanalysis.Journal of Climate, 27: 1910-1927.

[43]
Madden R A, Williams J, 1978. The correlation between temperature and precipitation in the United States and Europe.Monthly Weather Review, 106: 142-147.

[44]
Mariotti A, 2007. How ENSO impacts precipitation in southwest Central Asia.Geophsical Research Letters, 34: L16706.A linkage between ENSO and the hydroclimatic variability of the southwest central Asia region (SWCA) is established through observational analysis of precipitation, moisture flux and sea level pressure data, with further support from an atmospheric model of intermediate complexity. Enhanced precipitation in SWCA during warm ENSO events results from an anomalous southwesterly moisture flux coming from the Arabian Sea and tropical Africa, which is generated along the northwestern flank of the high pressure anomaly over the Indian and western Pacific Oceans, part of the canonical ENSO sea-saw pressure anomalies. The ENSO impact on SWCA precipitation is found to be greatest in the transition seasons of autumn and spring, but the dynamical impact on pressure and circulation persists throughout the year. This connection was particularly strong in recent decades. Model sensitivity experiments further show that this is driven primarily by tropical Pacific SST anomalies and associated large-scale sea-level pressure changes, while the Indian Ocean SST has opposite effects.

DOI

[45]
New M, Todd M, Hulme Met al., 2001. Precipitation measurements and trends in the twentieth century.International Journal of Climatology, 21: 1899-1922.Abstract Concern about anthropogenic climate change has heightened the need for accurate information about spatial and temporal variations in precipitation at the Earth's surface. Large-scale precipitation estimates can be derived from either surface gauge measurements or by satellite remote sensing, both of which have shortcomings. Gauge measurements provide information about trends and variability of monthly precipitation throughout the entire twentieth century, but because of the lack of data from most ocean regions, this information is representative of only about 25–30% of the Earth's surface. In contrast, satellite (especially multi-platform) measurements provide spatially complete coverage at monthly to subdaily resolution, but do not extend back beyond 1974. Merged gauge–satellite datasets maximize (and minimize) the relative benefits (and shortcomings) of each source type. While these merged products only extend back to 1979, their importance will grow as we move into the new century. Precipitation gauge data indicate that global land precipitation (excluding Antarctica) has increased by about 9 mm over the twentieth century (a trend of 0.89 mm/decade), which is relatively small compared with interannual and multi-decadal variability. Within this century-long trend, global precipitation exhibits considerable variability on decadal time-scales, with departures of up to ±40 mm from the century mean of about 950 mm. Regionally, precipitation has increased over most land areas, with the exception of tropical North Africa, and parts of southern Africa, Amazonia and western South America. The dominant mode of interannual variability in global and hemispheric land precipitation is related to the El Ni09o–Southern Oscillation (ENSO), which explains about 38% of the interannual variance in globally averaged land precipitation and about 8% of the space–time variability of global precipitation. In the mid- and high latitudes, the Arctic and Antarctic oscillation (AO and AAO) are the dominant modes of interannual climate variability. The AO explains 48 and 35% of area-averaged winter precipitation variability over land in the latitude bands 60–80°N and 40–60°N, respectively. The North Atlantic Oscillation is not an important modulator of global precipitation, but it does explain 8% of annual (more in winter) variability in spatially averaged northern mid-latitude precipitation. Analyses of precipitation over land and ocean (spatially complete) since 1980 indicate that only a few regions show marked trends in precipitation over this short period, but there is a suggestion that there has been a shift in zonal precipitation. There are coherent regions where the tropical ENSO signal extends in a northeast/southeast direction into the subtropics, especially in the Pacific-Indonesian region, but also over the Atlantic-African and Indian Ocean domains. Data from a number of countries provide evidence of increased intensity of daily precipitation, generally manifested through increased frequency of wet days and an increased proportion of total precipitation occurring during the heaviest events. Over most land areas there has also been an increase in the persistence of wet spells. Copyright 08 2001 Royal Meteorological Society

DOI

[46]
Noake K, Polson D, Hegerl Get al., 2012. Changes in seasonal land precipitation during the latter twentieth-century.Geophysical Research Letters, 39: L03706.Climate models predict substantial changes in seasonal precipitation in the future. Anthropogenic forcing has been found to contribute to the observed pattern of land precipitation change over the 2nd half of the 20th century when annual precipitation is averaged within latitude bands, the observed change was substantially larger than response simulated in climate models, based on a single observational dataset. Here we investigate the robustness of this finding using several land only observational datasets and look for an explanation for why observed changes are significantly larger. We show the discrepancy between model simulated and observed trends is reduced when changes are expressed as percent climatology, which reduces the difference in scale between observed point locations and model gridboxes. Focusing on seasonal rather than annual data reveals that there are seasonal differences in the pattern of zonal precipitation changes over the 20th century. We use fingerprint for zonal precipitation changes from 54 CMIP3 simulations and show that observed changes are detectable in all seasons but boreal summer (JJA), even when doubling the variance of the model simulation, and irrespective of the dataset used. The observed change is still larger than that simulated by the multi-model mean in all datasets except in boreal summer but only in boreal spring is the observed change robustly and significantly larger than that simulated.

DOI

[47]
Ouyang R, Liu W, Fu Get al., 2014. Linkages between ENSO/PDO signals and precipitation, stream flow in China during the last 100 years.Hydrology and Earth System Sciences, 18: 3651-3661.This paper investigates the single and combined impacts of El Ni??o???Southern Oscillation (ENSO) and the Pacific Decadal Oscillation (PDO) on precipitation and streamflow in China over the last century. Results indicate that the precipitation and streamflow overall decrease during El Ni??o/PDO warm phase periods and increase during La Ni??a/PDO cool phase periods in the majority of China, although there are regional and seasonal differences. Precipitation and streamflow in the Yellow River basin, Yangtze River basin and Pearl River basin are more significantly influenced by El Ni??o and La Ni??a events than is precipitation and streamflow in the Songhua River basin, especially in October and November. Moreover, significant influence of ENSO on streamflow in the Yangtze River mainly occurs in summer and autumn while in the Pearl River influence primarily occurs in the winter and spring. The precipitation and streamflow are relatively greater in the warm PDO phase in the Songhua River basin and several parts of the Yellow River basin and relatively less in the Pearl River basin and most parts of Northwest China compared to those in the cool PDO phase, though there is little significance detected by Wilcoxon signed-rank test. When considering the combined influence of ENSO and PDO, the responses of precipitation/streamflow are shown to be opposite in northern China and southern China, with ENSO-related precipitation/streamflow enhanced in northern China and decreased in southern China during the warm PDO phases, and enhanced in southern China and decreased in northern China during the cool PDO phases. It is hoped that this study will be beneficial for understanding the precipitation/streamflow responses to the changing climate and will correspondingly provide valuable reference for water resources prediction and management across China.

DOI

[48]
Park S, 2004. Remote ENSO influence on Mediterranean sky conditions during late summer and autumn: Evidence for a slowly evolving atmospheric bridge.Quarterly Journal of the Royal Meteorological Society, 130: 2409-2422.Analysis of atmospheric flows during 1956-95 indicates that the strong ENSO-WM correlation in the August-October season arises from a previously unreported quasi-stationary Rossby wave propagating eastwards from the western equatorial Pacific. This component weakens between 1956-75 and 1976-95, consistent with the reduced correlation of the ENSO-WM sky conditions between the same periods. In order to fully understand the observed long-term variations of remote ENSO correlation over the WM, further studies are required, including the potential roles of the Pacific Decadal Oscillation, Sahelian rainfall and Atlantic sea surface temperature. Copyright 2004 Royal Meteorological Society

DOI

[49]
Poli P, Hersbach H, Dee Det al., 2016. ERA-20C: An atmospheric reanalysis of the twentieth century.Journal of Climate, 29: 4083-4097.

[50]
Qian W, Kang H, Lee D, 2002. Distribution of seasonal rainfall in the East Asian monsoon region.Theoretical and Applied Climatology, 73: 151-168.This study deals with the climatological aspect of seasonal rainfall distribution in the East Asian monsoon region, which includes China, Korea and Japan. Rainfall patterns in these three countries have been investigated, but little attention has been paid to the linkages between them. This paper has contributed to the understanding of the inter-linkage of various sub-regions. Three datasets are used. One consists of several hundred gauges from China and South Korea. The second is based on the Climate Prediction Center (CPC) Merged Analysis of Precipitation (CMAP). The two sources of precipitation information are found to be consistent. The third dataset is the NCEP/NCAR reanalysis 850-hPa winds.The CMAP precipitation shows that the seasonal transition over East Asia from the boreal winter to the boreal summer monsoon component occurs abruptly in mid-May. From late March to early May, the spring rainy season usually appears over South China and the East China Sea, but it is not so pronounced in Japan. The summer monsoon rainy season over East Asia commonly begins from mid-May to late May along longitudes of eastern China, the Korean Peninsula, and Japan. A strong quasi-20-day sub-seasonal oscillation in the precipitation appears to be dominant during this rainy season. The end date of the summer monsoon rainy season in eastern China and Japan occurs in late July, while the end date in the Korean Peninsula is around early August. The autumn rainy season in the Korean Peninsula has a major range from mid-August to mid-September. In southern China, the autumn rainy season prevails from late August to mid-October but a short autumn rainy season from late August to early September is noted in the lower part of the Yangtze River. In Japan, the autumn rainy season is relatively longer from mid-September to late October.The sub-seasonal rainfall oscillation in Korea, eastern China and Japan are explained by, and comparable to, the 850-hPa circulation. The strong westerly frontal zone can control the location of the Meiyu , the Changma , and the Baiu in East Asia. The reason that the seasonal sea surface temperature change in the northwestern Pacific plays a critical role in the northward advance of the onset of the summer monsoon rainfall over East Asia is also discussed.

DOI

[51]
Ropelewski C, Halpert M, 1987. Global and regional scale precipitation patterns associated with the E1 Nifio/Southern Oscillation.Monthly Weather Review, 115: 1606-1626.

[52]
Russo S, Sterl A, 2012. Global changes in seasonal means and extremes of precipitation from daily climate model data.Journal of Geophysical Research, 117: D01108.1] We investigate simulated changes of seasonal precipitation maxima and means in a future, warmer climate. We use data from the ESSENCE project, in which a 17-member ensemble of climate change simulations in response to the SRES A1b scenario has been carried out using the ECHAM5/MPI-OM climate model. The large size of the data set gives the opportunity to detect the changes of climate extremes and means with high statistical confidence. Daily precipitation data are used to calculate the seasonal precipitation maximum and the seasonal mean. Modeled precipitation data appear consistent with observation-based data from the Global Precipitation Climatology Project. The data are split into six time periods of 25 years to get independent time series. The seasonal peaks are modeled by using the generalized extreme value distribution, while empirical distributions are used to study changes of the seasonal precipitation mean. Finally, we use an empirical method to detect changes of occurrence of very wet and dry periods. Results from these model simulations indicate that over most of the world precipitation maxima will increase in the future. Seasonal means behave differently. In many regions they are decreasing or not increasing. The occurrence of very wet periods is strongly increasing during boreal winter in the extratropics and decreasing in the tropics. In summary, wet regions become wetter and dry regions become drier.

DOI

[53]
Rudolph J, Friedrich K, 2013. Seasonality of vertical structure in radar-observed precipitation over southern Switzerland.Journal of Hydrometeorology, 14: 318-330.Operational radar data reveal that precipitation systems occurring on the southern side of the Alps near Locarno, Switzerland, follow seasonal patterns of vertical reflectivity structure. Storms occurring in summer are more convective than winter season storms as indicated by more frequent observation of reflectivity at higher altitudes during summer. Individual precipitation events occurring year-round are classified by comparison to average seasonal vertical reflectivity structure. Seasonal classification of individual storms reveals a transition between winter- and summer-type storms during spring and fall that follows changes in average daily surface temperature. In addition to distinct vertical structure, summer- and winter-type storms have differences in duration, intensity, and interval between storms. Although summer- and winter-type storms result in a similar amount of total precipitation, summer-type storms have shorter duration, and therefore greater intensity. The dependence of storm types on temperature has implications for intensification of the hydrologic cycle due to climate change. Warmer winter, spring, or fall surface temperatures may affect average precipitation intensity by increasing the number of days per year that experience more intense convective precipitation while decreasing the probability of less intense stratiform precipitation.

DOI

[54]
Schiemann R, Chiemann L, Luthi Det al., 2008. The precipitation climate of Central Asia: Intercomparison of observational and numerical data sources in a remote semiarid region.International Journal of Climatology, 2: 295-314.

[55]
Schneider U, Becker A, Finger Pet al., 2014. GPCC’s new land surface precipitation climatology based on quality-controlled in situ data and its role in quantifying the global water cycle.Theoretical and Applied Climatology, 115: 15-40.

[56]
Schneider U, Becker A, Finger Pet al., 2015. GPCC Full Data Reanalysis Version 7.0 at 0.5º: Monthly land-surface precipitation from rain-gauges built on GTS-based and historic data. doi: 10.5676/DWD_ GPCC/FD_M_V7_050.

[57]
Shaman J, 2014. The seasonal effects of ENSO on European precipitation: Observational analysis.Journal of Climate, 27: 6423-6438.An analysis and characterization of seasonal changes in the atmospheric teleconnection between ENSO and western European precipitation, as well as atmospheric conditions over the North Atlantic and Europe, are presented. Significant ENSO-associated changes in precipitation are evident during the boreal spring and fall seasons, marginal during boreal summer, and absent during boreal winter. The spring and fall precipitation anomalies are accompanied by statistically significant ENSO-related changes in large-scale fields over the North Atlantic and Europe. These seasonal teleconnections appear...

DOI

[58]
Smith T, Arkin P, Ren Let al., 2012. Improved reconstruction of global precipitation since 1900.Journal of Atmospheric and Oceanic Technology, 29: 1505-1517.ABSTRACT An improved land ocean global monthly precipitation anomaly reconstruction is developed for the period beginning in 1900. Reconstructions use the available historical data and statistics developed from the modern satellite-sampled period to analyze variations over the historical presatellite period. This paper documents the latest in a series of precipitation reconstructions developed by the authors. Although the reconstruction principle is still the minimization of mean-squared error, this latest reconstruction includes the following three major improvements over previous reconstructions: (i) an improved method that first produces an annual first guess, which is then adjusted using a monthly increment analysis; (ii) improved use of oceanic observations in the annual first guess using a canonical correlation analysis; and (iii) reinjection of gauge data where those data are available. These improvements allow more confident analyses and evaluations of global precipitation variations over the reconstruction period. Quantitative error estimates for the reconstruction are being developed and will be documented in a later paper.

DOI

[59]
Sorg A, Bolch T, Stoffel M, 2012. Climate change impacts on glaciers and runoff in Tien Shan (Central Asia).Nature Climate Change, 2: 725-731.Climate-driven changes in glacier-fed streamflow regimes have direct implications on freshwater supply, irrigation and hydropower potential. Reliable information about current and future glaciation and runoff is crucial for water allocation and, hence, for social and ecological stability. Although the impacts of climate change on glaciation and runoff have been addressed in previous work undertaken in the Tien Shan (known as the 'water tower of Central Asia'), a coherent, regional perspective of these findings has not been presented until now. In our study, we explore the range of changes in glaciation in different climatic regions of the Tien Shan based on existing data. We show that the majority of Tien Shan glaciers experienced accelerated glacier wasting since the mid-1970s and that glacier shrinkage is most pronounced in peripheral, lower-elevation ranges near the densely populated forelands, where summers are dry and where snow and glacial meltwater is essential for water availability. The annual glacier area shrinkage rates since the middle of the twentieth century are 0.38-0.76% per year in the outer ranges, 0.15-0.40% per year in the inner ranges and 0.05-0.31% per year in the eastern ranges. This regionally non-uniform response to climate change implies that glacier shrinkage is less severe in the continental inner ranges than in the more humid outer ranges. Glaciers in the inner ranges react with larger time lags to climate change, because accumulation and thus mass turnover of the mainly cold glaciers are relatively small. Moreover, shrinkage is especially pronounced on small or fragmented glaciers, which are widely represented in the outer regions. The relative insensitivity of glaciers in the inner ranges is further accentuated by the higher average altitude, as the equilibrium line altitude ranges from 3'500 to 3'600 masl in the outer ranges to 4'400 masl in the inner ranges. For our study, we used glacier change assessments based both on direct data (mass balance measurements) and on indirect data (aerial and satellite imagery, topographic maps). Latter can be plagued with high uncertainties and considerable errors. For instance, glaciated area has been partly overestimated in the Soviet Glacier catalogue (published in 1973, with data from the 1940s and 1950s), probably as a result of misinterpreted seasonal snowcover on aerial photographs. Studies using the Soviet Glacier catalogue as a reference are thus prone to over-emphasize glacier shrinkage. A valuable alternative is the use of continued in situ mass balance and ice thickness measurements, but they are currently conducted for only a few glaciers in the Tien Shan mountains. Efforts should therefore be encouraged to ensure the continuation and re-establishment of mass balance measurements on reference glaciers, as is currently the case at Karabatkak, Abramov and Golubin glaciers. Only on the basis of sound data, past glacier changes can be assessed with high precision and future glacier shrinkage can be estimated according to different climate scenarios. Moreover, the impact of snowcover changes, black carbon and debris cover on glacier degradation needs to be studied in more detail. Only with such model approaches, reflecting transient changes in climate, snowcover, glaciation and runoff, can appropriate adaptation and mitigation strategies be developed within a realistic time horizon.

DOI

[60]
Trenberth K, Shea D, 2005. Relationships between precipitation and surface temperature.Geophysical Research Letters, 32: L14703.The co-variability of monthly mean surface temperature and precipitation is determined globally for 1979-2002 from observationally-based analyses (ERA-40) for surface air temperature and the Global Precipitation Climatology Project (GPCP) version 2 for precipitation and compared with results from the NCAR Community Atmospheric Model version 3 (CAM3) and Community Climate System Model version 3 (CCSM3). Results are combined for the 5 months for northern winter (November to March) and summer (May to September). Over land, negative correlations dominate, as dry conditions favor more sunshine and less evaporative cooling, while wet summers are cool. At high latitudes in winter, positive correlations dominate as warm moist advection in extratropical cyclones favors precipitation and the water holding capacity of the atmosphere limits precipitation amounts in cold conditions. Where ocean conditions drive the atmosphere, higher surface air temperatures are associated with precipitation, as in El Nio, but some areas, such as the western Pacific in northern summer, feature negative correlations indicating that the atmosphere determines the surface temperatures. In the CAM driven with observed sea surface temperatures and the CCSM in fully coupled mode the latter mechanism is largely absent, and correlations are generally much stronger than observed, indicating more local control. Neither temperature nor precipitation records should be interpreted without considering the strong covariability that exists.

DOI

[61]
Tucker C J, Pinzon J E, Brown M Eet al., 2005. An extended AVHRR 8-km NDVI data set compatible with MODIS and SPOT vegetation NDVI data.International Journal of Remote Sensing, 26: 4485-5598.Daily daytime Advanced Very High Resolution Radiometer (AVHRR) 4‐km global area coverage data have been processed to produce a Normalized Difference Vegetation Index (NDVI) 8‐km equal‐area dataset from July 1981 through December 2004 for all continents except Antarctica. New features of this dataset include bimonthly composites, NOAA‐9 descending node data from August 1994 to January 1995, volcanic stratospheric aerosol correction for 1982–1984 and 1991–1993, NDVI normalization using empirical mode decomposition/reconstruction to minimize varying solar zenith angle effects introduced by orbital drift, inclusion of data from NOAA‐16 for 2000–2003 and NOAA‐17 for 2003–2004, and a similar dynamic range with the MODIS NDVI. Two NDVI compositing intervals have been produced: a bimonthly global dataset and a 10‐day Africa‐only dataset. Post‐processing review corrected the majority of dropped scan lines, navigation errors, data drop outs, edge‐of‐orbit composite discontinuities, and other artefacts in the composite NDVI data. All data are available from the University of Maryland Global Land Cover Facility (http://glcf.umiacs.umd.edu/data/gimms/).

DOI

[62]
Van Oldenborgh G, Burgers G, Tank A, 2000. On the El Niño teleconnection to spring precipitation in Europe.International Journal of Climatology, 20: 565-574.

DOI

[63]
Wang S, Huang J, He Yet al., 2014. Combined effects of the Pacific decadal oscillation and El Niño-southern oscillation on global land dry-wet changes.Scientific Reports, 4: 6651.Abstract The effects of natural variability, especially El Nio-Southern Oscillation (ENSO) effects, have been the focus of several recent studies on the change of drought patterns with climate change. The interannual relationship between ENSO and the global climate is not stationary and can be modulated by the Pacific Decadal Oscillation (PDO). However, the global land distribution of the dry-wet changes associated with the combination of ENSO and the PDO remains unclear. In the present study, this is investigated using a revised Palmer Drought Severity Index dataset (sc_PDSI_pm). We find that the effect of ENSO on dry-wet changes varies with the PDO phase. When in phase with the PDO, ENSO-induced dry-wet changes are magnified with respect to the canonical pattern. When out of phase, these dry-wet variations weaken or even disappear. This remarkable contrast in ENSO's influence between the two phases of the PDO highlights exciting new avenues for obtaining improved global climate predictions. In recent decades, the PDO has turned negative with more La Nia events, implying more rain and flooding over land. La Nia-induced wet areas become wetter and the dry areas become drier and smaller due to the effects of the cold PDO phase.

DOI PMID

[64]
Wang Y, Yan Z, 2009. Trends in seasonal precipitation over China during 1961-2007.Atmospheric and Oceanic Science Letters, 2: 165-171.在在为季节的中国的降水的六个索引的趋势在 587 个车站基于每日的观察在 1961-2007 期间被分析。趋势被与 Mann-Kendalls 测试使用参议员方法确定估计意义。在极端的季节的索引的趋势的地理模式类似于全部的降水的那些。为冬季,全部、极端的降水中国在将近所有上增加了,除了北中国的小部分。在极端降水的增加的趋势也在西南的中国发生在许多车站春天和长江和南部的中国的 midlower 活动范围夏天。为秋天,降水在东方中国减少了,与最大的干燥咒语的增加的长度,暗示为 rainy 以后季节的一个弄干的趋势。弄湿趋势在大多数西方的中国占优势所有季节了。在在北方趋势的南方和干旱的著名洪水在东方中国存在夏天,当时一个将近相反的趋势模式存在春天。

DOI

[65]
Wang Y, Zhou L, 2005. Observed trends in extreme precipitation events in China during 1961-2001 and the associated changes in large-scale circulation.Geophysical Research Letters, 32: L09707.The observed trends in extreme precipitation events, and those in annual and seasonal mean precipitation in China during 1961-2001 are analyzed. The results show that the annual mean precipitation increases significantly in southwest, northwest, and east China, and decreases significantly in central, north and northeast China. The increasing trends in east China occurred mainly in summer, while the decreasing trends in central, north, and northeast China occurred in both spring and autumn. The increasing trends in most of northwest China occurred in all seasons. Patterns of the trends in extreme daily precipitation events are similar to those in the annual and seasonal mean precipitation except in the northwest China where most areas show increasing trends in extreme events only in summer. The extreme precipitation events in the Yangtze River basin increased dramatically by 10%-20% every 10 years in summer, consistent with the increasing trends in summer mean precipitation in the region. The circulation over East Asia shows a weakening trend in the summer monsoon over central-east China.

DOI

[66]
Ward P, Jongman B, Kummu Met al., 2014. Strong influence of El Niño Southern Oscillation on flood risk around the world.PNAS, 111: 15659-15664.El Nio Southern Oscillation (ENSO) is the most dominant interannual signal of climate variability and has a strong influence on climate over large parts of the world. In turn, it strongly influences many natural hazards (such as hurricanes and droughts) and their resulting socioeconomic impacts, including economic damage and loss of life. However, although ENSO is known to influence hydrology in many regions of the world, little is known about its influence on the socioeconomic impacts of floods (i.e., flood risk). To address this, we developed a modeling framework to assess ENSO influence on flood risk at the global scale, expressed in terms of affected population and gross domestic product and economic damages. We show that ENSO exerts strong and widespread influences on both flood hazard and risk. Reliable anomalies of flood risk exist during El Nio or La Nia years, or both, in basins spanning almost half (44%) of Earth land surface. Our results show that climate variability, especially from ENSO, should be incorporated into disaster-risk analyses and policies. Because ENSO has some predictive skill with lead times of several seasons, the findings suggest the possibility to develop probabilistic flood-risk projections, which could be used for improved disaster planning. The findings are also relevant in the context of climate change. If the frequency and/or magnitude of ENSO events were to change in the future, this finding could imply changes in flood-risk variations across almost half of the world terrestrial regions.

DOI

[67]
Wu Z, Huang N, 2004. A study of the characteristics of white noise using the empirical mode decomposition method.Proceedings of the Royal Society A: Mathematical, Physical and Engineering Sciences, 460: 1597-1611.Based on numerical experiments on white noise using the empirical mode decomposition (EMD) method, we find empirically that the EMD is effectively a dyadic filter, the intrinsic mode function (IMF) components are all normally distributed, and the Fourier spectra of the IMF components are all identical and cover the same area on a semi-logarithmic period scale. Expanding from these empirical findings, we further deduce that the product of the energy density of IMF and its corresponding averaged period is a constant, and that the energy-density function is chi-squared distributed. Furthermore, we derive the energy-density spread function of the IMF components. Through these results, we establish a method of assigning statistical significance of information content for IMF components from any noisy data. Southern Oscillation Index data are used to illustrate the methodology developed here.

DOI

[68]
Wu Z, Huang N, 2009. Ensemble empirical mode decomposition: A noise-assisted data analysis method.Advance in Adaptive Data Analysis, 1: 1-41.

[69]
Xiao M, Zhang Q, Singh V, 2015. Influences of ENSO, NAO, IOD and PDO on seasonal precipitation regimes in the Yangtze River basin, China.International Journal of Climatology, 35: 3556-3567.ABSTRACT Teleconnections between El Nio/Southern Oscillation (ENSO), North Atlantic Oscillation (NAO), Indian Ocean Dipole (IOD) and Pacific Decadal Oscillation (PDO) and seasonal precipitation regimes over the Yangtze River basin have been analysed based on the rotated empirical orthogonal functions. Results show that ENSO is the leading driver of seasonal precipitation variability over the Yangtze River basin, and the spring precipitation has been influenced by the PDO and ENSO, the summer and autumn precipitation has been influenced by the ENSO and IOD, the winter precipitation has been influenced by the ENSO, IOD and NAO. Furthermore, changes for the seasonal occurrence and intensity of wet days linked to the ENSO, NAO, IOD and PDO indices have also been investigated to discover which is the dominant mechanism driving seasonal precipitation changes. And results indicated that the influences of ENSO, NAO, IOD and PDO on the seasonal occurrence and intensity of precipitation events are complex, such as that the negative PDO event at the same year tends to increase the spring occurrence of precipitation events in the southwestern part of the Yangtze River basin while the positive ENSO event a year earlier tends to increase the spring intensity of precipitation events in the east part of the Yangtze River basin.

DOI

[70]
Xu L G, Zhou H F, Du Let al., 2015. Precipitation trends and variability from 1950 to 2000 in arid lands of Central Asia.Journal of Arid Land, 7(4): 514-526.Climate warming will cause differences in precipitation distribution and changes in hydrological cycle both at regional and global scales. Arid lands of Central Asia (ALCA), one of the largest arid regions at the middle latitudes in the world, is likely to be strongly influenced by climate warming. Understanding the precipitation variations in the past is an important prerequisite for predicting future precipitation trends and thus managing regional water resources in such an arid region. In this study, we used run theory, displacement, extreme deviation theory, precipitation concentration index (PCI), Mann-Kendall rank correlation and climatic trend coefficient methods to analyze the precipitation in wet and dry years, changes in precipitation over multiple-time scales, variability of precipitation and its rate of change based on the monthly precipitation data during 1950-2000 from 344 meteorological stations in the ALCA. The occurrence probability of a single year with abundant precipitation was higher than that of a single year with less precipitation. The average duration of extreme drought in the entire area was 5 years, with an average annual water deficit of 34.6 mm (accounting for 11.2% of the average annual precipitation over the duration). The occurrence probability of a single wet year was slightly higher than that of a single dry year. The occurrence probability of more than 5 consecutive wet years was 5.8%, while the occurrence probability of more than 5 consecutive dry years was 6.2%. In the center of the study area, the distribution of precipitation was stable at an intra-annual timescale, with small changes at an inter-annual timescale. In the western part of the study area, the monthly variation of precipitation was high at an inter-annual timescale. There were clear seasonal changes in precipitation (PCI=12-36) in the ALCA. Precipitation in spring and winter accounted for 37.7% and 24.4% of the annual precipitation, respectively. There was a significant inter-annual change in precipitation in the arid Northwest China (PCI=24-34). Annual precipitation increased significantly (P=0.05) in 17.4% of all the meteorological stations over the study period. The probability of an increase in annual precipitation was 75.6%, with this increase being significant (P=0.05) at 34.0% of all the meteorological stations. The average increasing rate in annual precipitation was 3.9 mm/10a (P=0.01) in the ALCA. There were significant increasing trends (P=0.01) in precipitation in Kazakhstan, Kyrgyzstan and Tajikistan, with rates of 2.6, 3.1 and 3.7 mm/10a, respectively.

DOI

[71]
Xie P, Arkin P, 1997. Global precipitation: A 17-year monthly analysis based on gauge observations, satellite estimates and numerical model outputs.Bulletin of American Meteorological Society, 78: 2539-2558.

[72]
Yatagai A, Kamiguchi K, Arakawa Oet al., 2012. APHRODITE: Constructing a long-term daily gridded precipitation dataset for Asia based on a dense network of rain gauges.Bulletin of American Meteorological Society, 93: 1401-1415.

[73]
Zanchettin D, Franks S W, Traverso Pet al., 2008. On ENSO impacts on European wintertime rainfalls and their modulation by the NAO and the Pacific multi-decadal variability described through the PDO index.International Journal of Climatology, 28: 995-1006.While strong relationships have previously been established between the El Ni o/Southern Oscillation (ENSO) and climate variability in many parts of the world, previous analyses of ENSO impacts on European rainfalls have been variable and inconclusive. In this paper, the role and apparent interactions of a range of known teleconnections are assessed. It is shown that ENSO events do indeed appear to impact European rainfalls and that these impacts are likely to also depend on the concurrent state of the North Atlantic Oscillation (NAO) and the Pacific Decadal Oscillation (PDO). In particular, it is demonstrated that ENSO impacts most significantly on European wintertime rainfalls during positive (warm) phases of the PDO. Copyright 漏 2007 Royal Meteorological Society

DOI

[74]
Zhang Q, Xu C, Chen Xet al., 2011. Statistical behaviours of precipitation regimes in China and their links with atmospheric circulation 1960-2005.International Journal of Climatology, 31: 1665-1678.http://doi.wiley.com/10.1002/joc.2193

DOI

[75]
Zhao W, Khalil M A K, 1993. The relationship between precipitation and temperature over the contiguous United States.Journal of Climate, 6: 1232-1236.

[76]
Zveryaev I, 2004. Seasonality in precipitation variability over Europe.Journal of Geophysical Research, 109: D05103.1] A gridded monthly and pentad precipitation for 19790900092001 from the Climate Prediction Center Merged Analysis of Precipitation (CMAP) data set and terrestrial monthly gauge-based precipitation for 19580900091998 from the Climatic Research Unit, University of East Anglia (CRU), data set are used to investigate seasonality in the long- and short-term precipitation variability over Europe. Prominent seasonal differences are detected both in precipitation climatologies and in characteristics of precipitation variability. It is shown that over western Europe the summer precipitation climatology and its year-to-year variability (expressed by standard deviations) are lower than those of the winter precipitation. Major seasonal differences are found over central eastern Europe. In this region the summer precipitation climatology and magnitudes of its interannual variability exceed respective winter characteristics by a factor of 20900093.5. Similar relationships are found for the summer and winter magnitudes of intraseasonal fluctuations of precipitation. The first empirical orthogonal function (EOF) modes of both summer and winter seasonal mean precipitation over Europe are associated with the North Atlantic Oscillation (NAO). However, they explain very different (42% for winter and 25% for summer) fractions of total precipitation variability and form principally different spatial patterns. Temporal behavior of the respective principal components is also essentially different. The first EOF mode of the winter magnitudes of intraseasonal precipitation fluctuations is also associated with the NAO. The second EOF mode of the winter precipitation is linked to the East Atlantic teleconnection pattern. However, the respective mode in the magnitudes of intraseasonal fluctuations was not detected. The second EOF mode of the summer precipitation is associated with the 500 hPa heights pattern, which is characterized by four anomaly centers. Two major centers of opposite polarity are located over western Europe and Scandinavia-northeastern European Russia.

DOI

Outlines

/