Orginal Article

Assessment of efficiency and potentiality of agricultural resources in Central Asia

  • ZHANG Jiaoyou , 1, 2 ,
  • CHEN Yaning 1 ,
  • LI Zhi 1
Expand
  • 1. State Key Laboratory of Desert and Oasis Ecology, Xinjiang Institute of Ecology and Geography, CAS, Urumqi 830011, China
  • 2. University of Chinese Academy of Sciences, Beijing 100049, China

Author: Zhang Jiaoyou (1991-), Master Candidate, specialized in efficiency evaluation for water resources of Central Asia. E-mail:

Received date: 2018-01-16

  Accepted date: 2018-04-02

  Online published: 2018-09-25

Supported by

The Strategic Priority Research Program of the Chinese Academy of Sciences, No.XDA19030204

National Natural Science Foundation of China, No.41630859

Copyright

Journal of Geographical Sciences, All Rights Reserved

Abstract

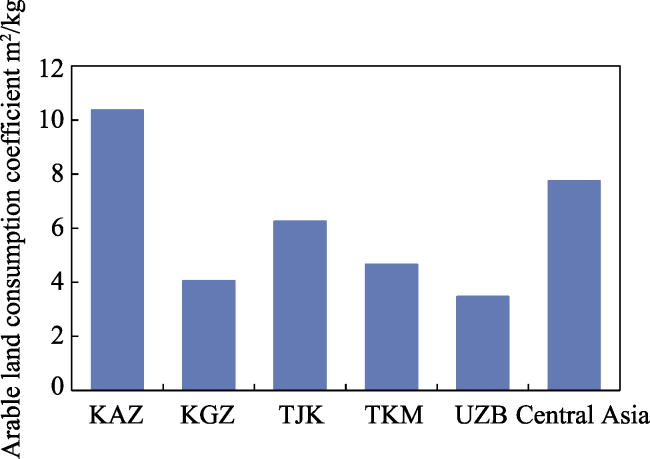
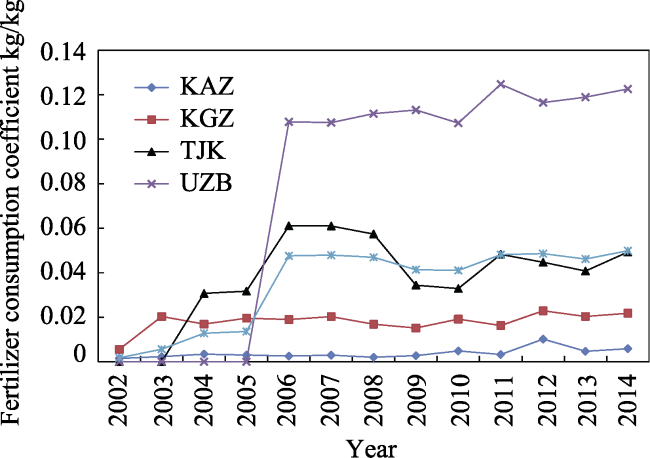
This paper quantitatively analyzes the utilization efficiency of agricultural resources in Central Asia by calculating the consumption coefficient of the main resources, including arable land, water and fertilizers. The results of these investigations reveal the following: (1) The average consumption coefficients of cultivated land resources in Central Asia are much higher than the world average value of up to 7.74 m2/kg, which is 3.6 times that of China, suggesting that the cultivated land resource consumption coefficient of cultivated land resource utilization efficiency is low in the Central Asian region. (2) Up to 80% of available water resources are used for agriculture irrigation. The average agricultural water consumption in Central Asia is about 9.43 m3/kg, or nearly 9.3 times the average value elsewhere in Asia, indicating that agricultural water use efficiency in this region is very low and water resources are wasted. (3) The fertilizer consumption coefficient in Central Asia is 0.035 kg/kg, which is close to the world average, but the utilization efficiency of fertilizer is relatively high. Therefore, in the future development of agriculture, Central Asia should pay more attention to the management of agricultural water resources in order to improve the utilization efficiency of these resources as well as that of arable land.

Cite this article

ZHANG Jiaoyou , CHEN Yaning , LI Zhi . Assessment of efficiency and potentiality of agricultural resources in Central Asia[J]. Journal of Geographical Sciences, 2018 , 28(9) : 1329 -1340 . DOI: 10.1007/s11442-018-1528-3

1 Introduction

Around the world, recent population expansion, rapid economic growth, rising biofuel production and increasing pollution levels are exerting tremendous pressure on land and fresh water resources that can best be described as limited (Godfray et al., 2010; Gopalakrishnan et al., 2009; Hoogerbrugge and Fresco, 2016; Schneider et al., 2011; Zhao et al., 2015). Agricultural land and water are the two most critical resources for life and food. Global per capita agricultural land is around 0.7 ha, accounting for 37.9% of the world’s per capita land area. Moreover, per capita freshwater withdrawal amounts are approximately 552.1 m3/year, of which 70% is used for agricultural purposes (Chen et al., 2018). At the same time, the factors of increasing water scarcity and competition for water and land from agricultural and non-agricultural sectors are driving the need to improve crop water productivity and to guarantee adequate food for future generations with the same or less water and land than that is currently available (Platonov et al., 2008; Smith, 2000). Therefore, research on the utilization efficiency of agricultural resources has important theoretical and practical significance for ensuring current and future food security, improving the ecological environment, and increasing cereals output (Barakat et al., 2013).
The term “agricultural resources” mainly refers to the natural and socio-economic resources involved in natural and economic reproduction (Revelle, 1976; Fernandez, 2006; Mittu and Chauhan, 2015). Assessment of agricultural resources efficiency is an important aspect of scientific research resources, as it promotes the combination of theory and practice of scientific research resources, while realizing the efficient use of regional agricultural resources towards sustainable socio-economic development. In general, increased yields mainly result from greater inputs of agricultural resources such as fertilizer, water, pesticides, technology, and so on (Tilman et al., 2002), indicating that these resources have an extremely important influence on the output and sustainable development of agriculture. However, given the complexity of agricultural resources contents and their interaction and interdependency, they need to be evaluated from a broader perspective that includes resource, social, economic and ecological benefits as well as intergenerational interests. This evaluation involves numerous technical difficulties in the comprehensive and accurate estimation and evaluation of resource utilization efficiency (Xie et al., 1998).
The current exponential growth levels of the global population requires finding a means to ensure future food security, reduce the impact of agriculture on the environment, and give full play to the potential of increasing food. Based on their use of the latest geospatial data and models, Foley et al. (2011) proposed measures to stop agricultural expansion, increase food production, improve crop productivity, improve diet, and reduce waste. They also evaluated how these measures could benefit both food production and environmental sustainability. Davis et al. (2016) presented a quantitative multi-metric assessment of how changes in efficiency and dietary patterns can combine to increase food supply and minimize environmental impacts from agriculture, estimating that 776 m3 H2O, 15.3 kg N, 299 kg CO2 and 0.85 ha are required annually to support an average global diet. Their assessment was that average footprint intensities will need to improve substantially (e.g., H2O: 65%; N: 85%; greenhouse gas emissions: 72%; land: 97%) if future increases in environmental burdens are to be prevented. However, as these researchers only consider consumption patterns from a global perspective, they avoid many of the difficulties associated with obtaining accurate footprint intensity values.
In Central Asia, water is becoming an increasingly important limiting factor of agricultural development. In order to find solutions to solve the region’s water management problems, Abdullaev (2004) calculated the water use efficiency of the water supply and evapotranspiration. The results of that study showed that there is great potential for increasing average values of water productivity within the basin, and that farmers and water managers are capable of achieving higher levels of production. To date, research on the utilization efficiency of agricultural resources in China has focused more on the selection of indexes and methods, which usually include ratio analysis, production function, Data Envelopment Analysis, factor-energy evaluation models, etc. In China, agricultural water production (WP) also has been recognized as an important indicator of agricultural water management. Cai et al. (2011) assessed the WP for irrigated (WPI) and rain-fed (WPR) crops in the Yellow River Basin, and this study shows that the yield of irrigation crops is higher than that of rain-fed crops, however, WPI is less than WPR. At the same time, it is crucial to consider not only the effective economic output, but also the negative effect output when measuring the efficiency of resource utilization. Xie et al. (1998) calculated and evaluated the consumption of major agricultural resources (e.g., fresh water and fertilizers) in different countries and regions around the world, concluding that the utilization of agricultural resources in China is inefficient and needs to be drastically improved.
Central Asia is located in the hinterland of Eurasia and includes the five “stan” countries of Kazakhstan (KAZ), Kyrgyzstan (KGZ), Tajikistan (TJK), Turkmenistan (TKM) and Uzbekistan (UZB). These five nations are part of the “One Belt and One Road” region, of which agriculture is traditionally the leading industry. In Central Asia, water is the most critical factor in economic social development and is also the main resource in agricultural production (Chen et al., 2016; Deng et al., 2017; Li et al., 2017). In our study, to calculate and assess the utilization efficiency of arable land, water and fertilizers as agricultural resources, we apply a simple and operable ratio analysis method, and then use the resource consumption coefficient. The main purpose of this paper is to provide a scientific basis for the in-depth assessment of the development potential of resources in Central Asia to improve the efficiency of agricultural resources utilization and to realize sustainable and efficient utilization of regional agricultural resources.

2 Study areas and methods

2.1 General situation of the study region

The research area of this paper is Central Asia (Figure 1), which is comprised of Kazakhstan (KAZ), Kyrgyzstan (KGZ), Tajikistan (TJK), Turkmenistan (TKM) and Uzbekistan (UZB). The Central Asian region is about 4 million square kilometers, and is located at 35°08'N-55°25'N and 46°28'E-87°29'E. The eastern portion of Central Asia is adjacent to China’s Xinjiang Uygur Autonomous Region, the western portion borders the Caspian Sea, the northern area borders Russia, and the southern borders Iran and Afghanistan. Being situated in the hinterland of Eurasia, Central Asia has a temperate continental climate featuring very little precipitation and significant evaporation, which is typical of arid and semi-arid interior regions (Zhang et al., 2017). Elevations in the study area are generally low in the west and high in the east, ranging from 28 m below sea level (the Caspian Sea in western Turkmenistan and Kazakhstan) to 4000 m above sea level in the eastern Tianshan Mountains. In fact, the major rivers originate in the eastern and southeastern Tianshan Mountains, whereas to the north there is mostly grassland, plains and hills. The main transboundary rivers in Central Asia include the Amu Darya, the Syr Darya, the Ergis River, and the Ili River, while the major lakes are the Aral Sea, Balkhash Lake, Issy-Kul Lake, and Zaisan Lake.
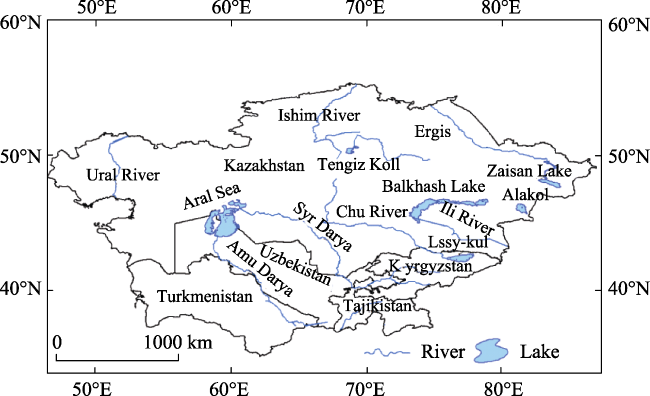
Figure 1 Location of Central Asia
Given the region’s aridity, the primary form of agriculture in Central Asia is irrigated farming, with some rainfed farming occurring in the north. Irrigated farming accounts for the majority of water use in the region, consuming almost 80%-85% of available water resources (Abdullaev, 2004). Irrigated agriculture is concentrated in the Aral Sea basin, but the land productivity of the entire basin is very low, especially in relation to water efficiency. In contrast, KAZ, KGZ, TJK, TKM and UZB have abundant agricultural resources, such as light, heat, water and soil resources, but the space allocation of their agricultural resources is uneven. For instance, TJK and KGZ have the most water, KAZ has the most abundant land resources, and UZB and TKM have superior soil, topography, labor and other natural conditions and social conditions, due to their location in the middle and lower reaches of the Amu Darya and Syr Darya, Central Asia’s largest inland rivers.

2.2 Data

The data used in this study come from the United Nations Food and Agriculture Organization (FAO: http://www.fao.org) and World Development Indicators (WDI) published by the World Bank (https://data.worldbank.org/indicator). They show the total population of the five countries of Central Asia (2014), arable land (2014), arable land (ha/person) (2014), land under cereal production (1992-2014), cereal production (1992-2014), agriculture of total freshwater withdrawal (2007-2014), industrial total freshwater withdrawal (2007-2014), total domestic freshwater (2007-2014), total annual freshwater withdrawals (2014), fertilizer consumption (2002-2014), and the value added by agriculture (2014).

2.3 Method

This paper mainly uses the ratio of agricultural resource inputs (arable land, agricultural water and fertilizer) and cereal production to analyze the consumption coefficient and efficiency of the main agricultural resources in Central Asia. The following equations are applied (Xie et al., 1998):
(1) The cultivated land resource consumption coefficient, expressed as:
\[Clre=\frac{Fla\times 10000}{Og}\ (1)\]
where Clre is the consumption coefficient of cultivated land resources, Fla is the area of arable land (ha), and Og is total cereal production (kg).
(2) Agricultural water consumption coefficient, expressed as:
\[Awec=\frac{Awua\times Awuc}{Og}\ (2)\]
where Awec is the agricultural water consumption coefficient, Awua is the annual fresh water resource extraction (m3), Awuc is the proportion of water used in agriculture, and Og is the total cereal production (kg).
(3) Fertilizer consumption coefficient, expressed as:
\[Fec=\frac{Faua}{Og}\ (3)\]
where Fec is the fertilizer consumption coefficient; Faua is fertilizer consumption (in kg), and Og is the total cereal production (kg).

3 Results and discussion

3.1 Arable land resources consumption coefficient and utilization efficiency

Arable land resources comprise the most basic natural resources needed for agricultural production (Lenhardt et al., 2017; Visser, 2016). There is approximately 13×108 hm2 of cultivated land in the world, feeding a population of about 60×108; the per capita arable area is about 0.225 hm2 (Xie et al., 1998). The geographical landscape of Central Asia is mainly desert and grassland, with a desert area comprising more than 100×104 km2. Overall, the amount of arable land in the five Central Asian countries is relatively small. According to World Bank data (Table 1), the populations of these countries are steadily increasing and currently stand at 67.71×10⁶. Uzbekistan and Kazakhstan account for 45.43% and 25.53% of the Central Asian total population, respectively, followed by Tajikistan (12.35%), Kyrgyzstan (8.62%) and Turkmenistan (8.07%). The rise in population has led to a per capita reduction in arable land resources, making the per person areal area of Central Asia smaller than that of the world average. As of 2014, Kazakhstan’s arable land covered about 10.89% of its total land area, giving an arable area of about 1.700 hm2 per capita; Kyrgyzstan’s arable land covered about 6.68% of its land area, giving an arable area of about 0.219 hm2 per capita; Tajikistan’s arable land covered about 5.26% of its land area, giving a per capita areal area of about 0.087 hm2; Turkmenistan’s arable land covered about 4.13% of its land area,giving an arable area of about 0.355 hm2 per capita; and Uzbekistan’s arable land covered about 10.34% of its land area, giving an arable area of about 0.143 hm2 per capita. Therefore, in order to deal appropriately with the pressure of population growth, these countries need to constantly improve their utilization efficiency of arable land resources to meet the food needs of the projected population increase in the future.
Table 1 Population and arable land of the five Central Asian countries (2014)
Population Arable land
Country Total Percentage of total population of Central Asia Land area Arable land area Percentage of
land area
Per person of arable land
106 person % km2 km2 % ha/person
KAZ 17.29 25.53 2699700 293950 10.89 1.700
KGZ 5.83 8.62 191800 12806 6.68 0.219
TJK 8.36 12.35 138786 7300 5.26 0.087
TKM 5.47 8.07 469930 19400 4.13 0.355
UZB 30.76 45.43 425400 44000 10.34 0.143
Central Asia 67.71 100 3925616 377456 9.62 0.538
The consumption coefficient of arable land resources is the ratio of grain seeding area to grain yield, or the amount of arable land needed to produce one kilogram of food. The efficiency coefficient of cultivated land resources is the reciprocal of the consumption coefficient of arable land, indicating the grain yield per unit area. The cereal concept defined by FAO refers to grains such as wheat, rice, maize and barley. In addition, cereal yield is measured as kilograms per hectare of harvested land, while production data on cereals relate to crops harvested for dry grain only. Thus, in this paper, grain yield is cereal yield, and arable area is harvested land area. The average consumption coefficient of arable land resources in Central Asia is 7.74, which is higher than the world average and 3.6 times that of China's arable land resources (Xie et al., 1998). Of the five Central Asian countries (Figure 2), Kazakhstan has the highest arable land consumption coefficient, with an average consumption coefficient of 10.35. The reason for this relatively high level could be that because Kazakhstan has relatively more arable land resources and it uses more extensive production methods, thus causing more arable land per unit of grain consumed and making less efficient use of arable land. In contrast, in Kyrgyzstan and Tajikistan, which are located in the southeastern part of Central Asia, about 90% of the land area is mountainous and therefore arable land resources are limited. As a result, intensive cultivation methods are used in these two countries, making the consumption coefficients of arable land resources relatively low. The arable land consumption coefficients in Turkmenistan and Uzbekistan are all lower than other countries in Central Asia, but they are still quite high compared to China, which is only 2.15 (Xie et al., 1998).
Figure 2 Consumption coefficient of arable land in the five countries of Central Asia
The total arable land resource consumption coefficients of the five Central Asian countries reveal a significant downward trend (Figure 3). As can be seen, the consumption coefficient of cultivated land resources in the entire Central Asian region declined from 13.01 in 1995 to 6.12 in 2014. This indicates that the utilization efficiency of arable land resources in Central Asia has gradually improved since the break-up of the Soviet Union. Improvements in efficiency come from the choice of better grain varieties and fertilizers, along with changes to cultivation systems and the adoption of advanced management methods.
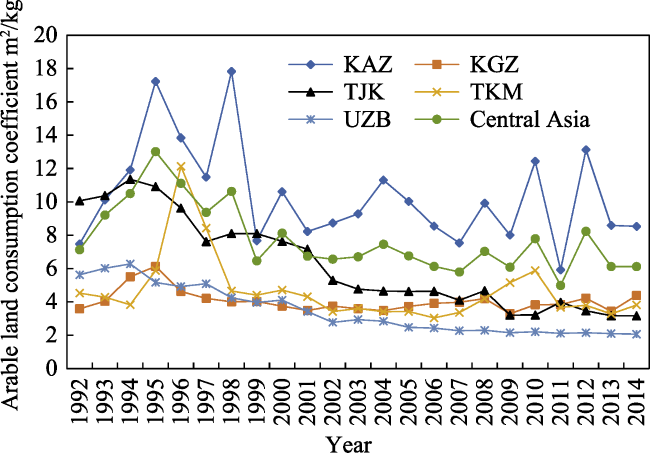
Figure 3 Changing trends of cultivated land resource consumption coefficients in Central Asia in 1992-2014

3.2 Agricultural water consumption coefficient and utilization efficiency

Agricultural water is the most important means of water resource utilization in all five Central Asian countries (Kulmatov, 2014; Thevs et al., 2015), with irrigation being the most important means of delivering water to farmland ( Kitamura et al., 2000; Abdullaev et al., 2010). In reviewing Table 2 data on water withdrawal by sector, we can see that water for agricultural purposes accounted for the largest withdrawal, with Kazakhstan using 66% for farming, Kyrgyzstan using 93%, Tajikistan 91%, Turkmenistan 94%, and Uzbekistan 90% (Table 2). Overall, the table shows that agriculture is the most water-intensive industry, with more than 80% of all available water being used in farming.
Table 2 Water withdrawal by sector (2014)
Industries Municipalities Agriculture
Country Volume Percentage of total Volume Percentage of total Volume Percentage of total
109 % 109 % 109 %
KAZ 6.26 29.63 0.88 4.15 14.00 66.23
KGZ 0.34 4.20 0.22 2.80 7.45 93.01
TJK 0.41 3.55 0.65 5.63 10.44 90.86
TKM 0.84 3.00 0.75 2.70 26.36 94.31
UZB 1.50 2.68 4.10 7.32 50.40 90.00
Central Asia 9.35 7.50 6.60 5.30 108.65 87.21
The water resources available in Central Asia are mainly surface water, groundwater and recycled water (Karen, 2013), and the distribution of water resources is extremely uneven (Table 3). Tajikistan and Kyrgyzstan, located upstream of the Aral Sea Basin, provide 32.6% and 25.2%, respectively, of domestic renewable freshwater resources (mainly surface water produced by rivers and precipitation). The total water resources of the two countries comprises more than 57% of the entire Central Asian region, but they only withdraw less than 11% of the total water available. Meanwhile, Tajikistan only withdraws 18% of its total water resource production, and Kyrgyzstan withdraws 16%. However, the total water resources provided by Kazakhstan, Turkmenistan and Uzbekistan, which are located in the lower reaches of the Aral Sea Basin, are only about 42% (Kazakhstan 33.1%, Turkmenistan 0.7%, Uzbekistan 8.4%) of the overall water resources in Central Asia, yet these three countries withdraw more than 84% of the total water used in the region. Turkmenistan’s water consumption is 19.9 times that of its domestic water resources, and Uzbekistan’s water consumption is 3.4 times. Hence, these water resource-poor countries make up for their own water shortages through upstream water supplies, making them heavily dependent on water coming from upstream countries (Lerman, 2008; Abdullaev et al., 2009).
Table 3 Water resources and water usage in Central Asia (2014)
Country Total freshwater in country Percentage of total freshwater in Central Asia Water withdrawal by country Water withdrawal of total freshwater Water withdrawal to total withdrawal in Central Asia Water withdrawal to total water resources in Central Asia
109 % 109 % % %
KAZ 64.35 33.09 21.14 32.85 16.97 10.87
KGZ 48.93 25.16 8.01 16.36 6.43 4.12
TJK 63.46 32.63 11.49 18.11 9.22 5.91
TKM 1.41 0.72 27.95 1989.32 22.43 14.37
UZB 16.34 8.40 56.00 342.72 44.95 28.79
Central Asia 194.49 100 124.59 64.06 100 64.06
The agricultural water consumption coefficient refers to the amount of water consumed per 1 kg of cereal production, while the reciprocal of agricultural water consumption coefficient is the efficiency of agricultural water resources utilization. It is necessary to use agricultural irrigation water consumption data for cereal irrigation water in order to analyze the agricultural water consumption coefficient. However, due to limitations in data collection, we have to use agricultural water in this study to analyze water consumption coefficients. Table 4 depicts agricultural water consumption coefficients in Central Asia, showing that the average agricultural water consumption coefficient is 9.43. Compared to other regions in the world, agricultural water consumption coefficients in Central Asia are much higher. The natural environment of Central Asia is similar to that of western China, but the water consumption coefficient of agriculture is nine times that of western China, indicating that the agricultural water efficiency is very low in Central Asia. Of the five Central Asian countries, Kazakhstan has the lowest consumption coefficient of agricultural water resources (1.166). This coefficient is lower than the Central Asian average and also lower than the averages of Egypt and Japan. Tajikistan and Uzbekistan are in second and third place, respectively, while Turkmenistan has the largest consumption of agricultural water. As can be seen, the five countries are gradually reducing their water consumption coefficients while at the same time slowly increasing their agricultural water use efficiency (Figure 4). The water consumption coefficiency in Central Asia is also decreasing from 14.56 in 1997 to 9.43 in 2014.
Table 4 Comparison of water consumption coefficient in Central Asia with that of other regions (Xie et al., 1998)
Region Water consumption
coefficients (m³/kg)
Asia 1.014
Africa 0.684
North America 0.33
South America 0.331
Europe 0.225
Egypt 2.638
Japan 1.946
China 1.102
Western China 1.105
Central Asia 9.434
Figure 4 Trend of agricultural water consumption coefficients and efficiency in Central Asia in 1997-2014

3.3 Consumption coefficient and utilization efficiency of fertilizer

Fertilizer is an important resource in agricultural production, with nitrogen, potash and phosphate fertilizers all playing crucial roles in grain production (Jallah et al., 1991). Because fertilizer improves cereal production, the amount of fertilizer invested in agriculture in Central Asia is also increasing year by year (Vyshpolsky et al., 2010). (Note that, due to data limitations, Turkmenistan is excluded from these data.) According to the input level of fertilizer per unit of cultivated area, 1.97 kg of fertilizer was invested per hectare in Central Asia in 2002, with the amount of fertilizer applied per hectare increasing to 82.68 kg in 2014. This means that the amount of fertilizer applied has increased exponentially (around 82 times) over a short period. The increased fertilizer use and grain yield also brought serious ecological pollution, such as soil hardening, polluting of groundwater resources, and decline in crop quality (Kotlyakov, 1991). In the five Central Asian states of Uzbekistan, Kyrgyzstan, Tajikistan, Kazakhstan, and Turkmenistan, approximately 50% of the irrigated land is affected by salinization (Kitamura et al., 2000; Conrad et al., 2013; Tanirbergenov et al., 2016). Among the four countries under study in this section, Uzbekistan has experienced the worst impacts due to heavy fertilizer application and soil salinization intensity, with soil salinization areas expanding from 50% in 1994 to 65.9% in 2001 (Ji et al., 2009).
For every 1 kg of cereal produced in Central Asia, 0.035 kg of fertilizer is consumed. This is close to the average world level. The average consumption of 1 kg of cereal in China is 0.069 kg of fertilizer, while the average consumption in the West is 0.078 kg, and the average consumption in the US is 0.022 kg. Thus, the rate of fertilizer consumption in Central Asia is very close to the world average, below the average level in China and the West, and above the average in the US.
In a horizontal comparison of Central Asian nations (excluding Turkmenistan), the consumption coefficient of fertilizer input shows the highest fertilizer consumption coefficient, which is 0.079. Tajikistan and Kyrgyzstan have a fertilizer consumption coefficient of 0.038 and 0.018, respectively, and Kazakhstan has the lowest fertilizer consumption, with a factor of 0.004, which is well below the world average. As can be seen from Figure 5, the consumption coefficient of fertilizer consumption in Central Asia increased between 2002 and 2006. In other words, the amount of fertilizer per unit of grain output has gradually increased. From 2006 to 2014, fertilizer consumption coefficients were more stable, showing only small fluctuations. This indicates that the amount of fertilizer per grain output was more stable from 2006 to 2014.
Figure 5 Trends in fertilizer consumption coefficients in Central Asia in 2002-2014

3.4 Utilization potential of agricultural resources in Central Asia

Although Central Asia is dominated by agriculture and there are many natural resources and social resources devoted to agricultural development, the contribution of agriculture to the countries’ national income is relatively small. According to World Bank data, the value added by agriculture in Kazakhstan is only 4.69% of GDP; in Kyrgyzstan, this amount is 17.11%; in Tajikistan, it is 27.25%; in Turkmenistan, it is 8.29%; and in Uzbekistan, the value added by agriculture is 18.79% of GDP. By combining the main agricultural resource consumption coefficient and utilization efficiency of the previous analysis, it can be concluded that the productivity level of the primary agricultural resources in Central Asian region is low. At the same time, however, agricultural development in the region has immense potential in both land and water resources. Table 5 shows Central Asia’s main agricultural resources (water, fertilizer) and cereal production arable land per hectare. As can be seen, for every hectare of arable land, Kazakhstan has the least amount of water and fertilizer. Although Kazakhstan has a lower per unit area yield, its water resources are the most efficient and its fertilizer use is the lowest. In addition, Kazakhstan has the largest total grain output and grain exports. Specifically, cereal production doubled in 2011, with about 3×10⁷ tonnes of cereal and 16×107 tonnes of export. Meanwhile, Uzbekistan has the highest cereal production per hectare, but its water use efficiency and fertilizer usage are also the highest. Improvements in agricultural productivity are the key determinants in development, as such improvements allow countries to satisfy their basic agricultural needs sooner and thus free up resources for industrialization (Restuccia et al., 2008). Therefore, it is important to fully develop the agricultural resource potential of Central Asian countries in order to accelerate the utilization efficiency of agricultural resources and promote the economic development in Central Asia.
Table 5 Main agricultural resources input and quantity of grain output
Country Input Output
Arable land Water Fertilizer Production
(ha) (m3) (kg) (kg)
KAZ 1 960.28 6.84 1172.89
KGZ 1 12502.43 49.57 2276.25
TJK 1 26459.25 156.24 3167.92
TKM 1 49111.46 * 2627.01
UZB 1 30857.77 592.16 4831.32
Central Asia 1 6124.33 65.28 1635.13

* means no data

4 Conclusions

Through the analysis of the main agricultural resource consumption coefficient and utilization efficiency for Central Asia, we can conclude the following:
(1) In Central Asia, per capita cultivated land area is decreasing from 0.834 in 1992 to 0.538 in 2014, the consumption coefficient of arable land resources (7.74) is higher than the average level in China (2.15), and the utilization efficiency of cultivated land is low. Kazakhstan has the highest agricultural consumption coefficient (10.35), followed by Tajikistan (6.25), Turkmenistan (4.66), Kyrgyzstan (4.05) and Uzbekistan (3.46). Therefore, it is necessary to protect and improve the arable land resource environment, increase cereal production per hectare, and reduce the consumption coefficient of cultivated land resources.
(2) Agricultural water efficiency is the lowest in the three agricultural resources utilization, and it is far below the world average. Kazakhstan has the lowest consumption coefficient of agricultural water resources (1.166), followed by Kyrgyzstan (5.54), Uzbekistan (9.54) and Tajikistan (13.85). Turkmenistan has the largest consumption of agricultural water (17.07). The reasons for this situation are, first, the high water-intensive crop area is larger; and second, the flood irrigation mode for the irrigation area is far larger than the actual demand, leading to water salinization ecological problems. This situation indicates the need to improve water use efficiency in farming methods and irrigation systems.
(3) Fertilizer consumption is relatively low and close to the world average. Uzbekistan has the highest fertilizer consumption coefficient (0.079), followed by Tajikistan (0.0379) and Kyrgyzstan (0.018). Kazakhstan has the lowest rate of fertilizer consumption and is well below the world average. However, the amount of fertilizer used in Central Asian unit cereals and unit arable land inputs is gradually increasing. Accordingly, the region should be more moderate in its use of chemical fertilizers and strive to develop green agriculture.

The authors have declared that no competing interests exist.

[1]
Abdullaev I, Fraiture C D, Giordano Met al., 2009. Agricultural water use and trade in Uzbekistan: Situation and potential impacts of market liberalization.International Journal of Water Resources Development, 25(1): 47-63.The focus in Uzbekistan on cotton and its irrigation led to large increases in water use with significant downstream impacts, particularly on the Aral Sea. While agriculture is still heavily influenced by the state, Uzbekistan has become more integrated in the global economy since its independence. The major goal of this paper is to examine the interrelationship between agricultural policies and water use during the last 15 years and how moves towards freer markets, such as those which might occur under the World Trade Organization, may impact Uzbekistan's water resources in the future. The results show that partial or full market liberalization may result in an increase in water use. However, the greater message is that non-water policies can have a major impact on water outcomes and therefore should be considered in any discussions of water sector reform.

DOI

[2]
Abdullaev I, Kazbekov J, Manthritilake Het al., 2010. Water user groups in Central Asia: Emerging form of collective action in irrigation water management.Water Resources Management, 24(5): 1029-1043.This paper examines the recent emerging informal Water Users Groups (WUGs) on the Ferghana Valley for managing of the water at the former collective farm level and potential for strengthening of the weak Water Users Associations (WUAs) through replication of WUGs formation. Due to the collapse of the Soviet Union, Central Asian states have introduced reforms in different sectors including the water resources sectors. As a part of the water resources management reforms, Water Users Associations (WUAs) formation has implemented to manage water resources infrastructure and water distribution. WUGs have been emerging because WUAs have not been very efficient and effective due to their top-down implementation approach. In future, WUGs are very effective institutional mechanism of water resources management, and a useful support instrument to WUAs.

DOI

[3]
Abdullaev I, Molden D, 2004. Spatial and temporal variability of water productivity in the Syr Darya Basin, Central Asia.Water Resources Research, 40(8): 379-405.Application of water productivity analysis can provide clues in the search for solutions to solve water management problems of central Asia. It is in this context that this paper provides an analysis of water productivity both spatially and temporally in the cotton and rice production areas of Syr Darya Basin of central Asia. The spatial analysis includes different farm types and basin segments, and the temporal analysis includes 3 hydrological years during 1999-2001. The analysis of temporal data showed that in water-deficient years, water productivity, both in terms of supply and evapotranspiration, is higher than the same in water-abundant years. The data also show that type and size of farms have an impact on water productivity in the case of both cotton and rice. This study concludes by suggesting strategies and options for enhancing the average water productivity both in the cotton- and rice-growing areas of the Syr Darya Basin.

DOI

[4]
Barakat M N, Aldoss A A, Elshafei A Aet al., 2013. Assessment of genetic diversity among wheat doubled haploid plants using TRAP markers and morpho-agronomic traits.Australian Journal of Crop Science, 7(1): 104-111.The objectives of this study were to compare the agronomic performance of wheat doubled haploid (DH) lines derived via microspore culture against their corresponding parental lines under field conditions. We also estimated the genetic diversity using molecular markers and agronomic performance to find an association between molecular markers and agronomic traits. DH wheat lines derived from mic...

[5]
Cai X, Yang Y-C E, Ringler Cet al., 2011. Agricultural water productivity assessment for the Yellow River Basin.Agricultural Water Management, 98(8): 1297-1306.Agricultural water productivity (WP) has been recognized as an important indicator of agricultural water management. This study assesses the WP for irrigated (WPI) and rainfed (WPR) crops in the Yellow River Basin (YRB) in China. WPI and WPR are calculated for major crops (corn, wheat, rice, and soybean) using experimental, statistical and empirically estimated data. The spatial variability of WPI and WRR is analyzed with regard to water and energy factors. Results show that although irrigated corn and soybean yields are significantly higher than rainfed yields in different regions of the YRB, WPI is slightly lower than WPR for these two crops. This can be explained by the seasonal coincidence of precipitation and solar energy patterns in the YRB. However, as expected, irrigation stabilizes crop production per unit of water consumption over space. WPI and WPR vary spatially from upstream to downstream in the YRB as a result of varying climate and water supply conditions. The water factor has stronger effects on both crop yield and WP than the energy factor in the upper and middle basin, whereas energy matters more in the lower basin. Moreover, WP in terms of crop yield is compared to that in terms of agricultural GDP and the results are not consistent. This paper contributes to the WP studies by a basin context, a comparison between WPI and WPR, a comparison of WP in terms of crop yield and economic value, and insights on the water and energy factors on WP. Moreover, policy implications based on the WP analysis are provided.

DOI

[6]
Chen B, Han M Y, Peng Ket al., 2018. Global land-water nexus: Agricultural land and freshwater use embodied in worldwide supply chains.Science of the Total Environment, 613/614: 931-943.Abstract As agricultural land and freshwater inextricably interrelate and interact with each other, the conventional water and land policy in "silos" should give way to nexus thinking when formulating the land and water management strategies. This study constructs a systems multi-regional input-output (MRIO) model to expound global land-water nexus by simultaneously tracking agricultural land and freshwater use flows along the global supply chains. Furthermore, land productivity and irrigation water requirements of 160 crops in different regions are investigated to reflect the land-water linkage. Results show that developed economies (e.g., USA and Japan) and major large developing economies (e.g., mainland China and India) are the overriding drivers of agricultural land and freshwater use globally. In general, significant net transfers of these two resources are identified from resource-rich and less-developed economies to resource-poor and more-developed economies. For some crops, blue water productivity is inversely related to land productivity, indicating that irrigation water consumption is sometimes at odds with land use. The results could stimulus international cooperation for sustainable land and freshwater management targeting on original suppliers and final consumers along the global supply chains. Moreover, crop-specific land-water linkage could provide insights for trade-off decisions on minimizing the environmental impacts on local land and water resources. Copyright 2017 Elsevier B.V. All rights reserved.

DOI PMID

[7]
Chen Y N, Li W H, Deng H Jet al., 2016. Changes in Central Asia’s water tower: Past, present and future.Scientific Reports, 6: 35458.

[8]
Conrad C, Rahmann M, Machwitz Met al., 2013. Satellite based calculation of spatially distributed crop water requirements for cotton and wheat cultivation in Fergana Valley, Uzbekistan.Global and Planetary Change, 110: 88-98.61We assess the crop water demand of cotton and wheat in Fergana Valley, Uzbekistan.61Accurate crop maps from multi-sensor data in early irrigation phases are possible.61Replacing cotton with spring crops can reduce irrigation water requirements.61Spatially explicit information can be used for optimizing operation and maintenance.

DOI

[9]
Davis K F, Gephart J A, Emery K Aet al., 2016. Meeting future food demand with current agricultural resources.Global Environmental Change, 39: 125-132.Meeting the food needs of the growing and increasingly affluent human population with the planet’s limited resources is a major challenge of our time. Seen as the preferred approach to global food security issues, ‘sustainable intensification’ is the enhancement of crop yields while minimizing environmental impacts and preserving the ability of future generations to use the land. It is still unclear to what extent sustainable intensification would allow humanity to meet its demand for food commodities. Here we use the footprints for water, nitrogen, carbon and land to quantitatively evaluate resource demands and greenhouse gas (GHG) emissions of future agriculture and investigate whether an increase in these environmental burdens of food production can be avoided under a variety of dietary scenarios. We calculate average footprints of the current diet and find that animal products account for 43–87% of an individual’s environmental burden – compared to 18% of caloric intake and 39% of protein intake. Interestingly, we find that projected improvements in production efficiency would be insufficient to meet future food demand without also increasing the total environmental burden of food production. Transitioning to less impactful diets would in many cases allow production efficiency to keep pace with growth in human demand while minimizing the food system’s environmental burden. This study provides a useful approach for evaluating the attainability of sustainable targets and for better integrating food security and environmental impacts.

DOI

[10]
Deng H J, Chen Y N, 2017. Influences of recent climate change and human activities on water storage variations in Central Asia.Journal of Hydrology, 544: 46-57.Terrestrial water storage (TWS) change is an indicator of climate change. Therefore, it is helpful to understand how climate change impacts water systems. In this study, the influence of climate change on TWS in Central Asia over the past decade was analyzed using the Gravity Recovery and Climate Experiment satellites and Climatic Research Unit datasets. Results indicate that TWS experienced a decreasing trend in Central Asia from 2003 to 2013 at a rate of -4.44卤2.2 mm/a, and that the maximum positive anomaly for TWS (46 mm) occurred in July 2005, while the minimum negative anomaly (32.5 mm) occurred in March 2008-August 2009. The decreasing trend of TWS in northern Central Asia (-3.86卤0.63 mm/a) is mainly attributed to soil moisture storage depletion, which is driven primarily by the increase in evapotranspiration. In the mountainous regions, climate change exerted an influence on TWS by affecting glaciers and snow cover change. However, human activities are now the dominant factor driving the decline of TWS in the Aral Sea region and the northern Tarim River Basin.

DOI

[11]
Fernandez L, 2006. Natural resources, agriculture and property rights.Ecological Economics, 57(3): 359-373.The study explores empirically forest resource and soil quality degradation under different property rights regimes in a subsistence agriculture framework. The quantitative analysis is a direct test of the theoretical hypothesis of Larson and Bromley (1990) [Larson, B., Bromley, D., 1990. Property rights, externalities, and resource degradation: locating the tragedy. Journal of Development Economics 33 (2).] that common property and private property rights may lead to similar incentives for resource protection. A household model is formulated and applied empirically with data from Indonesia to test rates of forest biomass and soil quality degradation under private and common property rights. Results show that the two regimes may equal each other by including bequest value. Sensitivity analysis is conducted by changing model parameters.

DOI

[12]
Foley J A, Ramankutty N, Brauman K Aet al., 2011. Solutions for a cultivated planet.Nature, 478(7369): 337-342.

[13]
Godfray H C J, Beddington J R, Crute I Ret al., 2010. Food security: The challenge of feeding 9 billion people.Science, 327(5967): 812.Continuing population and consumption growth will mean that the global demand for food will increase for at least another 40 years. Growing competition for land, water, and energy, in addition to the overexploitation of fisheries, will affect our ability to produce food, as will the urgent requirement to reduce the impact of the food system on the environment. The effects of climate change are a further threat. But the world can produce more food and can ensure that it is used more efficiently and equitably. A multifaceted and linked global strategy is needed to ensure sustainable and equitable food security, different components of which are explored here. 2010 American Association for the Advancement for Science. All Rights Reserved.

DOI PMID

[14]
Gopalakrishnan G, Negri M C, Wang Met al., 2009. Biofuels, land, and water: A systems approach to sustainability.Environmental Science & Technology, 43(15): 6094-6100.There is a strong societal need to evaluate and understand the sustainability of biofuels, especially because of the significant increases in production mandated by many countries, including the United States. Sustainability will be a strong factor in the regulatory environment and investments in biofuels. Biomass feedstock production is an important contributor to environmental, social, and economic impacts from biofuels. This study presents a systems approach where the agricultural, energy, and environmental sectors are considered as components of a single system, and environmental liabilities are used as recoverable resources for biomass feedstock production. We focus on efficient use of land and water resources. We conducted a spatial analysis evaluating marginal land and degraded water resources to improve feedstock productivity with concomitant environmental restoration for the state of Nebraska. Results indicate that utilizing marginal land resources such as riparian and roadway buffer strips, brownfield sites, and marginal agricultural land could produce enough feedstocks to meet a maximum of 22% of the energy requirements of the state compared to the current supply of 2%. Degraded water resources such as nitrate-contaminated groundwater and wastewater were evaluated as sources of nutrients and water to improve feedstock productivity. Spatial overlap between degraded water and marginal land resources was found to be as high as 96% and could maintain sustainable feedstock production on marginal lands. Other benefits of implementing this strategy include feedstock intensification to decrease biomass transportation costs, restoration of contaminated water resources, and mitigation of greenhouse gas emissions.

DOI PMID

[15]
Hoogerbrugge I, Fresco L O, 2016. Homegarden Systems: Agricultural Characteristics and Challenges. Inge D Hoogerbrugge & Louise.

[16]
Jallah J K, Mulbah C K, Kiazolu J Set al., 1991. Efficient fertilizer use for increased crop production: The Liberia experience.Fertilizer Research, 29(1): 65-79.Fertilizer use in Nigeria, though growing, is still very low especially if considered in relation to the growing food needs of the country. Efforts have been made through scientific investigations to find ways of increasing fertilizer use efficiency in the humid zone of the country. Investigations have been carried out mainly on nitrogen, phosphorus, potassium, mixed and compound fertilizers. The secondary nutrients sulphur, calcium and magnesium as well as the micronutrients have received comparatively little attention. In the Southeastern humid zone, a considerable effort has been made to solve the problem of soil acidity through liming. Interaction of the primary nutrients under field conditions has not been investigated sufficiently.Results of experiments carried out on comparisons of P sources, urea placement methods and interaction of N, P, K, S fertilizers in the Ultisols of Southeastern Nigeria show that single superphosphate was superior to Togo phosphate rock, partially acidulated Togo phosphate rock, and diammonium phosphate for the production of maize. Methods of application of urea did not significantly affect maize grain yield. There was no significant interaction of N, P, K, S in the Ultisol but S was limiting. An application of a minimum of 45 kg/N/ha appears to be threshold for positive response to P by maize stover. More effort is needed to understand nutrient interaction in the Ultisols which are dominant in the humid Southern zone of Nigeria.

DOI

[17]
Ji L-L, Abuduwaili, Mubareke Aet al., 2009. Comparative analysis of the land water resources exploitation and its safety in the five countries of Central Asia.Journal of Glaciology and Geocryology, 31(5): 960-968. (in Chinese)Due to the climate change and human activities,the Aral Sea Basin crisis has become the most serious problem to the five Central Asian countries,and itis also considered as one of the importantglobal ecological safety problem.The increase of population,the expansion ofirrigation agricultureand low efficiency of water resources management have resulted in the degradation of the regional land-water ecosystemin this countries.In this paper,a comparative analysis of the water-land resources exploitationand its safety state index from the periodof the break-up of Soviet Union to 2007 was taken. The results showed that: 1) In the period of 1988-2007,Kazakhstan total population decreased;total renewablewater resources per capita and water-taking per capita presented an increasing trend. At the same time,the annual averagetotal internal and external water resources kept at the same level. In otherfour countries,the total water resources per capita appeareda decreasing trend. Uzbekistan is the largest fresh water consumption country,followed by Turkmenistan. At the same period,Uzbekistanand Turkmenistan used most of their water resources for agriculture purpose. Kazakhstan is the highest water consumption country in industries,and Uzbekistan is also the highest domestic water consumption country. In 2005,the fresh water output of Tajikistan and Turkmenistan decreased 99% as compared with that in 1989. 2) At the period of 1992-2005,except Turkmenistan,per capita irrigated area of other four counties decreased year by year. At the same period,the forest and grass land areas of Kazakhstan decreasedfor some degree. However,itpresented an expanding trend in Kyrgyzstan and Uzbekistan. The forest areas of Tajikistan and Turkmenistan almost kept at the same level,but grass land area decreased;Uzbekistan is the largest fertilizer user country and has therather serious problem with soil salinization among other Central Asian counties,the proportion of salinized land to total irrigated area expanded from 50% in 1994 to 65^9% in 2001.

DOI

[18]
Karen F, 2013. Irrigation in Central Asia in Figures. AQUASTAT Survey-2012, FAO Water Reports 39.

[19]
Kitamura Y, Yano T, Yasuda Set al., 2000. Water and salt behavior in an irrigation block under rice-based cropping system in Central Asia: Research on water management to prevent secondary salinization in arid land (II).Transactions of the Japanese Society of Irrigation Drainage & Reclamation Engineering, 68: 183-192.

[20]
Kotlyakov V M, 1991. The Aral Sea Basin: A critical environmental zone.Environment: Science and Policy for Sustainable Development, 33(1): 4-38.

[21]
Kulmatov R, 2014. Problems of sustainable use and management of water and land resources in Uzbekistan.Journal of Water Resource and Protection, 6(1): 35-42.

[22]
Lenhardt P P, Brãhl C A, Leeb Cet al., 2017. Amphibian population genetics in agricultural landscapes: Does viniculture drive the population structuring of the European common frog (Rana temporaria)?Peerj, 5(7): e3520.Abstract Amphibian populations have been declining globally over the past decades. The intensification of agriculture, habitat loss, fragmentation of populations and toxic substances in the environment are considered as driving factors for this decline. Today, about 50% of the area of Germany is used for agriculture and is inhabited by a diverse variety of 20 amphibian species. Of these, 19 are exhibiting declining populations. Due to the protection status of native amphibian species, it is important to evaluate the effect of land use and associated stressors (such as road mortality and pesticide toxicity) on the genetic population structure of amphibians in agricultural landscapes. We investigated the effects of viniculture on the genetic differentiation of European common frog ( Rana temporaria ) populations in Southern Palatinate (Germany). We analyzed microsatellite data of ten loci from ten breeding pond populations located within viniculture landscape and in the adjacent forest block and compared these results with a previously developed landscape permeability model. We tested for significant correlation of genetic population differentiation and landscape elements, including land use as well as roads and their associated traffic intensity, to explain the genetic structure in the study area. Genetic differentiation among forest populations was significantly lower (median pairwise F ST 0002=00020.0041 at 5.39 km to 0.0159 at 9.400002km distance) than between viniculture populations (median pairwise F ST 0002=00020.0215 at 2.340002km to 0.0987 at 2.390002km distance). Our analyses rejected isolation by distance based on roads and associated traffic intensity as the sole explanation of the genetic differentiation and suggest that the viniculture landscape has to be considered as a limiting barrier for R. temporaria migration, partially confirming the isolation of breeding ponds predicted by the landscape permeability model. Therefore, arable land may act as a sink habitat, inhibiting genetic exchange and causing genetic differentiation of pond populations in agricultural areas. In viniculture, pesticides could be a driving factor for the observed genetic impoverishment, since pesticides are more frequently applied than any other management measure and can be highly toxic for terrestrial life stages of amphibians.

DOI PMID

[23]
Lerman Z, 2008. Agricultural development in Uzbekistan: The effect of ongoing reforms. Discussion Papers.

[24]
Li Z, Chen Y N, Fang G Het al., 2017. Multivariate assessment and attribution of droughts in Central Asia.Scientific Reports, 7: 1316.While the method for estimating the Palmer Drought Severity Index (PDSI) is now more closely aligned to key water balance components, a comprehensive assessment for measuring long-term droughts that recognizes meteorological, agro-ecological and hydrological perspectives and their attributions is still lacking. Based on physical approaches linked to potential evapotranspiration (PET), the PDSI in 1965-2014 showed a mixture of drying (42% of the land area) and wetting (58% of the land area) that combined to give a slightly wetting trend (0.0036 per year). Despite the smaller overall trend, there is a switch to a drying trend over the past decade (0.023 per year). We designed numerical experiments and found that PDSI trend responding to the dramatic increase in air temperature and slight change in precipitation. The variabilities of meteorological and agro-ecological droughts were broadly comparable to various PDSI drought index. Interestingly, the hydrological drought was not completely comparable to the PDSI, which indicates that runoff in arid and semi-arid regions was not generated primarily from precipitation. Instead, fraction of glacierized areas in catchments caused large variations in the observed runoff changes.

DOI PMID

[25]
Mittu B, Chauhan A, 2015. Soil health: An issue of concern for environment and agriculture.Journal of Bioremediation & Biodegradation, 6(3): 1-4.

[26]
Platonov A, Thenkabail P S, Biradar C Met al., 2008. Water Productivity Mapping (WPM) using Landsat ETM+ data for the irrigated croplands of the Syrdarya River Basin in Central Asia.Sensors, 8(12): 8156-8180.The overarching goal of this paper was to espouse methods and protocols for water productivity mapping (WPM) using high spatial resolution Landsat remote sensing data. In a world where land and water for agriculture are becoming increasingly scarce, growing “more crop per drop” (increasing water productivity) becomes crucial for food security of future generations. The study used time-series Landsat ETM+ data to produce WPMs of irrigated crops, with emphasis on cotton in the Galaba study area in the Syrdarya river basin of Central Asia. The WPM methods and protocols using remote sensing data consisted of: (1) crop productivity (ton/ha) maps (CPMs) involvingcrop type classification, crop yield and biophysical modeling, and extrapolating yield models to larger areas using remotely sensed data; (2) crop water use (m3/ha) maps (WUMs) (or actual seasonal evapotranspiration or actual ET) developed through Simplified Surface Energy Balance (SSEB) model; and (3) water productivity (kg/m3) maps (WPMs) produced by dividing raster layers of CPMs by WUMs. The SSEB model calculated WUMs (actual ET) by multiplying the ET fractionby reference ET. The ETfraction was determined using Landsat thermal imagery by selecting the “hot” pixels (zero ET) and “cold” pixels (maximum ET). The grass reference ET was calculated by FAO Penman-Monteith method using meteorological data. The WPMs for the Galaba study area demonstrated a wide variations (0-0.54 kg/m3) in water productivity of cotton fields with overwhelming proportion (87%) of the area having WP less than 0.30 kg/m3, 11% of the area having WP in range of 0.30-0.36 kg/m3, and only 2% of the area with WP greater than 0.36 kg/m3. These results clearly imply that there are opportunities for significant WP increases in overwhelming proportion of the existing croplands. The areas of low WP are spatially pin-pointed and can be used as focus for WP improvements through better land and water management practices.

DOI PMID

[27]
Restuccia D, Yang D T, Zhu X, 2008. Agriculture and aggregate productivity: A quantitative cross-country analysis.Journal of Monetary Economics, 55(2): 234-250.A decomposition of aggregate labor productivity based on internationally comparable data reveals that a high share of employment and low labor productivity in agriculture are mainly responsible for low aggregate productivity in poor countries. Using a two-sector general-equilibrium model, we show that differences in economy-wide productivity, barriers to modern intermediate inputs in agriculture, and barriers in the labor market generate large cross-country differences in the share of employment and labor productivity in agriculture. The model implies a factor difference of 10.8 in aggregate labor productivity between the richest and the poorest 5% of the countries in the world, leaving the unexplained factor at 3.2. Overall, this two-sector framework performs much better than a single-sector growth model in explaining observed differences in international productivity.

DOI

[28]
Revelle R, 1976. The resources available for agriculture.Scientific American, 235(235): 164-178.The physical resources of earth fire and water although they are very large are ultimately fixed. However the biological and social resources are far from being pressed to the limit. According to Thomas Malthus the human population will always increase until it reaches the limit set by the food supply. This limit is determined by the physical resources available for agriculture. He recognized that farm production increases with improved technology; however the rates of increase would always be lower than the potential capacity of human beings to multiply. This paper considers the inverse of Malthuss proposition--whether the effective utilization of resources for food production can be made to increase the limits set by human population size. A more important inquiry is whether rates of growth of agricultural production can be made to exceed rates of population growth. It is noted that the amount of cultivated land per person could be increased in every part of the world by the year 2000. However large capital investments would be needed for a major increase in crop yield in favorable regions. One way to accomplish this is to increase scientific knowledge of plant and animal biology and of the environment and to transform scientific advances into practical knowledge farmers can use. In addition many resources other than arable land and water must be utilized to increase world food production.

DOI

[29]
Schneider U A, Havlík P, Schmid Eet al., 2011. Impacts of population growth, economic development, and technical change on global food production and consumption.Agricultural Systems, 104(2): 204-215.Over the next decades mankind will demand more food from fewer land and water resources. This study quantifies the food production impacts of four alternative development scenarios from the Millennium Ecosystem Assessment and the Special Report on Emission Scenarios. Partially and jointly considered are land and water supply impacts from population growth, and technical change, as well as forest and agricultural commodity demand shifts from population growth and economic development. The income impacts on food demand are computed with dynamic elasticities. Simulations with a global, partial equilibrium model of the agricultural and forest sectors show that per capita food levels increase in all examined development scenarios with minor impacts on food prices. Global agricultural land increases by up to 14% between 2010 and 2030. Deforestation restrictions strongly impact the price of land and water resources but have little consequences for the global level of food production and food prices. While projected income changes have the highest partial impact on per capita food consumption levels, population growth leads to the highest increase in total food production. The impact of technical change is amplified or mitigated by adaptations of land management intensities.

DOI

[30]
Smith M, 2000. The application of climatic data for planning and management of sustainable rainfed and irrigated crop production.Agricultural and Forest Meteorology, 103: 99-108.Sustainable food production will depend on the judicious use of water resources as fresh water for human consumption and agriculture is becoming increasingly scarce. To meet future food demands and growing competition for clean water, a more effective use of water in both irrigated and rainfed agriculture will be essential. Options to increase water use efficiency include the conservation of rainfall, the reduction of irrigation water losses and the adoption of cultural practices that will increase production per unit of water. Water use for crop production is depending on the interaction of climatic parameters that determine crop evapotranspiration and water supply from rain. The compilation, processing and analysis of meteorological information for crop water use and crop production will therefore constitute a key element in developing strategies to optimize the use of water for crop production and to introduce effective water management practices. In the 1970s, FAO developed practical procedures to estimate crop water requirements and yield response to water stress which have become widely accepted standards in the planning and management of irrigated and rainfed agriculture. As a follow-up to recommendations of a panel of high-level experts convened in 1990, further studies have been carried out which have led to the development of revised procedures for reference evapotranspiration and crop evapotranspiration. The new procedures and guidelines have been recently published in the FAO Irrigation and Drainage series and include the adoption of the Penman onteith approach as the new standard for determining reference crop evapotranspiration (ET o) calculations. Procedures have been developed to use the method also in conditions when no or limited data on humidity, radiation and wind speed are available. Procedures for estimating crop evapotranspiration are revised with an update of the crop coefficients that allow more accurate estimates for a wide range of crops and for various crop, soil and water management practices. Daily ET o calculations are included by separating soil evaporation and crop transpiration estimates through the dual crop coefficient. The use of climatic data for the development of practical criteria in planning and management of irrigated and rainfed crop production is demonstrated at the hand of some examples using the FAO computer programmes and climatic database. Agrometeorology needs to play a key role in the looming global water crisis. Appropriate strategies and policies need to be defined, including strengthening of national capacities in the use of climatic data for planning and management of sustainable agriculture and drought mitigation. Cooperation between FAO and WMO in this field may serve as an example of such efforts.

DOI

[31]
Tanirbergenov S I, Suleimenov B U, Saparov A Set al., 2016. The fertilizer system increasing the salt tolerance and productivity of cotton in the conditions of saline soils in southern Kazakhstan.Research Journal of Pharmaceutical Biological & Chemical Sciences, 7(6): 147-155.

[32]
Thevs N, Ovezmuradov K, Zanjani L Vet al., 2015. Water consumption of agriculture and natural ecosystems at the Amu Darya in Lebap Province, Turkmenistan.Environmental Earth Sciences, 73(2): 731-741.The Amu Darya River is the major water source for Turkmenistan contributing 8802% to the total amount of surface water available to the country. Lebap Province harbours oases and natural riparian vegetation along the Amu Darya River. In the oases, cotton, wheat, and corn as well as fruit and vegetables are grown under irrigation. While cotton was strongly promoted during Soviet Union times, the wheat area was enlarged after independency02of Turkmenistan, in order to secure food self-sufficiency. In the literature, a very high crop water requirement has been reported for cotton in Turkmenistan. In this paper, the objective is to investigate the consumptive water use, i.e. actual evapotranspiration, of the major crops cotton, wheat, and corn, the household plots, and the natural vegetation within Lebap Province of Turkmenistan. Actual evapotranspiration (ET a ) was mapped from Landsat satellite images for the vegetation seasons 2009 and 2010. Additionally, reference ET (ET o ) and crop ET (ET c ) were calculated. ET a for riparian (Tugai) forests and Tamarix shrubs was 907–1,043 and 239–25902mm, respectively. ET a for the mapped crops cotton, wheat, rice, and gardens was 485–658, 156–350, 685–935, and 416–61502mm, respectively. ET o was 929 and 97902mm in 2009 and 2010, respectively. ET c for cotton and rice was 89602mm in 2009 and 92502mm in 2010 and 1,08502mm in 2009 and 1,19802mm in 2010, respectively. The low ET a values are explained partly by under-estimation through the method applied, partly by low yields of the crops. There is a big gap between the amount of water taken up from the Amu Darya and the water really consumed by the irrigated crops. This low water use efficiency might be due to water losses from channels and high amounts of water needed for soil preparation, i.e. leaching of salts.

DOI

[33]
Tilman D, Cassman K G, Matson P Aet al., 2002. Agricultural sustainability and intensive production practices.Nature, 418(6898): 671-677.

[34]
Visser O, 2016. Running out of farmland? Investment discourses, unstable land values and the sluggishness of asset making.Agriculture & Human Values: 1-14.This article critically analyzes the assumption that land is becoming increasingly scarce and that, therefore, farmland values are bound to rise across the globe. It investigates the process of land value creation, as well as its flipside: value erosion and stagnation, looking at the various mechanisms involved in each. As such, it is a study of how the financialization of agriculture affects the process of land commoditization. I show that, for farmland to be turned into an asset, a whole range of conditions have to be fulfilled, presenting a typology of asset making in the context of farmland. Asset making, like commoditization, is a process of assemblage, and it is less straightforward and less stable than generally assumed. Further, I argue that ‘asset making’ is not a one-way process. The article is based on an analysis of global data on land values and the case of farmland investment in post-Soviet farmland (Russia and Ukraine).

DOI

[35]
Vyshpolsky F, Qadir M, Karimov Aet al., 2010. Enhancing the productivity of high-magnesium soil and water resources in Central Asia through the application of phosphogypsum.Land Degradation & Development, 19(1): 45-56.Recent evidences from some irrigated areas worldwide, such as Central Asia, suggest that water used for irrigation contains magnesium (Mg2+) at levels higher than calcium (Ca2+). Excess levels of Mg2+ in irrigation water and/or in soil, in combination with sodium (Na+) or alone, result in soil degradation because of Mg2+ effects on the soil's physical properties. More than 30 per cent of irrigated lands in Southern Kazakhstan having excess levels of Mg2+ are characterized by low infiltration rates and hydraulic conductivities. The consequence has been a gradual decline in the yield of cotton ( Gossypium hirsutum L.), which is commonly grown in the region. These soils require adequate quantities of Ca2+ to mitigate the effects of excess Mg2+. As a source of Ca2+, phosphogypsum - a byproduct of the phosphorous fertilizer industry - is available in some parts of Central Asia. In participation with the local farming community, we carried out a 4-year field experiment in Southern Kazakhstan to evaluate the effects of soil application of phosphogypsum - 0, 4·5, and 8·0 metric ton per hectare (t ha-1) - on chemical changes in a soil containing excess levels of Mg2+, and on cotton yield and economics. The canal water had Mg2+ to Ca2+ ratio ranging from 1·30 to 1·66 during irrigation period. The application of phosphogypsum increased Ca2+ concentration in the soil and triggered the replacement of excess Mg2+ from the cation exchange complex. After harvesting the first crop, there was 18 per cent decrease in exchangeable magnesium percentage (EMP) of the surface 0·2 m soil over the pre-experiment EMP level in the plots where phosphogypsum was applied at 4·5 t ha-1, and a 31 per cent decrease in EMP in plots treated with phosphogypsum at 8 t ha-1. Additional beneficial effect of the amendment was an increase in the soil phosphorus content. The 4-year average cotton yields were 2·6 t ha-1 with 8 t ha-1 phosphogypsum, 2·4 t ha-1 with 4·5 t ha-1 phosphogypsum, and 1·4 t ha-1 with the control. Since the amendment was applied once at the beginning, exchangeable Mg2+ levels tended to increase 4 years after its application, particularly in the treatment with 4·5 t ha-1 phosphogypsum. Thus, there would be a need for phosphogypsum application to such soils after every 4-5 years to optimize the ionic balance and sustain higher levels of cotton production. The economic benefits from the phosphogypsum treatments were almost twice those from the control. Copyright 08 2007 John Wiley & Sons, Ltd.

DOI

[36]
Xie G D, Qi W H, Zhang Y Set al., 1998. A study on utilization efficiency of main agricultural resourcesResources Science, 20(5): 10-14. (in Chinese)

[37]
Zhang M, Chen Y N, Shen Y Jet al., 2017. Changes of precipitation extremes in arid Central Asia.Quaternary International, 436: 16-27. doi:10.1016/j.quaint.2016.12.024.Despite growing evidence of increasing precipitation extremes around the world, research into extreme precipitation events in Central Asia (CA) is still scarce. In this study, based on daily precipitation records from 22 meteorological stations, several methods were used to detect the spatial-temporal distribution, abrupt change and return periods for six extreme precipitation indices as well as the total annual precipitation during 1938–2005 in CA. The results show that all precipitation indices experienced increasing trend except for annual maximum number of consecutive dry days (CDD), which had a significant decreasing trend. Abrupt changes for most of precipitation indices mainly occurred around 1957 during 1938–2005. Return periods for all seven precipitation indices concentrated in 10-year period. Meanwhile, all precipitation indices showed spatial diversity and heterogeneity, and the entire area tended to be wetter and experienced fewer dry conditions. Understanding these changes of precipitation extremes in CA will definitely benefit to water resource management, natural hazard prevention and mitigation, and reliable future projections in this region.

DOI

[38]
Zhao F J, Ma Y, Zhu Y Get al., 2015. Soil contamination in China: Current status and mitigation strategies.Environmental Science & Technology, 49(2): 750-759.China faces great challenges in protecting its soil from contamination caused by rapid industrialization and urbanization over the last three decades. Recent nationwide surveys show that 16% of the soil samples, 19% for the agricultural soils, are contaminated based on China soil environmental quality limits, mainly with heavy and metalloids. Comparisons with other regions of the world show that the current status of soil contamination, based on the total contaminant concentrations, is not worse in China. However, the concentrations of some heavy in Chinese soils appear to be increasing at much greater rates. Exceedance of the contaminant limits in food crops is widespread in some areas, especially southern China, due to elevated inputs of contaminants, acidic nature of the soil and crop species or cultivars prone to heavy metal accumulation. Minimizing the transfer of contaminants from soil to the food chain is a top priority. A number of options are proposed, including identification of the sources of contaminants to agricultural systems, minimization of contaminant inputs, reduction of heavy metal phytoavailability in soil with liming or other immobilizing materials, selection and breeding of low accumulating crop cultivars, adoption of appropriate and fertilizer management, bioremediation, and change of land use to grow nonfood crops. Implementation of these strategies requires not only technological advances, but also social-economic evaluation and effective enforcement of environmental protection law.

DOI PMID

Outlines

/