Orginal Article

Detecting and mapping annual newly-burned plots (NBP) of swiddening using historical Landsat data in Montane Mainland Southeast Asia (MMSEA) during 1988-2016

  • LI Peng , 1, 2 ,
  • FENG Zhiming , 1, 2 ,
  • XIAO Chiwei 1, 2 ,
  • BOUDMYXAY Khampheng 1, 2 ,
  • LIU Yu 1
Expand
  • 1. Institute of Geographic Sciences and Natural Resources Research, CAS, Beijing 100101, China
  • 2. College of Resources and Environment, University of Chinese Academy of Sciences, Beijing 100049, China
*Corresponding author: Feng Zhiming (1963-), PhD and Professor, specialized in regional sustainable development and efficient utilization of resources. E-mail:

Author: Li Peng (1984-), PhD and Associate Professor, specialized in remote sensing of natural resources, land use and cover changes. E-mail: ; https://orcid.org/0000-0002-0849-5955

Received date: 2017-06-07

  Accepted date: 2018-01-21

  Online published: 2018-09-25

Supported by

National Natural Science Foundation of China, No.41301090

Copyright

Journal of Geographical Sciences, All Rights Reserved

Abstract

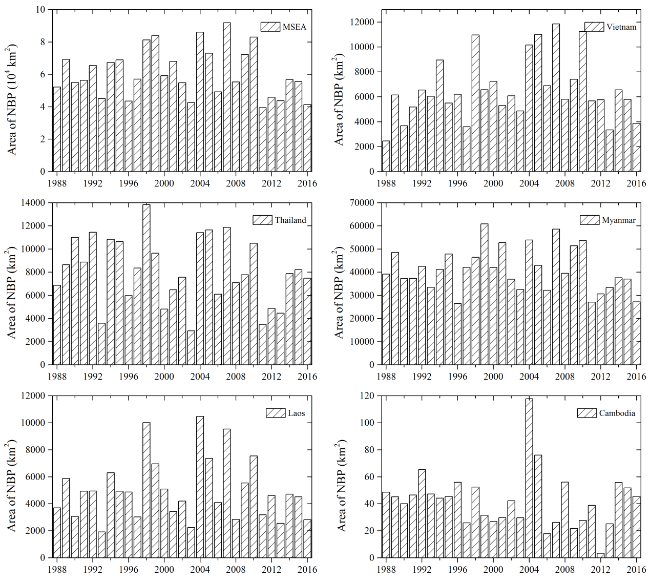
Swidden agriculture is by far the dominant land use system in the uplands of Southeast Asia (SEA), as well as other tropical regions, which plays an important role in the implementation of Reducing Emissions from Deforestation and Forest Degradation (REDD) of United Nations. To our knowledge, the long-term inter-annual area of newly burned plots (NBP) of swidden agriculture in mainland Southeast Asia is still not available, let alone in the whole tropics. With the strengthening regional geo-economic cooperation in SEA, swidden agriculture has experienced and/or is still experiencing extensive and drastic transformations into other diverse market-oriented land use types since the 1990s. In this study, high-level surface reflectance products of Landsat 4/5/7/8 family sensors including Thematic Mapper (TM), Enhanced Thematic Mapper Plus (ETM+) and Operational Land Imager (OLI) acquired in March, April and May of each year between 1988 and 2016 were firstly utilized to detect and monitor the extent and area of NBP of swidden agriculture with multiple thresholds of four commonly-used vegetation indices, namely the Normalized Difference Vegetation Index (NDVI), Normalized Difference Moisture Index (NDMI), Normalized Burn Ratio (NBR) and Soil Adjusted Vegetation Index (SAVI), in combination with local phenological features of swiddening and topographical data. The results showed that: (1) an annual average of 6.08×10⁴ km2 of NBP of swidden agriculture, or 3.15% of the total land area of MSEA, were estimated in the past nearly three decades. (2) Annual NBP were primarily distributed in four major geomorphic units including the Central Range of Hills, Northern Mountainous Region, Western Myanmar Hills, and Annamite Chain. (3) A decadal average analysis indicated that the NBP of swidden agriculture opened year by year declined as a whole, especially after 2010, merely with an average of 5.23×10⁴ km2. (4) The top ten provincial administrative units in Cambodia, Laos, Myanmar, Thailand and Vietnam, which consistently accounted for over 90% of the newly opened swiddens of each country, showed distinct fluctuations in using slash-and-burn practices in the last decades. The Landsat-based (30 m) reconstructed 29-year longitudinal updated maps (including extent and area) of the NBP of swidden agriculture may contribute to REDD and local livelihood related studies in Continental Southeast Asia. Our study further demonstrated that the multiple vegetative indices thresholds approach holds great potential in detecting swidden agriculture in tropical mountainous regions.

Cite this article

LI Peng , FENG Zhiming , XIAO Chiwei , BOUDMYXAY Khampheng , LIU Yu . Detecting and mapping annual newly-burned plots (NBP) of swiddening using historical Landsat data in Montane Mainland Southeast Asia (MMSEA) during 1988-2016[J]. Journal of Geographical Sciences, 2018 , 28(9) : 1307 -1328 . DOI: 10.1007/s11442-018-1527-4

1 Introduction

Almost 300-500 million upland farmers from over 60 countries in the tropics practice swidden agriculture in the mountainous and hilly regions of Latin America, Central Africa and South/Southeast Asia (Goldammer, 1988; Brady, 1996; van Vliet et al., 2012; Li et al., 2014). Because swidden agriculture involves quasi-periodic slashing and burning of natural and secondary vegetation in the same place (Li et al., 2014), deforestation and forest degradation are the major concerns to global environmental consequences (Achard et al., 2014; Fox et al., 2014). Southeast Asia (SEA) therefore underwent the highest percentage of deforestation rate and prominent forest degradation (Achard et al., 2002; Corlett, 2005; Stibig et al., 2014). Rainforest and dry biomes in mainland Southeast Asia (MSEA) are seriously impacted by the prevailing slash and burn tactics, which raise severe soil erosion and water quality decline (Gupta, 2005; Ziegler et al., 2009; Zwartendijk et al., 2017). Additionally, swidden agriculture is either shortened in the fallow length (Li et al., 2014; Liao et al., 2015) or replaced by other intensified land uses (Ziegler et al., 2011; Laurance et al., 2014; Dressler et al., 2016), particularly agriculture and industrial tree plantations (e.g. rubber, teak, and oil palm). The transformation of swidden agriculture exerts different effects on biological diversity (Rerkasem et al., 2009; Laurance et al., 2014), livelihoods and ecosystem services (Dressler et al., 2015, 2016), and causes substantial reductions of aboveground carbon stocks and soil organic carbon stocks (Bruun et al., 2009; Achard et al., 2014). Therefore, the detection and mapping of updated and historical information of swidden agriculture with remotely sensed data is of great significance to scientific community and serves as prerequisite data basis for swiddening related impacts research. Besides, several recent programmes or initiatives of global influence, such as the United Nations Collaborative Programme on Reducing Emissions from Deforestation and Forest Degradation (or UN-REDD) in Developing Countries, the Belt and Road Initiative (BRI), and the Sustainable Development Goals (SDGs) also call for enhancing mountainous problems research to promote poverty eradication, rainforests protection and regional prosperity.
Swidden agriculture is a dominant land use type in the tropics characterized by its diversity, complexity and dynamics (Padoch et al., 2007; Schmidt-Vogt et al., 2009). It hence brings about much difficulty in swidden agriculture monitoring with remote sensing data (Messerli et al., 2009; Cummings et al., 2017). Currently, there is still a surprising lack of global historical fundamental geographical data of swidden agriculture (Padoch et al., 2007; Schmidt-Vogt et al., 2009). With the strengthening regional economic cooperation in SEA, swidden agriculture has experienced drastic transformations into other diverse market-oriented land use types since the 1990s (Dressler et al., 2016). However, there is very limited information on the basic geographical and demographic data of swidden agriculture (Mertz et al., 2009; Schmidt-Vogt et al., 2009), especially in the mainland part (Li et al., 2016). Recently, a landscape mosaics approach was developed to quantify swidden agriculture in Laos (Messerli et al., 2009; Hett et al., 2012). Then, a modified landscape metrics approach based on Moderate Resolution Imaging Spectroradiometer (MODIS) time-series products was also developed to overcome the dependency on the availability of existing land cover data (Hurni et al., 2013, 2013). It is important to note that the above-mentioned swidden agriculture monitoring approaches either rely on existing land cover inventories or use coarse spatial resolution data, such as MODIS (250 m). The existing land cover data neglect the land use changes information of a region (Hurni et al., 2013) and cannot meet the needs of science and policy researchers in a timely manner. In addition, coarser spatial resolution data usually lead to misclassification and omission as swidden agriculture normally have a small area less than 0.01 km2 (Padoch et al., 2007). Therefore, it requires timely and updated geospatial datasets of newly-burned plots (NBP) of swidden agriculture at finer spatial and improved temporal resolution (Cummings et al., 2017).
Lately, we have developed an approach that takes advantage of multiple spectral bands including the visible, near-infrared (NIR), and shortwave-infrared (SWIR) of Landsat-8 Operational Land Imager (OLI) sensor to generate the first map of swidden agriculture in mainland Southeast Asia and Yunnan Province, China (Li et al., 2016). This approach is based on the unique phenological features of swidden agriculture, i.e., swiddening involves quasi-periodic slashing and burning of natural and secondary vegetation in the same place during March and April every certain years (Li et al., 2014; Liao et al., 2015). The NBP of swidden agriculture are a mixture of felled, dried, and burned vegetation (with reduced moisture content) and exposed (or burned) soil during the peak of dry season. An integrated algorithm based on four vegetation indices, including the Normalized Difference Vegetation Index (NDVI) (Tucker et al., 1986), Normalized Difference Moisture Index (NDMI) (Vogelmann et al., 1988), Normalized Burn Ratio (NBR) (García et al., 1991) and Soil Adjusted Vegetation Index (SAVI) (Huete, 1988), was developed to identify and track those imaging pixels that experienced slashing, drying and burning over time. NDVI and NBR are sensitive to sparse canopy cover (e.g. swidden agriculture) while saturate in case of moderate and dense canopy (e.g. evergreen forests) (Gamon et al., 1995; Fernández-Manso et al., 2016). However, NDMI continues to reflect changes in vegetation moisture content at dense canopy cover (Jackson et al., 2004) and SAVI considerably eliminated soil-induced variations and reduced the saturation effect (Huete, 1988; Huete et al., 1997). Unlike other landscape ecology based approaches that primarily use existing land cover data, the Landsat-based multi-step threshold algorithm combines vegetation indices that are sensitive to changes in the vegetation canopy, land surface moisture, and exposed soils. The usage of Landsat intra- and inter-annual images for reconstructing the change trajectories of land use has become a novel research trend (Dong et al., 2016; Dutrieux et al., 2016; Huang et al., 2017), since the free access to Landsat imagery (Woodcock et al., 2008). To our knowledge, no study has applied the intra- and inter-annual Landsat data during the dry season to delineate the newly-burned swidden in the tropics.
In this study, we used our recently reported algorithm to generate the 29-year longitudinal maps of the NBP of swidden agriculture in MMSEA with Landsat historical data products during 1988-2016. The objective is twofold: (1) to generate time-series datasets of NBP of swidden agriculture at 30-m spatial resolution, using annual Landsat-derived vegetation indices (NDVI, SAVI, NDMI and NBR) products, and (2) to analyze annual area changes of the NBP of swidden agriculture at provincial (top ten), national (Cambodia, Laos, Myanmar, Thailand and Vietnam) and regional (MSEA) levels. The nearly three decadal resultant maps of the NBP of swidden agriculture in this study could be used to support rural livelihoods improvement, environmental effects evaluation, biodiversity conservation and carbon stocks estimations as basic data source. If the multiple vegetation indices thresholds approach is feasible, then it can be expandable for swiddening monitoring in tropical mountainous regions.

2 Materials and methods

2.1 Study area

Mainland Southeast Asia (MSEA), also known as Continental Southeast Asia (Figure 1), is a subregion of Southeast Asia which comprises Cambodia, Laos, Myanmar, Thailand, and Vietnam (Chuan, 2005). The region has a tropical monsoon climate featured by greater seasonality, more extremes in both temperature and precipitation, and more pronounced dry spells per year (Chuan, 2005). In the regard of seasonality, MSEA has a cool-dry season from November to February, hot-dry season (March-April), and rainy season between May and October. The dry season (northeast monsoon) is characterized by low cloud cover with less than 20 mm of rainfall per month. The climate condition not only facilitates the felling, drying, burning of household-based swidden agriculture in this duration, but also contributes to larger acquisition probabilities for Landsat observations with low cloud cover threshold, say, less than or equal to 30% (Li et al., 2018; Xiao et al., 2018).
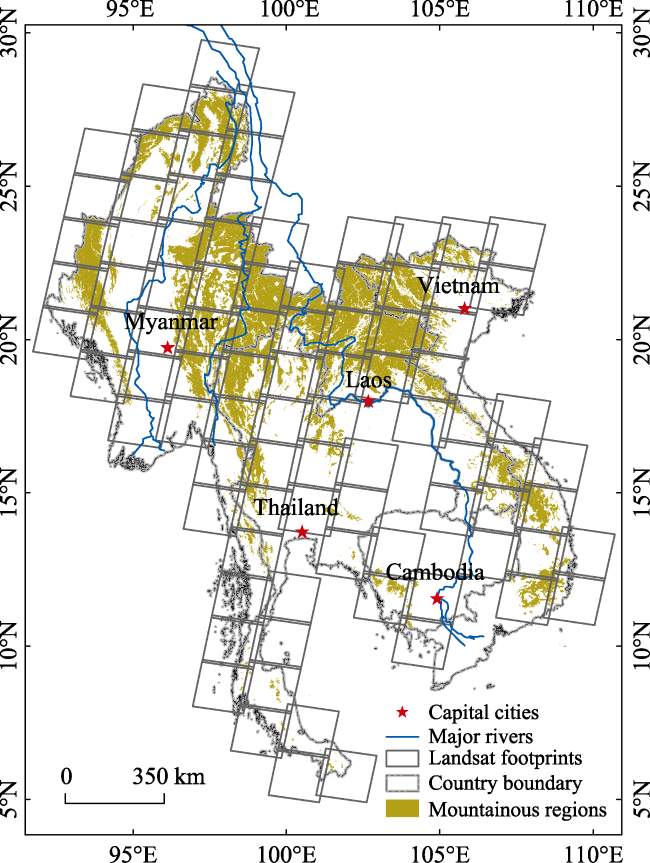
Figure 1 The location map of mainland Southeast Asia (MSEA)^Note: The dark yellow part refers to the redefined mountainous area (or the Redefined MMSEA) covered by 91 Landsat footprints (Path/Row)
Montane Mainland Southeast Asia (MMSEA), or the mountainous regions of MSEA, usually refers to the upland area over 300 m above sea-level (asl) (Ziegler et al., 2009; Fox et al., 2014). MMSEA normally consists of most parts of Northern Mountainous Region, Western Myanmar Hills, Central Range of Hills (including Shan Highland, Hills of Northern Thailand and Laos, Tenasserim Hills, and Central Highland of Malay Peninsula), Elephant and Cardamom Hills, and Annamite Chain (Gupta, 2005). Also, MMSEA is an important part of Zomia, a geographical term referring to the huge mass historically beyond the control of neighboring powerful governments (Van Schendel, 2002; Michaud, 2010). In the uplands, acrisols are the dominated soil types which limit grain output due to high acidity, low fertility, and erosion proneness (Dudal, 2005). Hence, swidden agriculture with short-term fallow cycles is still very common, but experiencing rapid transformation into other acid-tolerant commercial plantations, such as rubber, banana and oil palm (Dudal, 2005). In this study, a redefined mountainous area of MSEA (hereinafter refers as the Redefined MMSEA, see Figure 1) comprises the land with different parametrization of elevational and slope gradient as well as local relief based on the Mountain Research Initiative typology proposed by the United Nations Environment Programme World Conservation Monitoring Center (UNEP-WCMC) (Kapos et al., 2000). The introduction of topographical data (especially the local elevation range) was to reduce the spectral noise effects of permanent farmland and the corresponding human settlements on the detection of swidden agriculture. For more information about the defining process, one can refer to our previous study (Li et al., 2016).
MMSEA used to be the habitat of large, continuous tracts of natural forests (Corlett, 2005), which comprise evergreen mountain forests (>1000 m asl), evergreen lowland forests (<1000 m asl), mixed deciduous forests, and fragmented and degraded evergreen forest cover (Stibig et al., 2004, 2007). It also occupies the largest proportion of the remaining tropical forests in MSEA (Rerkasem et al., 2009). Around 2010, Cambodia, Laos, Myanmar and Vietnam became the partner countries of the UN-REDD programme in developing countries launched in 2008. Forest-dwelling people include the various and diverse ethnic groups (e.g. Akha, Chin, Hmong-Mien and Shan, etc.), and have been extensively practicing traditional subsistence agriculture (swidden farming) for ages. This traditional farming system therefore remains a dominant land use category in MMSEA (Fox et al., 2005; Schmidt-Vogt et al., 2009). In the past decades, under the pressure of population growth, economic development, and national ecological conservation policies, swidden agriculture has undergone extensive transformations, including conversion into cash-crops (rubber, sugar cane, and banana etcetera) cultivation and shortened fallow periods (Cairns, 2015).

2.2 Landsat data and vegetation indices products

Standard high-level surface reflectance products of Landsat Thematic Mapper (TM), Enhanced Thematic Mapper Plus (ETM+) and OLI were ordered, bulk-processed, freely downloaded from the United States Geological Survey (USGS) Earth Resources Observation and Science (EROS) Center Science Processing Architecture (ESPA) (https://espa.cr.usgs.gov/). EROS ESPA provides a number of data application options, including the source products (original input Level 1 products and metadata), top of atmosphere (TOA) reflectance, surface reflectance, C version function of mask (CFmask), and surface reflectance-based spectral indices, etcetera (USGS, 2016). After June 2, 2017, Landsat Collection 1 Higher-Level data products do not include CFMask processing but provide equivalent pixel-based information in the quality assessment (QA) band. Surface reflectance data are generated from the Landsat Ecosystem Disturbance Adaptive Processing System (LEDAPS) (Masek et al., 2006). CFmask bands, derived from TOA reflectance data, consist of the identification of cloud, cloud shadow, snow/ice and water (Zhu et al., 2012). Surface reflectance calculated spectral indices comprise the products of NDVI, SAVI, NDMI, NBR, and other three vegetation indices. In this study, the four forenamed spectral indices were selected to detect NBP of swidden agriculture (pixels), and the CFmask bands were used to exclude the cloud and cloud shadow pixels. The equations are given as follows:
\[NDVI=({{\rho }_{NIR}}-{{\rho }_{Red}})/({{\rho }_{NIR}}+{{\rho }_{Red}})\ (1)\]
\[SAVI=(1+L)\text{ }({{\rho }_{NIR}}-{{\rho }_{Red}})/({{\rho }_{NIR}}+{{\rho }_{Red}}+L)\ (2)\]
\[NDMI=({{\rho }_{NIR}}-{{\rho }_{SWIR1}})/({{\rho }_{NIR}}+{{\rho }_{SWIR1}})\ (3)\]
\[NBR=({{\rho }_{NIR}}-{{\rho }_{SWIR2}})/({{\rho }_{NIR}}+{{\rho }_{SWIR2}})\ (4)\]
where ρRed, ρNIR, ρSWIR1 and ρSWIR2 refer to surface reflectance values of the Red, NIR, SWIR1 and SWIR2 spectral bands of Landsat 4/5/7/8 TM, ETM+, and OLI sensors, respectively. The constant, L, represents the parameter of soil brightness correction. The L value varies from zero for higher vegetation densities to 1.0 for lower vegetation condition. Typically, an L value of 0.5 is the default setting for most situations, normally indicating intermediate vegetation densities.
Because the newly-burned swidden fields were primarily kept sun/air dried and intensively burned between March and April each year (Li et al., 2014), Landsat TM, ETM+, and OLI images acquired over MMSEA during the hot-dry season from 1988 to 2016 were all seriously selected without considering the issues of cloud coverage and Scan Line Corrector (SLC) failure for targeted pixels extraction. Besides, Landsat images gathered in May (post-burn stage and before cropping of rainy season) were also collected as alternate data sources due to data unavailability in the optimum period, i.e., from March to April. According to the Redefined MMSEA, 91 Landsat path/row (PR) coordinates cover the study area (Figure 1), with a total of 16,647 qualified scenes acquired during the past 29 years. However, 58 Landsat scenes (about 0.3%) could not be processed into surface reflectance data due to missing auxiliary input data and/or necessary thermal data (U.S. Geological Survey, 2016). The left 16,589 scenes used in this study, consisted of 9115 TM scenes (or 54.9%), 5,729 ETM+ scenes (or 34.6%, including 4542 ETM+ SLC-off scenes), and 1745 OLI scenes (or 10.5%). Among the 16,589 scenes, 50.1% of them had less than or equal to 30% cloud cover. More specifically, there were 28.8% of the scenes less than or equal to 10% cloud cover, 11.9% of the scenes greater than 10% and less than or equal to 20% cloud cover, and the remaining 9.4% scenes greater than 20% and less than or equal to 30% cloud cover. In the regard of the monthly number of scenes, there were 33.5% scenes in March, 34.2% scenes in April, and 32.3% scenes in May, respectively.
This study aims to extract annual average NBP area of swiddening pixels to the maximum extent based on the available Landsat images at 8- to 16-day interval. Although the phenological arrangement information of swidden agriculture during the dry season is typically known to scientific community, both the degrees of sun/air drying and the specific dates for man-made burning are not clear for imagery users. It therefore may not fully obtain the annually maximum extent and area of swidden agriculture using satellite images observed at only a single point in time (Hurni et al., 2013). One major improvement to this issue is to utilize all the Landsat imagery observed during the hot-dry season with the purpose of obtaining the utmost accurate spatial pattern of newly-burned swidden as far as possible.

2.3 The algorithm for detecting newly-burned plots (NBP) of swiddening fields in MSEA

Swidden agriculture detection with remote sensing techniques is always challenged due to its dynamics and complexity. For a given year, this traditional farming system usually displays various landscapes, such as newly-burned plots (including those under drying and freshly-burned), cultivated fields, and fallows (normally secondary forests) at different stages. In a previous study, swidden agriculture including the NBP of swidden agriculture and variously-aged fallows were detected, in a Time-for-Space substitution manner, using a multi-step threshold (MST) method with Landsat OLI derived vegetation indices (NDVI, SAVI, NDMI and NBR) in the Redefined MMSEA (Li et al., 2016). Because newly swidden fields were cleared during the hot dry season each year, in this study, swidden agriculture from 1988 to 2016 were consistently detected and mapped from the perspective of NBP by means of multiple spectral indices (NDVI, SAVI, NDMI and NBR) thresholds (hereinafter refer as MSIT). Specifically, the thresholds criteria comprise NDVI greater than or equal to 0.10, and SAVI, NDMI and NBR simultaneously less than or equal to 0.20, respectively. All the pixels of cloud and cloud shadow were excluded accordingly. The actual NBP of each image was extracted using the MSIT algorithm by intersecting with the Redefined MMSEA, followed by combining all potential NBP extracted from March to May each year into an annual NBP composite. Finally, a total of 29 resultant annual-maps of newly opened swidden over MMSEA were developed for the first time. Then, the spatial and temporal change patterns of NBP of swidden agriculture were analyzed for each country. The aforementioned data calculation and analysis were batch-processed based on Python programming language with ArcPy under ArcGIS 10.2 platform.

3 Results and analysis

3.1 Annual extent and area of the NBP of swiddening in Montane Mainland Southeast Asia (MMSEA) during 1988-2016

Figure 2 shows the 29-year longitudinal maps of the NBP of swidden agriculture in MSEA during 1988-2016. In the past nearly three decades, an annual average area of 6.08×10⁴ km2 of swidden plots, or 3.15% of the total land area, was newly opened each year in the uplands. Local highland ethnic groups (e.g. Akha, Chin, Hmong-Mien and Shan) usually practice the slash and burn tactics for multiple livelihoods purposes including agriculture (e.g. upland or dry rice and Job's tears), forestry (e.g. rubber, teak and eucalyptus), and agroforestry (e.g. intercropping) in MMSEA.
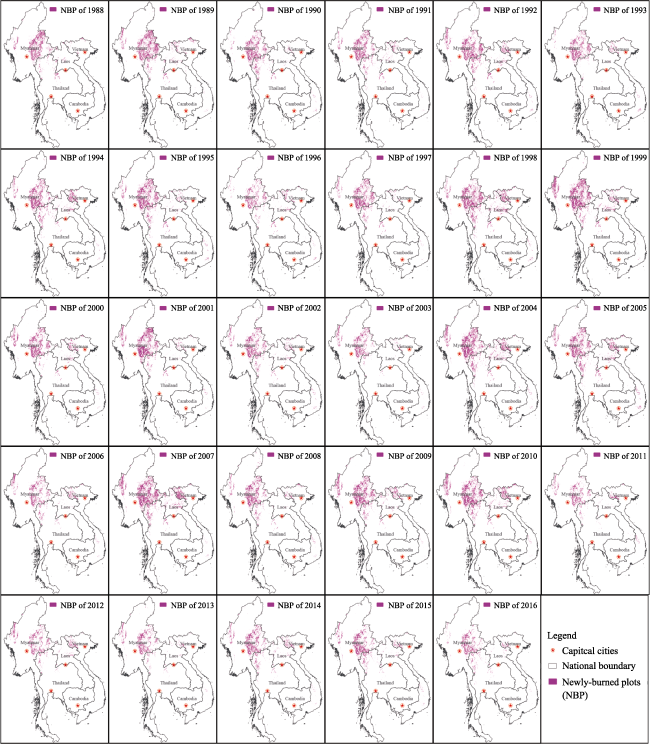
Figure 2 The twenty-nine 30-m resolution longitudinal maps of the newly-burned plots (NBP) of swidden agriculture derived from the multiple Landsat-based vegetation indices (NDVI, SAVI, NDMI and NBR) thresholds in the redefined MMSEA from 1988 to 2016
Temporally, the largest and smallest areas of the NBP of swiddening occurred in 2007 up to 9.19×10⁴ km2, or 4.75% of territory area of MSEA and, while in 2011 merely 3.94×10⁴ km2, or 2.04% of MSEA (Figure 3), respectively. Table 1 gives a full numeric list of the maximum and minimum areas and the corresponding area proportions of newly opened swiddens in each country during the same period. The maximum NBP area in Vietnam, Laos and Cambodia happened in the mid-2000s while those of Myanmar and Thailand appeared in the late 1990s. However, the occurrence years of annual minimum NBP area of swidden agriculture for MSEA countries were not fixed (Figure 3).
Table 1 The maximum and minimum area sizes of the newly-burned plots (NBP) of swiddening and the corresponding proportions of total land area and the related occurrence years in Cambodia, Laos, Myanmar, Thailand, Vietnam and MSEA (104 km2 and %)
Maximum area Minimum area
Quantity Proportion Year Quantity Proportion Year
MSEA 9.19 4.75 2007 3.94 2.04 2011
Cambodia 0.01 0.07 2004 - - 2012*
Laos 1.05 4.42 2004 0.19 0.81 1993
Myanmar 6.08 9.00 1999 2.64 3.90 1996
Thailand 1.38 2.70 1998 0.29 0.57 2003
Vietnam 1.18 3.59 2007 0.25 0.75 1988

Note: The smallest area of newly-burned swidden in Cambodia was approximately 3.32 km2 in 2012.

Figure 3 Annual average area of the newly-burned plots (NBP) of swidden agriculture in Cambodia, Laos, Myanmar, Thailand, Vietnam and the whole Montane Mainland Southeast Asia during 1988-2016
Spatially, annual NBP were primarily distributed in four major geomorphic units including the Central Range of Hills, Northern Mountainous Region, Western Myanmar Hills, and Annamite Chain (Figure 2). In addition, the borderlands of Myanmar-Thailand, Vietnam-Laos, and Myanmar and India were also the important locations of swidden agriculture. The resultant distributions of annual NBP were much close to those of Schmidt-Vogt’s study (2009). Of the five countries in MSEA, Myanmar (particularly Shan Plateau and Arakan Yoma) had the largest proportion of annual average NBP area of swiddening (67.60%), followed by Thailand (especially northern part) with 13.28%, Vietnam (especially northwestern part) with 10.81%, Laos (especially northern part) with 8.24% and Cambodia (especially northeastern part) merely with 0.07%, respectively. Earlier study showed that there were about 4500 km2 annually for swiddening in Laos (Hansen, 1998), while our annual average estimate was 5010 km2. It should be noted that the total area of swidden agriculture in MSEA countries would be much larger if swidden fallows at different stages were taken into consideration (Hansen, 1998; Messerli et al., 2009; Li et al., 2016).
National (quasi-) decadal average area of newly opened swiddens and the related area proportions were listed in Table 2. In the past nearly three decades, the NBP area of swiddening opened year by year declined as a whole (Table 2 and Figure 9a), especially after 2010, merely with mean area of 5.23×10⁴ km2. This declining trend of the NBP of swidden agriculture in MSEA can be explained because of governmental awareness and international endeavor, such as the opium-replacement policy in the 1980s (Cohen, 2009; Tian et al., 2011), the alternative development in the 1990s and the recent UN-REDD Programme (Fox et al., 2014). For example, Lao government used to increase the area of rubber plantations after 2003 through individuals, private- and state-sectors entities to respond to high rubber prices at that time (Manivong et al., 2008), so as to curb opium poppy cultivation. However, the extensive rubber plantation expansion didn’t last quite long until 2010 due to the emerging issues in land grabbing especially in southern Laos. Then, Lao government terminated the permission of new establishment of rubber plantation across the country. In addition, in 1999, Myanmar and local authorities decided to engage in a 15-year plan to eliminate opium poppy by the year 2014 (Tian et al., 2011).
Table 2 The (quasi-) decadal average area and the related area proportions of the newly-burned plots (NBP) of swidden agriculture in Cambodia, Laos, Myanmar, Thailand, Vietnam and MSEA (104 km2 and %)
(Quasi-) Decadal average area Annual average area Proportion of total land area
1980s 1990s 2000s 2010s 1988-2016 %
MSEA 6.08 6.24 6.52 5.23 6.08 3.15
Cambodia - - - - - 0.02
Laos 0.48 0.51 0.55 0.43 0.50 2.12
Myanmar 4.39 4.15 4.42 3.52 4.11 6.08
Thailand 0.78 0.94 0.78 0.67 0.81 1.57
Vietnam 0.43 0.63 0.77 0.60 0.66 2.00

Note: The (quasi-) decadal average area of the NBP in Cambodia were about 45 km2 during 1988-2009 and then reduced to 10 km2 or so in the 2010s.

Before the early 1990s, MSEA countries with the exception of Thailand suffered from long-term conflict and/or isolation which lead to poor socio-economic progress and slight land surface changes. Afterwards, geo-economic cooperation activities started with the Greater Mekong Subregion economic cooperation program launched in 1992 among MSEA and its neighboring countries (especially China and India) were gradually embarked on to promote regional economic and social development. MSEA therefore experienced extensive and continuous rapid land use and land cover changes due to rapid economic development. In this sense, the annual mean NBP area of swidden agriculture (nearly 6.08×10⁴ km2) established in the late 1980s (both 1988 and 1989) can be viewed as the traditional development level of slash-and-burn farming in the past. Not coincidentally, the numerical value was almost equal to the average level of the last 30 years.
Compared with the past development level, however, there still showed obvious area increment of newly-burned swidden during the 1990s and 2000s (Table 2), both with larger average NBP values of 6.24×10⁴ km2 and 6.52×10⁴ km2, respectively. In the first decade of the 21st century, more evident expansion of the NBP of swiddening was detected across MSEA due to inadequate central government supervision on land lease and its disordered development. It can be cautiously inferred that the rising of slashing and burning phenomenon has close connection with the expansion of economic crops gardens (e.g. banana, coffee and sugar cane) and tree plantations (for instance, rubber, teak and eucalyptus). It was not until circa 2010 that the central governments of MSEA nations realized the social issues (like land grabbing) and environmental pollutions (e.g. pesticides and fertilizers) of swidden agriculture and slash-and-burn related agroforestry development, and then started to impose restrictions on it. The annual NBP area was the smallest in 2011 and showed a decreasing trend accordingly. For example, upland households are simply permitted to reuse the already-opened swidden plots and prohibited to reclaim new land parcels in Laos according to our field investigation in 2016. In comparison, there were only two years (1998 and 1999) with an annual area larger than 7.00×10⁴ km2 in the 1990s, while the corresponding number of years increased to four, namely 2004, 2005, 2007 and 2009 in the 2000s, and only one in the 2010s, that is 2010. There were basically similar temporal changes at the country level with the exception of Vietnam, which was characterized by more frequent usage of the slash-and-burn practice in the 1990s and 2000s (Table 2). A flux of formally lowland populated people who migrated into the uplands to practice swidden agriculture during this period accelerated its expansion especially in Central Highlands and the northwest part of Vietnam.

3.2 National differences in annual area and spatial pattern of the newly-burned plots (NBP) of swiddening in MMSEA during 1988-2016

As it showed above, the spatial and temporal dynamics of the newly-burned plots of swidden agriculture varied dramatically at national level as well as provincial level. Because the five countries have 14 to 78 provinces regardless of the size of land area, then the top ten provinces of annual average NBP area in each country were further selected to clearly illustrate the annual provincial variations. The area proportions of the newly-burned plots of swidden agriculture for these provinces in Cambodia, Laos, Myanmar, Thailand and Vietnam were all consistently larger than 90%. Therefore, the provincial level analyses can clearly reflect the spatial patterns of each country in the past decades as a whole.
3.2.1 Cambodia
The top ten provinces of larger annual average area of the NBP in Cambodia during 1988-2016 in sequence were Mondulkiri, Ratanakiri, Koh Kong, Preah Sihanouk, Pursat, Kampot, Battambang, Pailin, Kampong Speu and Preah Vihear, respectively (Figure 4). The total average NBP area of the top ten provinces accounted for up to 99.8% in this country. Of these provinces, Mondulkiri and Ratanakiri in northeastern Cambodia, dominated by highlands at altitudes from 200 m to 1000 m, had 66.2% and 9.5% of the total average area of newly-burned plots of swidden agriculture, respectively. Among them, Mondulkiri Province had the maximum annual average NBP of swidden farming, about 28.31 km2. Our calculation results of the annual average NBP area were different from the qualitative estimates reported earlier, as swidden agriculture is mainly found in Ratanakiri Province (Schmidt-Vogt et al., 2009). The slash-and-burn techniques were typically applied for the expansion of rubber plantation invested by foreign (for example Vietnamese and Chinese) enterprises in these provinces. Besides, seven of them including Koh Kong, Preah Sihanouk, Pursat, Kampot, Battambang, Pailin, and Kampong Speu in the southwestern part of Cambodia, covering the Cardamom and Elephant Mountains with an elevation range of 500-1800 m, accounted for 23.8% of the total average area of the NBP. Although Mondulkiri Province had the largest percentage of the NBP area in the past nearly three decades, it still displayed a declining trend which was in line with the general development trend of Cambodia (Figure 9b). The first five provinces had the maximum annual average NBP area larger than 7 km2. Among them, Mondulkiri, Koh Kong and Pursat occurred in the mid-2000s, Ratanakiri in the early 2010s and Preah Sihanouk in the late 1980s. Regarding to the occurrence years of minimum annual average values, Mondulkiri, Koh Kong and Preah Sihanouk happened in 2012, Ratanakiri in 1990 and Pursat in 1988. From the view of the maximum annual average NBP area (less than 7 km2), the changing trends of decadal average in other five provinces were less obvious.
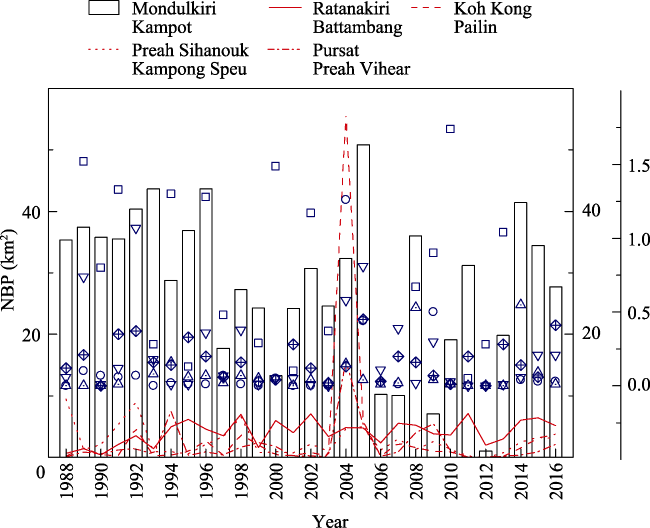
Figure 4 Temporal variations in annual average area of the newly-burned plots (NBP) of swidden agriculture for the top ten provinces in Cambodia during 1988-2016

Note: The province (i.e., Mondulkiri) with the largest NBP area was plotted with histogram (empty), the second to fifth provinces with line (e.g., solid, dashes, dots and dash dot), and the remaining five provinces with scatter in different symbols, respectively.

3.2.2 Laos
The top ten provinces of larger annual average area of the NBP in Laos during 1988-2016 in sequence were Louang Phrabang, Xiangkhoang, Phongsali, Houaphan, Oudomxay, Xaignabouri, Louang Namtha, Xaysomboun, Bokeo and Bolikhamxai respectively (Figure 5). The total average NBP area of the top ten provinces accounted for up to 92.2% in Laos. Of these provinces, the eight provinces in northern Laos were all included, accounting for 79.8%, and the other two provinces were located in central Laos, i.e., Xaysomboun and Bolikhamxai, with 20.2%. Among them, Louang Phrabang Province had the maximum annual average NBP of swidden farming, about 901.46 km2. Therefore, the newly-burned plots of swidden agriculture were primarily distributed in northern Laos during 1988-2016. This vast mountainous region used to be the primary area for opium poppy cultivation. With regard to the inter-annual variability of the NBP area, Laos showed a slightly declined trend at the country level. This can be explained that there were increasingly governmental efforts to prohibit swidden agriculture and opium cultivation throughout the country since the late 1980s. For instance, the upland slash-and-burn farmers (such as Lao Theung and Lao Soung) were resettled in lowlands to cultivate paddy rice as Lao Loum.
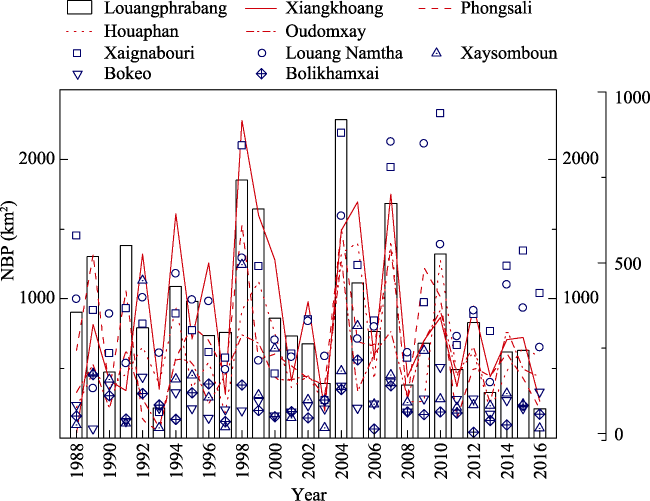
Figure 5 Temporal variations in annual average area of the newly-burned plots (NBP) of swidden agriculture for the top ten provinces in Laos during 1988-2016^Note: The province (i.e., Louang Phrabang) with the largest NBP area was plotted with histogram (empty), the second to fifth provinces with line (e.g., solid, dashes, dots and dash dot), and the remaining five provinces with scatter in different symbols, respectively.
However, the variabilities at the provincial level for the ten provinces were particularly different. Six of the ten provinces, including Louang Phrabang, Houaphan, Oudomxay, Louang Namtha, Bokeo and Bolikhamxai, had the maximum annual average NBP area in the mid-2000s, three of them (Xiangkhoang, Phongsali and Xaysomboun) in the late 1990s and one (i.e., Xaignabouri) in 2010. In contrast, with regard to the minimum annual average NBP area, Xiangkhoang, Louang Namtha and Bokeo occurred in the late 1980s, Phongsali, Oudomxay, Xaignabouri and Xaysomboun in the early 1990s, Houaphan in the late 1990s, finally Louang Phrabang and Bolikhamxai in the 2010s. Three provinces including Louang Phrabang, Phongsali and Bolikhamxai showed a declining trend as a whole, while provinces such as XiangKhoang, Houaphan, Oudomxay and Louang Namtha varied just the opposite, and the other three showed slight variations in the past decades (Figure 9c).
3.2.3 Myanmar
The top ten provincial administrative regions with larger annual average NBP area in Myanmar during 1988-2016 in sequence were Shan State, Chin State, Kayah State, Mandalay Region, Magway Region, Sagaing Region, Kachin State, Kayin State, Rakhine State and Bago Region respectively (Figure 6). Schmidt-Vogt and his colleagues (2009) earlier claimed that swidden agriculture was mainly found in the Karen, Shan, Kachin and Chin States of eastern and northern Myanmar. Our results of the distribution of swidden agriculture in Myanmar were in accordance with that. The total average area of the top ten states and regions accounted for up to 99.9% in Myanmar. There were four states or provinces with annual average NBP area greater than 1000 km2, i.e., Shan (30,299.22 km2), Chin (4360.81 km2), Kayah (2321.16 km2) and Mandalay (1455.38 km2), respectively.
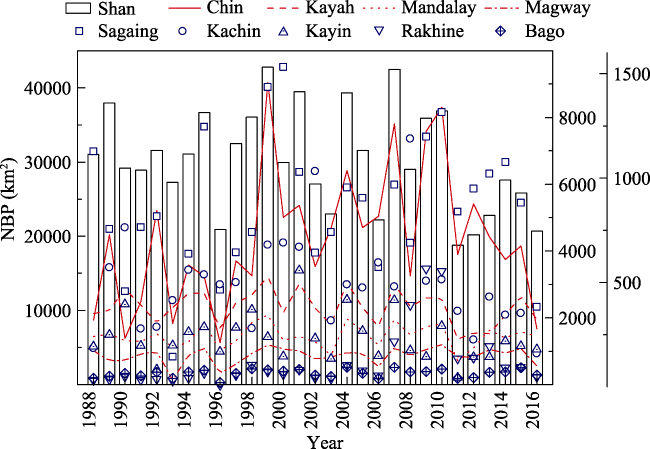
Figure 6 Temporal variations in annual average area of the newly-burned plots (NBP) of swidden agriculture for the top ten provinces in Myanmar during 1988-2016^Note: The state (i.e., Shan) with the largest NBP area was plotted with histogram (empty), the second to fifth provinces with line (e.g. solid, dashes, dots and dash dot), and the remaining five provinces with scatter in different symbols, respectively.
With regard to the inter-annual variability of NBP area, Myanmar also showed a slightly declining trend at the country level, although fluctuated year by year (Figure 9d). It should be noted that the maximum annual average NBP area of the ten provincial units all happened between 1999 and 2010. Among them, the first four states or provinces, namely Shan State, Chin State, Kayah State and Mandalay Region, all occurred in 1999, Magway Region in 2010 and the other five in the 2000s. By contrast, the provincial minimum annual average NBP occurred either in the 1990s and the 2010s, half (i.e., Chin State, Magway Region, Sagaing Region, Rakhine State and Bago Region) and half (i.e., Shan State, Kayah State, Mandalay Region, Kachin State and Kayin State). However, the variabilities at the provincial level particularly for the ten provinces were different. Four states in eastern Myanmar including Shan, Kayah, Kachin and Kayin typically showed a declining trend, while the other six states (Chin and Rakhine) or regions (Mandalay, Magway, Sagaing and Bago) varied in an increasing manner. Currently, reasons for the annually dynamic changes in the NBP of swidden agriculture in Myanmar are unclear. With regard to the decadal average of NBP area from the 1980s to the 2010s (Figure 9d), Shan state decreased obviously, and Chin State increased during the 2000s, while other eight states or regions varied slightly.
3.2.4 Thailand
The top ten provinces with larger annual average NBP area in Thailand during 1988-2016 in sequence were Chiang Mai, Mae Hong Son, Tak, Chiang Rai, Loei, Lamphun, Nan, Phetchabun, Lampang and Chaiyaphum, respectively (Figure 7). Schmidt-Vogt et al. (2009) claimed that swidden cultivation is mainly practiced by ethnic minorities in the northern uplands close to the border with Laos and Myanmar. Our results of the spatial pattern of swidden agriculture were in line with their conclusion. The total average area of the top ten provinces accounted for up to 91.8% in Thailand. There were only two provinces with annual average NBP area greater than 1000 km2, i.e., Chiang Mai (2150.23 km2) and Mae Hong Son (1360.05 km2). Thailand is variably divided into different sets of regions, the most notable of which are the six-region grouping used in geographic studies, namely Northern Thailand, Northeastern Thailand, Western Thailand, Central Thailand, Eastern Thailand and Southern Thailand. Of these provinces, six of them including Chiang Mai, Mae Hong Son, Chiang Rai, Lamphun, Nan and Lampang were from Northern Thailand, Loei and Chaiyaphum from Northeastern Thailand, Tak and Phetchabun from Western and Central Thailand respectively. The NBP of swiddening opened by the Karen tribe in these provinces were mainly distributed along the Thailand-Myanmar border. The top three provinces (Chiang Mai, Mae Hong Son and Tak) with larger area of NBP as well as Lamphun and Lampang, displayed relatively stable changing trends, while the NBP area of other provinces declined conformably (Figure 9e). Of the ten provinces, Loei and Mae Hong Son had the maximum annual average NBP in 1988 and 2010, respectively, Chiang Rai, Nan and Lampang in the early 1990s, Chiang Mai and Tak in 1998, as well as Lamphun, Phetchabun and Chaiyaphum in 2005. In contrast, Chiang Mai, Loei and Phetchabun had the minimum values of annual average NBP in 1993, Tak, Chiang Rai, Lamphun and Nan in 2003, and the last three in the early 2010s.
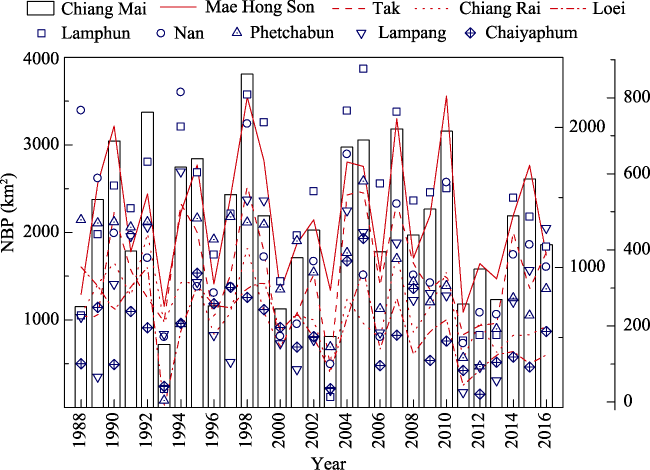
Figure 7 Temporal variations in annual average area of the newly-burned plots (NBP) of swidden agriculture for the top ten provinces in Thailand during 1988-2016

Note: The province (i.e., Chiang Mai) with the largest NBP area was plotted with histogram (empty), the second to fifth provinces with line (e.g., solid, dashes, dots and dash dot), and the remaining five provinces with scatter in different symbols, respectively.

3.2.5 Vietnam
The top ten provinces with larger annual average NBP area in Vietnam during 1988-2016 in sequence were Son La, Dien Bien Phu, Lai Chau, Ha Giang, Lam Dong, Kon Tum, Gia Lai, Lao Cai, Yen Bai and Cao Bang, respectively (Figure 8). The total average area of the top ten provinces accounted for up to 94.0% in Vietnam. Of these provinces, five of them including Son La, Dien Bien Phu, Lai Chau, Lao Cai and Yen Bai were from Northwest Vietnam, three provinces of them including Lam Dong, Kon Tum and Gia Lai from Central Highlands and another two from Northeast Vietnam. There were only two provinces with annual average NBP area greater than 1000 km2, i.e., Son La (1997.68 km2) and Dien Bien Phu (1441.55 km2). Just as Vietnam showed a slightly increasing trend of decadal average, the NBP of swiddening in all the ten provinces with the exception of Ha Giang and Cao Bang, two mountainous provinces shared long borderline with China, increased in varying degrees. Among them, for example, Son La Province, with the largest area of NBP, showed a largest growth rate from the 1980s to the 2010s, up to over 300% (Figure 9f). For the ten provinces, Son La, Dien Bien Phu, Lam Dong and Gia Lai had the maximum annual NBP area in the mid-2000s, Lai Chau, Ha Giang, Kon Tum and Lao Cai in the early 2010s, as well as Yen Bai in 1994 and Cao Bang in 1989. In contrast, six provinces, namely Son La,Lam Dong, Kon Tum, Gia Lai, Lao Cai and Yen Bai, had the minimum annual average NBP in 1988, Dien Bien Phu and Cao Bang in the early 1990s, and two final ones (Lai Chau and Ha Giang) in the early 2010s. It also further implies the decadal growth trend of newly opened plots of swidden farming.
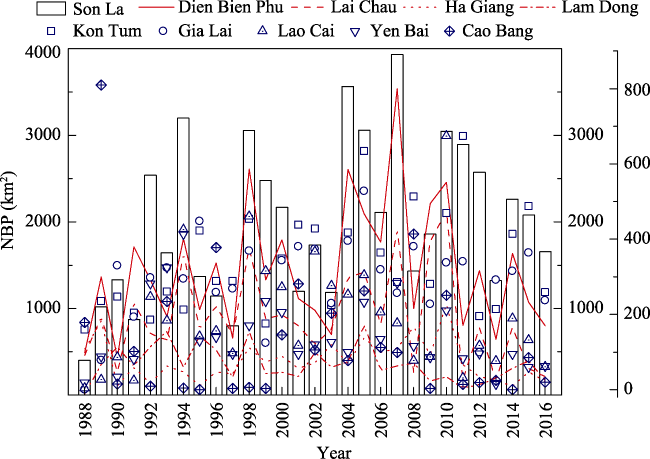
Figure 8 Temporal variations in annual average area of the newly-burned plots (NBP) of swidden agriculture for the top ten provinces in Vietnam during 1988-2016^Note: The province (i.e., Son La) with the largest NBP area was plotted with histogram (empty), the second to fifth provinces with line (e.g., solid, dashes, dots and dash dot), and the remaining five provinces with scatter in different symbols, respectively.
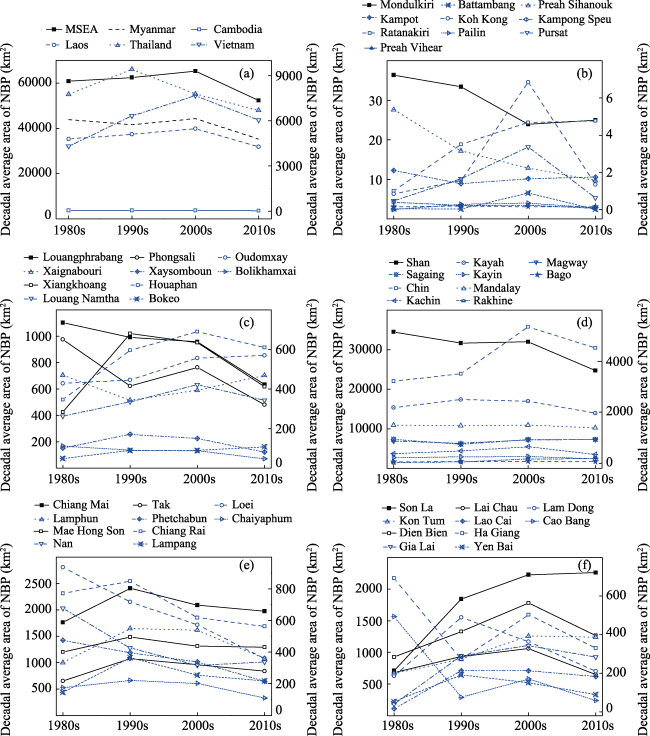
Figure 9 Temporal changes in decadal annual average area of newly-burned plots (NBP) of swidden agriculture at provincial, national and regional levels during 1988-2016

Note: (a) MSEA and the five countries; (b)-(f) refers to the top ten provinces of MSEA countries in an alphabetical order.

4 Conclusions and discussion

4.1 Conclusions

Based on the phenological features of swiddening, the redefined mountainous region or redefined MMSEA, and the multiple thresholds approach of Landsat-derived spectral indices (NDVI, SAVI, NDMI and NBR), the annual extent and area of newly-burned plots (NBP) of swidden agriculture were firstly detected and monitored in the vast mountainous regions of Mainland Southeast Asia (MSEA) during 1988-2016. There was an annual average area of 6.08×10⁴ km2 of newly opened swidden fields, or 3.15% of the total land area of MSEA in the past nearly three decades. However, the swiddening area opened year by year declined as a whole, especially after 2010, merely with an average of 5.23×10⁴ km2. This important conclusion comprehensively and robustly validated that the general declining trend of swidden agriculture estimated at local to regional scales in MSEA (Padoch et al., 2007; Schmidt-Vogt et al., 2009; van Vliet et al., 2012). In addition, Myanmar had the largest annual average NBP area of 4.11×10⁴ km2, followed by Thailand with 0.81×10⁴ km2, Vietnam with 0.66×10⁴ km2, Laos with 0.50×10⁴ km2 and Cambodia merely with 42.77 km2, respectively. Finally, the top ten provincial administrative units in Cambodia, Laos, Myanmar, Thailand and Vietnam, which consistently accounted for over 90% of the area of newly-burned swiddens in each country, showed distinct temporal fluctuations in using slash-and-burn practices in the last nearly three decades. Among them, Mondulkiri (Cambodia), Louang Phrabang (Laos), Shan (Myanmar), Chiang Mai (Thailand) and Son La (Vietnam) were the corresponding provinces with the largest annual average NBP area of swidden agriculture of MSEA countries in an alphabetical order. At the provincial level, there were eight provinces or states with an annual average NBP area larger than 1000 km2, such as Shan State, Chin State, Kayah State, Mandalay from Myanmar, Chiang Mai and Mae Hong Son from Thailand, and Son La and Dien Bien Phu from Vietnam. Among them, Shan State had the largest annual average NBP area of 3.03×10⁴ km2. The resultant 29 Landsat-based 30-m resolution maps of the NBP of swiddening in MSEA comprehensively and timely responded to the first appeal of enhancing swidden agriculture mapping and monitoring with satellite data in two special issues published by the journal of Human Ecology in 2009 (Mertz et al., 2009) and 2013 (van Vliet et al., 2013). We believed that the resultant annual maps of NBP of swidden agriculture lay a solid database for future investigation on local livelihood improvement and environmental effects assessment of this traditional subsistence agriculture in MSEA.

4.2 Discussion

Apart from the explicit importance of reconstructing the annual extent and area of 30-m resolution NBP of swidden agriculture, this study might have two critical implications. First, there are two main pathways for monitoring swidden agriculture, which can also be called “Space-Time Conversion” method, namely “Space-for-Time (S-T) substitution” and “Time-for-Space (T-S) substitution”, respectively. One is to detect the NBP and swidden fallows at varied stages with single-year remote sensing data. It can be named as the “S-T” substitution as it shows the temporal changes of swidden agriculture through the spatial distribution of varied aged-fallows, from one, five to over 20 years. The swidden fallows at different stages indirectly reflected the temporal development of newly opened swiddens. The other is to detect the NBP of swiddening with inter-annual remotely sensed data. It can be regarded as the “T-S” substitution as it shows the spatial differences of swidden agriculture via the distribution of annual NBP for nearly three decades. The annual extraction of the NBP of swidden agriculture also indirectly reflected the general spatial pattern of swidden agriculture.
In our previous study, we placed particular emphasis on developing a simple, effective and feasible algorithm using currently freely available satellite data (e.g. Landsat) at 30-m spatial resolution to detect and map swidden agriculture. However, the fact that the previous study merely utilized single-date multispectral image may limit the capability of the algorithm for fully delineating the actual total distribution of swidden agriculture. The reliability of the results was highly dependent on the selection of Landsat data used in that study. In this updated study, however, all available Landsat TM, ETM+ and OLI scenes acquired between March and May, or in the periods of pre- and post-peak hot-dry season, without considering the level of cloud coverage, in the last nearly three decades were fully utilized to extract the annual actual burned pixels of slash-and-burn to a maximum extent and treated as a comprehensive distribution of swidden agriculture over the mountainous regions of MSEA. The reliable Landsat high-level products data source could ensure the credibility and accuracy of the results, although the combination of the topographical mask with an elevation over 600 m may omit a small proportion of NBP of swidden agriculture as we noticed in the field work.
Second, Landsat historical archive data especially acquired during the dry season hold great potential in detecting and monitoring the traditional swidden agriculture, also a prevailing, dynamic and complex land use category in the tropics. What makes this study possible is that swidden agriculture has unique phenological features during the dry season. Remotely-sensed data of optical satellites such as Landsat are always questioned and challenged about their applicability in the tropical region due to cloud contamination. This argument is absolutely true in the rainy season (Li et al., 2018). However, the half-year dry spells in MSEA greatly facilitate satellites to acquiring less cloud cover observations, especially with the cloud coverage less than or equal to 30% (Li et al., 2018). Recently, we have analyzed monthly average of cloud cover (less than or equal to 30%) for Landsat data, including TM, ETM+ and OLI images over MSEA and Yunnan Province in the last three decades. It shows that Landsat has higher probabilities of acquiring high-quality images during the dry season, at a seasonal average of 62% versus merely 22% within the rainy season. Monthly averages of 30% or less than cloud cover were 67% for January and February, followed by 62% for March, 56% for April and November, and 61% for December. Therefore, we believed that the Landsat historical archive data can be viewed as a robust data source for mapping swidden agriculture, or shifting cultivation, or slash-and-burn farming in the tropics. However, finer spatial resolution data such as Sentinel-2 will greatly improve our understanding of the changes of swidden agriculture in the near future.
With the resultant inter-annual maps of the NBP of swiddening, the changes of spatial patterns over the past 29 years were clearly investigated in this study. Annual area fluctuations in the NBP at the provincial to national level validated the dynamic nature of swidden agriculture. The annual dynamics were closely related to the land use intensity or fallow length of the traditional farming. However, changes in fallow cycle of swidden agriculture and swiddening intensity are typically analyzed at local scale globally. The investigation of fallow period variation contributes to fully understanding the intensity of swidden farming as well as its socio-economic and biophysical effects. Next, we plan to reveal the dynamic changes of fallow length and land use intensity of swidden agriculture in MSEA through the probability comparative analysis of the NBP pixels detected each year during 1988-2016.

The authors have declared that no competing interests exist.

[2]
Achard F, Beuchle R, Mayaux Pet al., 2014. Determination of tropical deforestation rates and related carbon losses from 1990 to 2010.Global Change Biology, 20(8): 2540-2554.We estimate changes in forest cover (deforestation and forest regrowth) in the tropics for the two last decades (1990–2000 and 2000–2010) based on a sample of 4000 units of 1002×1002km size. Forest cover is interpreted from satellite imagery at 3002×023002m resolution. Forest cover changes are then combined with pan-tropical biomass maps to estimate carbon losses. We show that there was a gross loss of tropical forests of 8.0 million02ha02yr611 in the 1990s and 7.6 million02ha02yr611 in the 2000s (0.49% annual rate), with no statistically significant difference. Humid forests account for 64% of the total forest cover in 2010 and 54% of the net forest loss during second study decade. Losses of forest cover and Other Wooded Land (OWL) cover result in estimates of carbon losses which are similar for 1990s and 2000s at 88702MtC02yr611 (range: 646–1238) and 88002MtC02yr611 (range: 602–1237) respectively, with humid regions contributing two-thirds. The estimates of forest area changes have small statistical standard errors due to large sample size. We also reduce uncertainties of previous estimates of carbon losses and removals. Our estimates of forest area change are significantly lower as compared to national survey data. We reconcile recent low estimates of carbon emissions from tropical deforestation for early 2000s and show that carbon loss rates did not change between the two last decades. Carbon losses from deforestation represent circa 10% of Carbon emissions from fossil fuel combustion and cement production during the last decade (2000–2010). Our estimates of annual removals of carbon from forest regrowth at 11502MtC02yr611 (range: 61–168) and 9702MtC02yr611 (53–141) for the 1990s and 2000s respectively are five to fifteen times lower than earlier published estimates.

DOI PMID

[3]
Achard F, Eva H D, Stibig H Jet al., 2002. Determination of deforestation rates of the world's humid tropical forests.Science, 297(5583): 999-1002.A recently completed research program (TREES) employing the global imaging capabilities of Earth-observing satellites provides updated information on the status of the world's humid tropical forest cover. Between 1990 and 1997, 5.8 卤 1.4 million hectares of humid tropical forest were lost each year, with a further 2.3 卤 0.7 million hectares of forest visibly degraded. These figures indicate that the global net rate of change in forest cover for the humid tropics is 23% lower than the generally accepted rate. This result affects the calculation of carbon fluxes in the global budget and means that the terrestrial sink is smaller than previously inferred.

DOI PMID

[4]
Brady N C, 1996. Alternatives to slash-and-burn: A global imperative.Agriculture, Ecosystems & Environment, 58(1): 3-11.Our generation has seen an upswelling of interest and concern for atmospheric pollution and for the concomitant destruction or degradation of our natural resources. High on the list of both these concerns is the rapid destruction of tropical forests and their release of greenhouse gases in the process. Much of the forest destruction is to provide lumber for building construction worldwide, and for fuelwood, but most of it is to provide land for agriculture.

DOI

[5]
Bruun T B, de Neergaard A, Lawrence Det al., 2009. Environmental consequences of the demise in swidden cultivation in Southeast Asia: Carbon storage and soil quality.Human Ecology, 37(3): 375-388.The effects of swidden cultivation on carbon storage and soil quality are outlined and compared to the effects of the intensified production systems that swidden systems of Southeast Asia transform into. Time-averaged aboveground carbon stocks decline by about 90% if the long fallow periods of traditional swidden cultivation are reduced to 4 years and by about 60% if swidden cultivation is converted to oil palm plantations. Stocks of soil organic carbon (SOC) in tree plantations are 0-40% lower than stocks in swidden cultivation, with the largest losses found in mechanically established oil palm plantations. Impacts of tree plantations on soil quality are to a large extent determined by management. Conversion of swiddening to continuous annual cropping systems brings about substantial losses of time-averaged aboveground carbon stocks, reductions of SOC stocks and generally leads to declining soil quality. Knowledge of carbon storage in belowground biomass of tree based systems of the tropics is sparse but failure to include this pool in carbon inventories may significantly underestimate the total biomass of the systems. Moreover, studies that consider the ecological reasons behind farmers' land use decisions as well as spatial variability in biogeophysical and edaphological parameters are needed to evaluate the effects of the ongoing land use transitions in Southeast Asia.

DOI

[6]
Cairns M F, 2015. Shifting Cultivation and Environmental Change: Indigenous People, Agriculture and Forest Conservation. New York: Routledge, 1057.

[7]
Chuan G K, 2005. The climate of Southeast Asia. In: Gupta A (ed.). The Physical Geography of Southeast Asia.Oxford, UK:Oxford University Press, 80-93.

[8]
Cohen P T, 2009. The post-opium scenario and rubber in northern Laos: Alternative Western and Chinese models of development.International Journal of Drug Policy, 20(5): 424-430.BackgroundIn the past few years rubber planting has spread rapidly throughout northern Laos, especially in Luang Namtha province that borders China. The impetus for this boom has come partly from the spiralling demand for rubber in China (now the world's largest rubber consumer), the high world prices for rubber, and China's promotion of overseas investment through its opium-replacement policy. These economic factors have converged with the desperate need of impoverished highlanders in northern Laos to replace opium as a cash crop as a consequence of a recent opium-eradication campaign and inadequate alternative development.MethodsThis paper draws upon ethnographic and agro-economic research in northern Laos and neighbouring regions and reports of international development organisations operating in Laos.ResultsThe rubber boom in northern Laos represents a fundamental clash between Western drug-oriented alternative development, on the one hand, and China's national economic strategies abroad and investment-led narcotics policy, on the other.ConclusionChina's opium-replacement policy has contributed to a type of unregulated frontier capitalism with socio-economic and environmental effects that threaten the principles and goals of alternative development and even to marginalise the role international development organisations in northern Laos.

DOI PMID

[9]
Corlett R T, 2005. Vegetation. In: Gupta A (ed.). The Physical Geography of Southeast Asia. Oxford, UK: Oxford University Press, 105-119.

[10]
Cummings A R, Karale Y, Cummings G Ret al., 2017. UAV-derived data for mapping change on a swidden agriculture plot: Preliminary results from a pilot study.International Journal of Remote Sensing, 38(8-10): 2066-2082.Swidden agriculture, or the continuing agricultural system in which clearings are cropped for shorter periods than they are fallowed, landscapes have been described as 090004difficult-to-map090005 because they host a high variety of land-cover types. Consequently, satellite-borne remotely sensed data have not proven overwhelmingly successful in detecting and measuring change within these landscapes. We utilize data derived from an optical sensor carried on-board an unmanned aerial vehicles (UAVs) to measure the change on a swidden agriculture plot over a 4 month period in Guyana. UAVs were built with indigenous farmers who were trained in their operation to collect data over the swidden plot. A two-class classification was developed to quantify the change in both cultivated and naturally occurring vegetation. We found that non-vegetation surfaces rapidly decreased over the 4 months, declining from 79.42% in June to 69.69% in September. Vegetation recolonization of the swidden crop was particularly the cassava crop planted by the Makushi farmer. While our analysis was completed over a single swidden plot, our work demonstrated that UAVs could play a role in mapping swidden landscapes and change the perception that they are difficult to map. Local people involvement was critical to mapping their landscapes.

DOI

[11]
Dong J, Xiao X, Menarguez M Aet al., 2016. Mapping paddy rice planting area in northeastern Asia with Landsat 8 images, phenology-based algorithm and Google Earth Engine.Remote Sensing of Environment, 185: 142-154.61First 30 m paddy rice map in northeastern (NE) Asia with Landsat 8 and cloud computing61Landsat 8 data can facilitate annual rice phenology extraction and mapping in NE Asia61LST-based transplanting phase definition helps image selection and paddy rice mapping61Landsat sidelaps contribute to phenology information extraction in high latitude area61Paddy rice area in NE China accounts for 60% in NE Asia

DOI PMID

[12]
Dressler W H, Wilson D, Clendenning Jet al., 2016. The impact of swidden decline on livelihoods and ecosystem services in Southeast Asia: A review of the evidence from 1990 to 2015.Ambio, 46(3): 291-310.Global economic change and policy interventions are driving transitions from long-fallow swidden (LFS) systems to alternative land uses in Southeast Asia uplands. This study presents a systematic review of how these transitions impact upon livelihoods and ecosystem services in the region. Over 17000 studies published between 1950 and 2015 were narrowed, based on relevance and quality, to 93 studies for further analysis. Our analysis of land-use transitions from swidden to intensified cropping systems showed several outcomes: more households had increased overall income, but these benefits came at significant cost such as reductions of customary practice, socio-economic wellbeing, livelihood options, and staple yields. Examining the effects of transitions on soil properties revealed negative impacts on soil organic carbon, cation-exchange capacity, and aboveground carbon. Taken together, the proximate and underlying drivers of the transitions from LFS to alternative land uses, especially intensified perennial and annual cash cropping, led to significant declines in pre-existing livelihood security and the ecosystem services supporting this security. Our results suggest that policies imposing land-use transitions on upland farmers so as to improve livelihoods and environments have been misguided; in the context of varied land uses, swidden agriculture can support livelihoods and ecosystem services that will help buffer the impacts of climate change in Southeast Asia. The online version of this article (doi:10.1007/s13280-016-0836-z) contains supplementary material, which is available to authorised users.

DOI PMID

[13]
Dressler W, Wilson D, Clendenning Jet al., 2015. Examining how long fallow swidden systems impact upon livelihood and ecosystem services outcomes compared with alternative land-uses in the uplands of Southeast Asia.Journal of Development Effectiveness, 7(2): 210-229.Swidden agriculture or shifting cultivation has been practised in the uplands of Southeast Asia for centuries and is estimated to support up to 50002million people – most of whom are poor, natural resource reliant uplanders. Recently, however, dramatic land-use transformations have generated social, economic and ecological impacts that have affected the extent, practice and outcomes of swidden in the region. While certain socio-ecological trends are clear, how these broader land-use changes impact upon local livelihoods and ecosystem services remains uncertain. This systematic review protocol therefore proposes a methodological approach to analysing the evidence on the range of possible outcomes such land-use changes have on swidden and associated livelihood and ecosystem services over time and space.

DOI

[14]
Dudal R, 2005. Soil of Southeast Asia. Gupta A (ed.). The Physical Geography of Southeast Asia. Oxford, UK: Oxford University Press, 94-104.

[15]
Dutrieux L P, Jakovac C C, Latifah S Het al., 2016. Reconstructing land use history from Landsat time-series: Case study of a swidden agriculture system in Brazil.International Journal of Applied Earth Observation and Geoinformation, 47: 112-124.We developed a method to reconstruct land use history from Landsat images time-series. The method uses a breakpoint detection framework derived from the econometrics field and applicable to time-series regression models. The Breaks For Additive Season and Trend (BFAST) framework is used for defining the time-series regression models which may contain trend and phenology, hence appropriately modelling vegetation intra and inter-annual dynamics. All available Landsat data are used for a selected study area, and the time-series are partitioned into segments delimited by breakpoints. Segments can be associated to land use regimes, while the breakpoints then correspond to shifts in land use regimes. In order to further characterize these shifts, we classified the unlabelled breakpoints returned by the algorithm into their corresponding processes. We used a Random Forest classifier, trained from a set of visually interpreted time-series profiles to infer the processes and assign labels to the breakpoints. The whole approach was applied to quantifying the number of cultivation cycles in a swidden agriculture system in Brazil (state of Amazonas). Number and frequency of cultivation cycles is of particular ecological relevance in these systems since they largely affect the capacity of the forest to regenerate after land abandonment. We applied the method to a Landsat time-series of Normalized Difference Moisture Index (NDMI) spanning the 1984-2015 period and derived from it the number of cultivation cycles during that period at the individual field scale level. Agricultural fields boundaries used to apply the method were derived using a multi-temporal segmentation approach. We validated the number of cultivation cycles predicted by the method against in-situ information collected from farmers interviews, resulting in a Normalized Residual Mean Squared Error (NRMSE) of 0.25. Overall the method performed well, producing maps with coherent spatial patterns. We identified various sources of error in the approach, including low data availability in the 90s and sub-object mixture of land uses. We conclude that the method holds great promise for land use history mapping in the tropics and beyond.

DOI

[16]
Fernández-Manso A, Fernández-Manso O, Quintano C, 2016. SENTINEL-2A red-edge spectral indices suitability for discriminating burn severity.International Journal of Applied Earth Observation and Geoinformation, 50: 170-175.Fires are a problematic and recurrent issue in Mediterranean ecosystems. Accurate discrimination between burn severity levels is essential for the rehabilitation planning of burned areas. Sentinel-2A MultiSpectral Instrument (MSI) record data in three red-edge wavelengths, spectral domain especially useful on agriculture and vegetation applications. Our objective is to find out whether Sentinel-2A MSI red-edge wavelengths are suitable for burn severity discrimination. As study area, we used the 2015 Sierra Gata wildfire (Spain) that burned approximately 80km2. A Copernicus Emergency Management Service (EMS)-grading map with four burn severity levels was considered as reference truth. Cox and Snell, Nagelkerke and McFadde pseudo-R2statistics obtained by Multinomial Logistic Regression showed the superiority of red-edge spectral indices (particularly, Modified Simple Ratio Red-edge, Chlorophyll Index Red-edge, Normalized Difference Vegetation Index Red-edge) over conventional spectral indices. Fisher's Least Significant Difference test confirmed that Sentinel-2A MSI red-edge spectral indices are adequate to discriminate four burn severity levels.

DOI

[17]
Fox J, Castella J, Ziegler A D, 2014. Swidden, rubber and carbon: Can REDD+ work for people and the environment in Montane Mainland Southeast Asia?Global Environmental Change, 29: 318-326.Swidden (also called shifting cultivation) has long been the dominant farming system in Montane Mainland Southeast Asia (MMSEA). Today the ecological bounty of this region is threatened by the expansion of settled agriculture, including the proliferation of rubber plantations. In the current conception of REDD+, landscapes involving swidden qualify almost automatically for replacement by other land-use systems because swiddens are perceived to be degraded and inefficient with regard to carbon sequestration. However, swiddening in some cases may be carbon-neutral or even carbon positive, compared with some other types of land-use systems. In this paper we describe how agricultural policies and institutions have affected land use in the region over the last several decades and the impact these policies have had on the livelihoods of swiddeners and other smallholders. We also explore whether incentivizing transitions away from swiddening to the cultivation of rubber will directly or reliably produce carbon gains. We argue that because government policies affect how land is used, they also influence carbon emissions, farmer livelihoods, environmental services, and a host of other variables. A deeper and more systematic analysis of the multiple consequences of these policies is consequently necessary for the design of successful REDD+ policies in MMSEA, and other areas of the developing world. REDD+ policies should be structured not so much to -榟old the forest boundary- but to influence the types of land-use changes that are occurring so that they support both sustainable livelihoods and environmental services, including (but not limited to) carbon.

DOI

[18]
Fox J, Vogler J B, 2005. Land-use and land-cover change in Montane Mainland Southeast Asia.Environmental Management, 36(3): 394-403.Abstract This paper summarizes land-cover and land-use change at eight sites in Thailand, Yunnan (China), Vietnam, Cambodia, and Laos over the last 50 years. Project methodology included incorporating information collected from a combination of semiformal, key informant, and formal household interviews with the development of spatial databases based on aerial photographs, satellite images, topographic maps, and GPS data. Results suggest that land use (e.g. swidden cultivation) and land cover (e.g. secondary vegetation) have remained stable and the minor amount of land-use change that has occurred has been a change from swidden to monocultural cash crops. Results suggest that two forces will increasingly determine land-use systems in this region. First, national land tenure policies-the nationalization of forest lands and efforts to increase control over upland resources by central governments-will provide a push factor making it increasingly difficult for farmers to maintain their traditional swidden land-use practices. Second, market pressures-the commercialization of subsistence resources and the substitution of commercial crops for subsistence crops-will provide a pull factor encouraging farmers to engage in new and different forms of commercial agriculture. These results appear to be robust as they come from eight studies conducted over the last decade. But important questions remain in terms of what research protocols are needed, if any, when linking social science data with remotely sensed data for understanding human-environment interactions.

DOI PMID

[19]
Gamon J A, Field C B, Goulden M Let al., 1995. Relationships between NDVI, canopy structure, and photosynthesis in three Californian vegetation types.Ecological Applications, 5(1): 28-41.

[20]
García M L, Caselles V, 1991. Mapping burns and natural reforestation using Thematic Mapper data.Geocarto International, 6(1): 31-37.Remote sensing techniques are specially suitable to detect and to map areas affected by forest fires. In this work, Landsat 5 Thematic Mapper (TM) data has been used to study a number of forest fires that occurred in the province of Valencia (Spain) and to monitor the vegetation regeneration over burnt areas.

DOI

[21]
Goldammer J G, 1988. Rural land-use and wildland fires in the tropics.Agroforestry Systems, 6(3): 235-252.Tropical forest land is increasingly influenced by man-caused wildfires. The vast majority of the forested area burnt and cleared annually is in the tropics. The use of fire in rural land-use systems is the major cause of the wildfires. Five broad causative agencies of wildfires are presented, shifting cultivation, grazing, non-wood forest products, migration programs and the wildland/residential interface. Integrated concepts of prescribed burning and prescribed grazing may offer solutions to the tropical wildland fire problems.

DOI

[22]
Gupta A, 2005. Accelerated erosion and sedimentation in Southeast Asia. In: Gupta A (ed.), The Physical Geography of Southeast Asia. Oxford, UK: Oxford University Press, 239-249.

[23]
Gupta A, 2005. Landforms of Southeast Asia. In: Gupta A (ed.). The Physical Geography of Southeast Asia.Oxford, UK: Oxford University Press, 38-64.

[24]
Hansen P K, 1998. Shifting cultivation development in northern Laos. In: Chapman E C, Bouaham B, Hansen P K. Upland Farming System in the Laos PDR: Problems and Opportunities for Livestock. Vientiane, Laos, Australian Centre for International Agricultural Research (ACIAR): 34-42.

[25]
Hett C, Castella J C, Heinimann Aet al., 2012. A landscape mosaics approach for characterizing swidden systems from a REDD plus perspective.Applied Geography, 32(2): 608-618.Swidden agriculture is often deemed responsible for deforestation and forest degradation in tropical regions, yet swidden landscapes are commonly not visible on land cover/use maps, making it difficult to prove this assertion. For a future REDD+ scheme, the correct identification of deforestation and forest degradation and linking these processes to land use is crucial. However, it is a key challenge to distinguish degradation and deforestation from temporal vegetation dynamics inherent to swiddening. In this article we present an approach for spatial delineation of swidden systems based on landscape mosaics. Furthermore we introduce a classification for change processes based on the change matrix of these landscape mosaics. Our approach is illustrated by a case study in Viengkham district in northern Laos. Over a 30-year time period the swidden landscapes have increased in extent and they have degraded, shifting from long crop-allow cycles to short cycles. From 2007 to 2009 degradation within the swidden system accounted for half of all the landscape mosaics change processes. Pioneering shifting cultivation did not prevail. The landscape mosaics approach could be used in a swidden compatible monitoring, reporting and verification (MRV) system of a future REDD+ framework.

DOI

[26]
Huang H, Chen Y, Clinton Net al., 2017. Mapping major land cover dynamics in Beijing using all Landsat images in Google Earth Engine.Remote Sensing of Environment, 202: 166-176.Land cover in Beijing experienced a dramatic change due to intensive human activities, such as urbanization and afforestation. However, the spatial patterns of the dynamics are still unknown. The archived Landsat images provide an unprecedented opportunity to detect land cover changes over the past three decades. In this study, we used the Normalized Difference Vegetation Index (NDVI) trajectory to detect major land cover dynamics in Beijing. Then, we classified the land cover types in 2015 with the Google Earth Engine (GEE) cloud calculation. By overlaying the latest land cover types and the spatial distribution of land cover dynamics, we determined the main types where a land cover change occurred. The overall change detection accuracy for three types (vegetation loss associated with negative change in NDVI, vegetation gain associated with positive change in NDVI, and no changes) is 86.13%. We found that the GEE is a fast and powerful tool for land cover mapping, and we obtained a classification map with an overall accuracy of 86.61%. Over the past 3002years, 1402.2802km 2 of land was with vegetation loss and 1090.3802km 2 of land was revegetated in Beijing. The spatial pattern of vegetation loss and vegetation gain shows significant differences in different zones from the center of the city. We also found that 1162.7102km 2 of land was converted to urban and built-up, whereas 918.3602km 2 of land was revegetated to cropland, shrub land, forest, and grassland. Moreover, 202.6702km 2 and 156.7502km 2 of the land was transformed to forest and shrub land in the plain of Beijing that were traditionally used for cropland and housing.

DOI

[27]
Huete A R, 1988. A soil-adjusted vegetation index (SAVI).Remote Sensing of Environment, 25(3): 295-309.A transformation technique is presented to minimize soil brightness influences from spectral vegetation indices involving red and near-infrared (NIR) wavelengths. Graphically, the transformation involves a shifting of the origin of reflectance spectra plotted in NIR-red wavelength space to account for first-order soil-vegetation interactions and differential red and NIR flux extinction through vegetated canopies. For cotton ( Gossypium hirsutum L. var DPI-70) and range grass ( Eragrostics lehmanniana Nees) canopies, underlain with different soil backgrounds, the transformation nearly eliminated soil-induced variations in vegetation indices. A physical basis for the soil-adjusted vegetation index (SAVI) is subsequently presented. The SAVI was found to be an important step toward the establishment of simple lobal- that can describe dynamic soil-vegetation systems from remotely sensed data.

DOI

[28]
Huete A R, Liu H, Van Leeuwen W J, 1997. The use of vegetation indices in forested regions: Issues of linearity and saturation. In: IGARSS. Remote Sensing: A Scientific Vision for Sustainable Development. Singapore, IEEE: 1966-1968.

[29]
Hurni K, Hett C, Epprecht Met al., 2013. A texture-based land cover classification for the delineation of a shifting cultivation landscape in the Lao PDR using landscape metrics.Remote Sensing, 5(7): 3377-3396.

[30]
Hurni K, Hett C, Heinimann Aet al., 2013. Dynamics of shifting cultivation landscapes in Northern Lao PDR between 2000 and 2009 based on an analysis of MODIS time series and Landsat images.Human Ecology, 41(1): 21-36.The rotational nature of shifting cultivation poses several challenges to its detection by remote sensing. Consequently, there is a lack of spatial data on the dynamics of shifting cultivation landscapes on a regional, i.e. sub-national, or national level. We present an approach based on a time series of Landsat and MODIS data and landscape metrics to delineate the dynamics of shifting cultivation landscapes. Our results reveal that shifting cultivation is a land use system still widely and dynamically utilized in northern Laos. While there is an overall reduction in the areas dominated by shifting cultivation, some regions also show an expansion. A review of relevant reports and articles indicates that policies tend to lead to a reduction while market forces can result in both expansion and reduction. For a better understanding of the different factors affecting shifting cultivation landscapes in Laos, further research should focus on spatially explicit analyses.

DOI

[31]
Jackson T J, Chen D, Cosh Met al., 2004. Vegetation water content mapping using Landsat data derived normalized difference water index for corn and soybeans.Remote Sensing of Environment, 92(4): 475-482.Information about vegetation water content (VWC) has widespread utility in agriculture, forestry, and hydrology. It is also useful in retrieving soil moisture from microwave remote sensing observations. Providing a VWC estimate allows us to control a degree of freedom in the soil moisture retrieval process. However, these must be available in a timely fashion in order to be of value to routine applications, especially soil moisture retrieval. As part of the Soil Moisture Experiments 2002 (SMEX02), the potential of using satellite spectral reflectance measurements to map and monitor VWC for corn and soybean canopies was evaluated. Landsat Thematic Mapper and Enhanced Thematic Mapper Plus data and ground-based VWC measurements were used to establish relationships based on remotely sensed indices. The two indices studied were the Normalized Difference Vegetation Index (NDVI) and the Normalized Difference Water Index (NDWI). The NDVI saturated during the study period while the NDWI continued to reflect changes in VWC. NDWI was found to be superior based upon a quantitative analysis of bias and standard error. The method developed was used to map daily VWC for the watershed over the 1-month experiment period. It was also extended to a larger regional domain. In order to develop more robust and operational methods, we need to look at how we can utilize the MODIS instruments on the Terra and Aqua platforms, which can provide daily temporal coverage.

DOI

[32]
Kapos V, Rhind J, Edwards M et al., 2000. Developing a map of the world's mountain forests. In: Price M F, Butt N (ed.). Forests in Sustainable Mountain Development: A State of Knowledge Report for 2000. Task Force on Forests in Sustainable Mountain Development. Oxford: UK, 4-19.

[33]
Laurance W F, Sayer J, Cassman K G, 2014. Agricultural expansion and its impacts on tropical nature.Trends in Ecology & Evolution, 29(2): 107-116.The human population is projected to reach 11 billion this century, with the greatest increases in tropical developing nations. This growth, in concert with rising per-capita consumption, will require large increases in food and biofuel production. How will these megatrends affect tropical terrestrial and aquatic ecosystems and biodiversity? We foresee (i) major expansion and intensification of tropical agriculture, especially in Sub-Saharan Africa and South America; (ii) continuing rapid loss and alteration of tropical old-growth forests, woodlands, and semi-arid environments; (iii) a pivotal role for new roadways in determining the spatial extent of agriculture; and (iv) intensified conflicts between food production and nature conservation. Key priorities are to improve technologies and policies that promote more ecologically efficient food production while optimizing the allocation of lands to conservation and agriculture.

DOI PMID

[34]
Li P, Feng Z, 2014. Monitoring phenological stages of swiddening in northern Laos during the dry season. Proc. SPIE 9260, Land Surface Remote Sensing II. Beijing, International Society for Optics and Photonics: 13.

[35]
Li P, Feng Z, 2016. Extent and area of swidden in Montane Mainland Southeast Asia: Estimation by multi-step thresholds with Landsat-8 OLI data.Remote Sensing, 8(1): 44.Information on the distribution, area and extent of swidden agriculture landscape is necessary for implementing the program of Reducing Emissions from Deforestation and Forest Degradation (REDD), biodiversity conservation and local livelihood improvement. To our knowledge, explicit spatial maps and accurate area data on swidden agriculture remain surprisingly lacking. However, this traditional farming practice has been transforming into other profit-driven land use, like tree plantations and permanent cash agriculture. Swidden agriculture is characterized by a rotational and dynamic nature of agroforestry, with land cover changing from natural forests, newly-cleared swiddens to different-aged fallows. The Operational Land Imager (OLI) onboard the Landsat-8 satellite has visible, near-infrared and shortwave infrared bands, which are sensitive to the changes in vegetation cover, land surface moisture content and soil exposure, and therefore, four vegetation indices (VIs) were calculated, including the Normalized Difference Vegetation Index (NDVI), the Normalized Difference Moisture Index (NDMI), the Normalized Burn Ratio (NBR) and the Soil Adjusted Vegetation Index (SAVI). In this study, we developed a multi-step threshold approach that uses a combination of thresholds of four VIs and local elevation range (LER) and applied it to detect and map newly-opened swiddens and different-aged fallows using OLI imagery acquired between 2013 and 2015. The resultant Landsat-derived swidden agriculture maps have high accuracy with an overall accuracy of 86.9% and a Kappa coefficient of 0.864. The results of this study indicated that the Landsat-based multi-step threshold algorithms could potentially be applied to monitor the long-term change pattern of swidden agriculture in montane mainland Southeast Asia since the late 1980s and also in other tropical regions, like insular Southeast Asia, South Asia, Latin America and Central Africa, where swidden agriculture is still common.

DOI

[36]
Li P, Feng Z, Jiang Let al., 2014. A review of swidden agriculture in Southeast Asia.Remote Sensing, 6(2): 1654-1683.Swidden agriculture is by far the dominant land use system in the mountainous regions of Southeast Asia (SEA). It provides various valuable subsistence products to local farmers, mostly the poor ethnic minority groups. Controversially, it is also closely connected with a number of environmental issues. With the strengthening regional economic cooperation in SEA, swidden agriculture has experienced drastic transformations into other diverse market-oriented land use types since the 1990s. However, there is very limited information on the basic geographical and demographic data of swidden agriculture and the socio-economic and biophysical effects of the transformations. International programs, such as the Reducing Emissions from Deforestation and forest Degradation (REDD), underscore the importance of monitoring and evaluating swidden agriculture and its transition to reduce carbon emission due to deforestation and forest degradation. In this context, along with the accessibility of Landsat historical imagery, remote sensing based techniques will offer an effective way to detect and monitor the locations and extent of swidden agriculture. Many approaches for investigating fire occurrence and burned area can be introduced for swidden agriculture mapping due to the common feature of fire relatedness. In this review paper, four broad approaches involving spectral signatures, phenological characteristics, statistical theory and landscape ecology were summarized for swidden agriculture delineation. Five research priorities about swidden agriculture involving remote sensing techniques, spatial pattern, change, drivers and impacts were proposed accordingly. To our knowledge, a synthesis review on the remote sensing and outlook on swidden agriculture has not been reported yet. This review paper aims to give a comprehensive overview of swidden agriculture studies in the domains of debated definition, trends, remote sensing methods and outlook research in SEA undertaken in the past two decades.

DOI

[37]
Li P, Feng Z, Xiao C, 2018. Acquisition probability differences in cloud coverage of the available Landsat observations over mainland Southeast Asia from 1986 to 2015.International Journal of Digital Earth, 11(5): 437-450.Abstract Landsat data are the longest available records that consistently document global change. However, the extent and degree of cloud coverage typically determine its usability, especially in the tropics. In this study, scene-based metadata from the U.S. Geological Survey Landsat inventories, ten-day, monthly, seasonal, and annual acquisition probabilities (AP) of targeted images at various cloud coverage thresholds (10% to 100%) were statistically analyzed using available Landsat TM, ETM+, and OLI observations over mainland Southeast Asia (MSEA) from 1986 to 2015. Four significant results were found. First, the cumulative average acquisition probability of available Landsat observations over MSEA at the 30% cloud cover (CC) threshold was approximately 41.05%. Second, monthly and ten-day level probability statistics for the 30% CC threshold coincide with the temporal distribution of the dry and rainy seasons. This demonstrates that Landsat images acquired during the dry season satisfy the requirements needed for land cover monitoring. Third, differences in acquisition probabilities at the 30% CC threshold are different between the western and eastern regions of MSEA. Finally, the ability of TM, ETM+, and OLI to acquire high-quality imagery has gradually enhanced over time, especially during the dry season, along with consequently larger probabilities at lower CC thresholds.

DOI

[38]
Liao C, Feng Z, Li Pet al., 2015. Monitoring the spatio-temporal dynamics of swidden agriculture and fallow vegetation recovery using Landsat imagery in northern Laos.Journal of Geographical Sciences, 25(10): 1218-1234.Swidden agriculture is an age- old, prevailing but controversial farming practice in Montane Mainland Southeast Asia(MMSEA). In the uplands of northern Laos, swidden agriculture has become the predominant land use type for centuries. The swidden system has undergone dramatic transformations since the mid-1990 s. The debate on the change of swidden cultivation is linked to global critical issues of land use/cover change, biodiversity and climate change. Since the implementation of Reducing Emissions from Deforestation and forest Degradation(REDD) by the United Nations, an increasing attention has been given to swidden agriculture in the humid tropics nationally and internationally. However, very little is known or reported about the explicit spatial information of swidden agriculture and the consequences of the transitions at macroscopic scale. For the purpose of understanding the spatial and temporal dynamics of swidden system, the intensity of swidden use and fallow forest recovery in northern Laos, in this study, the swidden agriculture in 1990, 2002, and 2011 were mapped and delineated with Landsat Thematic Mapper(TM) and Enhanced Thematic Mapper plus(ETM+)imagery(30 m) with a decision tree classification method, followed by the analysis of spatiotemporal changes of swidden agriculture. Then, annual successive TM/ETM + images during the period 2000- 2010 were used to delineate the dynamics of burning phase and cropping phase. Subsequently, the burned pixels derived in 2000 were compared with those in the following years(2001-2011) under Arc GIS 10.0 to investigate the temporal development, land use frequency and swidden cycle with time- series Landsat- based NDVI data. Finally, as the swidden cycle changed from 1 to 11 years, the fallow vegetation recovery process was studied.The results showed that:(1) From 1990- 2011, the area of swidden agriculture increased by54.98%, from 153,800 to 238,400 ha. The increased swidden cultivation were mainly found in Luang Prabang and southern Bokeo; while the decreased parts were mainly in Phongsali.(2)The swidden agriculture mainly increased at the elevations of 500-800 m, 300-500 m and 800-1000 m and on the slopes of 10-20 and 20-30. More than 80% of swidden farming land was transformed from forests.(3) During the period 2000- 2011, the frequency of swidden use in northern Laos was about 2 or 3 times. The intervals of any two swidden use phases ranged from 1 to 7 years. In comparison with swidden cycles and the related proportion of swidden farming in the years of 2000, 2003 and 2007, swidden cycles in most parts were shortened.(4)There was a significant correlation between fallow vegetation recovery and swidden cycle, with a correlation coefficient of 0.9698. The NDVI of regenerated vegetation could be equal to the average NDVI value of forest when the swidden cycle reaches 10 years.

DOI

[39]
Manivong V, Cramb R A, 2008. Economics of smallholder rubber expansion in Northern Laos.Agroforestry Systems, 74(2): 113-125.In Northern Laos, as elsewhere in the Southeast Asian uplands, there is an agricultural transition underway from subsistence production based on shifting cultivation to commercial production based on tree crops. In response to demand from China, rubber smallholdings are being established by shifting cultivators in Northern Laos, encouraged by government land-use policy. We examine the bio-economics of smallholder rubber production in an established rubber-growing village and model the likely expansion of smallholder rubber in Northern Laos. Data were obtained from key informants, group interviews, direct observation, and a farm-household survey. Latex yields were estimated using the Bioeconomic Rubber Agroforestry Support System (BRASS). A financial model was developed to estimate the net present value for a representative rubber smallholding. This model was then combined with spatial data in a Geographical Information System (GIS) to predict the likely expansion of rubber based on resource quality and accessibility. Implications are drawn for upland development in the region.

DOI

[40]
Masek J G, Vermote E F, Saleous N Eet al., 2006. A Landsat surface reflectance dataset for North America, 1990-2000.IEEE Geoscience and Remote Sensing Letters, 3(1): 68-72.The Landsat Ecosystem Disturbance Adaptive Processing System (LEDAPS) at the National Aeronautics and Space Administration (NASA) Goddard Space Flight Center has processed and released 2100 Landsat Thematic Mapper and Enhanced Thematic Mapper Plus surface reflectance scenes, providing 30-m resolution wall-to-wall reflectance coverage for North America for epochs centered on 1990 and 2000. This dataset can support decadal assessments of environmental and land-cover change, production of reflectance-based biophysical products, and applications that merge reflectance data from multiple sensors [e.g., the Advanced Spaceborne Thermal Emission and Reflection Radiometer, Multiangle Imaging Spectroradiometer, Moderate Resolution Imaging Spectroradiometer (MODIS)]. The raw imagery was obtained from the orthorectified Landsat GeoCover dataset, purchased by NASA from the Earth Satellite Corporation. Through the LEDAPS project, these data were calibrated, converted to top-of-atmosphere reflectance, and then atmospherically corrected using the MODIS/6S methodology. Initial comparisons with ground-based optical thickness measurements and simultaneously acquired MODIS imagery indicate comparable uncertainty in Landsat surface reflectance compared to the standard MODIS reflectance product (the greater of 0.5% absolute reflectance or 5% of the recorded reflectance value). The rapid automated nature of the processing stream also paves the way for routine high-level products from future Landsat sensors.

DOI

[41]
Mertz O, Leisz S, Heinimann Aet al., 2009. Who counts? Demography of swidden cultivators in Southeast Asia.Human Ecology, 37(3): 281-289.Swidden cultivators are often found as a distinct category of farmers in the literature, but rarely appear in population censuses or other national and regional classifications. This has led to a worldwide confusion on how many people are dependent on this form of agriculture. The most often cited number of 200-300 million dates back to the early 1970s, but the source is obscure. We assess available, published data from nine countries in Southeast Asia and conclude that on this basis it is not possible to provide a firm estimate of the number of swidden cultivators in the region. A conservative range of 14-34 million people engaged in swidden cultivation in the region is suggested, however. We argue that along with improved knowledge of swidden livelihoods, there is an urgent need to develop techniques that will allow for better estimates of swidden populations in order to secure appropriate rural development and poverty reduction in swidden areas. is suggested, however. We argue that along with improved knowledge of swidden livelihoods, there is an urgent need to develop techniques that will allow for better estimates of swidden populations in order to secure appropriate rural development and poverty reduction in swidden areas.

DOI

[42]
Mertz O, Padoch C, Fox Jet al., 2009. Swidden change in Southeast Asia: Understanding causes and consequences.Human Ecology, 37(3): 259-264.IntroductionMore than 5002years ago the FAO Staff through its forestry journal Unasylva issued an “appeal…to governments, research centers, associations and private persons who are in a position to hel

DOI

[43]
Messerli P, Heinimann A, Epprecht M, 2009. Finding homogeneity in heterogeneity: A new approach to quantifying landscape mosaics developed for the Lao PDR.Human Ecology, 37(3): 291-304.A key challenge for land change science in general and research on swidden agriculture in particular, is linking land cover information to human-environment interactions over larger spatial areas. In Lao PDR, a country facing rapid and multi-level land change processes, this hinders informed policy-and decision-making. Crucial information on land use types and people involved is still lacking. This article proposes an alternative approach for the description of landscape mosaics. Instead of analyzing local land use combinations, we studied land cover mosaics at a meso-level of spatial scale and interpreted these in terms of human-environmental interactions. These landscape mosaics were then overlaid with population census data. Results showed that swidden agricultural landscapes, involving 17% of the population, dominate 29% of the country, while permanent agricultural landscapes involve 74% of the population in 29% of the territory. Forests still form an important component of these landscape mosaics.

DOI PMID

[44]
Michaud J, 2010. Editorial-Zomia and beyond.Journal of Global History, 5(2): 187-214.

[45]
Padoch C, Coffey K, Mertz Oet al., 2007. The demise of swidden in Southeast Asia? Local realities and regional ambiguities.Geografisk Tidsskrift-Danish Journal of Geography, 107(1): 29-41.Swidden farmers throughout Southeast Asia are rapidly abandoning traditional land use practices. While these changes have been quantified in numerous local areas, no reliable region-wide data have been produced. In this article we discuss three linked issues that account for at least some of this knowledge gap. First, swidden is a diverse, complex, and dynamic land use that data gatherers find difficult to see, define and measure, and therefore often relegate to a “residual category” of land use. Second, swidden is a smallholder category, and government authorities find it difficult to quantify what is happening in many dynamic and varied smallholdings. Third, national policies in all countries of Southeast Asia have tried to outlaw swidden farming and to encourage swiddeners to adopt permanent agriculture land use practices. Drawing on specific, local examples from throughout the region to illustrate these points, we argue that an accurate assessment of the scale and pace of changes in swidden farming on a regional level is critically important for identifying the processes that account for these shifts, as well as evaluating their consequences, locally and regionally.

DOI

[46]
Rerkasem K, Lawrence D, Padoch Cet al., 2009. Consequences of swidden transitions for crop and fallow biodiversity in Southeast Asia.Human Ecology, 37(3): 347-360.Swidden agriculture, once the dominant form of land use throughout the uplands and much of the lowlands of Southeast Asia, is being replaced by other land uses. While change and adaptation are inherent to swiddening, the current rapid and widespread transitions are unprecedented. In this paper we review some recent findings on changes in biodiversity, especially plant diversity at various scales, as swidden farming is replaced by other land uses. We focus particularly on two areas of Southeast Asia: northern Thailand and West Kalimantan. We examine actual and potential changes in the diversity of crops that characterize regional swidden systems, as well as that of the spontaneously occurring plants that appear in swidden fields and fallows. Severe declines in plant diversity have been observed in most areas and at most spatial scales when swidden is replaced by permanent land use systems. However, shifts away from swidden agriculture do not invariably result in drastic declines or losses of biological diversity, but may maintain or even enhance it, particularly at finer spatial scales. We suggest that further research is necessary to understand the effects of swidden transitions on biodiversity.

DOI

[47]
Rerkasem K, Yimyam N, Rerkasem B, 2009. Land use transformation in the mountainous mainland Southeast Asia region and the role of indigenous knowledge and skills in forest management.Forest Ecology and Management, 257(10): 2035-2043.The mountainous mainland Southeast Asia region, that covers adjoining parts of Cambodia, Lao PDR, Myanmar, Thailand, Vietnam and China, contains the region's largest remaining tropical forest. The people living in the forested mountains, who belong to a diversity of ethnic minority groups, possess a wealth of local knowledge and skills in forest management. With rapid decrease in forest area, implementation of forest conservation policies, improved access to market and replacement of shifting cultivation with permanent cropping, land use and management in the region has been rapidly changing. Some indigenous knowledge and technology in forest management will inevitably continue to be lost in the process, but not all. This paper shows how local forest management systems have been adapted to deal with the change, with specific focus on deployment and adaptation of indigenous knowledge and skills. First background on the region and its traditional land use systems will be provided. A review will then be made of the cropping system changes that have been taking place and their driving forces and how local farmers have adapted indigenous knowledge and skill in forest management to meet current needs and conditions. Cases drawn from studies in the region will illustrate how deployment of indigenous technology not only helps the farmers to improve their productivity but can also provide services in forest regeneration and biodiversity conservation. To do this farmers, including those who were former migratory opium growers, make use of the knowledge of their own environment and locally available genetic resources and the community's organizational and management skills. It will also be shown that farmers- knowledge and skills are not static, but continually revised and integrating modern inputs as well as transfer of new ideas and innovations.

DOI

[48]
Schmidt-Vogt D, Leisz S J, Mertz Oet al., 2009. An assessment of trends in the extent of swidden in Southeast Asia.Human Ecology, 37(3): 269-280.Swidden systems consisting of temporarily cultivated land and associated fallows often do not appear on land use maps or in statistical records. This is partly due to the fact that swidden is a diverse and dynamic land use system that is difficult to map and partly because of the practice of grouping land covers associated with swidden systems into land use or land cover categories that are not self-evidently linked to swiddening. Additionally, in many parts of Southeast Asia swidden systems have changed or are in the process of changing into other land use systems. This paper assesses the extent of swidden on the basis of regional and national sources for nine countries, and determines the pattern of changes of swidden on the basis of 151 cases culled from 67 articles. Findings include (1) a majority of the cases document swidden being replaced by other forms of agriculture or by other livelihood systems; (2) in cases where swiddening is still practiced, fallow lengths are usually, but not always, shorter; and (3) shortened fallow length does not necessarily indicate a trend away from swidden since it is observed that short fallow swidden is sometimes maintained along with other more intensive farming practices and not completely abandoned. The paper concludes that there is a surprising lack of conclusive data on the extent of swidden in Southeast Asia. In order to remedy this, methods are reviewed that may lead to more precise future assessments.

DOI

[49]
Stibig H, Achard F, Carboni Set al., 2014. Change in tropical forest cover of Southeast Asia from 1990 to 2010.Biogeosciences, 11(2): 247.The study assesses the extent and trends of forest cover in Southeast Asia for the periods 1990???2000 and 2000???2010 and provides an overview on the main causes of forest cover change. A systematic sample of 418 sites (10 km ?? 10 km size) located at the one-degree geographical confluence points and covered with satellite imagery of 30 m resolution is used for the assessment. Techniques of image segmentation and automated classification are combined with visual satellite image interpretation and quality control, involving forestry experts from Southeast Asian countries. The accuracy of our results is assessed through an independent consistency assessment, performed from a subsample of 1572 mapping units and resulting in an overall agreement of >85% for the general differentiation of forest cover versus non-forest cover. The total forest cover of Southeast Asia is estimated at 268 Mha in 1990, dropping to 236 Mha in 2010, with annual change rates of 1.75 Mha (650.67%) and 1.45 Mha (650.59%) for the periods 1990???2000 and 2000???2010, respectively. The vast majority of forest cover loss (652 / 3 for 2000???2010) occurred in insular Southeast Asia. Complementing our quantitative results by indicative information on patterns and on processes of forest change, obtained from the screening of satellite imagery and through expert consultation, respectively, confirms the conversion of forest to cash crops plantations (including oil palm) as the main cause of forest loss in Southeast Asia. Logging and the replacement of natural forests by forest plantations are two further important change processes in the region.

DOI

[50]
Stibig H J, Achard F, Fritz S, 2004. A new forest cover map of continental southeast Asia derived from SPOT-VEGETATION satellite imagery.Applied Vegetation Science, 7(2): 153-162.Question: Can recent satellite imagery of coarse spatial resolution support forest cover assessment and mapping at the regional level? Location: Continental southeast Asia. Methods: Forest cover mapping was based on digital classification of SPOT4-VEGETATION satellite images of 1 km spatial resolution from the dry seasons 1998/1999 and 1999/2000. Following a geographical stratification, the spectral clusters were visually assigned to land cover classes. The forest classes were validated by an independent set of maps, derived from interpretation of satellite imagery of high spatial resolution (Landsat TM, 30 m). Forest area estimates from the regional forest cover map were compared to the forest figures of the FAO database. Results: The regional forest cover map displays 12 forest and land cover classes. The mapping of the region's deciduous and fragmented forest cover remained challenging. A high correlation was found between forest area estimates obtained from this map and from the Landsat TM derived maps. The regional and sub-regional forest area estimates were close to those reported by FAO. Conclusion: SPOT4-VEGETATION satellite imagery can be used for mapping consistently and uniformly the extent and distribution of the broad forest cover types at the regional scale. The new map can be considered as an update and improvement on existing regional forest cover maps.

DOI

[51]
Stibig H J, Belward A S, Roy P Set al., 2007. A land-cover map for South and Southeast Asia derived from SPOT-VEGETATION data.Journal of Biogeography, 34(4): 625-637.Aim Our aim was to produce a uniform 'regional' land-cover map of South and Southeast Asia based on 'sub-regional' mapping results generated in the context of the Global Land Cover 2000 project.

DOI

[52]
Tian Y, Wu B, Zhang Let al., 2011. Opium poppy monitoring with remote sensing in North Myanmar.International Journal of Drug Policy, 22(4): 278-284.Myanmar has long been a focus of the international community as a major opium poppy cultivation region. This study used remote sensing technology and ground verification to monitor opium poppy cultivation for three opium poppy growth seasons in North Myanmar. The study found that opium poppy cultivation has remained high. In 2005–6, 2006–7 and 2007–8 growing seasons the total areas monitored were 52,482 km 2, 178,274 km 2 and 236,342 km 2 and the total cultivated area of opium poppy was 8959 ha, 18,606 ha and 22,300, respectively. This was significantly less than cultivation levels reported during the 1990s. The major cultivation regions were located in Shan State, producing 88% of total poppy cultivation in North Myanmar in 2007–8. The opium poppy was mainly cultivated in the interlocking regions controlled by the local armed forces in Shan State. The field survey noted that most households in this area were poor and poppy cultivation was a main source of income. There were also differences between our figures on poppy cultivation and those reported by United Nations Office on Drugs and Crime. Our study shows that although the opium poppy cultivation in North Myanmar has reduced over recent years, it remains a major producer of opium and to which the international community needs to pay attention, especially in those areas controlled by local armed forces.

DOI PMID

[53]
Tucker C J, Justice C O, Prince S D, 1986. Monitoring the grasslands of the Sahel 1984-1985.International Journal of Remote Sensing, 7(11): 1571-1581.Normalized difference vegetation index data obtained from polar-orbiting meteorological satellites were used to compare the growing or rainy seasons of 1984 and 1985 for the Sahelian zone of Africa. A substantial difference was found between these two years, with 1985 generally having higher normalized difference vegetation index values indicating higher levels of primary production in 1985 than in 1984. 1 km data were compared for Senegal, Mali, Niger and Sudan, and 7 km data were compared for sub-Saharan Africa. The qualitative comparison of these data suggests the use of similar data to assist in centralized monitoring of rangeland conditions, to identify areas of deficiencies in primary production and provide synoptic information in support of regional drought monitoring

DOI

[54]
U.S. Geological Survey (USGS), 2016. USGS Earth Resources Observation and Science (EROS) Center Science Processing Architecture (ESPA) On Demand Interface (Version 3.3).

[55]
Van Schendel W, 2002. Geographies of knowing, geographies of ignorance: Jumping scale in Southeast Asia.Environment and Planning D: Society and Space, 20(6): 647-668.

[56]
van Vliet N, Mertz O, Birch-Thomsen Tet al., 2013. Is there a continuing rationale for swidden cultivation in the 21st century?Human Ecology, 41(1): 1-5.Introduction Large areas of the tropical forest landscapes are still occupied – partly or fully – by swidden cultivation, but it is also clear that in many areas both the extent and intensity of swidden cultivation are changing. This is not new as it has always been a dynamic system used when it is opportune and changed or even dropped when other more favorable options for land and labor use, income, etc. appear. It seems that these changes now occur faster in some regions and slower or not at all in others (van Vliet et al . 2012 ). Political and economic pressures are the main drivers that have encouraged or enforced such changes, particularly towards more intensive agricultural practices or to other types of land use (urbanization, large scale plantations, protected areas, extractive concessions, etc.). However, the nature of these changes in swidden cultivation are not well documented, partly because swidden fields and the various successional stages of woody re-growth associated with ...

DOI

[57]
van Vliet N, Mertz O, Heinimann Aet al., 2012. Trends, drivers and impacts of changes in swidden cultivation in tropical forest-agriculture frontiers: A global assessment.Global Environmental Change, 22(2): 418-429.This meta-analysis of land-cover transformations of the past 10-15 years in tropical forest-agriculture frontiers world-wide shows that swidden agriculture decreases in landscapes with access to local, national and international markets that encourage cattle production and cash cropping, including biofuels. Conservation policies and practices also accelerate changes in swidden by restricting forest clearing and encouraging commercial agriculture. However, swidden remains important in many frontier areas where farmers have unequal or insecure access to investment and market opportunities, or where multi-functionality of land uses has been preserved as a strategy to adapt to current ecological, economic and political circumstances. In some areas swidden remains important simply because intensification is not a viable choice, for example when population densities and/or food market demands are low. The transformation of swidden landscapes into more intensive land uses has generally increased household incomes, but has also led to negative effects on the social and human capital of local communities to varying degrees. From an environmental perspective, the transition from swidden to other land uses often contributes to permanent deforestation, loss of biodiversity, increased weed pressure, declines in soil fertility, and accelerated soil erosion. Our prognosis is that, despite the global trend towards land use intensification, in many areas swidden will remain part of rural landscapes as the safety component of diversified systems, particularly in response to risks and uncertainties associated with more intensive land use systems.

DOI

[58]
Vogelmann J E, Rock B N, 1988. Assessing forest damage in high-elevation coniferous forests in Vermont and New Hampshire using Thematic Mapper data.Remote Sensing of Environment, 24(2): 227-246.This study evaluates the potential of measuring/mapping forest damage in spruce-fir forests in the Green Mountains of Vermont and White Mountains of New Hampshire using Landsat Thematic Mapper (TM) data. The TM 1.65/0.83 μm (TM5/4) and 2.22/0.83 μm (TM7/4) band ratios were found to correlate well with ground-based measurements of forest damage (a measure of percentage foliar loss) at 11 spruce-fir stands located on Camels Hump, a mountain in northern Vermont. Images using 0.56 μm and 1.65 μm bands with 1.65/0.83 μm band ratios indicated locations of heavy conifer forest damage. Both 1.65/0.83 and 2.22/0.83 μm band ratios were used to quantify levels of conifer forest damage among individual mountains throughout many of the Green and White Mountains. Damage was found to be consistantly higher for the Green than the White Mountains.

DOI

[59]
Woodcock C E, Allen R, Anderson Met al., 2008. Free access to Landsat imagery.Science, 320(5879): 1011-1012.

[60]
Xiao C W, Li P, Feng Z Met al., 2018. Spatio-temporal differences in cloud cover of Landsat-8 OLI observations across China during 2013-2016.Journal of Geographical Sciences, 28(4): 429-444.Currently, the historical archive images of Landsat family sensors are probably the most effective data products for tracking global longitudinal changes since the 1970s. However, the issue of the degree and extent of cloud coverage is always a challenge and varies distinctively worldwide. So far, acquisition probability (AP) analyses of cloud cover (CC) of Landsat observations have been conducted with different sensors at regional scale. To our knowledge, CC probability analysis for the newly-launched Landsat-8 Operational Land Imager (OLI) across China is not reported. In this paper, monthly, seasonal, and annual APs for Landsat OLI (44,228 in total) images over China acquired from April 2013 to October 2016 with various CC thresholds were analyzed. The results showed that: first, the cumulative average APs of all OLI data over China at the CC thresholds 30% was about 49.6% which illustrated the availability of OLI imagery across China. Second, the spatial patterns of 10%, 20%, and 30% CC thresholds of OLI observations, coincided well with the precipitation distributions separated by the respective 200 mm, 400 mm, and 800 mm isohyetal lines. Third, the APs of images with the 30% CC threshold are the highest in autumn and winter especially in October of 58.7%, while the corresponding lowest probability occurred in June of 41.0%. Finally, the spatial differences in APs of targeted images with 30% CC thresholds were quite significant. At regional scales, the arid and semi-arid areas, Inland River and Songliao River basins, and northwestern side of the Hu Huanyong population line had the larger probabilities of obtaining high-quality images. Our study suggested that OLI imagery satisfy the data requirements needed for land surface monitoring, although there existed obvious spatio-temporal differences in APs over China at the 30% CC threshold.

DOI

[61]
Zhu Z, Woodcock C E, 2012. Object-based cloud and cloud shadow detection in Landsat imagery.Remote Sensing of Environment, 118: 83-94.78 A new method for automated cloud and cloud shadow detection in Landsat images. 78 It is the result of combining past approaches and a new object-based approach. 78 It is an improvement over the traditional ACCA cloud algorithm. 78 The average Fmask cloud overall accuracy is 96.4%.

DOI

[62]
Ziegler A D, Bruun T B, Guardiola-Claramonte Met al., 2009. Environmental consequences of the demise in swidden cultivation in Montane Mainland Southeast Asia: Hydrology and deomorphology.Human Ecology, 37(3): 361-373.The hydrological and geomorphological impacts of traditional swidden cultivation in Montane Mainland Southeast Asia are virtually inconsequential, whereas the impacts associated with intensified replacement agricultural systems are often much more substantial. Negative perceptions toward swiddening in general by governments in the region beginning half a decade ago have largely been based on cases of forest conversion and land degradation associated with (a) intensified swidden systems, characterized by shortened fallow and extended cropping periods and/or (b) the widespread cultivation of opium for cash after the Second World War. Neither of these practices should be viewed as traditional, subsistence-based swiddening. Other types of intensive agriculture systems are now replacing swiddening throughout the region, including semi-permanent and permanent cash cropping, monoculture plantations, and greenhouse complexes. The negative impacts associated with these systems include changes in streamflow response, increased surface erosion, a higher probability of landslides, and the declination in stream water quality. Unlike the case for traditional swiddening, these impacts result because of several factors: (1) large portions of upland catchments are cultivated simultaneously; (2) accelerated hydraulic and tillage erosion occurs on plots that are cultivated repetitively with limited or no fallowing to allow recovery of key soil properties, including infiltration; (3) concentrated overland flow and erosion sources are often directly connected with the stream network; (4) root strength is reduced on permanently converted hillslopes; (5) surface and ground water extraction is frequently used for irrigation; and (6) and pesticides and herbicides are used. Furthermore, the commercial success of these systems relies on the existence of dense networks of roads, which are linear landscape features renowned for disrupting hydrological and geomorphological systems. A new conservation focus is needed to reduce the impacts of these intensified upland agricultural practices.

DOI

[63]
Ziegler A D, Fox J M, Webb E Let al., 2011. Recognizing contemporary roles of swidden agriculture in transforming landscapes of Southeast Asia.Conservation Biology, 25(4): 846-848.No abstract is available for this article.

DOI PMID

[64]
Zwartendijk B W, van Meerveld H J, Ghimire C Pet al., 2017. Rebuilding soil hydrological functioning after swidden agriculture in eastern Madagascar.Agriculture, Ecosystems & Environment, 239: 101-111.Land-use change due to the widespread practice of swidden agriculture affects the supply of ecosystem services. However, there is comparatively little understanding of how the hydrological functioning of soils, which affects rainfall infiltration and therefore flood risk, dry-season flows and surface erosion, is affected by repeated vegetation clearing and burning, the extent to which this can recover following land abandonment and vegetation regrowth, and whether active restoration speeds up recovery. We used interviews with local land users and indicator plant species to reconstruct the land-use history of 19 different sites in upland eastern Madagascar that represent four different land-use categories: semi-mature forests that were never burnt but were influenced by manual logging until 15–20 years ago; fallows that were actively reforested 6–9 years ago; 2–10 year old naturally regenerating fallows; and highly degraded fire-climax grassland sites. Surface- and near-surface (down to 30 cm depth) saturated soil hydraulic conductivities (Ksat), as well as the dominant flow pathways for infiltration and percolation were determined for each land-cover type. Surface Ksat in the forest sites was very high (median: 724 mm h6301) and infiltration was dominated by flow along roots and other preferential flow pathways (macropores), whereas Ksat in the degraded land was low (median: 45 mm h6301) with infiltration being dominated by near-surface matrix flow. The total area of blue-dye stains was inversely correlated to the Ksat. Both surface- and near-surface Ksat had increased significantly after 6–9 years of forest regeneration (median values of 203 and 161mm h6301 for reforestation and natural regeneration, respectively). Additional observations are needed to more fully understand the rates at which soil hydrological functioning can be rebuilt and whether active replanting decreases the time required to restore soil hydrological functioning or not.

DOI

Outlines

/