Orginal Article

The trade network of the Belt and Road Initiative and its topological relationship to the global trade network

  • SONG Zhouying , 1, 2, 3 ,
  • CHE Shuyun 1, 2, 3 ,
  • YANG Yu* , 1, 2, 3
Expand
  • 1. Key Laboratory of Regional Sustainable Development Modeling, CAS, Beijing 100101, China
  • 2. Institute of Geographic Sciences and Natural Resources Research, CAS, Beijing 100101, China
  • 3. College of Resources and Environment, University of Chinese Academy of Sciences, Beijing 100049, China
*Corresponding author: Yang Yu (1984-), PhD and Associate Professor, specialized in energy geography and regional studies. E-mail:

Author: Song Zhouying (1982-), PhD and Associate Professor, specialized in economic geography and regional studies. E-mail:

Received date: 2018-01-05

  Accepted date: 2018-03-20

  Online published: 2018-09-25

Supported by

CAS Priority Research Program, No.XDA20010102

National Social Science Foundation of China, No.17VDL008

Copyright

Journal of Geographical Sciences, All Rights Reserved

Abstract

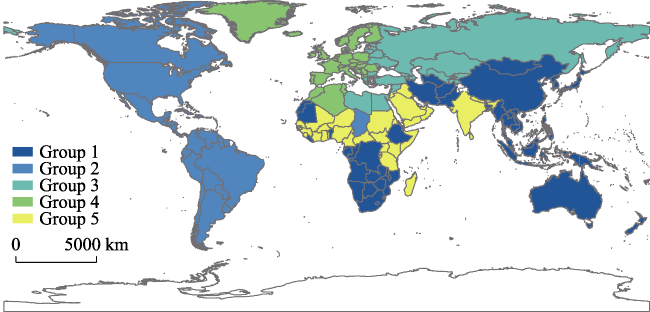
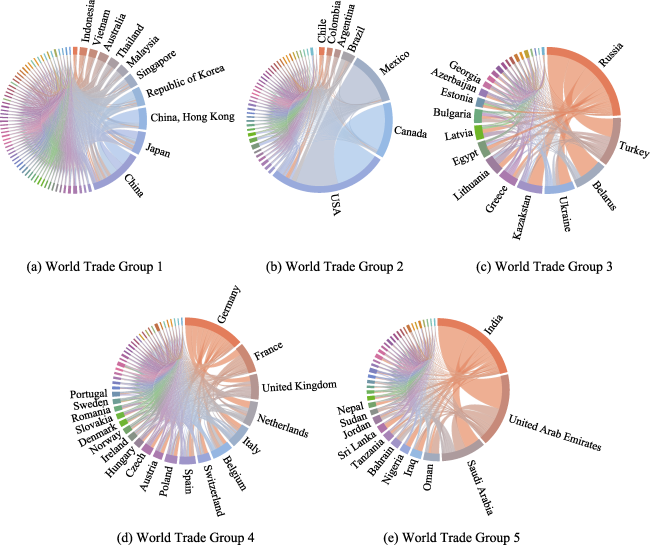
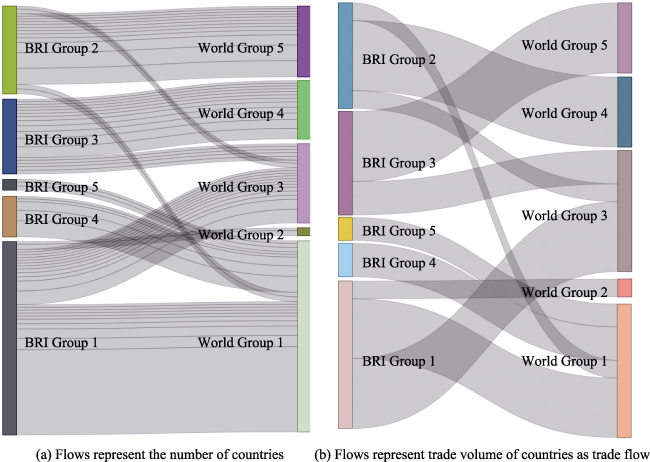
Unimpeded trade is one of the cooperation priorities in the Belt and Road Initiative proposed by China. On 15 May 2017, the Joint Communique of the Leaders Roundtable of the Belt and Road Forum for International Cooperation reaffirmed the participants’ shared commitment to build an open economy and ensure free and inclusive trade. The Belt and Road Initiative (BRI) is not only China's new action to drive its open and global development, but also a platform for an increasing number of countries to explore free and inclusive trade and promote a universal, rule-based, open, non-discriminatory, and equitable multilateral trade system. It is therefore important to examine the topological relationship between the BRI and global trade networks. More specifically, this article first analyzes the community structure of trade networks using a community detection algorithm, and then estimates the topological relationship between different trade communities. The findings of this article are as follows. First, this research identified three trade communities and two sub-communities in the BRI trade network, in which China is the core, Russia is the sub-core of the biggest trade community, and India, United Arab Emirates, and Saudi Arabia are cores of the second trade community (South Asia-West Asia). Second, it identified five trade communities in the global trade network, centred on China, USA, Russia, India-United Arab Emirates, and Germany-Netherlands-France-Britain and other European developed countries. Third, the topological analysis indicated that in the global trade network, most BRI countries are attracted by the core nodes of the BRI regions, such as the China, Russia and India-United Arab Emirates core nodes, and have strong trade contacts with BRI countries. Most Central-East European countries are mainly attracted by Germany-Netherlands-France-Britain and other developed European countries with a low penetration of BRI trade. Although some Southeast Asian countries are incorporated into the Asia-Australia-South Africa community with China as the core, they still need to strengthen trade linkages with BRI countries.

Cite this article

SONG Zhouying , CHE Shuyun , YANG Yu* . The trade network of the Belt and Road Initiative and its topological relationship to the global trade network[J]. Journal of Geographical Sciences, 2018 , 28(9) : 1249 -1262 . DOI: 10.1007/s11442-018-1523-8

1 Introduction

Since the 1970s, globalization has brought a rapid increase in global trade. From 1970 to 2016, global gross domestic product (GDP hereafter) increased 25.44 times, while international trade increased 52.32 times at current prices. On the one hand, globalization had positive effects on global economic growth; on the other, it resulted in severe social polarization at various spatial scales (Hudson, 2016; Liu and Dunford, 2016; Henderson and Jepson, 2017; Liu, 2017). Against such a background, the Belt and Road Initiative (BRI, hereafter) proposed by China provides an alternative, inclusive globalization path (Liu, 2017). In particular, “unimpeded trade” is an important component and a priority of the BRI, and is regarded as a significant driver of the economic prosperity of, and regional cooperation among, BRI countries (Song et al., 2017). The Joint Communiqué of the Leaders’ Roundtable of the Belt and Road Forum for International Cooperation, signed on May 15, 2017, explicitly promoted the idea of building an open economy, and ensuring free and inclusive trade. Thus, the emerging BRI trade network is a key feature of the BRI. It is against such a background that this paper analyses the BRI trade network and examines its topological relationship to the global trade network.
Trade cooperation under the BRI is undoubtedly an open system, devoted to maintaining global free trade. However, an analysis of BRI trade network and its role in global trade network must involve the identification of the spatial boundary of the BRI. In this research, 64 countries tentatively identified in 2014 as countries with which China would like to explore the possibility of co-developing the BRI by China’s Ministry of Foreign Affairs along with China itself were identified as the BRI trade network. The global trade network involves all of the 232 countries in the world.
Analyses of trade networks are common in disciplines such as economics, geography and management. A particular focus of trade research has been on social and complex network analysis to study the evolution of spatio-temporal patterns and topological structures of world trade and their determinants (Kim et al., 2002; Serrano et al., 2003; Fagiolo et al., 2010; Duan et al., 2008; Chen et al., 2011; Luca and Lucia, 2011; Carolo and Lucia, 2015), and the trade networks of specific products and industries, such as crude oil, natural gas, maize and manufacturing (Hakanson and Dow, 2012; Sun et al., 2012; Xu et al., 2015; Ma et al., 2016; Ma et al., 2017). In recent years, with the promotion of the BRI, trade networks among the 65 BRI countries have also become subjects of interest (Song et al., 2017) with applications of social network, fuzzy analytical network and cohesive subgroups methods to reveal the characteristics of the BRI trade networks (Wang et al., 2015; Zou et al., 2016; Song et al., 2017). Other scholars have used complex network analysis methods to examine BRI trade networks for specific products (Liu et al., 2015; He et al., 2016). Existing research has however not paid attention to the topological structure of the BRI trade network and its status within the global trade network. Trade relationships and trade flows between the BRI countries and the global trade network have not been effectively analysed.
This study has some novel features when compared to the existing literature. First, it used the community detection method to analyse the topological structures of the emerging BRI trade network to identify BRI trade groups, trade relationships and trade nodes. Second, it uses spatial analysis and mapping methods that significantly supplement traditional multivariate analysis (Pick, 2015). The visualization capability of ARCGIS is used to develop a descriptive understanding of the spatio-temporal patterns of the emerging BRI trade network. Chord Diagrams are used to represent the trade relationships and trade flows inside each of the trade groups identified by the community detection method. Sankey Diagrams are employed to identify topological relationships between the BRI and global trade networks. Finally, a BRI percentage index is used to see whether the topological relationships identified by the community detection and visualization methods account for geographical associations, in which case one can overcome geographically biased topological analysis findings.

2 Research data and methods

2.1 Research data

The data used in this paper came from the International Trade Centre (ITC) database, which was later compared with trade data from China’s Customs Information Website. And the underlying data relating to trade were all valued in US dollar (USD), such as million dollar, billion dollar and trillion dollar, and all about the year 2016.
Two key indicators are selected to measure the community structure of trade networks and their topological relationships, trade volume and trade flow. Trade volume refers to the value amount of the exchange of goods across international borders or territories that was traded during 2016, and equals to exports plus imports. And trade flow refers to the goods trade amount/volume between two particular countries or regions in 2016.

2.2 Research methods

(1) The community detection method
Community detection is adopted to analyse the topological structures of BRI and global trade networks, identifying the internal combined conglomeration structure of the trade network represented by the actual trade flows between countries and regions. Calculation involves the use of the algorithm optimization module. Countries are regarded as the nodes of trade networks, trade relationships are the wires in the network, and trade flows are the weights of the wires. A modularization formula is employed defined as:
\[Q=\frac{1}{2m}\sum\limits_{i,j}{\left[ {{A}_{ij}}-\frac{{{k}_{i}}{{k}_{j}}}{2m} \right]\delta ({{c}_{i}},{{c}_{j}})},\ (1)\]
where Aij represents the trade flow between countries i and j; ki and kj denote the sum of the trade flows for countries i and j; ci and cj refer to the community indices of countries i and j; and δ(ci, cj) indicates whether or not countries i and j are in the same community: if yes, the value is 1; if no, the value is 0. m denotes the total trade flow within the whole network. Higher values of Q indicate higher degrees of modularization.
(2) Visualization method
Two visualization methods, the Chord and Sankey Diagrams, are used to represent the topological relationships of the trade networks and trade flows between different trade groups. The Chord Diagram is a topological network visualization method that can reflect the topological relationship between different locations within the network. The arcs correspond to network nodes. A larger radius angle of an arc results in a longer arc length and larger attribute value for a network node, which means the modified core trade areas are stronger. The links between arcs reveal the topological relationships for different nodes, where a larger link width corresponds to stronger relationships, meaning that the trade relationships between countries (nodes) are stronger. And the nodes of a network are represented as arcs on a circle.
The Sankey Diagram is a flow structure visualization method, which represents the circulation of factors from one node in a network to another. The beginning and end of a rectangle in the diagram correspond to network nodes, and the length of the rectangle corresponds to the attribute value. The widths of each branch normally correspond to the value of the flow quantity. However, in this study, the widths reflect the number of countries in different groups, and the number of countries that transfer from the BRI trade group to the world trade group.

3 A comparative analysis of the BRI and global trade networks

3.1 The emerging BRI trade network and trade groups

As Figure 1 shows, in 2016 a tight trade network had already been established between China and countries along the Belt and Road. China accounts for the largest trade flows. More specifically, China is the largest trade partner of 30 countries in BRI trade network, including Russia, India, Malaysia, Singapore, Indonesia, Turkey, and Saudi Arabia. China is the second largest trade partner of eleven countries, such as Kazakhstan, Qatar, Ukraine, and United Arab Emirates (UAE). And China is also the third largest trade partner for seven countries, including the Republic of Belarus and Czech Republic.
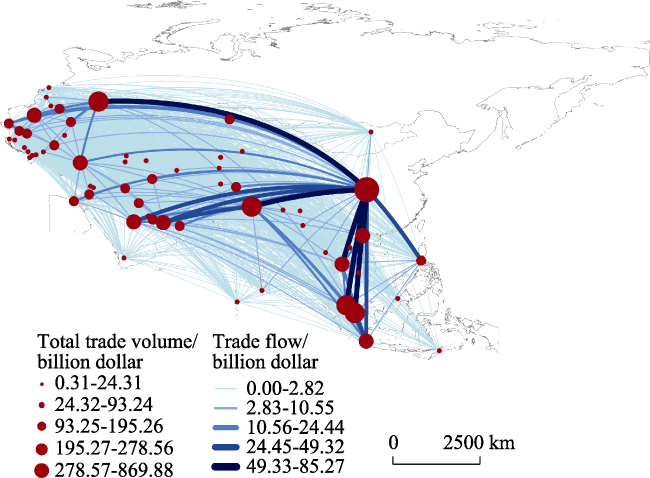
Figure 1 The trade network of countries along the Belt and Road, 2016 (calculated by the author)
The community detection method (algorithm optimization module) identifies three main trade groups and two second-level trade groups in the trade network between countries along BRI (Figure 2). As a result of the spatial interaction between globalization and regionalization, the BRI trade network itself reveals a division into groups that reveal relatively strong geographical proximity effects. To some extent Central-Eastern Europe had to some extent established its own system.
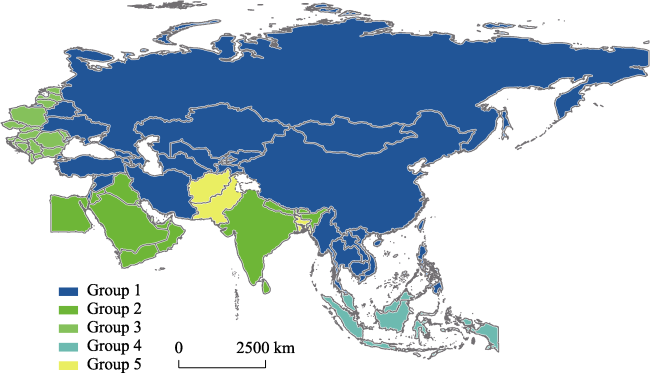
Figure 2 The trade group divisions for countries along the Belt and Road, 2016 (calculated by the author)
Of the three main groups, the Asia-Europe Group (Figure 3a) was the largest and included 24 countries along the Belt and Road. China was the core node in terms of both trade volume and trade relationships. The second most-important node was Russia, followed by the Republic of Belarus, Turkey, Kazakhstan, and Ukraine. The second main group was the South Asia-West Asia Group (Figure 3b). It comprised 16 countries. As the trade flows show, the important nodes were India, United Arab Emirates, and Saudi Arabia, followed by Qatar, Oman, and Egypt. Most countries in this group are resource export countries, especially the Middle East countries, whose economic development is heavily dependent on petroleum and gas. As a result, the commodity structure of trade of these countries displays a low degree of diversity. The third main group, with 17 countries (Figure 3c), is the Central-Eastern Europe Group. Its trade nodes are less clear than those of the other two main groups. Countries including Czech Republic, Poland, Slovakia, Hungary, and Romania have relatively large trade volumes, and are relatively important trade nodes in the group.
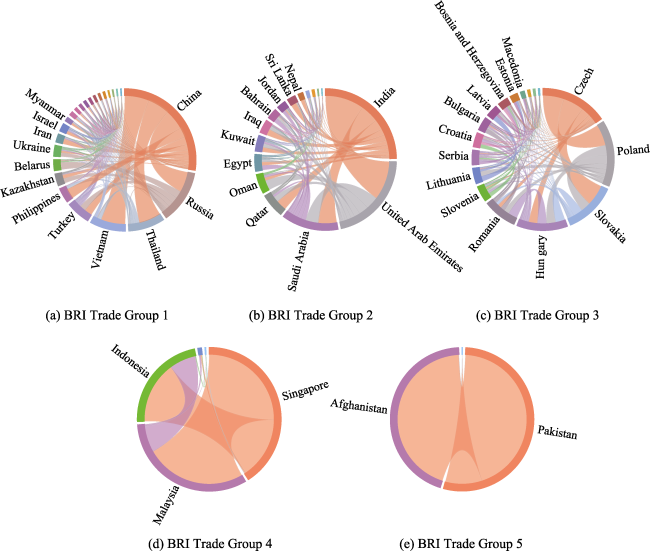
Figure 3 The internal trade networks within the trade groups along the Belt and Road, 2016 (Data source: International Trade Centre database)
Southeast Asia and South Asia formed two second-level trade groups. The former, with five countries, had closer internal trade relationships. As Figure 3d shows, Singapore, Malaysia, and Indonesia had higher trade volumes and were important trade nodes. The South Asia group comprised just three countries, shown in Figure 3e. The biggest trade partner for Pakistan was China, while that of Afghanistan was Pakistan.

3.2 The global trade network and trade groups

As Figure 4 shows, the global trade network had three main characteristics. First, trade relationships between the big trading nations were extremely strong. For instance, the trade volumes between China and the USA, Japan, South Korea, and Germany, and between the USA and Japan, Canada, and South Korea all exceeded 100 billion USD. In 2016 the total volume of trade between China and the USA alone reached 521 billion USD, 1.63% of the global trade volume. Second, trading nations have relatively strong trade relationships with nations located in geographically close proximity. For example, the trade volumes of the USA with Mexico and Canada, as well as of China with Japan, South Korea, and Australia were all greater than 100 billion USD. Third, in the global trade network there were three agglomeration regions with high trade values, the North American, Asian and European regions. The largest nodes in North America were the USA, Canada and Mexico, with trade values of 3.7 trillion USD, 791.9 billion USD, and 760.9 billion USD, respectively. The biggest node in Asia was China, with a trade volume of 3.69 trillion USD, followed by Japan and Hong Kong, which also had trade volumes in excess of 1 trillion USD. There was no prominent trade node in Europe. Instead, countries such as Germany, France, Britain, Netherlands, Italy, Belgium and Switzerland all had relatively high trade volumes of over 500 billion USD.
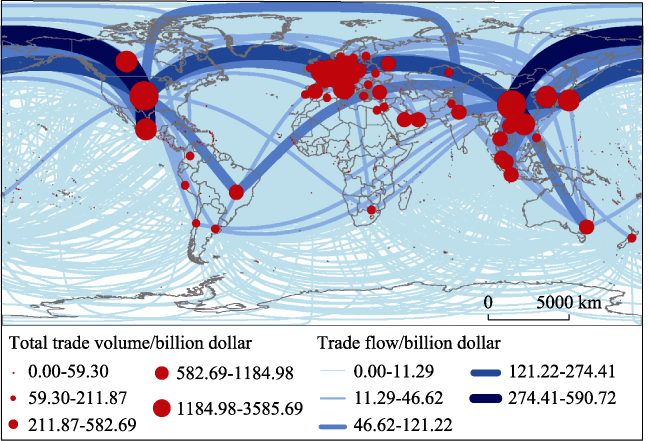
Figure 4 The network of world trade relationships, 2016 (calculated by the author)
To further analyse the topological structure of the global trade network, five groups were identified using the community detection method (algorithm optimization module). These groups are mapped in Figure 5. As a result of combination of globalization and regionalization, the five trade groups reveal a degree of overall spatial continuity, although some regions, such as North Africa and the Middle East, are characterised by spatial divisions and discontinuities. As already mentioned, most countries in North Africa and the Middle East are resource-rich. These countries have relatively strong trade relationships with their main export destination countries, but relatively weak relationships with adjacent countries. For this reason, the groups that contain these countries reveal great diversity.
Figure 5 The trade group division of the global trade network, 2016 (calculated by the author)
The biggest trade group containing 74 countries and regions was the Asia-Australia-South Africa Group, shown in Figure 6a. China is regarded as the single core in the group’s network structure, from both the perspective of trade volume and trade relationships/flows. The subdominant nodes were Japan, Hong Kong and South Korea, whose trade volumes were all over 0.9 trillion USD in 2016. Other countries, such as Singapore, Malaysia, Thailand, Australia, Vietnam, and Indonesia, also played vital roles in terms of trade volume, and were relatively important trade nodes.
The second group was the American Group, shown in Figure 6b, consisting of 48 countries and regions, with the USA as the single core in the group’s network structure, from both the perspective of trade volume and trade relationships. Canada and Mexico had relatively large trade volumes, but they had weak relationships with other countries in the trade group, as their trade was generally with the USA, and they both had a relatively small trade volume with other countries in the group. Brazil, Argentina, Columbia, and Chile were third level nodes in this trade group.
The third group was the Europe-Asia Group, shown in Figure 6c, including 26 countries and regions. Russia was the single core of the group and was distinct in both trade volume and trade relationships, followed by Turkey, the Republic of Belarus, Ukraine and Kazakhstan. Countries such as Greece, Lithuania, Egypt, Latvia, Bulgaria, Estonia, Azerbaijan and Georgia, also had relatively large trade volumes, and were relatively important trade nodes in the group.
Figure 6 The internal network structures of five world trade group, 2016 (data source: International Trade Centre database)
The fourth group was the Europe Group, shown in Figure 6d, which is a multi-core group. There were 46 countries and regions in this group, with Germany as the core node and France, Britain, Netherlands, Italy and Belgium as the second most-important core nodes. In addition, Spain, Switzerland, Austria and Czech Republic had relatively large trade volumes. Compared with other groups, trade network centralization was relatively low and the network topological relationships were relatively complicated.
The fifth group was the Asia-Africa Group, shown in Figure 6e, with 38 countries and regions. There were two cores in the trade network, namely India and United Arab Emirates. The second important node was Saudi Arabia, and other node countries in this group with relatively large trade volumes were Oman, Iraq, Nigeria, Bahrain and Tanzania.

4 Topological relationships between the BRI and the global trade networks

4.1 Differences between BRI trade groups in the context of global trade network

There were five core nodes in global trade network as described previously. Of these nodes two were outside the BRI regions as of 2016: the USA centred core node and European developed countries centred core nodes. Three core nodes were within the BRI regions, the China centred, Russia centred, and India-United Arab Emirates centred core nodes. These nodes were named as BRI inner code nodes. Within the global trade network, the countries in the BRI trade network were attracted to different core global nodes, and the BRI trade groups were characterized by coexisting integration and segmentation (Figure 7).
Figure 7 Differences between BRI groups in the context of the global trade network, 2016 (BRI Group in the figure is short for BRI Trade Group, while world group is short for World Trade Group)
In terms of BRI trade network, 24 countries belonged to BRI Trade Group 1, with China as the first and Russia as the second core. Countries were separated from their constituent BRI trade group in the context of the global trade network. Some countries in the Middle East, Central Asia and Southeast Asia group, i.e., Iran, Turkmenistan, Cambodia, Laos, Myanmar, Thailand, and Vietnam, were attached to World Trade Group 1 (the China centred trade group). In contrast, countries such as Ukraine, the Republic of Belarus, Kazakhstan, Kyrgyzstan and Uzbekistan, were attached to the World Trade Group 3 (Russia centred trade group). In addition, a minority of countries, such as Palestine and Israel, were attached to the World Trade Group 2 (the USA centred world group). As Figure 7a shows, the majority of BRI Trade Group 1 countries with China as the leading and Russia as the second core, were attached to inner-BRI core nodes even in the global trade network.
Countries in BRI Trade Group 2, with India-United Arab Emirates as its core, saw relatively small changes in their constituent groups in the context of global trade network. The majority of these countries, including Oman, Bahrain, Nepal, Saudi Arabia and Sri Lanka, were part of the group centred on the same core areas, namely the India-United Arab Emirates centred World Trade Group 5. A number of countries, such as Qatar and Kuwait, were a part of World Trade Group 1 centred on China; and some others, such as Egypt and Lebanon, were parts of World Trade Group 4 centred on developed European countries.
BRI Trade Group 3, composed of European countries, was split up in the context of the global trade network. The majority of the countries in this BRI group were parts of World Trade Group 4 (the developed European countries centred group), including the Republic of Montenegro, Czech Republic, Bosnia and Herzegovina, Hungary, Albania, Macedonia, Serbia, Croatia, Slovenia, Romania, Slovakia, and Poland. In contrast, the other countries were parts of the Russia centred World Trade Group 3. These countries included Estonia, Bulgaria, Latvia, Lithuania, and Moldova. As is clear, a number of countries in BRI Trade Group 3 (centred on Czech Republic and Poland) were grouped in 2016 with countries outside of the BRI regions such as Germany, France and Britain (World Trade Group 4).
Most countries in the two second-level BRI Trade Groups, BRI Trade Group 4 and BRI Trade Group 5, were parts of the China centred World Trade Group 1. These countries included resource-rich countries such as Afghanistan, Pakistan, and Bangladesh, and Southeast Asian countries such as East Timor, Malaysia, Brunei, Singapore, and Indonesia. In other words, Middle Eastern and Southeast Asian countries grouped with a set of countries whose core areas were Pakistan and Singapore in the BRI trade network were attached to the China centred network at a global scale.
In summary, the analysis of topological trade relationships between 65 countries along BRI in 2016 indicates that some BRI countries were part of extra-BRI core trade areas at the level of the global trade network but that at the same level most remained part of intra-BRI core areas. In the global trade network, 14 BRI countries were attached to extra-BRI centred groups (the USA centred core node and European developed countries centred core node), 12 had relatively strong trade relationships with Europe, and the other two with American countries. In comparison, 51 BRI countries along BRI were still attached to intra-BRI core trade areas, 20 to China, 19 to Russia, and the other 12 to India-United Arab Emirates.

4.2 Analysis of the topological relationships among BRI countries

In order to further examine the topological relationships between the BRI and the global trade networks, for 65 countries along BRI the share of their trade volume with BRI countries was computed as a share of their world trade volume (hereafter BRI percentage).
BRI percentage = TBRI I / Twi (2)
where TBRIi represents the trade volume between country I and the other 64 BRI countries, and Twi represents the trade volume between country I and all countries in the world.
The results indicate that the 65 countries along BRI could be divided into four types within different BRI relationship intensities (Figure 8). The first type comprised countries with BRI percentages< 40%. These countries are geographically distributed across Europe, the Middle East and Southeast Asia. They are parts of the BRI, but their main trading partners were outside the BRI regions. For example, although countries such as the former Yugoslav Republic of Macedonia, Slovenia, Romania, Czech Republic, Hungary, Albania and Poland are along the BRI, they were attached to extra-BRI trade cores in the global trade network and had weak trade relationships with countries along the BRI. These countries’ low BRI percentage could be further improved with more trade cooperation. The second type, with BRI percentages in the 40%-60% range, mainly comprised countries located in Europe, South Asia and Southeast Asia. These countries had balanced trade relationships with trade partners both inside and outside the BRI regions, and have potential to further strengthen their trade relationships with countries along BRI. Among them, Indonesia, Malaysia, Singapore, Thailand, Cambodia, Bangladesh, Qatar and Vietnam had relatively strong trade relationships with China; Jordan and Sri Lanka had relatively strong relationships with India-United Arab Emirates; and Latvia, Lithuania, Kazakhstan, Egypt, Bulgaria, Lebanon, Turkey and Azerbaijan had relatively strong relationships with Russia. The third type, with BRI percentages between 60% and 80%, included countries mainly located in the Middle East and Central Asia, such as Iran, Pakistan, Maldives, Oman, Bahrain, Yemen, Iraq, Kyrgyzstan, the Republic of Belarus, Uzbekistan, Moldova, Armenia, Ukraine and Georgia. They are considered medium permeability countries, with relatively strong trading intensities with countries along the BRI. The fourth type had a BRI percentage >80%. This group included Laos, Afghanistan, East Timor, Turkmenistan, Myanmar, Mongolia, Nepal, the Kingdom of Bhutan, Tajikistan and Syria. Their main trading partners were countries along the BRI, and their trade relationships with countries along the BRI are extremely strong.
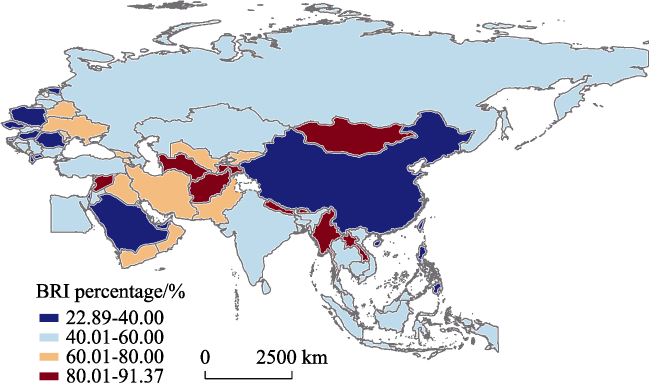
Figure 8 The intensity of relationships between countries along the Belt and Road with the BRI, 2016 (Data source: International Trade Centre database)
Analysis based on both the community detection method and BRI percentage index calculation shows that the three BRI trade groups are also important groups at a global scale (the China centred World Trade Group 1, Russia centred World Trade Group 3, and India-United Arab Emirates centred World Trade Group 5) and that a large share of the overall trade of the BRI countries is with the BRI bloc. The BRI percentages recorded in Table 1 show that 80% of the countries with China as their trade core, 83.3% with India-United Arab Emirates as their trade core, and 94.7% of the countries with Russia as their trade core had scores of over 40%. At the global scale, countries whose trade core was developed European countries (World Trade Group 4) had relatively poor trade relationships with countries along the BRI. Of these countries, 58.3% had a BRI percentage of no more than 40%.
Table 1 Share of total trade with the BRI countries for countries along the BRI
Country BRI
Percentage
Country BRI
Percentage
Country BRI
Percentage
China centred intensity Developed European
centred intensity
India and United Arab Emirates centred intensity (Continued)
Laos 91.37% Republic of Montenegro 66.46% Saudi Arabia 27.86%
Afghanistan 89.55% Bosnia and Herzegovina 52.08% United Arab
Emirates
22.89%
East Timor 89.31% Serbia 51.28% Russia centred Intensity
Turkmenistan 89.28% Croatia 44.49% Tajikistan 87.62%
Myanmar 82.01% Slovakia 42.88% Syria 80.49%
Mongolia 80.16% Former Yugoslav Republic of Macedonia 39.67% Kyrgyzstan 79.28%
Iran 76.22% Slovenia 38.81% Byelorussia 75.41%
Pakistan 60.36% Romania 36.76% Uzbekistan 69.11%
Indonesia 53.26% Czech Republic 35.16% Moldova 66.97%
Malaysia 52.29% Hungary 34.97% Armenia 66.71%
Singapore 49.98% Albania 33.36% Ukraine 66.47%
Thailand 49.84% Poland 33.05% Georgia 62.02%
Cambodia 48.13% India and United Arab Emirates
centred intensity
Latvia 58.26%
Bangladesh 45.57% Nepal 86.06% Lithuania 53.80%
Qatar 41.29% the Kingdom of Bhutan 83.38% Kazakhstan 52.67%
Vietnam 40.19% Maldives 76.46% Egypt 47.34%
The Philippines 39.50% Oman 66.21% Bulgaria 45.53%
Brunei 39.25% Bahrain 64.27% Lebanon 45.15%
China 28.98% Yemen 62.63% Turkey 44.00%
Kuwait 25.15% Iraq 61.88% Azerbaijan 43.38%
USA centred intensity Jordan 56.87% Russian Federation 41.62%
Palestine 85.40% Sri Lanka 55.07% Estonia 39.50%
Israel 23.37% India 47.90%

* The BRI percentage refers to the total volume of trade of a country with all countries along the BRI divided by the total volume of trade of a country with all countries in the world

5 Conclusions

The BRI is not only China’s new action to drive its open and global development, but also a platform for countries to explore free and inclusive trade. While ‘free and inclusive trade’ is one of the issues over which a consensus was reached at the Leaders’ Roundtable of the Belt and Road Forum for International Cooperation, held on May 15, 2017. This study examined the spatio-temporal patterns and topological structures of the emerging BRI trade network, and compared them with those of the global trade network in 2016, using a community detection method, visualization methods and statistical analysis. By examining the characteristics of the BRI trade network and their relationship to the global trade network, the aim was to help find a better way to further promote free and inclusive trade along BRI.
The main findings were as follows: (1) In 2016 three trade groups and two subgroups could be identified in the trade network among BRI countries. The three main groups were: the Asia-Europe Group with China as the core, and Russia as the second node; the South Asia-West Asia Group with India, United Arab Emirates and Saudi Arabia as cores; and the Central-Eastern Europe Group with a multi core structure. (2) In the case of the global trade network five trade groups were identified, namely: the Asia-Australia-South Africa Group; America Group; Europe-Asia Group; Europe Group; and Asia-Africa Group. China, the USA, Russia, Germany-Netherlands-France-Britain and other developed European countries, and India-United Arab Emirates formed the cores of these groups. Three of these cores were inside the BRI regions, namely China, Russia and India-United Arab Emirates. (3) Topological analysis results indicated that in the context of the global trade network, BRI trade groups were subject to structural changes involving integration and segmentation. In the global trade network, most BRI countries were still closely connected to the China, Russia and India-United Arab Emirates core nodes, and had relatively strong trade relationships with the BRI countries. In contrast, most Central and Eastern European countries were more closely connected with developed European countries’ core nodes, and had relatively weak trade relationships with the BRI countries. In addition, some Southeast Asian countries had low BRI percentages, although they were still parts of the Asia-Australia-South Africa Group (World Trade Group1), with China as the trade core. (4) Although China, Russia and India-United Arab Emirates are core nodes of the BRI trade groups, they play important roles in the global trade network, where they are also the core nodes of world trade groups. Moreover, their BRI percentages are relatively low, as the trade relationships between big trading nations are extremely strong. In other words, the total trade volumes of these four countries with big trading nations outside the BRI, such as the USA, Japan, South Korea and Germany, are often larger than those with the countries along the Belt and Road.
To promote free and inclusive trade along the Belt and Road, different countries may focus on different trade development patterns. For example, some countries with BRI percentages < 40%, such as the former Yugoslav Republic of Macedonia, Slovenia, Romania, Czech Republic, Hungary, Albania, and Poland, which are associated mainly with extra-BRI trade cores, should further strengthen trade linkages with BRI countries. Among the second type of countries, with BRI percentages in the 40%-60% range, Indonesia, Malaysia, Singapore, Thailand, Cambodia, Bangladesh, Qatar and Vietnam could further promote their trade contacts with China, while Jordan, and Sri Lanka could strengthen their relationships with India-United Arab Emirates, and Latvia, Republic of Lithuania, Kazakhstan, Egypt, Bulgaria, Lebanon, Turkey and Azerbaijan could improve trade relationships with Russia. Third, most countries with BRI percentage in the 60%-80% range, including Iran, Pakistan, Oman, Bahrain, Yemen, Iraq, Kyrgyzstan, the Republic of Belarus and Uzbekistan, should pay more attention to improving their trade structure, which depends at present on resource exports. Fourth, countries have high BRI percentages, such as Laos, Afghanistan, East Timor, Turkmenistan, Myanmar, Mongolia, Nepal, the Kingdom of Bhutan, Tajikistan and Syria, should expand their trade partners outside the 65 BRI countries.
As for China, it should mainly focus on three types of trade partners in the future. The first type includes the core nodes in the global trade network, which are also China’s biggest trade partners, such as the USA, Russia, Germany, India and United Arab Emirates. The second type includes countries that both have close trade linkages with China and are attracted to the Asia-Australia-South Africa Group in the global trade network, such as Japan, South Korea, Thailand, Burma, Singapore and Malaysia. The third type covers some Central and Eastern European countries and Southeast Asian countries, which are BRI countries but have relatively weak trade relationships with the BRI regions, such as the Philippines, Brunei, Slovenia, the former Yugoslav Republic of Macedonia, Poland, Czech Republic, United Arab Emirates, Saudi Arabia, Israel, etc.

The authors have declared that no competing interests exist.

[1]
Blondel V, Guillaume J, Lambiotte R, 2008. Fast unfolding of communities in large networks.Journal of Statistical Mechanics Theory, 25(10): 155-168.

[2]
Carolo P, Lucia T, 2015. Are preferential agreements significant for the world trade structure? A network community analysis.Kyklos, 68(2): 220-239.type="main"> We assess the impact of preferential trade agreements (PTAs) on the structure of world trade by looking for communities in the world trade network (WTN), and allowing the presence of preferential trade patterns to emerge endogenously. The finding of significant communities (as defined in the topology of the networks) would imply that trading countries are organized in groups of preferential partners. We use different approaches to analyze communities in the WTN between 1962 and 2008, but all methods agree in finding no evidence of a significant partition, supporting the view that the existing PTAs are not strongly distorting the geography of trade patterns, at least at the aggregate level.

DOI

[3]
Chen Y F, 2011. Analysis on social network of world trade situation in 2000-2009.Journal of International Trade, (11): 31-42. (in Chinese)Through a social network analysis of the trade data in the period of 2000-2009,this paper studies the world trade web in the new century and the impact of the subprime mortgage crisis on it.A descriptive analysis shows that the world trade web was a disassortative network with a small "rich club",that though most countries established trade relationships with many partners,only a few of these connections were intense,and that as the result of the sub-prime mortgage crisis,the decline in the trade ties went before the shrinking in the trade strength.A core-periphery structure analysis reveals that the coreness of USA declined constantly and that of Japan,Germany,UK,and France ascended,especially after the crisis,and that the coreness of the BRICs reached twice as great as the level before the crisis.

[4]
Cinar M, Johnson J, Geusz K, 2016. Estimating Chinese trade relationships with the Silk Road countries. China & World Economy, 24(1): 5-103.在这份报纸,我们讨论在以前的丝绸道路区域的国家是的到程度到达或没能与中国到达他们的做贸易的潜力。我们用一个泊松伪最大值可能性的评估者估计贸易的一个严肃模型,并且用在里面样品, out-of-sample 和 counterfactual 途径估计贸易潜力。我们为道路土地与中国交换的丝绸用这三个方法比较贸易潜力。下次,我们把估计的贸易潜力比作实际贸易,并且发现大多数丝绸道路国家是在他们有中国的贸易的 underperforming。然而,对潜力的贸易性能多年以来为大多数国家改善了 1990-2013。我们的结果建议中国的以前的丝绸道路做贸易搭挡还得认识到中国的经济生长的完整的潜在的好处,但是差距可能正在变窄。

DOI

[5]
Duan W Q, Liu B Q, Ji J H, 2008. Topological structure evolution of world trade network.Systems Engineering: Theory & Practice, (10): 71-75. (in Chinese)

[6]
Fagiolo G, Reyes J, Schiavo S, 2010. The evolution of the world trade web: A weighted-network analysis.Journal of Evolutionary Economics, 20(4): 479-514.This paper employs a weighted network approach to study the empirical properties of the web of trade relationships among world countries, and its evolution over time. We show that most countries are characterized by weak trade links; yet, there exists a group of countries featuring a large number of strong relationships, thus hinting to a core-periphery structure. Also, better-connected countries tend to trade with poorly-connected ones, but are also involved in highly-interconnected trade clusters. Furthermore, rich countries display more intense trade links and are more clustered. Finally, all network properties are remarkably stable across the years and do not depend on the weighting procedure.

DOI

[7]
Gong P P, Song Z Y, Liu W D, 2015. Commodity structure of trade between China and countries in the Belt and Road Initiative area.Progress in Geography, 34(5): 571-580. (in Chinese)Economic cooperation is one of the priority areas in the "Belt and Road Initiative" proposed by China.It is important to examine the characteristics and patterns of development of trade between China and countries in the "Belt and Road Initiative" area, for achieving "unimpeded trade" and promoting economic prosperity and regional cooperation. Under this background, this article reviews the changing trend of commodity structure of trade between China and countries in the "Belt and Road Initiative" area, and analyzes the commodity structure and pattern, based on the revealed comparative advantage index(RCA), sensitive industry identification method,and k-medium value clustering. The results show that the commodity structure of China's export to these countries has improved, while import has been more centralized with increasing share of energy. Second, the main products that China exports to these countries are mechanical equipment and textiles and garments, while the main products that China imports are mostly energy, textiles and garments, and mechanical equipment. Third,sensitive industries involved in China's exports include clothing and shoes, nonmetallic minerals, transportation equipment and so on, and those involved in China's imports are mainly ores, energy, and some primary processed products. Fourth, at the provincial level, eastern, central, and some western provinces that do not share border with other countries, are mainly connected to Southeast Asia, West Asia, and Middle East, while western and northern border provinces are mainly dependent on trade with neighboring countries in the area, and have more ties with Central Asia, South Asia, and Mongolia-Russia. Most eastern provinces, central provinces, and several fast-growing western provinces are mainly exporting mechanical equipment, while most northwestern provinces are mainly exporting clothing. On the other hand, energy is the main product imported to Qinghai, Xinjiang, Liaoning, Heilongjiang, and other eastern provinces, while ores and metal products are main imported to most western provinces.

[8]
Hakanson L, Dow D, 2012. Markets and networks in international trade: On the role of distances in globalization.Management International Review, 52(6): 761-789.AbstractThe enduring importance of geographic distance as an impediment to international trade has recently become recognized as an empirical fact in need of explanation. According to one line of argument—the ‘network view’—the continuing high sensitivity of international trade to geographical distance is associated with a shift in the composition of trade towards goods requiring more extensive information exchange and personal interaction between buyers and sellers. An alternative explanation—‘the market view’—contends that improved availability of information and increasing transparency of markets have facilitated the matching of geographically more proximate buyers and sellers, and that the observed decline in average transportation distances is a reflection of increasingly efficient markets.This paper examines empirically the merits of these two arguments based on a longitudinal analysis of bilateral trade between 25 major trading nations for the period 1962–2008. It compares the development of the relative importance of ‘psychic distance’—a proxy for information related transaction costs—and geographic distance—a proxy for transportation costs—in three categories of goods.The results are broadly in support of the ‘market-view’, showing that the sensitivity of trade to psychic distance has declined dramatically for categories of goods. The impact of geographic distance has increased markedly for homogenous goods, whereas for more differentiated goods it has decreased mildly.

DOI

[9]
He M, Zhang N N, Huang Z Q, 2016. Analysis on competitiveness and complementarity of agricultural products tradein countries along “Belt and Road Initiative” areas.Issues in Agricultural Economy, (11): 51-60. (in Chinese)

[10]
Henderson J, Jepson N, 2018. Critical transformations and global development: Materials for a new analytical framework.Area Development and Policy, 3(1): 1-23. (in press)Abstract This paper addresses the disconnection between current analyses of global development and 21stcentury developmental realities. It argues for a reworking of the development sciences on the basis of ‘transformation analysis’, attending, in particular, to those phases in longer-term social change that it characterizes as periods of ‘critical transformation’. Taking ‘the global’ seriously as an analytical category, it argues for an innovative development science capable of application in both the ‘developing’ and ‘developed’ worlds, and thus of yielding more appropriate practical and policy guidance. The paper briefly explores the empirical utility of transformation analysis by attention to the recent development histories of Hungary and Malaysia.

DOI

[11]
Hudson R.2016. Rising powers and the drivers of uneven global development.Area Development and Policy, 1(3): 279-294.Abstract The emergence of the rising powers has been seen as heralding a fundamental shift in global economic geography. It can also be seen as the latest expression of capitalist economic development. I first consider theorizations of this development as combined, uneven and crisis-prone, with an ongoing tension between processes of differentiation and equalization. I then situate the rising powers in the context of successive patterns of global uneven development, the transformation from an Old to a New International Division of Labour and then to a ‘new’ New International Division of Labour in which the emergence of the rising powers is a major element. There are, however, significant differences among the rising powers in their economic development trajectories, in the role of the state in shaping these, and in their relationships to other economies in both global North and South. Changes at the global scale are linked to changes in the intra-national geographies of economies in the new global economic geography. I conclude with some speculative remarks as to the possible future trajectories of the rising powers and how global economic geographies might evolve in future.

DOI

[12]
Kim S, Shin E H, 2002. A longitudinal analysis of globalization and regionalization in international trade: A social network approach.Social Forces, 81(2): 445-471.Although there have been heated debates over globalization and regionalization, refined empirical research has been lacking. Defining globalization and regionalization as specific types of linkages between countries, we attempt to empirically examine the following: (1) Has the world been globalized and/or regionalized? and (2) If it has, what are the consequences of these processes? To explore these questions, we analyze longitudinal data on international commodity trade using the social network approach. Data analysis shows that the world became increasingly globalized between 1959 and 1996 in the sense that each country studied traded with more countries in 1996 than in 1959. As a result, the world trade network became denser. At the core of this process has been the development of countries in the middle strata. We also find that the structure of the world trade network became decentralized over time, a change that provides greater support for neoclassical economic theory than for world-system/dependency theory. Regarding regionalization, we find that intraregional density is greater than interregional density and that intraregional ties are stronger than interregional ones. Moreover, both intraregional and interregional density increased significantly between 1959 and 1996, indicating, first, that the flow of world trade became regionalized and, second, that globalization and regionalization are not contradictory processes.

DOI

[13]
Liu W D, 2017. Inclusive globalization: New philosophy of China’s Belt and Road Initiative.Bulletin of Chinese Academy of Sciences, 32(4): 311-339. (in Chinese)

[14]
Liu W D, Dunford M, 2016. Inclusive globalization: Unpacking China’s belt and road initiative.Area Development and Policy, 1(3): 323-340.Abstract China’s Belt and Road Initiative (BRI) is a call for an open and inclusive (mutually beneficial) model of cooperative economic, political and cultural exchange (globalization) that draws on the deep-seated meanings of the ancient Silk Roads. While it reflects China’s rise as a global power, and its industrial redeployment, increased outward investment and need to diversify energy sources and routes, the BRI involves the establishment of a framework for open cooperation and new multilateral financial instruments designed to lay the infrastructural and industrial foundations to secure and solidify China’s relations with countries along the Silk Roads and to extend the march of modernization and poverty reduction to emerging countries.

DOI

[15]
Luca D B, Lucia T, 2011. The world trade network.The World Economy, 34(8): 1417-1454.

[16]
Ma S Z, Ren W W, Wu G J, 2016. The characteristics of agricultural trade network and its impact on the division of global value chain: Based on social network analysis.Management World, (3): 60-72. (in Chinese)

[17]
Ma Y, Xu L L, 2017. The structure and influencing factors of natural gas trade network of countries along “Belt and Road Initiative” areas. World Economy Studies, (3): 109-121. (in Chinese)

[18]
Pick J B, Sarkar A, Johnson J, 2015. United States digital divide: State level analysis of spatial clustering and multivariate determinants of ICT utilization.Socio-Economic Planning Sciences, 49: 16-32.61Digital divide is analyzed for 8 technologies for the states of the U.S. in 2010.61Exploratory conceptual model is induced for digital divide of U.S. states.61Methods are mapping, cluster analysis, spatial autocorrelation, and regression.61Most important ICT correlates are social capital, education, and societal openness.61State of Georgia's development of technology exemplifies the model.

DOI

[19]
Serrano M A, Boguá M, 2003. Topology of the world trade web.Physical Review E, 68: 015101.Abstract Economy, and consequently trade, is a fundamental part of human social organization which, until now, has not been studied within the network modeling framework. Here we present the first, to the best of our knowledge, empirical characterization of the world trade web, that is, the network built upon the trade relationships between different countries in the world. This network displays the typical properties of complex networks, namely, scale-free degree distribution, the small-world property, a high clustering coefficient, and, in addition, degree-degree correlation between different vertices. All these properties make the world trade web a complex network, which is far from being well described through a classical random network description.

DOI PMID

[20]
Song Z Y, Che S Y, Zhang W, 2017. Spatial-temporal characteristics of foreign trade between China and countries along the silk roads.Bulletin of Chinese Academy of Sciences, 32(4): 365-369. (in Chinese)nimpeded trade' is one of the priorities of cooperation in the Belt and Road Initiative proposed by China. It is important to examine the spatial-temporal characteristics of foreign trade between China and Silk Road Countries(SRCs) for promoting economic prosperity and regional cooperation along Silk Roads. Based on review of the macro situation along Silk Road regions, this paper first analyzes spatial-temporal characteristics of trade cooperation between China and SRCs, and then estimates trade potential using in-sample and regression approaches. The finding of this paper are salutary. First, with the rapid growth of foreign trade between China and SRCs, the trade network along Silk Road regions are getting closer and closer; meanwhile, with the increase of China's export to SRCs and SRCs' import from China, the trade balance between China and SRCs has shifted from trade deficit to trade surplus since 2014. Second, we can identify three trade communities and two sub communities in the trade network along Silk Road regions, through community detection algorithm, in which China is the core node of the biggest trade community. As for China, Southeast Asia is the most close trade partner, followed by West Asia; while the trade volume between China and Central Asia is still small. Third, the regression results indicate that, in 2020, the most significant potential trade partners for China are some Southeast Asia countries, such as Singapore, Malaysia, Thailand, Vietnam, Indonesia, and Russia, India, Saudi Arabia and the United Arab Emirates.

[21]
Wang M C, Xu K N, 2016. The dynamic relationship between bilateral trade and China’s economic growth in countries along “Belt and Road Initiative” Areas: Based on perspective of spatial interaction.World Economy Studies, (2): 101-110. (in Chinese)

[22]
Xu H L, Sun T Y, Wu G, 2015. Status in trade networks, R&D expenditure and technology diffusion: An empirical study based on the trade data of global high-end manufacturing.China Soft Science, (9): 55-69. (in Chinese)

[23]
Zou J L, Liu W D, 2016. Trade network of China and countries along “Belt and Road Initiative” areas from 2001 to 2013.Scientia Geographica Sinica, 36(11): 1629-1636. (in Chinese)Since the proposition of"Belt and Road Initiative", researches on trade between China and countries along the Initiative area have increased. However, it is relatively rare to study trade network taking China and those countries as a whole. In this article, we utilize a social network analysis method to analyze the characteristics, trade groups as well as core-periphery structure and its evolution of this trade network. Then we analyze the structure of sub trade network of China and the Southeast Asian countries. The results show that density of the trade network established by China and countries along"Belt and Road Initiative"areas has increased, coupled with growing number of core countries. Meanwhile, China's core degree in this trade network has increased with China being the most important core country in 2013. What's more, China becomes the core country in the sub trade network of China and the Southeast Asian countries as well. Based on this analysis, we propose that during the process of promoting"Belt and Road Initiative"construction, China should rely on policy communication to reduce trade barriers and improve trade facilitation with countries along the Initiative area. In particular, it should be set as the priority to facilitate trading conditions with core countries in the Initiative area trade network for further enhancing China's core position in this network. What's more, China should make good use of the advantage of being the core position in the network, play an active role of being the area core country and promote the construction and development of"Belt and Road Initiative".

DOI

Outlines

/