Orginal Article

The structure and evolution of trade relations between countries along the Belt and Road

  • LIU Zhigao , 1, 2 ,
  • WANG Tao 1, 2 ,
  • Jung Won SONN 3* ,
  • Jung Won SONN 3
Expand
  • 1. Key Laboratory of Regional Sustainable Development Modeling, Institute of Geographic Sciences and Natural Resources Research, CAS, Beijing 100101, China
  • 2. School of Resources and Environment, University of Chinese Academy of Sciences, Beijing 100049, China
  • 3. Bartlett School of Planning, University College London, London, WC1N 3PR, United Kingdom
*Corresponding author: Chen Wei (1989-), PhD Candidate, E-mail:

Author: Liu Zhigao (1974-), PhD and Associate Professor, specialized in economic geography and regional development. E-mail:

Received date: 2018-03-01

  Accepted date: 2018-04-02

  Online published: 2018-09-25

Supported by

National Social Science Foundation of China, No.17VDL008

The Project of Bureau of International Cooperation of the Chinese Academy of Sciences, No.131A11KYSB20170014

National Natural Science Foundation of China, No.41530751, No.41471113, No.41701125

Ministry of Education of the Republic of Korea and the National Research Foundation of Korea, No.NRF-2015S1A3A2047036

Copyright

Journal of Geographical Sciences, All Rights Reserved

Abstract

Trade facilitation is one of the five main agendas of the Belt and Road Initiative (BRI). Social network analysis has helped understand the complexity of trade networks, but existing studies tend to overlook the fact that not all bilateral trade relations are equally important to a country. To fill this gap in the literature, this paper focuses on the top 2 trade relations networks to illuminate the structure and evolution of B&R trade relations, the relative positions of different countries, and changes in the composition of trade communities (e.g., the community leaders) and the changing patterns of trade between them. We find rich dynamics over time both inter- and intra-communities. The overall international trade networks of B&R countries experienced a leadership change from Russia to China on one hand, some temporary communities experienced emergence, disappearance (e.g. the Kuwait- and Thailand-led communities) or reemergence (e.g. Poland-led community), and a community membership was generally consistent on the other hand. Since the future impacts of China’s BRI will depend on the degree of integration of the connected regions, some countries with stable and high centrality indices (e.g. Russia, Singapore, Serbia, Greece, Turkey, Iran, Poland, Hungary and Romania) could be selected by China as strategic regional partners, and countries with a strategically important geographical position but weak trade links (e.g. Myanmar, Pakistan, and Belarus) should be prioritized.

Cite this article

LIU Zhigao , WANG Tao , Jung Won SONN , Jung Won SONN . The structure and evolution of trade relations between countries along the Belt and Road[J]. Journal of Geographical Sciences, 2018 , 28(9) : 1233 -1248 . DOI: 10.1007/s11442-018-1522-9

1 Introduction

The Belt and Road Initiative (‘BRI’, hereafter) proposed by Chinese President Xi Jinping in 2013 found its way into the new revised Charter of the Chinese Communist Party in October 2017, giving the BRI a firm constitutional status as part of China’s new thinking about open development. The BRI refers to the overland Silk Road Economic Belt (the Belt) and the 21st-Century Maritime Silk Road (the Road) that were announced in September and October 2013 respectively. Since then, particularly after March 2015 when the “Vision and Actions on Jointly Building the Silk Road Economic Belt and the 21st Century Maritime Silk Road” (NDRC, MFA and MC, 2015, “Vision and Actions” hereafter) were announced, the BRI has received widespread international attention (Toops, 2016; Bennett, 2016; Vinokurov and Tsukarev, 2017). Not only journalists but also academics were quick to take part in the debate. Academic journals published special issues (e.g., East Asia, 2015; China & World Economy, 2017; Geopolitics, 2017), as well as individual papers on the BRI from various perspectives (e.g., Cinar et al., 2016; Huang 2016; Liu and Dunford, 2016; Summers, 2016; Ravi, 2016; James and Chih, 2017).
Considering the increasing influence of China as a global power in a turbulent world and the positive and widespread worldwide responses to China’s BRI, the initiative is considered to be a platform for an increasing number of countries to explore new international economic governance mechanisms (Liu et al., 2018). According to the Vision and Actions and President Xi’s speeches at the Belt and Road Forum for International Cooperation, the intention of this initiative was not to re-establish the ancient networks of silk trade routes between Asia and Europe, but to use the metaphor of the ancient Silk Roads as a soft basis to create a promising platform for international cooperation (Liu, 2015; 2017a; 2017b). The ancient Silk Road is a transcontinental network of routes, connecting China to other parts of the Eurasian continent and facilitating economic, scientific, technological, religious, and cultural exchanges (Liu, 2010). Consequently, the Silk Road is an important, if not the only, symbol of a common historical and cultural heritage of most countries in Asia, Europe, and northern and eastern Africa. China’s BRI uses this historical metaphor to denote “peace and cooperation, openness and inclusiveness, mutual learning and mutual benefit,” which are referred to as the “Silk Road Spirit” in the Vision and Actions, and as a way to promote inclusive globalization (Liu and Dunford, 2016).
According to the Vision and Actions, the new initiative focuses not only on physical and economic but also on spiritual and cultural connectivity between countries along the ancient Silk Roads and beyond. Among these types of connectivity, trade facilitation and development is a priority area. President Xi's speech at the opening of the Belt and Road Forum suggests that the BRI is committed to promoting a “system of fair, equitable and transparent rules for international trade and investment” (Xinhua, 2017). Against this background, an increasing number of publications have contributed to our understanding of China’s trade with countries along the Belt and Road. Some studies analyzed geographical patterns of trade between China and Belt and Road countries, either examining trade as a whole (Zou et al., 2015; Gong et al., 2015; Song et al., 2017b), or focusing on particular sectors such as agricultural products (He et al., 2016), energy (Liu and Liang, 2015), and natural gas (Ma and Xu, 2017). Other studies have discussed the current situation, commodity structure and prospects of trade between China and particular Belt and Road areas: examples are West Asia (Han and Zou, 2014), Central Asia (Yang et al., 2015a) and Indo-China Peninsula countries (Yang et al., 2015b). Moreover, some studies used spatial econometric methods to estimate the economic effects of China’s trade with BRI countries on China’s provinces (Zou et al., 2015) or the Chinese economy as a whole (Wang and Xu, 2016; Cinar et al., 2016).
These studies have proved fruitful and shed new light on China’s trade with countries along the Belt and Road. However, they ignored explicitly or implicitly the fact that trade relationships are trilateral as well as bilateral. To better understand China’s trade with countries along the Belt and Road, a social network approach is therefore needed. From a social network analysis point of view, the trade relations between countries along the Belt and Road constitute a complex and interdependent network. International trade networks have been studied through the lens of network analysis for a long time by sociologists, economists, mathematicians, and even physicists (Breiger, 1981; Kim and Shin, 2002; Fagiolo et al., 2008; Beckfield, 2009; Kali and Reyes, 2010), and have also been used to investigate the trade relations of the BRI countries (Zou and Liu, 2016; Song et al., 2017a). These studies revealed that the BRI area trade relations possesses typical properties of complex networks, including a three-tiered structure (core, semi-periphery, and periphery), and a high clustering coefficient. However, these studies have paid insufficient attention to the varying importance of a country’s trade relations. Not all bilateral trade relations are of equal importance to a country because, in a country’s trade value, a few top partners account for a dominant share.
To fill this gap and understand the structure and evolution of the B&R trade, this research identifies the relational international trade network of the Belt and Road countries. Instead of the top 1 trade network, the top 2 trade network was used, capturing important trade relations without a great increase in complexity. The top 2 trade network refers to the network of relations for all countries’ top 2 trade partners: country i is linked to country j if j is one of the i’s top 2 trade partners. The top 2 network should capture most important international trade relations.
Using the top 2 network, the structure and evolution of the B&R trade network is examined, and the relative positions of different countries in different periods is quantified, enabling the identification of temporal changes in the composition of trade communities (e.g., the community leaders), and in the patterns of trade between different communities. This analysis of the structure and evolution of the B&R top 2 trade relations network in turn has implications for the formulation of the BRI trade facilitation and development policy.
Although the Chinese government announced that the initiative is open to all countries, 65 BRI countries including China have been identified (hereafter, the B&R countries). These nations account for more than 60% of the world’s population and about one-third of the world’s GDP. To examine the structure and evolution of the B&R trade network (Zou and Liu, 2016; Song et al., 2017a) trade data for the period from 2000 to 2016 was used. To examine the influences of the global financial crisis and the BRI on trade networks, changes in the B&R trade networks in 2000, 2004, 2008, 2013 and 2016 were identified.

2 Methodology

2.1 Data and complete international trade network of the Belt and Road countries

From a social network analysis point of view, international trade comprises a network in which the nodes are countries and connections between nodes or edges are the trade relations between those countries. Data from 2000 to 2016 from the IMF Direction of Trade Statistics (DOTS) was used. As one of the most frequently used trade databases, it provides data on the international distribution of each country’s exports and imports. Because most states report imports in CIF values (i.e. including cost, insurance and freight) and exports in FOB values (i.e. free on board), the recorded total global imports exceeds that of exports. In this study, import data was used, as states tend to monitor imports more closely than exports (Barbieri et al., 2009) so that import data is considered to be more accurate than export data (Smith and White, 1992; Kim and Shin, 2002). Matlab was used to create an undirected weighted matrix At based on bilateral import trade among the Belt and Road countries. In the
matrix, node i stands for country i and \(A_{ij}^{t}\) stands for the total trade values between country i and country j at year t.
Ucinet 6 software was used to describe some basic characteristics and the evolution of the B&R trade network from 2000 to 2010. Table 1 shows the results. First, the B&R trade network grew rapidly from 2000 to 2008, as the number of ties between countries increased from 1782 to 2168, indicating that on average the B&R countries together developed 43 new trade partners each year. The growth of trade ties resulted not only in a constant increase in network density from 0.428 to 0.521, but also in an increase in degree of centralization from 0.032 to 0.117 during the same period, suggesting that despite the increase in number of ties, international trade amongst the B&R countries tended to be increasingly concentrated between a few dominant countries.
Table 1 Descriptive statistics of the complete B&R trade network
Year 2000 2001 2002 2003 2004 2005 2006 2007 2008
Number of countries 64 64 64 64 64 64 65 65 65
Number of ties 1782 1802 1840 1840 1886 1884 2102 2130 2168
Density 0.428 0.433 0.442 0.442 0.453 0.453 0.505 0.512 0.521
Degree of centralization 0.032 0.036 0.045 0.061 0.072 0.082 0.091 0.107 0.117
Year 2009 2010 2011 2012 2013 2014 2015 2016
Number of countries 65 65 65 65 65 65 65 65
Number of ties 2164 2168 2188 2184 2216 2192 2216 2222
Density 0.520 0.521 0.526 0.525 0.533 0.527 0.533 0.534
Degree of centralization 0.116 0.112 0.117 0.112 0.120 0.125 0.122 0.126
Despite being affected by the 2008 global economic crisis, the complete trade network of the B&R countries from 2009 to 2016 developed very slowly, even becoming unstable. Fifty-eight new trade ties emerged in this seven-year period, but there was also a noticeable fluctuation in the number of ties and the density and degree of centralization during the crisis and post-crisis periods. The number of trade ties stayed relatively steady between 2164 and 2188 in the period from 2009 to 2012, suddenly increasing to 2216 in 2014, decreasing to 2192 one year later, and then increasing to 2222 in 2016, with an overall increase of 58 new trade relations. This may indicate that the B&R countries were still able to find new trade partners, despite the short period of stagnation immediately after the 2008 economic crisis. On the whole, the small increase in both the density and the degree centralization of the B&R trade network during this turbulent period implies that B&R countries might have started to recover from the economic slowdown and that some countries continued to strengthen their ties with key trade partners while shedding nonessential ties. Therefore, further focus on a country’s top trade partners might be more useful in understanding the real picture of the international trade network of the B&R countries (Zhou et al., 2016).

2.2 The top networks of the complete B&R trade network

The B&R trade network in 2016 can be used to illustrate the construction of the top networks. First, the complete B&R trade network was identified using the data from matrix At. Then the top networks were identified by keeping each country’s top trade relations. The top 1 network consists of each country’s topmost trade relationships with each other, while the top 2 network comprises each country’s top 2 trade relationships with all other countries and so on. Figure 1 visualizes the overall and top B&R trade networks. Evidently, the top 1 network contains fewer ties than the top 2 network. In other words, the top trade network includes the major trade ties from the complete network but does not include some other relations, which nonetheless provide some information about the trade relation structure. Hence, the higher the standard used, the greater the level of importance of the resultant trade network.
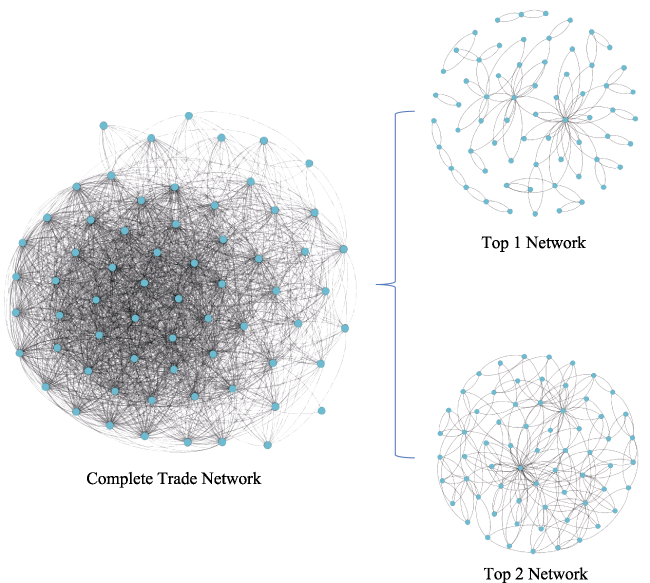
Figure 1 Complete and top B&R trade networks in 2016
Table 2 shows the trade ties and trade values of the top networks as shares of the overall B&R trade network in 2016. As Table 2 shows, the ties in the top 1 and top 2 networks accounted for only 5.4% and 10.53% of the total trade ties, respectively, but the trade values made up 56.61% and 74.03% of the total trade values, respectively. As the threshold is lowered, more trade ties and trade values are included in the corresponding networks. The shares of the top 3, top 4, and top 5 networks were approximately 15%, 20% and 25% of the total trade ties, and were about 82%, 88% and 90% of the total trade values.
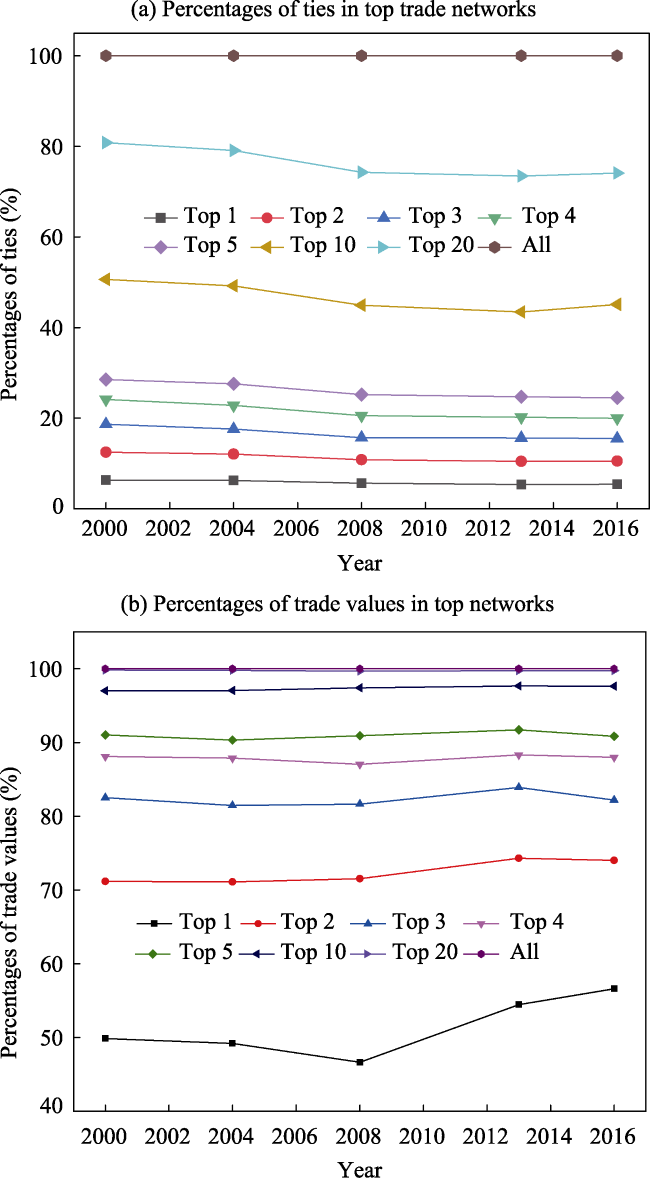
Table 2 Top networks as a share of the complete B&R trade network in 2016
Networks Top 1 Top 2 Top 3 Top 4 Top 5 Top 10 Top 20 All
Percentages of edges (%) 5.40 10.53 15.48 19.98 24.48 45.09 74.08 100.00
Percentages of trade values (%) 56.61 74.03 82.20 88.01 90.84 97.64 99.73 100.00
Figure 2 further visualizes the relationship between top trade networks and their shares of total B&R trade for every two years from 2000 to 2016. On the whole, the top 1 network alone was less than 6% of the total ties but above 50% of the trade values, except in 2008 when trade was hit due to the global economic crisis. The top 2 network alone was approximately 10% of the trade ties but above 70% of the trade values, indicating the top networks indeed constituted the backbone of the B&R trade network.
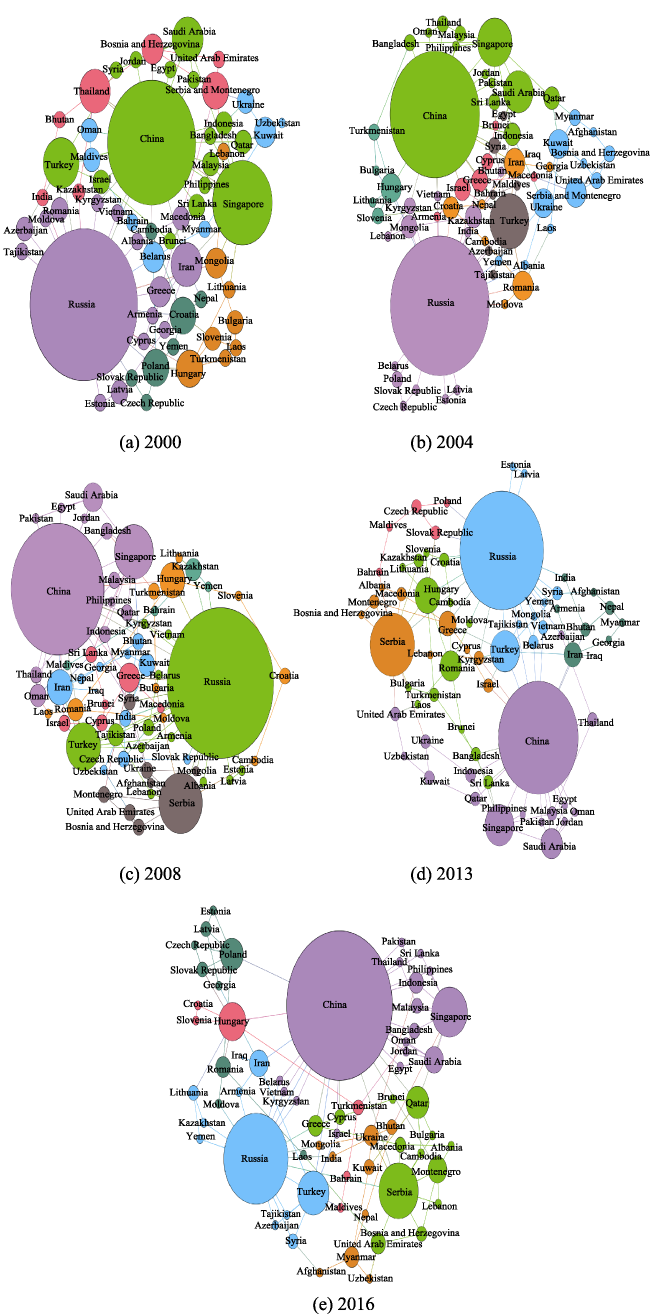
Figure 2 Visualization of the shares of the top networks in the B&R trade network in 2000, 2004, 2008, 2013 and 2016
Although the top 1 network is the foundation of all types of top networks, it does not contain much information about the trade structure. In Figure 1, the top 1 network can mislead one to believe that there are some communities of countries that actively trade with each other but are relatively disconnected from the remaining countries. Conversely, the top 2 network shows a similar structure to that of the whole network. Consequently, in the remainder of this paper, the top 2 trade network is used to investigate the network structure in 2000, 2004, 2008, 2013 and 2016.
Although the top networks were identified, some problems remain. First, it is not the exact values of the top trade relations but the top trade relations themselves that are important for each country. Another problem is that the top networks do not indicate the volume of trade which is small for small countries. However, for those small countries, the top networks still represent the most important trade links, which make those networks worth studying. Second, it is very difficult to visualize the original top networks, partly because there are tremendous differences in trade values, and partly because these trade values cannot represent the real structure. Moreover, since many trade relations are removed, comparing the values of the top relations does provide and accurate visualization of the real trade network. For this reason, binary codes were used for the top networks, i.e., 1 for all top networks and 0 for the rest. In the remainder of this paper, the Community Detection approach was used to investigate the structure and dynamics of the top trade networks, rather than the trade values of the B&R countries.

2.3 Community detection approach

Along with descriptive statistics, community detection illuminates the features of the top networks, especially their structural characteristics. There are a number of publicly available tools for exploring complex networks. Gephi, for example, is an open source platform with analytical and data visualization functions. The software runs on Windows. Gephi provides many common metrics for social network analysis (SNA) and scale-free networks, measuring the centrality, density, clustering coefficients, path lengths, community detection, etc. of graphs. Many social network analysts choose Gephi because it is extremely powerful in visualization and community detection. It allows users to interact with the representation and to manipulate the structures, shapes, and colours to reveal hidden patterns. And users can customize the colour, size and labels for readability and overall aesthetics. Moreover, Gephi uses a modularity optimization method—the fast unfolding algorithm for community detection—to decompose a gigantic network into several relatively independent modules (also called groups, clusters, or communities), which are sets of highly connected nodes (Blondel et al., 2008). For these reasons, Gephi was used to detect and visualize the community structure in the top trade networks of the B&R countries from 2000 and 2016. This study split the overall top 2 trade network into several relatively independent trade communities. Each country is densely connected internally within the communities, but there are sparser connections between communities.
There are many different methods for community identification. A widely used measure for the evaluation of community decomposition is modularity. Modularity is designed to measure the density of links inside communities as compared to the links between communities. The value of the modularity coefficient lies in the range [-1, 1]. The closer the value of the modularity coefficient is to 1, the better is the quality of the partitions. The modularity coefficient is defined as
\[Q=\frac{1}{2m}\sum\nolimits_{ij}{\left[ {{A}_{ij}}-\frac{{{k}_{i}}{{k}_{j}}}{2m} \right]}\text{ }\delta ({{c}_{i,}}\text{ }{{c}_{j}}),\ (1)\]
where ci presents the community to which node i belongs. The \(\delta \) function equals 1 if ci = cj and 0 otherwise. Aij is the edge weight between i and j. \({{k}_{i}}=\sum\nolimits_{j}{{{A}_{ij}}}\) are the sums of the weights of the edges of node i and \(m=\frac{1}{2}\sum\nolimits_{ij}{{{A}_{ij}}}\) is the total edge weight of the network.
In order to maximize the modularity value efficiently, a fast unfolding algorithm is used. This algorithm, also known as Louvain Method for community detection, is a method used to extract communities from large networks and was developed by Vincent Blondel and his colleagues from the University of Louvain. It is a simple, efficient, and easy to implement method for identifying communities in large networks and outperforms many similar greedy modularity optimization methods in both the modularity and the time categories. It is today widely used for detecting communities in large networks (Blondel et al., 2008).
This algorithm is performed in two phases, each of which is iterated. First, each node in the network is assigned to a community. So, there is only one node in each community. In this study node i was put into its neighboring community designated by node j is giving rise to a variation in modularity, \(\Delta Q.\) For each node i and the neighboring community C, the variation in modularity is defined as:
\[\Delta Q=\left[ \frac{\sum\nolimits_{in}{+2{{k}_{i,in}}}}{2m}-{{\left( \frac{\sum\nolimits_{tot}{+{{k}_{i}}}}{2m} \right)}^{2}} \right]\text{ }-\left[ \frac{\sum\nolimits_{in}{{}}}{2m}-{{\left( \frac{\sum\nolimits_{tot}{{}}}{2m} \right)}^{2}}-{{\left( \frac{{{k}_{i}}}{2m} \right)}^{2}} \right],\ (2)\]
where \(\sum\nolimits_{in}{{}}\) is the sum of the weights of the edges inside the neighbouring community C. is the sum of the weights of the edges incident to all nodes in C, ki represents the sums
of the weights of the edges of node i, ki,in is the sum of the weights of edges from node i to nodes in community C and m is the total edge weight of the network. If the variation is positive, i joins the neighboring community with maximum \(\Delta Q\). Otherwise i stays in its original community. This process is applied repeatedly and sequentially for every node until no further improvement can be achieved.
In the second phase of the algorithm, a new network was identified based on the communities (i.e. nodes) during the phase. The weights of the edges between the new nodes are given by the sum of the edges between nodes in the corresponding two communities. Edges between nodes of the same community lead to self-loops in the new network. Then the first phase of the algorithm was re-applied and iterated. When the number of the communities stopped changing, the maximum modularity of the community partition was attained.

3 Results and analysis

3.1 Countries’ positions in the top 2 network

Identifying influential nodes in dynamic processes is crucial to understanding network structure and evolution. Centrality concepts were developed in social network analysis to quantify the importance of nodes in a network. Various centrality measures have been proposed to identify the hierarchical structures of a network. In order to identify countries’ positions in the top 2 trade network of the B&R region, three classic quantitative indicators of centrality were used: degree centrality (DC), closeness centrality (CC), and betweenness centrality (BC). Each centrality measure has particular structural properties (De Benedictis, 2014).
Degree centrality records the number of connections of a node. In international trade, because degree centrality is the number of countries a particular country exports to or imports from, it can be used as the measure of a country’s influence on the entire international trade network. Closeness centrality is a measure of the geodesic distance from a node to other nodes (i.e. a measure of how topologically close a node is with respect to others) and is related to the ability to reach other nodes. In trade network, degree centrality captures how much a country is influenced by and how much it influences other countries. Betweenness centrality is a measure of the share of all of the shortest paths between each pair of nodes going through a particular node and quantifies the ability of a node to act as a bridge among other nodes (Benedictis and Tajoli, 2011). Betweenness centrality measures how much a country acts as an intermediary or gatekeeper in the trade network. Both degree centrality and closeness centrality are based on the idea that the centrality of a node in a network is related to its distance to the other nodes, while betweenness centrality is based on the idea that central nodes stand between others. Ucinet 6 software was used again to measure these centralities.
Table 3 lists the top 10 countries in terms of centralities in 2000, 2004, 2008, 2013 and 2016. According to the connectivity analysis, the following conclusions can be drawn. First, China and Russia were consistently the top 2 countries in terms of all centralities, suggesting that these two large countries are not only the biggest trading countries but also absolutely dominated the trade network of the B&R region. China grew fast and became the center of the B&R trade network in 2016, overtaking Russia. Second, Serbia and Hungary are the two key countries in the B&R trade network. Their centrality indices are high and stable, particularly after 2004. Greece also played an important role in the years 2004, 2008 and 2013, although it experienced a decline after 2013. Third, there are three pivotal countries in the Middle East: Turkey, Iran, and Saudi Arabia. Turkey has been ranked high on all centrality indices in all years. Iran, following Turkey, is the second most important country in the Middle East. The degree centrality of Saudi Arabia was also high but the country’s low closeness centrality is indicative of a weak influence on the overall trade network. Last but not least, in Southeast Asia, Singapore occupied a similar position to Saudi Arabia: high in degree centrality but low in closeness centrality and betweenness centrality.
Table 3 Top 10 countries by centrality indicatiors in 2000,2004,2013 and 2016
As Table 3 shows, there are some changes in the positions of some countries in the top 2 trade network over time. The European countries became more important after 2004. Besides Hungary and Serbia, countries as Romania, Greece, and Poland played increasingly important roles, which is connected with the shift of industry in Europe and the improvements in strategic infrastructures in these countries (such as Piraeus). The Middle Eastern countries always have a strong influence in the B&R trade. Besides Turkey, Iran, and Saudi Arabia, some countries with rich oil and natural gas resources like Qatar and Oman, also rank high in some years. While European countries are gaining importance, Central Asian and Southeast Asian countries might be losing importance. In 2000, some countries in Central Asia and Southeast Asia had high centralities, but their centralities index declined in 2004 and 2016, implying that their positions in the B&R trade remained unstable.

3.2 Structural evolution of the top 2 network

Gephi and the ForceAtlas2 algorithm was used to detect communities and visualize the structures and communities of the B&R trade network (Jacomy et al., 2014). In the visualization, the nodes indicate countries, the links represent trade relationships between two countries, countries with the same colour belong to the same community, and the size of a node is proportional to the number of trade relations of the country.
Table 4 shows the size of identified communities in the top 2 trade network of the B&R countries. While the number of communities remained stable at six or seven, the patterns and commodity composition of trade across different communities did not. First, the overall international trade networks of the B&R countries experienced a leadership change from Russia to China, owing to the economic rise of the latter. Second, some communities experienced substantial membership reorganization, especially in the cases of the Russia- and Iran-led communities. Third, temporary communities emerged and disappeared quickly. For instance, two communities, each led by Kuwait and Thailand appeared in 2000, but did not last long. A Poland-led community disappeared in 2004 but reappeared in 2016. It is worth nothing here that a community may comprise smaller sub-communities of counties. Finally, the number of trade communities declined from seven in 2000 to five in 2016, which means that the level of concentration has increased over time.
Table 4 The evolution of the size of communities in the top 2 trade network
Community No. Community leader 2000 2004 2008 2013 2016
Russia 18 14 13 10 11
China 16 13 13 17 17
Serbia 0 0 8 10 13
Hungary 8 5 10 14 6
Kuwait 8 0 0 0 0
Poland 7 0 0 0 9
Thailand 7 0 0 0 0
Serbia and Montenegro 0 11 0 0 0
Iran 0 8 11 9 0
Turkey 0 7 0 0 0
Israel 0 6 0 0 0
Greece 0 0 6 0 0
Kazakhstan 0 0 4 0 0
Czech 0 0 0 5 0
Myanmar 0 0 0 0 9
No. of communities 6 7 7 6 6
As Figure 3 shows, seven trade communities were identified in 2000, centred on Russia, China, Kuwait, Hungary, Poland, and Thailand. The Russia-led community was the largest with 18 member countries, most of which were former Soviet Union countries (Azerbaijan, Latvia, Tajikistan, Kyrgyzstan, Georgia, Armenia, Moldova, and Estonia) and the Balkan states (Greece, Romania, Macedonia, and Albania). The second largest community was the one around China and included 16 countries, most of which were South and Southeast Asian countries (Singapore, Sri Lanka, Malaysia, Indonesia, Pakistan, Bangladesh, Brunei, and the Philippines), and the Middle East (Turkey, Saudi Arabia, Qatar, Israel, Syria, Jordan, and Egypt). In this community, Singapore was the second largest after China. The Hungary and Kuwait communities both covered eight countries, while the other two communities were oriented towards Poland and Thailand, and were smaller in terms of the number of countries as both consisted of only six countries each. The Kuwait, Poland and Thailand-led communities were geographically decentered and disappeared in 2004, 2008, and 2013.
Figure 3 The visualization of the structure of the B&R trade network using Gephi in 2000, 2004, 2008, 2013 and 2016.
In 2004, although the two largest communities were still Russia and China, the numbers of member countries had both declined. The Russia-led community was very unstable with new countries from Central Europe (Poland, Czech Republic, Slovakia), Eastern Europe (Belarus, Estonia, Latvia), Central Asia (Kazakhstan, Kyrgyzstan), and other regions (Mongolia, Lebanon, India, Bhutan) joining, while some old members disappeared, including countries from the South Caucasus (Armenia, Azerbaijan, Georgia) and the Balkan Peninsula (Greece, Romania, Macedonia, and Albania). Compared to the Russia-led community, the China-led community remained relatively stable with only five old member countries (Turkey, Israel, Egypt, Pakistan, and Brunei) exiting and two members (Thailand and Oman) clustering. Four new community leaders (Serbia and Montenegro, Iran, Turkey, and Israel) emerged temporarily in 2004, but they did not appear in the subsequent visualizations, as shown in Table 4.
In 2008, the two largest communities were Russia- and China-led. Each had 11 member countries. Turkey, an independent community leader in 2004, joined the Russia-led community. Poland moved away from the Russia-led community and joined the China-centered community. The third and fourth largest communities were led by Iran and Hungary respectively, and their members increased to 11 and 10, respectively. Note that Serbia replaced Serbia and Montenegro as the community leader after Serbia and Montenegro was broken into two separate countries in 2006. Given that Serbia accounted for around 90% of the population and GDP of Serbia and Montenegro, this change in leadership was not surprising (United States Statistics Division, 2017). Some old member counties including Ukraine, United Arab Emirates, Bosnia and Herzegovina and Afghanistan still were in this community, while Kuwait, Uzbekistan, Laos and Albania left. Two temporary communities that were led by Greece and Kazakhstan emerged in 2008 but did not last until 2013.
In 2013, the China-led community became the largest one, and its membership increased to 17. Most of the old members remained (with an exception of Bangladesh and Uzbekistan), and five new members (United Arab Emirates, Ukraine, Jordan, the Philippines, Azerbaijan) joined. In contrast, the size of the Russia-led community declined in 2013 to 10, because six members in 2008 (Poland, Lebanon, Kyrgyzstan, Azerbaijan, Armenia, and Albania) left, while only three new counties (Syria, Mongolia and Yemen) joined. The Hungarian community grew to become the third largest with 14 countries. It had seven new member countries, namely, two from Eastern Europe (Romania, Moldova) and five from Asia (Bangladesh, Sri Lanka, Kazakhstan, Turkmenistan, and Brunei). Although the fourth largest community was still led by Serbia and its membership increased to 10, its members changed a lot. Compared to the year 2008, just two old members, Bosnia and Herzegovina and Montenegro, which was by now a separate country, remained. Meanwhile, seven new courtiers (Greece, Israel, Kyrgyzstan, Macedonia, Lebanon, Cyprus, and Albania) joined. The number of countries in the Iran-led community was nine which was not too different from previous years. However, due to the high turnaround of membership, only five of 2008 members (India, Bhutan, Iraq, Myanmar and Georgia) remained. A small community with five members was formed around the Czech Republic but did not make it to 2016.
The most noticeable change in 2016 was the emergence of the two new communities, led by Myanmar and Poland, each with nine members. The Myanmar-led community was geographically diffused, with all of its members other than Ukraine in Asia (Kuwait, Bhutan, Mongolia, India, Afghanistan, Nepal, and Uzbekistan). However, the Poland-led community was more geographically concentrated with five out of seven members (Czech Republic, Slovak Republic, Romania, Latvia, Estonia and Moldova) within 700 kilometers in terms of border to border distance. Laos and Georgia were the two outliers in this community. The Hungary-led community shrank from 14 members in 2013 to six in 2016. Only three original members (Turkmenistan, Slovenia, and Croatia) remained. The Serbia-led community became more visible with an increasing number of members. Only four old members (Greece, Montenegro, Cyprus, Bosnia and Herzegovina, and Albania) withdrew, while eight (Serbia, Qatar, United Arab Emirates, Macedonia, Lebanon, Cambodia, Brunei and Bulgaria) joined. The China-led and Russia-led communities continued to dominate the overall 2016 network.

4 Conclusions and policy implications

The facilitation of international trade is one of the key aims of the Belt and Road Initiative. Since the Belt and Road Initiative was proposed in 2013, an increasing number of studies have examined China’s trade with countries along the Belt and Road, examining geographical patterns, commodity structures and economic effects. However, the trade relations between countries along the Belt and Road are not only bilateral but also trilateral, while trade relations comprise a complex and interdependent network of relationships. Although network analysis has been widely used to examine these network relationships, previous studies did not pay enough attention to the different weights of a country’s trade relations. To fill this gap, top trade relational networks were examined to investigate the structure and evolution of B&R trade, paying particular attention to each country’ top partners. More specifically, top 2 trade networks were used to identify structural changes such as changes in countries’ positions, the overall patterns of trade across communities and the compositions of the communities from 2000 to 2016.
The research reached a number of conclusions that provide the basis for trade facilitation and development of policy formulation. First, not all relations in the trade network are equally important to a country, especially at a time of global economic turbulence. After the 2008 global economic crisis, although the complete trade network of B&R countries developed very slowly, both network density and the degree of centralization continued increasing. The implication is that in the post-2008 economic crisis period the trade network became more concentrated on a few dominant countries, as some countries further strengthened their ties with key trade partners, while shedding nonessential ties. In 2016 although the top 2 trade network accounted for less than 11% of the total trade ties, it was responsible for nearly 75% of the total trade values. Therefore, the identification and maintenance of the top networks is critical to overall network development. Top networks provide a useful but relatively simple tool to illuminate the network structure of international trade.
Second, a centralities-based study identified the competitive positions of countries. After 2013, China outperformed Russia in terms of the three centralities, suggesting that China had come to dominate the trade network of the B&R region. The future impacts of China’s BRI will depend on the degree of integration of the connected regions. Since the top 10 countries measured by centrality indices are either community leaders (e.g. Russia) or regional sub-centers (e.g. Singapore) or “bridges” between two communities (Romania and Hungary in 2016), China should select them as strategic regional partners. Their positions can be used in various ways to realize the potential of the BRI. Despite the decline in the relative position of Russia, China should further strengthen trade relations with it, because it has strong network influence. Besides Russia, other strategic partners are other countries with stable and high centrality indices, namely Singapore, Serbia, Greece, Turkey, Iran, Poland, Hungary and Romania, although obviously factors other than trade network relations such as geo-political and economic competition and historical relations with China should be taken into consideration.
Third, both the trade communities and their composition were highly unstable, suggesting that the trade communities compete with each other, in terms of the community leaders and their members. Although Russia remained a community leader, its community members changed and decentralized geographically. The Poland-led community experienced disappearance and re-emergence. Community leaders such as Kuwait, Thailand, Turkey, Israel, Greece, Kazakhstan, Czech Republic and Myanmar secured leadership positions in some years while losing it in others. This fluctuation might imply that they have some influence but that it is unstable, although they might be considered as regional strategic partners for China. It is also important to note that trade networks consist of geographically separated countries reflecting the complicated politico-economic systems of the B&R countries and the obstacles that have to be overcome before the construction of a more cohesive trade network can be constructed. Countries occupying a strategically important geographical position but that have weak trade links should be prioritized. Myanmar, Pakistan, and Belarus are such countries.
Table 3 Top 10 countries by centrality indicators in 2000, 2004, 2008, 2013 and 2016
2000 2004 2008
Country DC Country CC Country BC Country DC Country CC Country BC Country DC Country CC Country BC
Russia 0.35 Russia 0.50 Russia 0.47 Russia 0.35 Russia 0.52 Russia 0.45 Russia 0.38 Russia 0.57 Russia BC
China 0.29 China 0.47 China 0.31 China 0.32 China 0.52 China 0.38 China 0.33 China 0.55 China 0.50
Singapore 0.19 Singapore 0.41 Singapore 0.12 Serbia 0.14 Turkey 0.45 Turkey 0.09 Serbia 0.16 Turkey 0.47 Serbia 0.40
Turkey 0.11 Turkey 0.41 Mongolia 0.08 Singapore 0.13 Greece 0.42 Iran 0.09 Singapore 0.14 Hungary 0.44 Iran 0.13
Iran 0.10 Mongolia 0.40 Thailand 0.07 Turkey 0.11 Hungary 0.41 Ukraine 0.07 Turkey 0.13 Greece 0.44 Turkey 0.10
Saudi Arabia 0.10 Kyrgyzstan 0.39 Croatia 0.07 Iran 0.08 Singapore 0.40 Serbia &
Montenegro
0.07 Iran 0.09 Syria 0.42 Hungary 0.08
Thailand 0.10 Vietnam 0.39 Turkey 0.06 Hungary 0.08 Saudi Arabia 0.39 Hungary 0.07 Hungary 0.09 Serbia 0.41 Greece 0.07
Poland 0.08 Iran 0.37 Hungary 0.06 Saudi
Arabia
0.08 Kyrgyzstan 0.39 Greece 0.07 Saudi Arabia 0.08 Kyrgyzstan 0.41 Tajikistan 0.06
Hungary 0.08 Thailand 0.37 Belarus 0.05 Greece 0.08 Iran 0.39 Saudi Arabia 0.07 Greece 0.08 Vietnam 0.41 Singapore 0.05
Croatia 0.08 Croatia 0.37 Iran 0.05 Oman 0.08 Romania 0.39 Qatar 0.06 Oman 0.06 Tajikistan 0.41 Kuwait 0.05
2013 2016
Country DC Country CC Country BC Country DC Country CC Country BC
Russia 0.34 Russia 0.55 Russia 0.49 China 0.41 China 0.59 China 0.60
China 0.33 China 0.52 China 0.40 Russia 0.25 Russia 0.50 Russia 0.24
Serbia 0.19 Turkey 0.46 Serbia 0.22 Serbia 0.16 Serbia 0.46 Serbia 0.16
Turkey 0.13 Serbia 0.44 Turkey 0.10 Singapore 0.14 Turkey 0.44 Hungary 0.13
Singapore 0.13 Hungary 0.43 Iran 0.08 Turkey 0.13 Singapore 0.42 Poland 0.11
Hungary 0.11 Kyrgyzstan 0.42 Hungary 0.08 Hungary 0.11 Hungary 0.42 Turkey 0.08
Saudi Arabia 0.09 Vietnam 0.41 Romania 0.06 Qatar 0.09 Qatar 0.41 Qatar 0.07
Romania 0.09 Belarus 0.41 Greece 0.05 Poland 0.09 Greece 0.41 Iran 0.07
Iran 0.08 Greece 0.40 Bhutan 0.04 Iran 0.08 Poland 0.41 Singapore 0.06
Greece 0.08 Kazakhstan 0.39 Syria 0.03 Saudi
Arabia
0.08 Iran 0.41 United Arab
Emirates
0.04

The authors have declared that no competing interests exist.

[1]
Barbieri K, Keshk O M, Pollins B M, 2009. Trading data evaluating our assumptions and coding rules.Conflict Management and Peace Science, 26(5): 471-491.

[2]
Beckfield J.,2009. A new trichotomous measure of world-system position using the international trade network.International Journal of Comparative Sociology, 50(1): 5-38.

[3]
Benedictis D L, Tajoli L, 2011. The world trade network.The World Economy, 34(8): 1417-1454.

[4]
Bennett M M, 2016. The Silk Road goes north: Russia’s role within China’s Belt and Road Initiative.Area Development and Policy, 1(3): 341-351.

[5]
Blondel V D, Guillaume J L, Lambiotte Ret al., 2008. Fast unfolding of communities in large networks.Journal of Statistical Mechanics Theory and Experiment, (10): 1-12.

[6]
Breiger R L, 1981. Structures of economic interdependence among nations. In: Blau P, Merton R. Continuities in Structural Inquiry. Beverly Hills, CA: Sage, 353-380.

[7]
China and World Economy, 2017. Special Issue: Eurasian perspectives on China’s Belt & Road Initiative.China and World Economy, 25(5): 1-138.

[8]
Cinar E M, Johnson J, Geusz K, 2016. Estimating Chinese trade relationships with the Silk Road countries.China and World Economy, 24(1): 85-103.在这份报纸,我们讨论在以前的丝绸道路区域的国家是的到程度到达或没能与中国到达他们的做贸易的潜力。我们用一个泊松伪最大值可能性的评估者估计贸易的一个严肃模型,并且用在里面样品, out-of-sample 和 counterfactual 途径估计贸易潜力。我们为道路土地与中国交换的丝绸用这三个方法比较贸易潜力。下次,我们把估计的贸易潜力比作实际贸易,并且发现大多数丝绸道路国家是在他们有中国的贸易的 underperforming。然而,对潜力的贸易性能多年以来为大多数国家改善了 1990-2013。我们的结果建议中国的以前的丝绸道路做贸易搭挡还得认识到中国的经济生长的完整的潜在的好处,但是差距可能正在变窄。

DOI

[9]
De Benedictis L, Nenci S, Santoni Get al., 2014. Network analysis of world trade using the BACI-CEPII Dataset.Global Economy Journal, 14(3/4): 287-343.In this paper we explore the BACI-CEPII database using Network Analysis. Starting from the visualization of the World Trade Network, we then define and describe the topology of the network, both in its binary version and in its weighted version, calculating and discussing some of the commonly used network's statistics. We fin ally discuss some speci c topics that can be studied using Network Analysis and International Trade data, both at the aggregated and sectoral level. The analysis is done using multiple software (Stata, R, and Pajek). The scripts to replicate part of the analysis are included in the appendix, and can be used as an handson tutorial. Moreover,the World Trade Network local and global centrality measures, for the unweighted and the weighted version of the Network, calculated using the bilateral aggregate trade data for each country (178 in total) and each year (from 1995 to 2010,) can be downloaded from the CEPII webpage.

DOI

[10]
East Asia, 2015. Special Issue: New Silk Road Project.East Asia, 32(1/2): 1-221.Coinciding with the rise of Chinese economy, China’s foreign policy has become more assertive than ever. As part of the “Chinese Dream” promise, her new projects, the “New Maritime Silk Road” and the

DOI

[11]
Fagiolo G, Reyes J A, Schiavo S, 2008. On the topological properties of the World Trade Web: A weighted network analysis.Physica A, 387(15): 3868-3873.This paper studies the topological properties of the World Trade Web (WTW) and its evolution over time by employing a weighted-network analysis. We show that the WTW, viewed as a weighted network, displays statistical features that are very different from those obtained by using a traditional binary-network approach. In particular, we find that: (i) the majority of existing links are associated to weak trade relationships; (ii) the weighted WTW is only weakly disassortative; (iii) countries holding more intense trade relationships are more clustered.

DOI

[12]
Geopolitics, 2017. Special section: The geopolitics of China’s Maritime Silk Road Initiative.Geopolitics, 22(2): 223-473.

[13]
Gong P P, Song Z Y, Liu W D, 2015. Commodity structure of trade between China and countries in the Belt and Road Initiative area.Progress in Geography, 34(5): 571-580. (in Chinese)Economic cooperation is one of the priority areas in the "Belt and Road Initiative" proposed by China.It is important to examine the characteristics and patterns of development of trade between China and countries in the "Belt and Road Initiative" area, for achieving "unimpeded trade" and promoting economic prosperity and regional cooperation. Under this background, this article reviews the changing trend of commodity structure of trade between China and countries in the "Belt and Road Initiative" area, and analyzes the commodity structure and pattern, based on the revealed comparative advantage index(RCA), sensitive industry identification method,and k-medium value clustering. The results show that the commodity structure of China's export to these countries has improved, while import has been more centralized with increasing share of energy. Second, the main products that China exports to these countries are mechanical equipment and textiles and garments, while the main products that China imports are mostly energy, textiles and garments, and mechanical equipment. Third,sensitive industries involved in China's exports include clothing and shoes, nonmetallic minerals, transportation equipment and so on, and those involved in China's imports are mainly ores, energy, and some primary processed products. Fourth, at the provincial level, eastern, central, and some western provinces that do not share border with other countries, are mainly connected to Southeast Asia, West Asia, and Middle East, while western and northern border provinces are mainly dependent on trade with neighboring countries in the area, and have more ties with Central Asia, South Asia, and Mongolia-Russia. Most eastern provinces, central provinces, and several fast-growing western provinces are mainly exporting mechanical equipment, while most northwestern provinces are mainly exporting clothing. On the other hand, energy is the main product imported to Qinghai, Xinjiang, Liaoning, Heilongjiang, and other eastern provinces, while ores and metal products are main imported to most western provinces.

[14]
Han Y H, Zou J H, 2014. The current situation and prospect of trade cooperation between China and Western Asian countries under the background of BRI.Intertrade, (8): 21-28. (in Chinese)

[15]
He M, Zhang N N, Huang Z Q, 2016. Analysis on competitiveness and complementarity of agricultural products trade in countries along “Belt and Road Initiative” areas.Issues in Agricultural Economy, (11): 51-60. (in Chinese)

[16]
Huang Y P, 2016. Understudying China’s Belt & Road Initiative: Motivation, framework and assessment.China Economic Review, 40(c): 314-321.

[17]
Jacomy M, Venturini T, Heymann Set al., 2014. ForceAtlas2, a continuous graph layout algorithm for H&Y network visualization designed for the Gephi software.PLoS ONE, 9(6): 98679.

[18]
James D S, Chih Y W, 2017. Chinese narratives on “One Belt, One Road” in geopolitical & imperial contexts.The Professional Geographer, 69(4): 591-603.

[19]
Kali R, Reyes J A, 2010. Financial contagion on the international trade network.Economic Inquiry, 48(4): 1072-1101.We combine data on international trade linkages with a network approach to map the global trading system as an interdependent complex network. This enables us to obtain indicators of how well connected a country is into the global trading system. We use these network-based measures of connectedness to explain stock market returns during recent episodes of financial crisis. We find that a crisis is amplified if the epicenter country is better integrated into the trade network. However, target countries affected by such a shock are in turn better able to dissipate the impact if they are well integrated into the network. A network approach can help explain why the Mexican, Asian, and Russian financial crises were highly contagious, while the crises that originated in Venezuela and Argentina did not have such a virulent effect. We suggest that a network approach incorporating the cascading and diffusion of interdependent ripples when a shock hits a specific part of the global trade network provides us with an improved explanation of financial contagion. (JEL F10, F36, F40, G15)

DOI

[20]
Kim K, Shin E H, 2002. A longitudinal analysis of globalization and reigonalization in international trade: A social network approach.Social Forces, 81(2): 445-468.

[21]
Liu J Q, Liang Q, 2015. Research on energy cooperation along BRI.Energy of China, (7): 17-20. (in Chinese)

[22]
Liu W D, 2015. Scientific understanding of the Belt and Road Initiative of China and related research themes.Progress in Geography, 35(5): 538-544. (in Chinese)The Belt and Road Initiative here the "Belt" stands for the Silk Road Economic Belt and the "Road" stands for the 21 st Century Maritime Silk Road s a call of China for new modes of regional economic cooperation under the trend of development of economic globalization. It targets at promoting orderly and free flow of economic factors, efficient allocation of resources, and deep integration of markets; enabling the countries along the Belt and Road to achieve economic policy coordination and carry out broader, deeper, and more efficient economic cooperation; and jointly building an open, inclusive, and balanced regional economic cooperation architecture. Thus the Belt and Road Initiative is an alternative road to further economic globalization, but contains ideas that are different from the past, that is, the spirit of the Silk Road "peace and cooperation, openness and inclusiveness, mutual learning and win-win." Based on such an understanding, this article first analyzes the general background of the Belt and Road Initiative against economic globalization and the changing configurations of the world, and then discusses the Initiative's spatial connotation by revealing its multi-scalar and transscalar characteristics. The article points out that the Belt and Road Initiative is a national strategy, rather than a regional strategy, to coordinate all-around opening of China to the world and promote further integration of the country into the global economy. Last, the article suggests several research themes in geography that are brought about by the Belt and Road Initiative, including geopolitical studies, geography of countries of the region to explore cooperation opportunities, foreign direct investment theories advanced by the Belt and Road Initiative, and optimization of transcontinental transportation.

[23]
Liu W D, 2017a. Inclusive globalization: New philosophy of China’s Belt and Road Initiative.Bulletin of Chinese Academy of Sciences, 32(4): 311-339. (in Chinese)

[24]
Liu W D, 2017b. Inclusive Globalization: New Philosophy of China's Belt and Road Initiative. Beijing: The Commercial Press. (in Chinese)

[25]
Liu W D, Dunford M, 2016. Inclusive globalization: Unpacking China’s Belt & Road Initiative.Area Development and Policy, 1(3): 323-340.

[26]
Liu W D, Dunford M, Gao B Y, 2017. A discursive construction of the Belt and Road Initiative: From neo-liberal to inclusive globalization.Progress in Geography, 36(11): 1321-1331. (in Chinese)An international consensus is emerging around the Belt and Road Initiative(BRI) proposed by the Chinese government, with a growing number of countries seeing it as a way of jointly exploring new international economic governance mechanisms. Meanwhile, with the crisis of neo-liberalism, economic globalization has arrived at a crossroad. In particular, incessant voices speak out against globalization, making the quest for a new way of promoting global development a major challenge. In this context, more and more political elites and scholars consider that the BRI opens up a possible new globalization path, amongst which inclusive globalization warrants exploration. On the basis of a brief analysis of the course and mechanism of global economic expansion and the limitations of neo-liberal globalization, along with the putting into practice of the BRI, this paper outlines some of the core features of inclusive globalization, i.e., inclusive growth with effective and efficient government regulation; inclusive infrastructure development; inclusive development paths chosen nationally that suit national conditions; inclusive participation; and cultural inclusiveness. Although these features are not sufficient to characterize fully inclusive globalization, they do identify some directions for future research, and provide elements of a discursive construction of the BRI.

DOI

[27]
Liu X R, 2010. The Silk Road in World History. Oxford: Oxford University Press.

[28]
Ma Y, Xu L L, 2017. The structure and influencing factors of natural gas trade network of countries along “Belt and Road Initiative” areas.World Economy Studies, (3): 109-121. (in Chinese)

[29]
National Development & Reform Commission (NDRC), Ministry of Foreign Affairs (MFA) & Ministry of Commerce (MC) of China, 2015. Vision & Actions on Jointly Building Silk Road Economic Belt & 21st Century Maritime Silk Road. Beijing: Foreign Languages Press.

[30]
Ravi B, 2016. The Silk Road as a Global Brand.China Report, 52(1): 45-52.

[31]
Smith D A, White D R, 1992. Structure and dynamics of the global economy: Network analysis of international trade 1965-1980.Social Forces, 70(4): 857-893.

[32]
Song Z Y, Che S Y, Yang Y, 2017a. Topological relationship between trade network in the Belt and Road Initiative area and global trade network. Progress in Geography, 36(11): 1340-1348. (in Chinese)Unimpeded trade is one of the priorities of cooperation in the Belt and Road Initiative proposed by China. On 15 May 2017, the Joint Communique of the Leaders Roundtable of the Belt and Road Forum for International Cooperation reaffirmed the participants' shared commitment to build an open economy and ensure free and inclusive trade. The Belt and Road Initiative(BRI) is not only China's new action to drive its open and global development, but also a platform for increasingly more countries to explore free and inclusive trade. It is therefore important to examine the topological relationship between BRI trade network and global trade network,for promoting a universal, rule-based, open, nondiscriminatory, and equitable multilateral trading system. Based on a literature review, this article first analyzes community structure and trade network based on community detection algorithm, and then estimates the topological relationship of different trade communities. The findings of this article are as follows. First, we identified five trade communities in global trade network through community detection algorithm, in which China, USA, Russia, India-UAE, and Germany-the NetherlandsFrance-Britain and other European developed countries are the cores of the five trade communities, respectively.Second, we identified three trade communities and two sub-communities in the BRI trade network, in which China is the core, Russia is the sub-core of the biggest trade community, and India, UAE, and Saudi Arabia are cores of the second trade community(South Asia-West Asia). Third, the topological analysis results indicate that in the global trade network, most BRI countries are attracted by the core nodes in the BRI area, such as China,Russia, India-UAE core nodes, and have strong trade contact with BRI countries. Most Central-East European countries are mainly attracted by Germany-the Netherlands-France-Britain and other European developed countries with low penetration of BRI trade. Although some Southeast Asian countries are incorporated into the Asia-Australia-South Africa community with China as the core, they still need to strengthen trade linkages with BRI countries.

[33]
Song Z Y, Che S Y, Zhang W, 2017b. Spatial-temporal characteristics of foreign trade between China and countries along the Silk Roads.Bulletin of Chinese Academy of Sciences, 32(4): 365-369. (in Chinese)

[34]
Summers T, 2016. China’s ‘New Silk Roads’: Sub-national regions & networks of global political economy.Third World Quarterly, 37(9): 1628-1643.

[35]
Toops S, 2016. Reflections on China’s Belt and Road Initiative.Area Development and Policy, 1(3): 352-360.Abstract Since 2013, China’s leadership have been proposing a New Silk Road also called One Belt One Road to refer to the Silk Road Economic Belt (by land) and 21st Century Maritime Silk Road (by sea). This article focuses on the overland routes connecting Xinjiang in China to Kazakhstan, the Kyrgyz Republic, and Pakistan, its historical antecedents, and the role of Xinjiang as a gateway to China’s contemporary Silk Road connections.

DOI

[36]
Vinokurov E, Tsukarev T, 2018. The Belt and Road Initiative and the transit countries: An economic assessment of land transport corridors.Area Development and Policy, 3(1): 93-113.react-text: 295 A system of econometric models designed for forecasting target monetary indicators as well as conducting monetary policy scenarios analysis is presented. The econometric models integrated in the system are represented in the error correction form and are interlinked by means of monetary policy instruments variables, common exogenous variables characterizing external shocks, and monetary policy... /react-text react-text: 296 /react-text [Show full abstract]

DOI

[37]
Wang M C, Xu K N, 2016. The dynamic relationship between bilateral trade and China’s economic growth in countries along “Belt and Road Initiative” Areas: Based on perspective of spatial interaction.World Economy Studies, (2): 101-110. (in Chinese)

[38]
Xinhua, 2017.Belt and Road forum for international cooperation. Available from .

[39]
Yang L Z, Liu X J, Yu W C, 2015a. Research on the trade complementarity between China and Central Asian countries under the background of BRI.Shanghai Journal of Economics, (11): 94-103. (in Chinese)

[40]
Yang M Q, Yang L, Hu Z D, 2015b. Pattern evolution and challenges of trades between China and Indo-China Peninsula countries under the background of “One Belt and One Road”.Tropical Geography, 35(5): 655-663.The Indo-China Peninsula, bordering Southwest China, is an important hub of "One Belt and One Road" and also an important channel to the Indian Ocean. Therefore, it is in a very important strategic position. In this paper, the pattern of trade between China and Indo-China Peninsula countries from 1995 to 2013 was analyzed, and trade dependence(HM index) on each other for nearly a decade was calculated. The results showed that: the trade between China and Indo-China Peninsula countries is unbalanced; Indo-China Peninsula countries depended apparently more on the Chinese market than China depended on their markets. With the implementation of "One Belt and One Road", the trade relations between China and Indo-China Peninsula countries will face many new challenges: trade imbalance will lead to issues of domestic economic operational risk, international trade friction, suspicion, spatial imbalance of trade, etc.; individual differences in HM index will lead to differences in the position and attitude of the countries in their economic and trade cooperation with China; the foreign section of the land and sea trade channel may be blocked; and the extraterritorial powers will contend for markets with China. Actively promoting the peripheral diplomatic strategy of "amity, sincerity, mutual benefit and inclusiveness", scientifically and reasonably adjusting the trade structure, vigorously pushing the development of trade facilitation and optimizing the economy layout of the Southwest border area is the effective strategy to rise to the new challenges of the trade relations between China and Indo-China Peninsula countries.

DOI

[41]
Zhou M, Wu G, Xu H, 2016. Structure and formation of top networks in international trade, 2001-2010.Social Networks, 44(44): 9-21.We propose the construction of the international trade network based on top trade relations (i.e., countryiis linked to countryjifjisi's top trade partner). The constructed network captures most important relations in international trade. The overall network displays a tree-like hierarchical structure. It is organized around global central countries (especially the US, China, and Germany) under which there are more levels of local centers. We develop a model that uses country behavior in local triadic environment to account for the formation of such network structure. The census of triads confirms the applicability of this model.

DOI

[42]
Zou J L, Liu C L, Yin G Qet al., 2015. Spatial patterns and economic effects of China’s trade with countries along the Belt and Road.Progress in Geography, 34(5): 598-605. (in Chinese)Policy coordination, facilities connectivity, unimpeded trade, financial integration, and people-to-people bond are the focus of international cooperation of the "Belt and Road Initiative". Exports of the provinces in China to the "Belt and Road Initiative" area is the main content of the "Unimpeded trade and Financial integration," but research on trade between China and countries in the "Belt and Road Initiative" area are relatively rare,and trade interdependence remains unclear. According to the latest data from the International Trade Center, Chinese customs statistics in 2014, and Multi-regional Input-Output Table of China's 30 provinces in 2010, we analyzed the trade interdependence between China and countries of the "Belt and Road Initiative" area, and the contribution of provincial export to the GDP of each province. The results show that: trade interdependence had deepen between China and countries of the "Belt and Road Initiative" area, but the interdependence was asymmetrical; at the provincial level, the relatively high GDP contribution of exports in coastal provinces shows that these provinces are more export-dependent. Xinjiang has the highest GDP contribution of export(to Central Asia)and is thus strongly export dependent.

[43]
Zou J L, Liu W D, 2016. Trade network of China & countries along “Belt and Road Initiative” areas from 2001-2013.Scientia Geographica Sinica, 36(11): 1629-1636. (in Chinese)<p>Since the proposition of “Belt and Road Initiative”, researches on trade between China and countries along the Initiative area have increased. However, it is relatively rare to study trade network taking China and those countries as a whole. In this article, we utilize a social network analysis method to analyze the characteristics, trade groups as well as core-periphery structure and its evolution of this trade network. Then we analyze the structure of sub trade network of China and the Southeast Asian countries. The results show that density of the trade network established by China and countries along “Belt and Road Initiative” areas has increased, coupled with growing number of core countries. Meanwhile, China’s core degree in this trade network has increased with China being the most important core country in 2013. What’s more, China becomes the core country in the sub trade network of China and the Southeast Asian countries as well. Based on this analysis, we propose that during the process of promoting “Belt and Road Initiative” construction, China should rely on policy communication to reduce trade barriers and improve trade facilitation with countries along the Initiative area. In particular, it should be set as the priority to facilitate trading conditions with core countries in the Initiative area trade network for further enhancing China’s core position in this network. What’s more, China should make good use of the advantage of being the core position in the network, play an active role of being the area core country and promote the construction and development of “Belt and Road Initiative”.</p>

DOI

Outlines

/