
Journal of Geographical Sciences >
The identification of global strategic shipping pivots and their spatial patterns
Author: Wang Chengjin, PhD and Professor, specialized in economic geography, especially the port system, logistics network, and industrial geography. E-mail: wangcj@igsnrr.ac.cn
Received date: 2018-01-04
Accepted date: 2018-03-20
Online published: 2018-09-25
Supported by
The Strategic Priority Research Program of the CAS, No.XDA20010101
National Natural Science Foundation of China, No.41571113
The Key Project of the Chinese Academy of Sciences, No.ZDRW-ZS-2017-4
Copyright
In concert with developments in global trade and energy resource transportation, there has been a marked increase in reliance on overseas shipping. Unimpeded marine transportation has therefore become a key issue which influences national maritime interests including the security of trade and energy resources. A strategic shipping pivot thus performs a vital controlling function for global shipping networks. In this study strategic shipping pivots are defined and subdivided into sea hubs, channels and areas. We then develop a model to identify strategic shipping pivots on a global scale. The results show that, depending on differences in location, function, and type, the concept of strategic shipping pivot permits the identification of both spatial and structural differentiation with respect to strategic hubs, corridors, and seas. Now 44 strategic hubs have formed across the globe. These hubs have become the control centers of local shipping network organization. At the same time, seven strategic corridors containing most shipping routes and transportation capacity connect important sea areas, and permit a high-degree of control over the transport of strategic materials. The strategic seas, the Caribbean, the Mediterranean, Southeast Asia, and the Pacific provide vital import and export pathways, so that the formation of strategic shipping pivots is mainly influenced by factors such as physical geographical conditions, the spatial distribution of socio-economic activities, business organization, technical progress, geopolitical patterns and geopolitical disputes. Physical geographical conditions provide the potential foundations for strategic shipping pivots, while the spatial distribution of socio-economic activities and communications determine the strategic value of these points. Finally, business organization, technical progress, and geopolitical disputes all function to strengthen the strategic mechanisms and the mutagenicity of strategic shipping pivots.
WANG Chengjin , CHEN Peiran , CHEN Yunhao . The identification of global strategic shipping pivots and their spatial patterns[J]. Journal of Geographical Sciences, 2018 , 28(9) : 1215 -1232 . DOI: 10.1007/s11442-018-1521-x
Table 1 Indicators used to characterize global strategic shipping pivots |
| Hub type | Index | Evaluation indicator | Weight Gi | Notes |
|---|---|---|---|---|
| Strategic hub | Production capacity | Throughput | 0.30 | The production scale of port transportation |
| Organizational ability | Shipping line quantity | 0.20 | The organizational capacity of a port | |
| Liner movements | 0.16 | The vessel berthing frequency of a port | ||
| Network accessibility | Quantity of access ports | 0.12 | The accessibility of a port within the global shipping network | |
| Transportation connection scale | 0.08 | The accessibility of a port within the global shipping network | ||
| Radiation ability | Quantity of primary connections | 0.14 | The radiation and attraction ability of other ports | |
| Strategic channel | Shipping capacity | Cargo volume passing through | 0.16 | The level of the port transportation function |
| Traffic restriction | Water depth condition | 0.24 | Channel entry difficulty | |
| Location condition | Importance of connecting sea areas | 0.40 | The importance of channel accessibility | |
| Shipping substitutability | 0.20 | Substitutability of channel accessibility | ||
| Strategic sea area | Fragmentation degree | Regime quantity | 0.40 | The degree of regional regime convergence and fragmentation |
| Geographical condition | Number of islands and straits | 0.30 | The degree of advantage posed by regional physical geographical location | |
| Shipping status | Number of hub ports | 0.30 | The strategic status of a region within a shipping network |
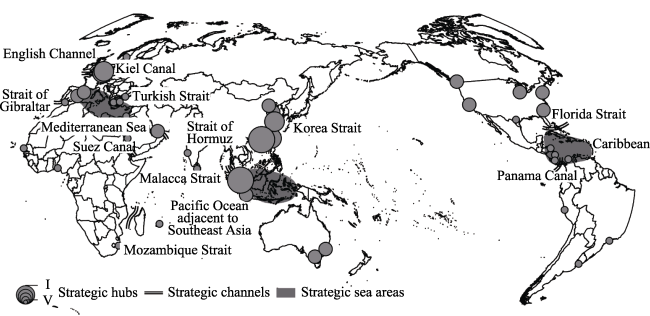
Figure 1 Spatial pattern of global strategic shipping pivots |
Table 2 The hierarchical structure of strategic shipping hubs |
| Grade | Score | Number of ports | Port name (score) |
|---|---|---|---|
| 1 | 1 ≥Hi ≥ 0.8 | 2 | Singapore (0.975), Hong Kong (0.87) |
| 2 | 0.8 >Hi ≥ 0.6 | 2 | Shanghai (0.671), Shenzhen (0.652) |
| 3 | 0.6 >Hi ≥ 0.4 | 4 | Antwerp (0.537), Busan (0.501), Kaohsiung (0.491), Rotterdam (0.473) |
| 4 | 0.4 >Hi ≥ 0.2 | 14 | New York (0.359), Qingdao (0.322), Tokyo (0.293), Charleston (0.292), Dubai (0.278), Jakarta (0.265), Valencia (0.25), Oakland (0.248), Melbourne (0.246), Chicago (0.23), Barcelona (0.228), Tianjin (0.225), Sydney (0.223), Vancouver (0.203) |
| 5 | 0.2 >Hi ≥ 0 | 21 | Santos (0.199), Jeddah (0.187), Colombo (0.183), Manzanilla (0.159), Istanbul (0.15), Oslo (0.132), Cartagena (0.124), Al Hera Heath (0.122), Callao (0.117), Piraeus (0.113), Montevideo (0.102), Louis (0.098), Limon (0.082), Durban (0.080), San Antonio (0.076), Costel (0.074), Delhi (0.072), Izmir (0.072), Lagos (0.031), Ashgabat0.019), Dakar (0.016) |
Table 3 Key indicators of strategic shipping channels |
| Strait | Water depth (m) | Width (km) | Vessel traffic (thousands of ships/year) | Oil throughput (10,000 barrels/day) | Strategic value | Connected sea areas |
|---|---|---|---|---|---|---|
| Malacca Strait | 25 | 37 | 8 | 1,520 | 0.942 | Indian Ocean, South China Sea, and Pacific Ocean |
| Strait of Hormuz | 10.5 | 56 | 4 | 1,700 | 0.840 | Persian Gulf and Arabian Sea |
| English Channel | 60 | 34 | 20 | - | 0.805 | North Sea and Baltic Sea |
| Strait of Gibraltar | 300 | 14 | 12 | - | 0.851 | Mediterranean and Atlantic |
| Strait of Mandeb | 150 | 26 | 2 | 380 | 0.743 | Red Sea, Mediterranean, and Indian Ocean |
| Suez Canal | 22.5 | 34 | 2 | 320 | 0.853 | Mediterranean Sea and Indian Ocean |
| Panama Canal | 13 | 152 | 1.5 | 87.7 | 0.838 | Pacific and Atlantic |
Table 4 Hierarchical structure of vessel types for major shipping channels |
| Ship type | Grade | Width (m) | Load (dead weight tonnage (dwt)) | Draft (m) |
|---|---|---|---|---|
| Tanker | Panamax | 32.3 | 6-7.5 | 12 |
| Aframax | 41-44 | 8-12 | 14 | |
| Suezmax | 70 | 12.5-17 | 21.3 | |
| Container ship | Panamax | 32.3 | 5 | 11 |
| post-Panamax | 42.8 | 10 | 13.5 | |
| Suezmax | 55 | 13.7 | 13.5 | |
| Bulk cargo ship | post-Suezmax | 60 | 20 | 15.7 |
| Panamax | 26 | 5-8 | 13.3 | |
| Capesize | 45 | 8-17 | 17.9 |
Table 5 Key indicators of strategic shipping seas |
| Strategic sea area | Number of regimes | Number of straits | Number of hub ports | Strategic value | Coastal countries and regions |
|---|---|---|---|---|---|
| Caribbean | 20 | 6 | 4 | 0.735 | Guatemala, Honduras, Nicaragua, Costa Rica, Panama, Columbia, Venezuela, Cuba, Haiti, Dominica, Antigua, Barbuda, Trinidad and Tobago |
| Mediterranean Sea | 17 | 9 | 7 | 0.885 | Spain, France, Monaco, Italy, Malta, Slovenia, Croatia, Bosnia, Herzegovina, Hesse Montenegro, Albania, Greece, Turkey, Cyprus, Syria, Lebanon, Israel, Palestine, Egypt, Libya, Tunisia, Algeria, Morocco |
| Pacific Ocean adjacent to Southeast Asia | 12 | 11 | 5 | 0.754 | China, Vietnam, Laos, Cambodia, Thailand, Myanmar, Malaysia, Singapore, Indonesia, Brunei, Philippines, East Timor |
The authors have declared that no competing interests exist.
| [1] |
|
| [2] |
|
| [3] |
|
| [4] |
|
| [5] |
|
| [6] |
|
| [7] |
|
| [8] |
|
| [9] |
|
| [10] |
|
| [11] |
|
| [12] |
|
| [13] |
|
| [14] |
|
| [15] |
|
| [16] |
|
| [17] |
|
| [18] |
|
| [19] |
|
| [20] |
|
| [21] |
|
| [22] |
|
| [23] |
|
| [24] |
|
| [25] |
|
| [26] |
|
| [27] |
|
| [28] |
|
| [29] |
|
| [30] |
|
| [31] |
|
| [32] |
|
| [33] |
|
| [34] |
|
| [35] |
United States Department of Defense. The Asia-Pacific Maritime Security Strategy, July 2015 [EB/OL].
|
| [36] |
|
| [37] |
|
| [38] |
|
| [39] |
|
| [40] |
|
| [41] |
|
| [42] |
|
| [43] |
|
| [44] |
|
| [45] |
|
| [46] |
|
| [47] |
|
| [48] |
|
/
| 〈 |
|
〉 |