Orginal Article

Spatiotemporal changes in agricultural land cover in Nepal over the last 100 years

  • Basanta PAUDEL , 1, 2 ,
  • ZHANG Yili , 1, 2, 3* ,
  • LI Shicheng 1, 2, 4 ,
  • LIU Linshan 1
Expand
  • 1. Key Laboratory of Land Surface Pattern and Simulation, Institute of Geographic Sciences and Natural Resources Research, CAS, Beijing 100101, China
  • 2. University of Chinese Academy of Sciences (UCAS), Beijing 100049, China
  • 3. CAS Center for Excellence in Tibetan Plateau Earth Sciences, Beijing 100101, China
  • 4. School of Public Administration, China University of Geosciences, Wuhan 430074, China
*Corresponding author: Zhang Yili, Professor, E-mail:

Author: Basanta Paudel, PhD Candidate, specialized in land use/land cover change and climate change adaptation. E-mail:

Received date: 2017-05-09

  Accepted date: 2017-07-27

  Online published: 2018-10-25

Supported by

National Natural Science Foundation of China, No.41371120

International Partnership Program of Chinese Academy of Sciences, No.131C11KYSB20160061

The Chinese Academy of Sciences - The World Academy of Sciences (CAS-TWAS) President’s Fellowship Program for PhD Study

Copyright

Journal of Geographical Sciences, All Rights Reserved

Abstract

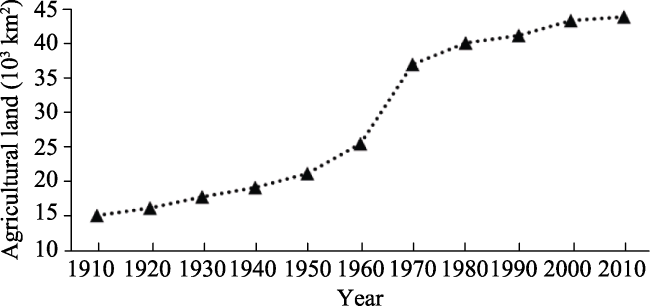
In order to advance land use and land cover change (LUCC) research in Nepal, it is essential to reconstruct both the spatiotemporal distribution of agricultural land cover as well as scenarios that can explain these changes at the national and regional levels. Because of rapid population growth, the status of agricultural land in Nepal has changed markedly over the last 100 years. Historical data is used in this study, encompassing soils, populations, climatic variables, and topography. Data were revised to a series of 30 m grid cells utilized for agricultural land suitability and allocation models and were analyzed using a suite of advanced geographical tools. Our reconstructions for the spatiotemporal distribution of agricultural land in Nepal reveal an increasing trend between 1910 and 2010 (from 151.2 × 10² km2 to 438.8 × 10² km2). This expanded rate of increase in agricultural land has varied between different eco, physiographic, and altitudinal regions of the country, significantly driven by population changes and policies over the period of this investigation. The historical dataset presented in this paper fills an existing gap in studies of agricultural land change and can be applied to other carbon cycle and climate modeling studies, as well as to impact assessments of agricultural land change in Nepal.

Cite this article

Basanta PAUDEL , ZHANG Yili , LI Shicheng , LIU Linshan . Spatiotemporal changes in agricultural land cover in Nepal over the last 100 years[J]. Journal of Geographical Sciences, 2018 , 28(10) : 1519 -1537 . DOI: 10.1007/s11442-018-1559-9

1 Introduction

Studies on land use and land cover change (LUCC) at global and regional scales have shown that large environmental and ecological changes are often due to human activities (Klein Goldewijk and Ramankutty, 2004; Foley et al., 2005; Fuchs et al., 2015; Yang et al., 2015). Marked changes in global population, high levels of industrial development, and advances in technology have all been proposed as key factors driving LUCC (Lambin et al., 2001). Research in this area and on global change generally has increased continuously over recent decades at a large number of different academic institutions and organizations (Ramankutty and Foley, 1999; Chen et al., 2015), with all available data often being brought to bear in historical reconstructions of land use change (Yang et al., 2015).
The analysis of spatially explicit data within climate and ecosystem models has proved the most effective approach for understanding LUCC (He et al., 2015). At the same time, however, numerical simulations have also been applied in this field (Pitman et al., 2011), especially in research on changing agricultural and cropland coverage (He et al., 2012; He et al., 2013; Zhang et al., 2013; Li et al., 2016; Li et al., 2017; Paudel et al., 2017). The use of map-based long-term historical analysis of agricultural land patterns has proved the most effective method to demonstrate changing trends, as such approaches are spatially explicit. To date, such methods have been successfully applied to the reconstruction of long-term LUCC (Fuchs et al., 2013), in particular changes in agricultural and cropland cover, at both temporal and spatial scales (He et al., 2015; Li et al., 2016; Paudel et al., 2017).
A number of excellent benchmark studies have been carried out in this field, generating historical spatial datasets for research in particular on cropland change at global scales (Ramankutty and Foley, 1999; Pongratz et al., 2008). A good deal of attention has been paid to historical LUCC reconstructions using high-resolution spatial data, leading, for example, to the development of the History Database of the Global Environment (HYDE) and the Sustainability and the Global Environment (SAGE) dataset (Ramankutty and Foley, 1999; Klein Goldewijk et al., 2011). The latter of these two global datasets encompasses the distribution of cropland between 1700 and 1992 at 0.5° resolution, while the former was developed, and is now available, in four versions. HYDE versions 3.1 and 3.2 are the latest iterations and incorporate several factors, including population, distance to the nearest river, slope, distribution of urban area, forest, and potential vegetation. These versions contain a series of long-term (the last 12,000 years, over the Holocene) historical datasets (Klein Goldewijk, 2017); reconstructions using these data have so far been carried out in a number of different regions, utilizing a range of different techniques and models for the reconstruction of long-term LUCC (Wei et al., 2015; Yang et al., 2015).
Global-level datasets such as SAGE and HYDE capture general trends in the long-term status of LUCC. In the context of Nepal, while a number of initial historical LUCC and agricultural land cover studies were conducted, they only encompassed small areas of the country over short time periods (Paudel et al., 2016b). Subsequently, however, two national-level LUCC datasets have been developed (Land Resources Mapping Project [LRMP], 1986; Uddin et al., 2015), incorporating advances in aerial photography and satellite systems and utilizing remote sensing and geographic information system technologies. Thus, one recent study has been carried out to determine spatiotemporal patterns of agricultural land between 1970 and 2010 and to fill in historical LUCC national data gaps (Paudel et al., 2017). Again, however, recent datasets also only consider the status of agricultural land over the last 50 years within Nepal; because other national scale datasets also only consider very specific time periods, previous work has been unable to elucidate long-term changes and trends in LUCC as well as the status of agricultural lands.
The aim of this historical study of agricultural land change was therefore to create and reconstruct long-term spatial datasets of agricultural land distributions at 30 m × 30 m resolution for Nepal over the last 100 years (between 1910 and 2010) at 10-year intervals. This study thus provides a series of much-needed historical spatial datasets for the country.

2 Study area and methods

2.1 Study area

Nepal, the study area for this research, is a land-locked country located adjacent to China and India in the central Himalayas between latitudes 26˚22′N and 30˚27′N and longitudes 80˚04′E and 88˚12′E (Figure 1a). This country comprises five physiographic regions, Tarai, Siwalik, and Hill, as well as the Middle and High Mountains, encompasses an area of 147,181 km² (LRMP, 1986), has a population of 28.5 million (2015), and had a per capita gross domestic product (GDP) of 732.3 US$ in 2015 (World Bank, 2015). Data show that the average temperature of Nepal rose by 1.8°C between 1975 and 2006, an average rate of increase of 0.06°C/year (Malla, 2009). Average annual precipitation is 1,600 mm; rainfall trends shows that 80% of precipitation occurs in the monsoonal seasons between June and September (Gautam, 2008). Nepal is an agricultural country that has 16 main soil types, including humic and chromic cambisols (Dijkshoorn and Huting, 2009).
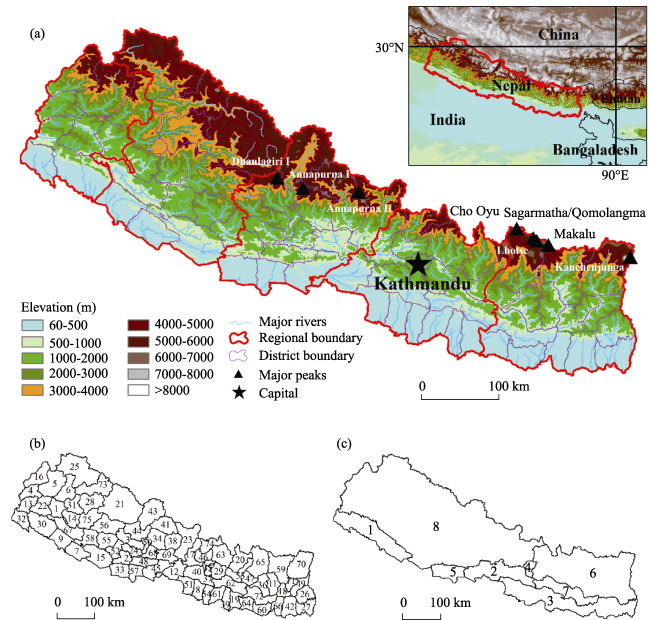
Figure 1 Map showing altitudinal (a) and administrative boundaries (this study used population data based on 75 district level for the period between 1970 and 2010) (b) as well as population data for eight regions within Nepal (c) between 1910 and 1960 (modified after Paudel et al., 2017)
Nepal encompassed a range of internal administrative regions throughout different historical periods. Thus, using historical population data, we determined eight major administrative regions within the country which were used in this study to reconstruct agricultural land changes between 1910 and 1960: 1, Far-Western Tarai; 2, Central Inner Tarai; 3, Eastern Tarai; 4, Kathmandu Valley; 5, Mid-Western Tarai; 6, Eastern Hills; 7, East Inner Tarai; and 8, Western Hills (Figure 1c). We also utilized five development regions, 14 zones, and 75 administrative-level districts for our reconstructions between 1970 and 2010 (Figure 1b) (Paudel et al., 2017).
Among the majority of the people in Nepal involved in agricultural activities, most use traditional cultivation methods. Thus, over the last century, changes in agricultural land use have tracked population expansion across the country. At the same time, both cropping systems and other trends within Nepal have varied based on geographical location and climatic conditions. In the Tarai regions of the country, for example, rice is mainly cultivated along with wheat and maize, while maize and millet are the dominant crops in the Hill region as well as planted rice, wheat, and cash crops (Chapagain, 2006). Buckwheat, barley, and potato farming are popular in the Mountain region alongside animal husbandry, while of the three ecological zones within Nepal, the Tarai region has the highest crop productivity proportion because of its favorable geographical location, fertile land, and good climatic conditions.

2.2 Reconstruction algorithm

Building on a number of previous global, national, and regional-level historical reconstructions of agricultural and cropland cover (Ramankutty and Foley, 1999; Pongratz et al., 2008; Klein Goldewijk et al., 2011; He et al., 2012; He et al., 2013; Wei et al., 2015; Li et al., 2016; Paudel et al., 2017), we collated historical literature and existing datasets for Nepal that cover the last 100 years. In this study, all actively cultivated cropland area was regarded as agricultural land, which excluded pasture and rangeland. The detailed algorithm used in this study is described in Figure 2. First, due to the absence of national datasets, we collated historical statistical data for agricultural land that covers the period between 1910 and 1960 from the HYDE 3.1 dataset. Second, we culled agricultural land spatial datasets (30 m grids) from Paudel et al. (2017) for the analysis of agricultural land status between 1970 and 2010. Third, we collected national-level agricultural land spatial datasets for 1978 (LRMP, 1986), as well as data on elevation, climate, soil types, population density, and slope. These parameters were all used for the assessment of land suitability for cultivation following modification with the established approach presented by Paudel et al. (2017). We then combined all parameters to generate an agricultural land allocation model and used this to divide land area into 30 m grids for the period between 1910 and 1960. We then generated a series of novel datasets and analyzed them in tandem with the same standard reconstructed datasets between 1970 and 2010. This approach enabled us to complete a long-term analysis of agricultural land cover in Nepal over the last 100 years.
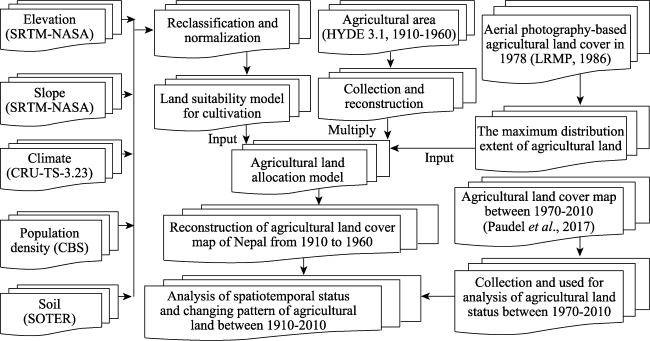
Figure 2 The algorithm used in this study for reconstructing agricultural land cover over the last 100 years (modified from Paudel et al., 2017)

2.3 Data sources

To enable the spatiotemporal reconstruction of historical agricultural land change in Nepal, we used a variety of datasets from different sectors and included information relating to land spatial and inventory data, as well as slope, elevation, soil types, population density, and climate records. This information was collated from a range of different sources; details of the datasets we used are summarized in Table 1. During the reconstruction of agricultural land cover, due to the lack of government records, we obtained statistical areas for the period between 1910 and 1960 from the HYDE 3.1 dataset (Klein Goldewijk et al., 2011), and adapted 30 m spatial resolution datasets for the period between 1970 and 2010 from Paudel et al. (2017).
Table 1 Details of the datasets used in this study
Data category Spatial coverage Temporal coverage Unit Original resolution Re-gridded
resolution
Data sources
LRMP-LULC National 1978-1979 m 240 m 30 m LRMP, 1986
Mean annual temperature Global 1901-2010 °C 0.5° 30 m CRU-TS-3.23
Mean annual precipitation Global 1901-2010 mm 0.5° 30 m CRU-TS-3.23
Population density District 1911-2011 km2 - 30 m CBS, Nepal
Elevation Global 2015 m 30 m 30 m SRTM-NASA
Slope Global 2015 ° 30 m 30 m SRTM-NASA
Soil National 2009 km 1 km 30 m SOTER
Agricultural land (HYDE 3.1) National 1910-1960 km2 - - Klein Goldewijk
et al. (2011)
Agricultural land District 1970-2010 km2 30 m 30 m Paudel et al. (2017)
Spatial data for agricultural land cover in 1978 were obtained from the LRMP, and were used to determine the maximum extent of agricultural land area. Specifically, HYDE 3.1 agricultural land datasets were obtained from Klein Goldewijk et al. (2011) and used as the basis for our reconstructions. Climate datasets from the Climatic Research Unit (CRU-TS-3.23) were used to obtain estimates for mean annual temperature and precipitation (Harris et al., 2014); we used average mean temperature and precipitation for each stage of this study. The US National Aeronautics and Space Administration (NASA) has released open-access shuttle radar topography mission (SRTM) digital elevation model data at 30 m resolution, which we used for elevations and converted to slope data. We obtained soil data from the soil and terrain (SOTER) database for Nepal (Dijkshoorn and Huting, 2009), while historical population data for this period were obtained from the Central Bureau of Statistics, Kathmandu, Nepal (CBS, 1958, 1961, 1971, 1981, 1991, 2001, 2012).

2.4 Spatially explicit allocation methods

The area of agricultural land in Nepal has expanded over the period of this investigation, leading to its present-day status. Thus, to analyze the long-term status of agricultural land over time, we used data for the period between 1970 and 2010 extracted from Paudel et al. (2017) and applied the same mature, spatially-explicit allocation method used previously by these workers to reconstruct agricultural land cover between 1910 and 1960. LRMP agricultural land cover datasets were used to determine the maximum extent of agricultural land cover between 1910 and 1960, because this is the most extensive record for Nepal prior to 1978. A Boolean agricultural extent cover map, Wagri(i), was then obtained to illustrate agricultural land area; a value of 1 was used to indicate the presence of agricultural land and a value of 0 was used to denote absence. Because the spatial extent of agricultural land in each grid is dependent on natural phenomena (Li et al., 2016), we followed the approach advocated by Paudel et al. (2017) and incorporated geographical conditions, including elevation, slope, soil type, population density, and climatic factors, to assess spatial weighting and to determine areas of land suitable for agriculture (Paudel et al., 2017).
We defined the upper limit of the extent of potential agricultural land area in each 30 m grid cell at an elevation of 4,500 m and a slope of 30° based on a previous study that evaluated Nepal and the Central Himalayas (Paudel et al., 2017; Wu et al., 2017). We then calculated the relationship between agricultural land, elevation, slope, and climate for the eight regional-levels between 1910 and 1960, kn (n = 1; 2; 3; ...; 8), based on Eqs. 1, 2, and 3, respectively, all adapted from Paudel et al. (2017). We used monthly mean climate record values (i.e., precipitation and temperature) for each stage, including mean values for 1910 for the period between 1901 and 1910, mean values for 1920 for the period between 1911 and 1920, and so on, up until 1960. Finally, we performed a population density calculation using Eq. 4 adapted from Paudel et al. (2017) to determine the suitability of land for agriculture in grid cell i across the eight regions, kn (n = 1; 2; 3;...8), between 1910 and 1960.
(1)
In this expression, E′(i) is the normalized value of the elevation for land suitable for cultivation in grid i, while E denotes the original value of grid i, Emax is the maximum elevation value of grid i, and Emin denotes the minimum elevation value of grid i.
(2)
In this expression, S′(i) refers to the normalized value of the slope of land suitable for cultivation in grid i, while S is the original slope value of grid i, Smax is the maximum slope value of grid i, and Smin is the minimum slope value of grid i.
(3)
In this expression, C'(i) refers to the normalized climate value (i.e., temperature and precipitation) for the suitability of land for agriculture in grid i, while C is the original climate value of grid i, Cmax is the maximum climate value of grid i, and Cmin is the minimum climate value of grid i.
(4)
In this expression, P′(i,t) is the normalized value of population density determining the suitability of land for agriculture in grid i in year t, while P is the original value for grid i, Pmax is the maximum population density value of grid i, and Pmin is the minimum population density value of grid i.
The dominant soil type in a region is another key factor that determines the suitability of land for cultivation. On this basis, we classified soil types into one of two groups, either having potential as agricultural land or unsuitable. We then assigned a binary value of 1 to denote potential agricultural land (Soilsuit), or 0 if unsuitable; we applied this approach across the 16 major soil categories in the SOTER database (Dijkshoorn and Huting 2009).
Thus, using the five factors described above, and the Boolean extent of agricultural land cover map Wagri(i) was determined to illustrate the area of land suitable for agriculture. The spatial weighting of agricultural land in each grid was then calculated using Eq. 5, adapted from Paudel et al. (2017), as follows:
(5)
In this expression, W(i, t) refers to the weighted area of a region allocated to agricultural land in grid i. We normalized W(i, t) for region kn to ensure that the total weighting for a particular region was equal to one; this was done using Eq. 6 adapted from Paudel et al. (2017) as follows:
(6)
We then used Eq. 7 to estimate the agricultural land area within each 30 m × 30 m grid cell. This expression was adapted from Paudel et al. (2017), as follows:
(7)
In this expression, Agri(i,t) refers to the agricultural land area of grid i in year t, while area (kn, t) is the agricultural land area of region kn in year t.
Once we had determined total agricultural land area, excess area was removed and a loop was implemented to allocate the total until all grids met the prescribed limit of 0.0009 km2. We looped this allocation process for agricultural land area for the years 1910, 1920, 1930, 1940, 1950, and 1960, while data meeting the same methodological standards were extracted from Paudel et al. (2017) to cover the years 1970, 1980, 1990, 2000, and 2010. This complete dataset enabled analysis of agricultural land change over the last 100 years in Nepal.

3 Results

3.1 Changes in agricultural land area at the national level

Reconstructions show that agricultural land area across Nepal increased from 15.12 × 10³ km2 in 1910 to 43.88 × 10³ km2 in 2010. However, while there has been an overall national trend towards increasing agricultural land area (Figure 3), this expansion has varied at different times and can be divided into three stages. There was a period of slow growth between 1910 and 1950, followed by a period of rapid growth between 1950 and 1980, and a final period of steady growth between 1980 and 2010.
Figure 3 Reconstructions of agricultural land area in Nepal between 1910 and 2010
3.1.1 Slow growth: between 1910 and 1950
The total area of agricultural land increased slightly over the first stage of this period, by 1.04 × 10³ km2, from 15.12 × 10³ km2 in 1910 to 16.16 × 10³ km2 in 1920. During the second stage of this period, between 1920 and 1930, agricultural land area increased slightly more than during the first stage, changing from 16.16 × 10³ km2 in 1920 to 17.74 × 10³ km2 in 1930. Agricultural land area increased between 1930 and 1940 by 1.43 × 103 km2, rising from 17.74 × 10³ km2 to 19.17 × 10³ km2, while there was also an increase from 19.17 × 10³ km2 to 21.13 × 10³ km2 during the fourth stage of the study, between 1940 and 1950. Overall, agricultural land expansion during this period took place at a low rate; there are several reasons for this, discussed below in more detail.
3.1.2 Rapid growth: between 1950 and 1980
Data show that over this period the agricultural land area in Nepal increased at a higher rate than earlier (Figure 3). Indeed, between 1950 and 1960, the rate of change was higher than during the previous four study stages; over this period the area of agricultural land increased from 21.13 × 10³ km2 to 25.44 × 10³ km2, the second highest expansion seen in Nepal in the last 100 years and an increase of 4.31 × 10³ km2 compared to the previous stage. Similarly, during the sixth stage of this study, between 1960 and 1970, agricultural land area also increased rapidly from 25.44 × 10³ km2 in 1960 to 37.03 × 10³ km2 in 1970. Over this period, agricultural land area increased by 11.59 × 10³ km2, the highest recorded increase in Nepal over the last 100 years. There are several reasons for this change, discussed in more detail below. Finally, during the seventh study stage, between 1970 and 1980, agricultural land area increased by 3.12 × 10³ km2, from 37.03 × 10³ km2 in 1970 to 40.15 × 10³ km2 in 1980.
3.1.3 Steady growth: between 1980 and 2010
Data show that between 1980 and 2010 there was a steady increase in the agricultural land area of Nepal (Figure 3). During the eighth stage of this study, between 1980 and 1990, this increase was less than in the seventh stage, from 40.15 × 10³ km2 in 1980 to 41.16 × 10³ km2 in 1990. The area covered by agricultural land during the ninth stage, between 1990 and 2000, increased by 2.15 × 10³ km2, from 41.16 × 10³ km2 to 43.31 × 10³ km2, while there was also an increase from 43.31 × 10³ km2 to 43.88 × 10³ km2 during the tenth stage of this study, between 2000 and 2010. Our reconstructions resulted in a final agricultural land area of 43.88 × 10³ km2 in 2010, the maximum recorded for the entire study.

3.2 Changes in agricultural land area at the eco-regional level

The three major eco-regions (Mountain, Hill, and Tarai) of Nepal were utilized in this study as part of our analysis of agricultural land area distribution. Data show that of the 75 government declared districts in Nepal, 16 are in the Mountain region (mostly located in the northern part of the country), 39 are in the Hill region (located across the middle part of the country), and the remaining 20 are in the Tarai region (on plains in the southern part of the country).
On the basis of these divisions, results show that the distribution of agricultural land varied in a very similar way in the Tarai and Hill regions in the period between 1910 and 1960, while there was a higher rate of expansion in the Tarai region between 1970 and 1990. In later stages, however, between 1990 and 2010, the Hill region tended to contain more agricultural land as a proportion of the total in Nepal, while in terms of the overall distribution of agricultural land, the Mountain region contained far less than the others throughout all the stages we investigated. Data also reveal a temporal trend towards increasing agricultural land area in all three eco-regions between 1910 and 2010 (Figure 4).
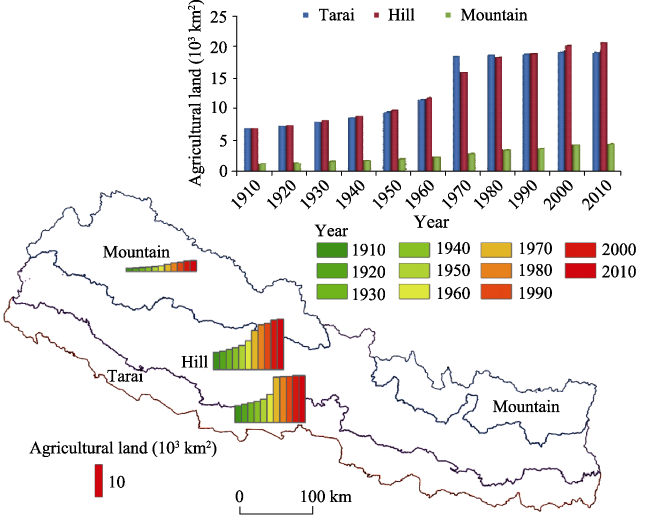
Figure 4 Trends in agricultural land area expansion between 1910 and 2010 across the three eco-regions of Nepal
Agricultural land area has tended to increase across the country as a whole, while in individual regions, more of this LULC was present in the Hill region in very early stages, up until 1960. At the same time, however, the area of agricultural land was higher in the Tarai region compared to the Hill region between 1970 and 1990. Trends in later stages show a slight decline in agricultural land area in the Tarai region as well as an increasing trend in the Mountain and Hill regions.

3.3 Changes in agricultural land area in development regions

There are five development regions in Nepal, classified as first level administrative units. We therefore assessed changes in the status of agricultural land within the five administrative regions that comprise this country, the Eastern Development Region (EDR), the Central Development Region (CDR), the Western Development Region (WDR), the Mid-Western Development Region (MWDR), and the Far-Western Development Region (FWDR) (Paudel et al., 2017). The results of this study show a smoothly increasing trend in agricultural land area in each of these regions (Figure 5).
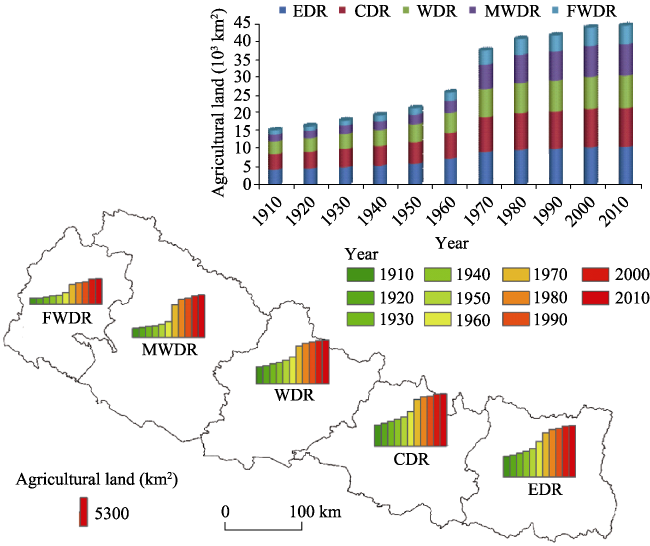
Figure 5 Trends in the expansion of agricultural land area between 1910 and 2010 in the five development regions of Nepal. Note: EDR refers Eastern Development Region, CDR for Central Development Region, WDR for Western Development Region, MWDR for Mid-Western Development Region, and FWDR for Far-Western Development Region in Nepal.
Reconstructions of agricultural land area for the five development regions revealed changes between 1910 and 2010. The agricultural land area of the EDR changed from 4.20 × 10³ km2 to 10.46 × 10³ km2 between 1910 and 2010, while that of the CDR changed in the same way, increasing from 4.30 × 10³ km2 to 10.68 × 10³ km2 over the study period. Similarly, the agricultural area of the WDR increased by 3.51 × 10³ km2 to 8.95 × 10³ km2 between 1910 and 2010; a similar trend was seen in the MWDR, an increase from 1.90 × 10³ km2 to 8.66 × 10³ km2 between 1910 and 2010. The situation was slightly different in the FWDR where there was an increase from 1.21 × 10³ km2 to 5.14 × 10³ km2 between 1910 and 2010. The largest rate of increase was seen in the CDR across every stage because this region contains more plains and areas favorable for crop cultivation than the other four.

3.4 Changes in spatial patterns at the national level

This study has presented a series of historical reconstructions of agricultural land change in Nepal over the last 100 years divided into 11 time slices (i.e., at ten-year intervals) at high resolution (30 m). Our spatial agricultural land reconstructions reveal that during the first study stage that commenced in 1910, this land use type was mainly concentrated in the Hill and Tarai regions of Nepal (Figure 6a), in particular in the central and eastern areas. The overall area of agricultural land increased slightly during the second (1920) (Figure 6b), third (1930) (Figure 6c), and fourth (1940) (Figure 6d) study stages, in a similar fashion to the first stage. However, in the fifth (1950) (Figure 6e) and sixth (1960) stages (Figure 6f) there was a more rapid increase in agricultural land area than previously, with significantly higher spatial expansion in both Hill and Tarai regions. During the sixth stage in particular, results show a noticeable expansion in agricultural land within the Tarai region. One reason for this expansion has to do with the fact that before 1950 this region experienced major problems with malaria, prior to a major government eradication initiative (Dhimal et al., 2014). The same period (1950 to 1951) witnessed the overthrow of the Rana family autocracy in Nepal (Whelpton, 2005), unification, the advent of modern democracy in 1951, and the initiation of government land settlement programs in the Tarai region (Ojha, 1983). It is clear that between 1950 and 1960, agricultural land in Nepal was reclaimed at a high rate, particularly intensively in the Tarai and Hill regions.
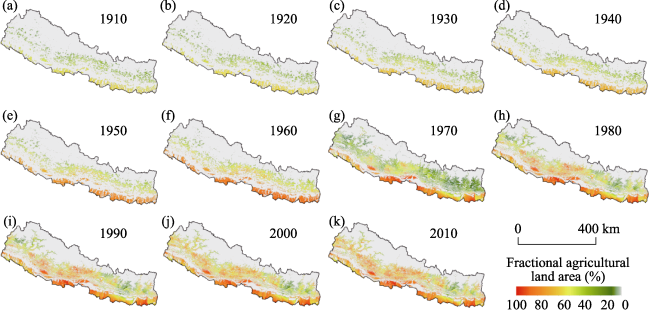
Figure 6 The spatial status of agricultural land cover in Nepal at 30 m resolution between 1910 and 2010 (a-k, with g-k taken from Paudel et al., 2017)
During the seventh stage (1970), spatial distribution data show that agricultural land was still being reclaimed at an unprecedented rate, especially in the Tarai region of Nepal (Figure 6g) and in central and western areas. By this time, a large area of agricultural land was concentrated in the eastern Tarai, while comparatively less was present in the mid- and far-western areas (Paudel et al., 2017). Data show that within the time period of this study, over the last 100 years, the rate of agricultural land expansion was the highest between 1960 and 1970. Indeed, agricultural land area also increased significantly during the eighth stage (1980), especially in the Hill region, in mid- and far-western areas of the Tarai region, and in the eastern and far-western Hill region (Figure 6h) (Paudel et al., 2017). During the ninth stage (1990) (Figure 6i), agricultural land use had become more intensified in the Tarai region, but had not expanded much in mid- and far-western areas of the Hill and Mountain regions due to their climatic conditions and harsh topography. During the tenth stage (Figure 6j) of this study (2000), a fractionally higher rate of expansion was seen in the Hill and Mountain regions compared to the Tarai, while in the last stage (2010) (Figure 6k), agricultural land continued to expand at a steady rate, especially in the Hill and Mountain regions. At the same time, agricultural land cover adjacent to, and within, big cities continued to decrease due to high levels of urbanization (Thapa and Murayama, 2009, 2010).

3.5 Spatial variation at the physiographic region level

Due to vast topographic variations, Nepal comprises five physiographic regions: Tarai, Siwalik, and Hill, as well as Middle and High Mountain (LRMP, 1986) (Figure 7c). Based on these five physiographic regions, we describe and analyze spatial variations in agricultural land change. The spatial trend in reconstructed agricultural land cover over the last 100 years clearly shows that agricultural activities in all regions of the country have rapidly intensified (Supplementary Information Table A1).
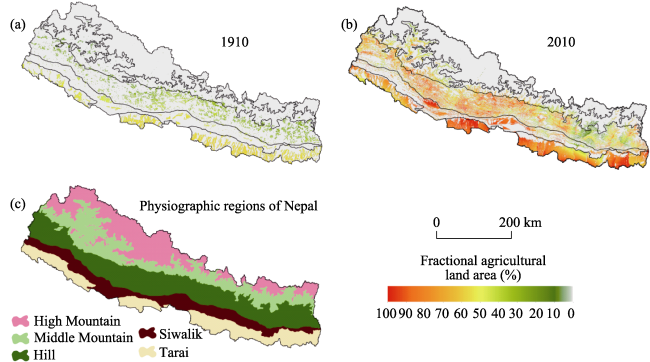
Figure 7 The spatial status of agricultural land cover in Nepal at the level of physiographic regions in 1910 (a) and 2010 (b)
Intensification of the agricultural land use in the High Mountain region led to five times more reclamation that previously between 1910 and 2010, from 17.11 km2 to 95.54 km2, respectively. Similarly, spatial trends in the Middle Mountain region show variation from 946.54 km2 to 4879.59 km2 over the last 100 years, while agricultural land cover in the Hill region was 6680.71 km2 in 1910. This area rapidly increased until 2010 when it was 17,749.91 km2. Although the pattern in the Siwalik region also shows an intensification of about 3.6 times agricultural land cover between 1910 and 2010, the most dynamic trend is seen in the Tarai region where land area increased from 6274.12 km2 to 16,771.36 km2 over the course of this study.
The spatial pattern that characterizes the first stage shows that the majority of agricultural land was previously located in the Hill region, even though the intensity of this LULC is higher in the Tarai region. Status and agricultural land patterns show that the High Mountain, Middle Mountain, and Siwalik regions experienced less agricultural activity at the start of the study period; spatial results shown that agricultural land cover in the Hill region between 1910 and 1960 was larger than in the Tarai region, while this dramatically intensified between 1970 and 1990 to a higher level than in the Hill region. This trend continued between 2000 and 2010 to reach a higher level of agricultural land cover than other regions of the country.
In general, agricultural land cover in the Tarai region includes more fertile soil than other physiographic regions, as well as more suitable topography for agriculture. This means that the intensification and expansion of agricultural land in southern Nepal has rapidly increased over the last 100 years, clearly reflected in spatial patterns of agricultural land between 1910 and 2010 (Figures 7a and 7b).

3.6 Spatial variation within altitudinal zones

Nepal is located in the Himalayan region. Thus, because of vast topographic and altitudinal variations, the spatial status of agricultural land cover over the last 100 years has also been directly affected by altitudinal variation and there is a close relationship between the two variables. We therefore evaluated trends and changes in the spatial intensification of agricultural land cover between 1910 and 2010 by dividing national contour lines into seven categories, below 500 m, between 500 m and 1000 m, between 1000 m and 1500 m, between 1500 m and 2500 m, between 2500 m and 3500 m, between 3500 m and 4500 m, and above 4500 m. This enabled us to determine spatial changes in agricultural land cover based on elevation range over the last 100 years.
The southern region of Nepal is situated in the low altitudinal zone, and is called the Tarai. Contour lines show that the majority of land in this region is at elevations below 500 m, although some areas at this height are also seen in the Siwalik, Hill, and Middle Mountain regions of the country. In terms of agricultural activities, this low altitude area is most suitable for crops, not just because of the presence of plains at low altitude but also because of fertile soil for agriculture. Thus, this zone, below 500 m, encompasses the highest proportion of agricultural land cover nationally across all study stages (Supplementary Information Table B1).
The spatial distribution of agricultural land cover between 500 m and 1,000 m has also intensified, but to a much lesser extent than in the lower altitudinal zone. This result is obvious because this altitudinal range encompasses most of the area of the Siwalik region of Nepal which is not as suitable for agriculture as the first zone. In addition, the total area of this zone is also much lower than the first altitudinal zone. The rate of change in agricultural land over the last 100 years by altitude is presented in Figure 8.
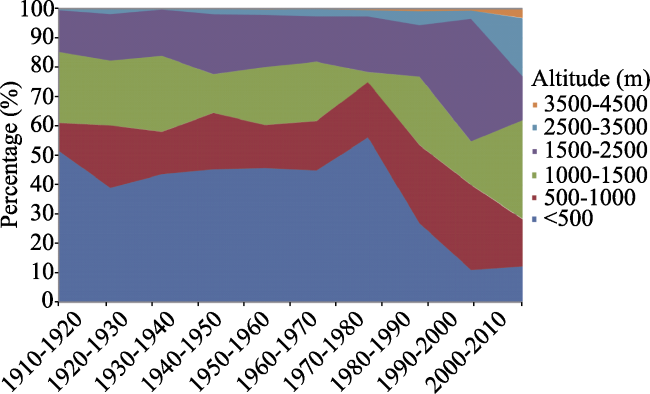
Figure 8 The altitudinal rate of change (%) of agricultural land area in Nepal between 1910 and 2010
Spatial trends in the intensification of agricultural land cover in the belt between 1000 m and 1500 m are much higher than those between 500 m and 1000 m. This zone is mostly located in the Hill region; the agricultural area of this belt has also greatly intensified in recent decades, especially after 1990. The results of this study show that agricultural area in this altitudinal zone was 3501.67 km2 in 1910, increasing up to 8769.16 km2 by 2010. Trends in agricultural land within the altitudinal belt between 1500 m and 2,500 m are almost the same as those between 500 m and 1000 m, albeit slightly less than the in the 500 m and 1000 m belt. This zone is also characterized by a smoothly increasing rate of land reclamation, as in other altitudinal zones; the distribution of agricultural land in this altitudinal zone was 2184.11 km2 in 1910 and had increased to 7567.78 km2 by 2010.
Although the elevation zone between 2500 m and 3500 m is characterized by less agricultural land cover overall, this has expanded and intensified over the last 100 years. Some areas within this zone lie within the Middle Mountain region, while some are within the High Mountain region where agricultural activities are difficult and the soil quality is not favorable for crops. As a result, the distribution of agricultural land within this altitudinal belt is less than that of its counterparts.
The spatial distribution of agricultural land in the elevation zone between 3500 m and 4500 m is low; this area was 8.31 km2 in 1910 but increased over the 100 year period of this study to 83.47 km2 by 2010. The majority of the area encapsulated by this altitudinal belt is located in the Middle and High Mountain regions, so this result is also obvious because of high altitude, extreme climate, and topography. Under these conditions it is very difficult for both crops and humans to survive. The cut-off point for this study was set at 4500 m; we therefore assume that there is no agricultural land area above this altitude and so no spatial distribution map at this height was reconstructed. It is noteworthy that this may have created some uncertainties in estimates for the distribution of total agricultural land area; the additional uncertainties in this study are briefly discussed in Supplementary Information C.

4 Discussion

4.1 Management, potential drivers, policy implications, and future directions

Throughout the historical period, the government of Nepal has managed the transition from highly fertile zones to agricultural land, starting in the 1950s after the launch of a malaria eradication program and supported by a favorable political system following democratic reforms in 1950 and 1951. In this generally favorable political climate, the government of Nepal started to settle landless people in the Tarai region in the so-called ‘Rapti Project’. As part of this resettlement program, people were moved from the Hill to the Tarai region (Ojha, 1983). Indeed, as evidenced by the historical literature, a tropical climate and malaria eradication programs in the Tarai region are usually thought to be the main causative factors of agricultural land expansion (Ojha, 1983). However, other factors were likely also to have been just as important, including the government policy to resettle people in the Tarai region, the attractiveness of the highly fertile soils in this area, the low cost and high profitability of agricultural activities in lowland areas compared to hilly slopes, and a high rate of population growth. Throughout previous stages, these types of programs and factors led to remarkably high rates of land reclamation for agriculture in Nepal. However, poor management in recent decades has led to the conversion of highly built-up areas as well as the abandonment of some regions. For these reasons, it is necessary to develop, effectively implement, and manage coherent land use policies.
The regional-level study presented here for Nepal shows that, socioeconomic, neighborhood, climatic, and topography-related factors have mainly driven agricultural land area changes (Paudel et al., 2016a). In addition, population density, the migration of foreign labor, distance from roads, settlements, and rivers, as well as precipitation, temperature, elevation, soil, and land slope must also be taken into account. It is clear that the relative influence of these factors were different in historical times; different drivers have come to the forefront at different times, reflecting the changing status of agricultural land at the regional and national scale. High population growth over the last 100 years (Figure 9a), for example, has played a key role in agricultural land expansion, while climatic conditions also relate, directly and indirectly, to changes in this LULC (Figure 9b). Additional important factors include the actions and policies of government, directly related to agricultural land expansion across Nepal throughout the period of this study, especially in the Tarai region. In recent decades, agricultural land areas in this region that are adjacent to the east-west highway have been extensively converted into built-up areas as a direct result of government policies and their implementation. It is very important that the government puts in place suitable land use policies and amends them based on sustainable management strategies that are linked to the economy and the lifestyles of the populations. This process can be aided by the adequate management of LUCC, especially agricultural land, both currently and into the future.
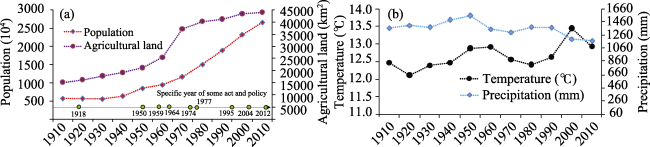
Figure 9 Variations in population, agricultural land area (a), temperature and precipitation (b) over the last 100 years in Nepal. A number of acts and government policies have been superimposed onto this figure.
Throughout the historical period in Nepal, a number of settlement policies for land management were applied at different stages. For example, between 1769 and 1815, the government attempted to reclaim waste land through forced labor (Regmi, 1972). The most important of these government policies was initiated towards the end of the 18th century (Ojha, 1983); however, between 1814 and 1816, land settlement policies came almost to a standstill due to the Anglo-Nepalese war and the process was not re-started until after 1920 when people were again encouraged to settle in the Tarai region (Ojha, 1983). After 1950, the rate of agricultural land reclamation rose rapidly and the government developed a series of land use laws and policies in an attempt to effectively manage LUCC (Sharma and Khanal, 2010). Examples include the ‘Birta Abolition Act 1959’, the ‘Land Survey and Measurement Act 1963’, the ‘Land Act 1964’, the ‘Range Land Nationalization Act 1974’, the ‘Trust Corporation (Guthi) Act 1976’, the ‘Land Revenue Act 1977’, and the ‘Land Acquisition Act 1977’ (FAO, 2010) (Figure 9). Building on these historical developments, a new set of land use policies was developed in 2012 (NLUP, 2012) that emphasize the appropriate use of land (Paudel et al., 2016a). In addition, the government of Nepal developed a National Agricultural Policy 2004, an Irrigation Policy 2004, and an Agricultural Perspective Plan (1995-2015) aimed at enabling the effective management of agricultural land across the country. However, many problems have not been solved appropriately because of the inadequate implementation of laws and policies (Paudel et al., 2016a).
The reconstructions presented here show that significant areas of agricultural land surrounding big cities have been converted to built-up areas over recent decades, especially in the Tarai region. However, the rate of agricultural land abandonment has also increased in the Hill and Mountain regions of the country, due to the lack of appropriate government policies, implementation, and management. We argue that if the government does not take appropriate action with regard to the management of agricultural land. It is likely that the current high rate of conversion to built-up areas will continue in the future, alongside the abandonment of land based on its geographical location. The new national land use project (NLUP, 2012) aims to solve some of agricultural land management issues (Paudel et al., 2016a) by developing integrated land use planning and zoning across major land categories (i.e., agricultural, residential, forest, commercial, industrial, public, and other areas). This land use project will also aid the effective management of agricultural land. We argue that it will be necessary to focus in the future on the implementation of policies aimed at increasing agricultural productivity, as well as enhancing commercially competitive agriculture (Paudel et al., 2016a) in tandem with the combined management of agricultural land, biodiversity conservation, and natural resources. It is also necessary to take the rapidly growing national population into account as part of the effective management of agricultural land in Nepal.

4.2 Marked changes and regional variation over the last 100 years

The results of this study reveal a series of remarkable changes in agricultural land cover across Nepal over the last 100 years. In particular, data show that agricultural land area in 1910 was around three times less than in 2010. Based on our historical reconstructions of agricultural land cover across Nepal, three stages characterized by marked changes can be highlighted. Between 1950 and 1960, agricultural land cover in the country rose by 4.31 × 10³ km2. This equates to an increase of 11.59 × 10³ km2 between 1960 and 1970 compared to the period between 1950 and 1960, and was followed by a peak of 3.12 × 10³ km2 between 1970 and 1980. Several possible factors could explain these changes.
In the first place, as discussed above, there were major problems with malaria in Nepal prior to 1950, especially in the Tarai region. However, from 1950 onwards, the government initiated an intensive program to eradicate this disease (Dhimal et al., 2014). Other political changes also took place at the same time, including the 1950-1951 overthrow of the Rana family autocracy (Whelpton, 2005), unification and the advent of modern democracy in 1951, and the initiation of government-sponsored land settlement programs in the Tarai region (Ojha, 1983). All of these changes would have been highly conducive to agricultural land expansion in Nepal. Indeed, the period between 1951 and 1960 is often referred to as ‘the Transitional Period’ in terms of national agricultural land expansion (Ojha, 1983). Following the initiation of Malaria eradication and the land settlement program between 1950 and 1960, the government then strongly supported the expansion of agricultural land between 1960 and 1970, especially in the Tarai, and Hill and regions of the country. This government support led to the highest level of land use expansion seen in the 100 year duration of this study. Between 1950 and 1970, the government of Nepal freely allocated waste lands in the Tarai region to anyone who undertook to reclaim them for settlement, allowing the payment of less tax over a four- to ten-year period (Regmi, 1972).
Turning to regional variations, results show that the over the last 100 years, the southern part of Nepal has experienced the highest rate of increase in agricultural land area. At the same time, however, the fractional spatial distribution of this change reveals that the rate of increase had declined by 2010. There are a number of human-induced reasons for this, including a high rate of urbanization in the plains area, the establishment of industrial areas in the southern part of the country, and an increasing trend towards population growth in the regions (Paudel et al., 2017). Thus, status and trends in agricultural land reconstruction changes varied between different administrative areas (i.e., regions, zones, and districts) between 1910 and 2010. Reconstructions show that far-western areas, including the Tarai regional districts Kailali and Kanchanpur, had less agricultural land before 1950; this was also the case in the Hill district of Baitadi and the Mountain district of Darchula, both of which were rapidly reclaimed between 1950 and 2010. In more western areas of the country, in regions such as Kaski, Syanja, Tanahu, and Lamjung, the reuse of land and the intensification of agricultural areas took place at a steadier rate than in other parts of the country. In contrast, central and eastern districts of the Tarai region, including Morang, Sunsari, and Jhapa, now have more agricultural land than they did earlier, much of which has been heavily reclaimed since the 1950s. These regions are amongst the most suitable in Nepal for cultivating crops as they are characterized by flat slopes and fertile land. Agricultural land cover in these regions intensified during the later time periods of this study, while the situation in Hill and Mountain districts such as Khotang, Solukhumbu, and Sankhuwasabha meant that intensification of this LULC type did not occur until after 2000. Agricultural land in some of these regions has even been recently abandoned because of the absence of irrigation, labor shortages, and reductions in income from traditional agriculture (Paudel et al., 2016a). The area of agricultural land in the Kathmandu Valley, for example, increased until the 1960s but declined in recent decades due to high levels of urbanization.
Reconstructions show that, until 2010, the lowest area of agricultural land was in the Karnali zone, while the largest area of agricultural land was in the Lumbini zone. These results were both expected because the latter zone encompasses a favorable area for crop cultivation, while the former is characterized by harsh topographic and climatic conditions (Paudel et al., 2017). Finally, reconstructions over the last 100 years for different districts and regions of the country are significantly different from one another because of topographic, rapid population growth, and climatic factors.

5 Conclusions

The historical reconstruction study presented in this paper considered changes in spatial patterns of agricultural land in Nepal over the last 100 years (i.e., encompassing the period between 1910 and 2010). This was achieved via land suitability assessment and a land allocation model and generated a series of historical datasets. Agricultural land reconstruction between 1910 and 1960 was based on national-level statistical data and encompassed eight regional-levels of population figures analyzed at both national and regional levels. In contrast, we used district-level statistical data for the period between 1970 and 2010, analyzing this at both national and different regional levels. Thus, on the basis of these models, we reconstructed and developed high resolution (30 m) agricultural land cover maps for Nepal, covering ten-year intervals between 1910 and 2010.
The results of our reconstructions strongly suggest that agricultural land in Nepal expanded significantly between 1910 and 2010. This expansion varied at different times; between 1910 and 1950, for example, less growth in agricultural land area was seen, from 15.12 × 10³ km2 to 21.13 × 10³ km2, while a rapid increase was seen between 1950 and 1980, from 21.13 × 10³ km2 to 40.15 × 10³ km2, respectively. Steady growth was seen between 1980 and 2010, from 40.15 × 10³ km2 in 1980 to 43.88 × 10³ km2 in 2010. The spatial distribution of agricultural land during the initial 1910 stage showed that less area was present proportionally in the Tarai and Hill regions; the Jhapa, Rupandehi, and Banke districts in the Tarai region as well as the Ilam, Kaski, and Surkhet districts in the Hill region had less agricultural land area. However, increasing land area intensified and this trend became most marked in the Tarai region after the 1950s, as well as in the central Hill and Mountain regions of the country. Data show that, over recent decades, especially after the 1990s, there has been a slight decrease in the rate of land area conversion to agricultural land, especially around the capital city (Kathmandu) and in other areas surrounding big cities (Biratnagar, Pokhara, Butwal, Kohalpur, Nepaljung). The high rate of population growth, government policies, and climate have all played key roles in influencing agricultural land cover over this period. The historical spatial dataset for the last 100 years presented in this paper will prove very useful for the future analysis of agricultural land impacts at local, regional, and national scales, as well as for analyses of carbon emissions and climatic modeling.

The authors have declared that no competing interests exist.

[1]
CBS, 1958. National Population Census, 1911, 1920, 1930, 1941, and 1952/54. Government of Nepal. Kathmandu, Nepal: Central Bureau of Statistics.

[2]
CBS, 1961. National Population Census, 1961. Government of Nepal. Kathmandu, Nepal: Central Bureau of Statistics.

[3]
CBS, 1971. National Population Census, 1971. Government of Nepal. Kathmandu, Nepal: Central Bureau of Statistics.

[4]
CBS, 1981. National Population Census, 1981. Government of Nepal. Kathmandu, Nepal: Central Bureau of Statistics.

[5]
CBS, 1991. National Population Census 1991. Government of Nepal, National Planning Commission Secretariat. Kathmandu, Nepal: Central Bureau of Statistics.

[6]
CBS, 2001. National Population Census 2001. Government of Nepal, National Planning Commission Secretariat. Kathmandu, Nepal: Central Bureau of Statistics.

[7]
CBS, 2012. National Population and Housing Census 2011 (National Report). Government of Nepal, National Planning Commission Secretariat. Kathmandu, Nepal: Central Bureau of Statistics.

[8]
Chapagain P S, 2006. Involution or evolution? Conceptualizing the changes in farming system of Eastern Nepal.Himalayan Review, 37: 1-17.

[9]
Chen J, Chen J, Liao A Pet al., 2015. Global land cover mapping at 30m resolution: A POK-based operational approach.ISPRS Journal of Photogrammetry and Remote Sensing, 103(1): 7-27.Global Land Cover (GLC) information is fundamental for environmental change studies, land resource management, sustainable development, and many other societal benefits. Although GLC data exists at spatial resolutions of 300m and 1000m, a 30m resolution mapping approach is now a feasible option for the next generation of GLC products. Since most significant human impacts on the land system can be captured at this scale, a number of researchers are focusing on such products. This paper reports the operational approach used in such a project, which aims to deliver reliable data products. Over 10,000 Landsat-like satellite images are required to cover the entire Earth at 30m resolution. To derive a GLC map from such a large volume of data necessitates the development of effective, efficient, economic and operational approaches. Automated approaches usually provide higher efficiency and thus more economic solutions, yet existing automated classification has been deemed ineffective because of the low classification accuracy achievable (typically below 65%) at global scale at 30m resolution. As a result, an approach based on the integration of pixel- and object-based methods with knowledge (POK-based) has been developed. To handle the classification process of 10 land cover types, a split-and-merge strategy was employed, i.e. firstly each class identified in a prioritized sequence and then results are merged together. For the identification of each class, a robust integration of pixel-and object-based classification was developed. To improve the quality of the classification results, a knowledge-based interactive verification procedure was developed with the support of web service technology. The performance of the POK-based approach was tested using eight selected areas with differing landscapes from five different continents. An overall classification accuracy of over 80% was achieved. This indicates that the developed POK-based approach is effective and feasible for operational GLC mapping at 30m resolution.

DOI

[10]
Dhimal M, Ahrens B, Kuch U2014. Malaria control in Nepal 1963-2012: Challenges on the path towards elimination.Malaria Journal, 13: 1-14.Background Malaria is still a priority public health problem of Nepal where about 84% of the population are at risk. The aim of this paper is to highlight the past and present malaria situation in this country and its challenges for long-term malaria elimination strategies. Methods Malariometric indicator data of Nepal recorded through routine surveillance of health facilities for the years between 1963 and 2012 were compiled. Trends and differences in malaria indicator data were analysed. Results The trend of confirmed malaria cases in Nepal between 1963 and 2012 shows fluctuation, with a peak in 1985 when the number exceeded 42,321, representing the highest malaria case-load ever recorded in Nepal. This was followed by a steep declining trend of malaria with some major outbreaks. Nepal has made significant progress in controlling malaria transmission over the past decade: total confirmed malaria cases declined by 84% (12,750 in 2002 vs 2,092 in 2012), and there was only one reported death in 2012. Based on the evaluation of the National Malaria Control Programme in 2010, Nepal recently adopted a long-term malaria elimination strategy for the years 2011???2026 with the ambitious vision of a malaria-free Nepal by 2026. However, there has been an increasing trend of Plasmodium falciparum and imported malaria proportions in the last decade. Furthermore, the analysis of malariometric indicators of 31 malaria-risk districts between 2004 and 2012 shows a statistically significant reduction in the incidence of confirmed malaria and of Plasmodium vivax, but not in the incidence of P. falciparum and clinically suspected malaria. Conclusions Based on the achievements the country has made over the last decade, Nepal is preparing to move towards malaria elimination by 2026. However, considerable challenges lie ahead. These include especially, the need to improve access to diagnostic facilities to confirm clinically suspected cases and their treatment, the development of resistance in parasites and vectors, climate change, and increasing numbers of imported cases from a porous border with India. Therefore, caution is needed before the country embarks towards malaria elimination.

DOI PMID

[11]
Dijkshoorn K, Huting J, 2009. Soil and terrain database for Nepal (Report). ISRIC - World Soil Information, Wageningen, 21p. with data set.

[12]
FAO, 2010. Land Use Policy and Planning. Food and Agriculture Organization of the United Nations UN Complex, Pulchowk, Nepal, p.40.

[13]
Foley J A, DeFries R, Asner G Pet al., 2005. Global consequences of land use.Science, 309(5734): 570-574.

[14]
Fuchs R, Herold M, Verburg P Het al., 2013. A high-resolution and harmonized model approach for reconstructing and analysing historic land changes in Europe.Biogeosciences, 10(3): 1543-1559.Human-induced land use changes are nowadays the second largest contributor to atmospheric carbon dioxide after fossil fuel combustion. Existing historic land change reconstructions on the European scale do not sufficiently meet the requirements of greenhouse gas (GHG) and climate assessments, due to insufficient spatial and thematic detail and the consideration of various land change types. This paper investigates if the combination of different data sources, more detailed modelling techniques, and the integration of land conversion types allow us to create accurate, high-resolution historic land change data for Europe suited for the needs of GHG and climate assessments. We validated our reconstruction with historic aerial photographs from 1950 and 1990 for 73 sample sites across Europe and compared it with other land reconstructions like Klein Goldewijk et al. (2010, 2011), Ramankutty and Foley (1999), Pongratz et al. (2008) and Hurtt et al. (2006). The results indicate that almost 700 000 km(2) (15.5%) of land cover in Europe has changed over the period 1950-2010, an area similar to France. In Southern Europe the relative amount was almost 3.5% higher than average (19%). Based on the results the specific types of conversion, hot-spots of change and their relation to political decisions and socio-economic transitions were studied. The analysis indicates that the main drivers of land change over the studied period were urbanization, the reforestation program resulting from the timber shortage after the Second World War, the fall of the Iron Curtain, the Common Agricultural Policy and accompanying afforestation actions of the EU. Compared to existing land cover reconstructions, the new method considers the harmonization of different datasets by achieving a high spatial resolution and regional detail with a full coverage of different land categories. These characteristics allow the data to be used to support and improve ongoing GHG inventories and climate research.

DOI

[15]
Fuchs R, Verburg P H, Clevers J G P W et al., 2015. The potential of old maps and encyclopaedias for reconstructing historic European land cover/use change.Applied Geography, 59: 43-55.61We examined the added value of old data for historic land reconstructions.61The study focuses on Continental Europe and the period around 1900.61Historic maps improved accuracy of the land allocation in our reconstruction by 16.5%.61Old maps improved the representation of spatial elements of landscapes in our model.61Historic land records showed strong agreement with independent data, such as old maps.

DOI

[16]
Gautam J, 2008. Country Report on the State of the Nepal’s Plant Genetic Resources for Food and Agriculture. Commission of Genetic Resources for Food and Agriculture. Food and Agriculture Organization of the United Nations. p.91.

[17]
Harris I, Jones P D, Osborn T Jet al., 2014. Updated high-resolution grids of monthly climatic observations: The CRU TS3.10 Dataset.International Journal of Climatology, 34(3): 623-642.This paper describes the construction of an updated gridded climate dataset (referred to as CRU TS3.10) from monthly observations at meteorological stations across the world's land areas. Station anomalies (from 1961 to 1990 means) were interpolated into 0.5 degrees latitude/longitude grid cells covering the global land surface (excluding Antarctica), and combined with an existing climatology to obtain absolute monthly values. The dataset includes six mostly independent climate variables (mean temperature, diurnal temperature range, precipitation, wet-day frequency, vapour pressure and cloud cover). Maximum and minimum temperatures have been arithmetically derived from these. Secondary variables (frost day frequency and potential evapotranspiration) have been estimated from the six primary variables using well-known formulae. Time series for hemispheric averages and 20 large sub-continental scale regions were calculated (for mean, maximum and minimum temperature and precipitation totals) and compared to a number of similar gridded products. The new dataset compares very favourably, with the major deviations mostly in regions and/or time periods with sparser observational data. CRU TS3.10 includes diagnostics associated with each interpolated value that indicates the number of stations used in the interpolation, allowing determination of the reliability of values in an objective way. This gridded product will be publicly available, including the input station series ( and ). (c) 2013 Royal Meteorological Society

DOI

[18]
He F N, Li S C, Zhang X Z, 2012. Reconstruction of cropland area and spatial distribution in the mid-Northern Song Dynasty (AD1004-1085).Journal of Geographical Sciences, 22(2): 359-370.lt;p>To understand historical human-induced land cover change and its climatic effects, it is necessary to create historical land use datasets with explicit spatial information. Using the taxes-cropland area and number of families compiled from historical documents, we estimated the real cropland area and populations within each <em>Lu</em> (a province-level political region in the Northern Song Dynasty) in the mid-Northern Song Dynasty (AD1004-1085). The estimations were accomplished through analyzing the contemporary policies of tax, population and agricultural development. Then, we converted the political region-based cropland area to geographically explicit grid cell-based fractional cropland at the cell size of 60 km by 60 km. The conversion was based on calculating cultivation suitability of each grid cell using the topographic slope, altitude and population density as the independent variables. As a result, the total area of cropland within the Northern Song territory in the 1070s was estimated to be about 720 million <em>mu</em> (Chinese area unit, 1 <em>mu</em> = 666.7 m<sup>2</sup>), of which 40.1% and 59.9% occurred in the north and south respectively. The population was estimated to be about 87.2 million, of which 38.7% and 61.3% were in the north and south respectively, and per capita cropland area was about 8.2 <em>mu</em>. The national mean reclamation ratio (i.e. ratio of cropland area to total land area; RRA hereafter for short) was bout 16.6%. The plain areas, such as the North China Plain, the middle and lower reaches of the Yangtze River, Guanzhong Plain, plains surrounding the Dongting Lake and Poyang Lake and Sichuan Basin, had a higher RRA, being mostly over 40%; while the hilly and mountainous areas, such as south of Nanling Mountains, the southwest regions (excluding the Chengdu Plain), Loess Plateau and southeast coastal regions, had a lower RRA, being less than 20%. Moreover, RRA varied with topographic slope and altitude. In the areas of low altitude (&le;250 m), middle altitude (250-100 m) and high altitude (1000-3500 m), there were 443 million, 215 million and 64 million <em>mu</em> of cropland respectively and their regional mean RRAs were 27.5%, 12.6% and 7.2% respectively. In the areas of flat slope, gentle slope, medium slope and steep slope, there were 116 million, 456 million, 144 million and 2 million <em>mu</em> of cropland respectively and their regional mean RRAs were 34.6%, 20.7%, 8.5% and 2.3% respectively.</p>

DOI

[19]
He F N, Li S C, Zhang X Z, 2015. A spatially explicit reconstruction of forest cover in China over 1700-2000.Global and Planetary Change, 131: 73-81.61Identified the maximum distribution extent of forest in China without human activities;61Developed a method to estimate forest weight of each10km grid by assessing land suitability for cultivation;61By the method, the provincial forest area were transformed into forest cover dataset of China for 1700-2000;61Comparisons indicated that our model can reproduce China forest cover for the past 300years well.

DOI

[20]
He F N, Li S C, Zhang X Zet al., 2013 Comparisons of cropland area from multiple datasets over the past 300 years in the traditional cultivated region of China.Journal of Geographical Sciences, 23(6): 978-990.lt;p>Land use/cover change is an important parameter in the climate and ecological simulations. Although they had been widely used in the community, SAGE dataset and HYDE dataset, the two representative global historical land use datasets, were little assessed about their accuracies in regional scale. Here, we carried out some assessments for the traditional cultivated region of China (TCRC) over last 300 years, by comparing SAGE2010 and HYDE (v3.1) with Chinese Historical Cropland Dataset (CHCD). The comparisons were performed at three spatial scales: entire study area, provincial area and 60 km by 60 km grid cell. The results show that (1) the cropland area from SAGE2010 was much more than that from CHCD; moreover, the growth at a rate of 0.51% from 1700 to 1950 and -0.34% after 1950 were also inconsistent with that from CHCD. (2) HYDE dataset (v3.1) was closer to CHCD dataset than SAGE dataset on entire study area. However, the large biases could be detected at provincial scale and 60 km by 60 km grid cell scale. The percent of grid cells having biases greater than 70% (&lt;-70% or &gt;70%) and 90% (&lt;-90% or &gt;90%) accounted for 56%-63% and 40%-45% of the total grid cells respectively while those having biases range from -10% to 10% and from -30% to 30% account for only 5%-6% and 17% of the total grid cells respectively. (3) Using local historical archives to reconstruct historical dataset with high accuracy would be a valuable way to improve the accuracy of climate and ecological simulation.</p>

DOI

[21]
Klein Goldewijk K, Beusen A, Doelman Jet al., 2017. Anthropogenic land use estimates for the Holocene: HYDE 3.2.Earth System Science Data, 9(2): 927-953.This paper presents an update and extension of HYDE, the History Database of the Global Environment (HYDE version 3.2). HYDE is an internally consistent combination of historical population estimates and allocation algorithms with time-dependent weighting maps for land use. Categories include cropland, with new distinctions for irrigated and rain-fed crops (other than rice) and irrigated and rain-fed rice. Grazing lands are also provided, divided into more intensively used pasture and less intensively used rangeland, and further specified with respect to conversion of natural vegetation to facilitate global change modellers. Population is represented by maps of total, urban, rural population, population density and built-up area. The period covered is 1062000 before Common Era (BCE) to 2015 Common Era (CE). All data can be downloaded from <a href="https://doi.org/10.17026/dans-25g-gez3" target="_blank">https://doi.org/10.17026/dans-25g-gez3. We estimate that global population increased from 4.402million people (we also estimate a lower range 65<65620.01 and an upper range of 8.9 million) in 106200062BCE to 7.257 billion in 201562CE, resulting in a global population density increase from 0.03 persons (or capita, in short cap)62km612 (range 0–0.07) to almost 5662cap62km612 respectively. The urban built-up area evolved from almost zero to roughly 5862Mha in 201562CE, still only less than 0.562% of the total land surface of the globe. Cropland occupied approximately less than 162% of the global land area (136203762Mha, excluding Antarctica) for a long time period until 162CE, quite similar to the grazing land area. In the following centuries the share of global cropland slowly grew to 2.262% in 170062CE (ca. 29362Mha, uncertainty range 220–36762Mha), 4.462% in 185062CE (57862Mha, range 522–63762Mha) and 12.262% in 201562CE (ca. 159162Mha, range 1572–160462Mha). Cropland can be further divided into rain-fed and irrigated land, and these categories can be further separated into rice and non-rice. Rain-fed croplands were much more common, with 2.262% in 170062CE (28962Mha, range 217–36162Mha), 4.262% (54962Mha, range 496–60662Mha) in 185062CE and 10.162% (131662Mha, range 1298–132562Mha) in 201562CE, while irrigated croplands used less than 0.0562% (4.362Mha, range 3.1–5.562Mha), 0.262% (2862Mha, range 25–3162Mha) and 2.162% (27762Mha, range 273–27862Mha) in 1700, 1850 and 201562CE, respectively. We estimate the irrigated rice area (paddy) to be 0.162% (1362Mha, range 9–1662Mha) in 170062CE, 0.262% (2862Mha, range 26–3162Mha) in 185062CE and 0.962% (11862Mha, range 117–12062Mha) in 201562CE. The estimates for land used for grazing are much more uncertain. We estimate that the share of grazing land grew from 5.162% in 170062CE (66762Mha, range 507–82062Mha) to 9.662% in 185062CE (119262Mha, range 1068–130462Mha) and 24.962% in 201562CE (324162Mha, range 3211–327062Mha). To aid the modelling community we have divided land used for grazing into more intensively used pasture, less intensively used converted rangeland and less or unmanaged natural unconverted rangeland. Pasture occupied 1.162% in 170062CE (14562Mha, range 79–17562Mha), 1.962% in 185062CE (25362Mha, range 218–28762Mha) and 6.062% (78762Mha, range 779–79562Mha) in 201562CE, while rangelands usually occupied more space due to their occurrence in more arid regions and thus lower yields to sustain livestock. We estimate converted rangeland at 0.662% in 170062CE (8262Mha range 66–9362Mha), 162% in 185062CE (12962Mha range 118–13662Mha) and 2.462% in 201562CE (31062Mha range 306–31262Mha), while the unconverted natural rangelands occupied approximately 3.462% in 170062CE (43762Mha, range 334–53362Mha), 6.262% in 185062CE (81062Mha, range 733–88162Mha) and 16.562% in 201562CE (214562Mha, range 2126–216462Mha).

DOI

[22]
Klein Goldewijk K, Beusen A, Van Drecht Get al., 2011. The HYDE 3.1 spatially explicit database of human induced global land use change over the past 12,000 years.Global Ecology and Biogeography, 20(1): 73-86.ABSTRACT Aim68 This paper presents a tool for long-term global change studies; it is an update of the History Database of the Global Environment (HYDE) with estimates of some of the underlying demographic and agricultural driving factors. Methods68 Historical population, cropland and pasture statistics are combined with satellite information and specific allocation algorithms (which change over time) to create spatially explicit maps, which are fully consistent on a 5′ longitude/latitude grid resolution, and cover the period 10,000bctoad2000. Results68 Cropland occupied roughly less than 1% of the global ice-free land area for a long time untilad1000, similar to the area used for pasture. In the centuries that followed, the share of global cropland increased to 2% inad1700 (. 3 million km) and 11% inad2000 (15 million km), while the share of pasture area grew from 2% inad1700 to 24% inad2000 (34 million km) These profound land-use changes have had, and will continue to have, quite considerable consequences for global biogeochemical cycles, and subsequently global climate change. Main conclusions68 Some researchers suggest that humans have shifted from living in the Holocene (emergence of agriculture) into the Anthropocene (humans capable of changing the Earth's atmosphere) since the start of the Industrial Revolution. But in the light of the sheer size and magnitude of some historical land-use changes (e.g. as result of the depopulation of Europe due to the Black Death in the 14th century and the aftermath of the colonization of the Americas in the 16th century) we believe that this point might have occurred earlier in time. While there are still many uncertainties and gaps in our knowledge about the importance of land use (change) in the global biogeochemical cycle, we hope that this database can help global (climate) change modellers to close parts of this gap.

DOI

[23]
Klein Goldewijk K, Ramankutty N, 2004. Land cover change over the last three centuries due to human activities: The availability of new global data sets.GeoJournal, 61(4): 335-344.Land use and land cover change is an important driver of global change (Turner et al., 1993). It is recognized that land use change has important consequences for global and regional climates, the global biogeochemical cycles such as carbon, nitrogen, and water, biodiversity, etc. Nevertheless, there have been relatively few comprehensive studies of global, long-term historical changes in land cover due to land use. In this paper, we review the development of global scale data sets of land use and land cover change. Furthermore, we assess the differences between two recently developed global data sets of historical land cover change due to land use. Based on historical statistical inventories (e.g. census data, tax records, land surveys, historical geography estimates, etc) and applying different spatial analysis techniques, changes in agricultural land cover (croplands, pastures) were reconstructed for the last 300 years. The two data sets indicate that cropland areas expanded from 3-4 million km in 1700 to 15-18 million km in 1990 (mostly at the expense of forests), while grazing land area expanded from 5 million km in 1700 to 31 million km in 1990 (mostly at the expense of natural grasslands). The data sets disagree most over Latin America and Oceania, and agree best over North America. Major differences in the two data sets can be explained by the use of a fractional versus Boolean approach, different modelling assumptions, and inventory data sets.

DOI

[24]
Lambin E F, Turner B L, Geist H Jet al., 2001. The causes of land-use and land-cover change: Moving beyond the myths.Global Environmental Change, 11(4): 261-269.Common understanding of the causes of land-use and land-cover change is dominated by simplifications which, in turn, underlie many environment-development policies. This article tracks some of the major myths on driving forces of land-cover change and proposes alternative pathways of change that are better supported by case study evidence. Cases reviewed support the conclusion that neither population nor poverty alone constitute the sole and major underlying causes of land-cover change worldwide. Rather, peoples responses to economic opportunities, as mediated by institutional factors, drive land-cover changes. Opportunities and constraints for new land uses are created by local as well as national markets and policies. Global forces become the main determinants of land-use change, as they amplify or attenuate local factors.

DOI

[25]
Li S C, He F N, Zhang X Z, 2016. A spatially explicit reconstruction of cropland cover in China from 1661 to 1996.Regional Environmental Change, 16(2): 417-428.Reconstruction of cropland cover is crucial for assessing human impact on the environment. In this study, based on existing studies concerning historical cropland, population data and government inventories, we obtained a provincial cropland area dataset of China for 1661–1996 via collection, revision and reconstruction. Then, the provincial cropland area was allocated into grid cells of 10×10km depending on the land suitability for cultivation. Our reconstruction indicates that cropland increased from ~55.5×10 4 km 2 in 1661 to ~130.0×10 4 km 2 in 1996. From 1661 to 1873, cropland expanded tremendously in the Sichuan Basin, and land reclamation was greatly enhanced in North China Plain. For 1873–1980, agricultural development occurred primarily in northeastern China. After 1980, most provinces in the traditionally cultivated region of China experienced decreases in cropland area. In comparison with satellite-based data for 2000, we found that our reconstruction generally captures the spatial distribution of cropland. Also, differences are mostly <20% (6120 to 20%). Compared with HYDE 3.1 dataset, which is designed for the global scale, our model is more suitable for reconstructing the historical crop cover of China at 10×10km grid scale. Our reconstruction can be used in climate models to study the impact of crop cover change on the climate and carbon cycle.

DOI

[26]
Li S C, Wang Z F, Zhang Y L, 2017. Crop cover reconstruction and its effects on sediment retention in the Tibetan Plateau for 1900-2000.Journal of Geographical Sciences, 27(7): 786-800.Geographically explicit historical land use and land cover datasets are increasingly required in studies of climatic and ecological effects of human activities. In this study, using historical population data as a proxy, the provincial cropland areas of Qinghai province and the Tibet Autonomous Region(TAR) for 1900, 1930, and 1950 were estimated. The cropland areas of Qinghai and the TAR for 1980 and 2000 were obtained from published statistical data with revisions. Using a land suitability for cultivation model, the provincial cropland areas for the 20 th century were converted into crop cover datasets with a resolution of 1 × 1 km. Finally, changes of sediment retention due to crop cover change were assessed using the sediment delivery ratio module of the Integrated Valuation of Ecosystem Services and Trade-offs(InVEST) model(version 3.3.1). There were two main results.(1) For 1950–1980 the fractional cropland area increased from 0.32% to 0.48% and land use clearly intensified in the Tibetan Plateau(TP), especially in the Yellow River–Huangshui River Valley(YHRV) and the midstream of the Yarlung Zangbo River and its two tributaries valley(YRTT). For other periods of the 20 th century, stability was the main trend.(2) For 1950–1980, sediment export increased rapidly in the Minhe autonomous county of the YHRV, and in the Nianchu River and Lhasa River basins of the YRTT, which means that sediment retention clearly decreased in these regions over this period. The results of this assessment provide scientific support for conservation planning, development planning, or restoration activities.

DOI

[27]
LRMP, 1986. Land Utilization Report.Land Resource Mapping Project, Kenting Earth Science Canada and Department of Topography, Government of Nepal, Kathmandu, Nepal, p.112.

[28]
Malla G, 2009. Climate change and its impact on Nepalese agriculture.The Journal of Agriculture and Environment, 9: 62-71.

[29]
NLUP, 2012. National Land Use Policy. Ministry of Land Reform and Management, Government of Nepal, Kathmandu, Nepal. p.17.

[30]
Ojha D P, 1983. History of land settlement in Nepal Tarai.Contribution to Nepalese Studies, 11(1): 21-44.

[31]
Paudel B, Gao J G, Zhang Y Let al., 2016a. Changes in cropland status and their driving factors in the Koshi River Basin of the Central Himalayas, Nepal.Sustainability, 8(9): 933.

[32]
Paudel B, Zhang Y L, Li S Cet al., 2016b. Review of studies on land use and land cover change in Nepal.Journal of Mountain Science, 13(4): 643-660.Land use and land cover (LULC) in Nepal has undergone constant change over the past few decades due to major changes caused by anthropogenic and natural factors and their impacts on the national and regional environment and climate. This comprehensive review of past and present studies of land use and land cover change (LUCC) in Nepal concentrates on cropland, grassland, forest, snow/glacier cover and urban areas. While most small area studies have gathered data from different sources and research over a short period, across large areas most historical studies have been based on aerial photographs such as the Land Resource Mapping Project in 1986. The recent trend in studies in Nepal is to focus on new concepts and techniques to analyze LULC status on the basis of satellite imagery, with the help of geographic information system and remote sensing tools. Studies based on historical documents, and historical and recent spatial data on LULC, have clearly shown an increase in cropland areas in Nepal, and present results indicating different rates and magnitudes. A decrease in forest and snow/glacier coverage is reported in most studies. Little information is available on grassland and urban areas from past research. The unprecedented rate of urbanization in Nepal has led to significant urban land changes over the past 30 years. Meanwhile, long term historical LUCC research in Nepal is required for extensive work on spatially explicit reconstructions on the basis of historical and primary data collection, including LULC archives and drivers for future change.

DOI

[33]
Paudel B, Zhang Y L, Li S Cet al., 2017. Spatiotemporal reconstruction of agricultural land cover in Nepal from 1970 to 2010.Regional Environmental Change, 17(8): 2349-2357.Agricultural land cover and changes in its extent are directly related to human activities. The rapidly growing population in Nepal has resulted in an increasing trend of agricultural land expansion,...

DOI

[34]
Pitman A J, Avila F B, Abramowitz Get al., 2011. Importance of background climate in determining impact of land-cover change on regional climate.Nature Climate Change, 1(9): 472-475.Humans have modified the Earths climate through emissionsof greenhouse gases and through land-use and land-coverchange (LULCC). Increasing concentrations of greenhousegases in the atmosphere warm the mid-latitudes more thanthe tropics, in part owing to a reduced snow albedo feedbackas snow cover decreases. Higher concentration of carbondioxide also increases precipitation in many regions, as aresult of an intensification of the hydrological cycle. Thebiophysical effects of LULCC since pre-industrial times haveprobably cooled temperate and boreal regions and warmedsome tropical regions. Here we use a climate model to showthat how snow and rainfall change under increased greenhousegases dominates how LULCC affects regional temperature.Increased greenhouse-gas-driven changes in snow and rainfallaffect the snow albedo feedback and the supply of water,which in turn limits evaporation. These changes largely controlthe net impact of LULCC on regional climate. Our resultsshow that capturing whether future biophysical changes dueto LULCC warm or cool a specific region therefore requiresan accurate simulation of changes in snow cover and rainfallgeographically coincident with regions of LULCC. This is achallenge to current climate models, but also provides potentialfor further improving detection and attribution methods.

DOI

[35]
Pongratz J, Reick C, Raddatz Tet al., 2008. A reconstruction of global agricultural areas and land cover for the last millennium.Global Biogeochemical Cycles, 22(3): 1-16.Humans have substantially modified the Earth's land cover, especially by transforming natural ecosystems to agricultural areas. In preindustrial times, the expansion of agriculture was probably the dominant process by which humankind altered the Earth system, but little is known about its extent, timing, and spatial pattern. This study presents an approach to reconstruct spatially explicit changes in global agricultural areas (cropland and pasture) and the resulting changes in land cover over the last millennium. The reconstruction is based on published maps of agricultural areas for the last three centuries. For earlier times, a country-based method is developed that uses population data as a proxy for agricultural activity. With this approach, the extent of cropland and pasture is consistently estimated since AD 800. The resulting reconstruction of agricultural areas is combined with a map of potential vegetation to estimate the resulting historical changes in land cover. Uncertainties associated with this approach, in particular owing to technological progress in agriculture and uncertainties in population estimates, are quantified. About 5 million kmof natural vegetation are found to be transformed to agriculture between AD 800 and 1700, slightly more to cropland (mainly at the expense of forested area) than to pasture (mainly at the expense of natural grasslands). Historical events such as the Black Death in Europe led to considerable dynamics in land cover change on a regional scale. The reconstruction can be used with global climate and ecosystem models to assess the impact of human activities on the Earth system in preindustrial times.

DOI

[36]
Ramankutty N, Foley J A, 1999. Estimating historical changes in global land cover: Croplands from 1700 to 1992.Global Biogeochemical Cycles, 13(4): 997-1027.Baethge C, Marx C.

DOI

[37]
Regmi M C, 1972. A Study in Nepali Economic History 1768-1846. Delhi, India: Adroit Publishers.

[38]
Sharma K, Khanal S, 2010. A review and analysis of existing legal and policy issues related to land tenure and agriculture in Nepal.Kathmandu University Journal of Science, Engineering and Technology, 6(2): 133-141.

[39]
Thapa R B, Murayama Y, 2009. Examining spatiotemporal urbanization patterns in Kathmandu Valley, Nepal: Remote sensing and spatial metrics approaches.Remote Sensing, 1(3): 534-556.This paper examines the spatiotemporal pattern of urbanization in Kathmandu Valley using remote sensing and spatial metrics techniques. The study is based on 33-years of time series data compiled from satellite images. Along with new developments within the city fringes and rural villages in the valley, shifts in the natural environment and newly developed socioeconomic strains between residents are emerging. A highly dynamic spatial pattern of urbanization is observed in the valley. Urban built-up areas had a slow trend of growth in the 1960s and 1970s but have grown rapidly since the 1980s. The urbanization process has developed fragmented and heterogeneous land use combinations in the valley. However, the refill type of development process in the city core and immediate fringe areas has shown a decreasing trend in the neighborhood distances between land use patches, and an increasing trend towards physical connectedness, which indicates a higher probability of homogenous landscape development in the upcoming decades.

DOI

[40]
Thapa R B, Murayama Y, 2010. Drivers of urban growth in the Kathmandu valley, Nepal: Examining the efficacy of the analytic hierarchy process.Applied Geography, 30(1): 70-83.This article explores the driving factors of urban growth in Kathmandu Valley using analytic hierarchy process. The dynamic pattern of urban growth in the valley has been greatly influenced by seven driving factors: physical conditions, public service accessibility, economic opportunities, land market, population growth, political situation, and plans and policies. These factors have played important yet different roles in the city core, fringe, and rural areas. Among these factors, economic opportunities in the core, population growth in the fringe, and the political situation in the rural areas are identified as the highest impact factors of urban growth. Due to the lesser land availability in the city core, the land market factor had a smaller role in the core compared to the fringe and rural areas. The plans and policies factor is evaluated as minimally effective in all thematic areas. The physical condition factor had a low impact in the city core and fringe areas, but played a larger role than the economic opportunities, public service accessibility, and plans and policies in the rural areas. Due to spatial disparities in the public service establishments in the valley, the public services accessibility factor had a low impact in the rural area. A representative model of driving factors is presented to explain the overall relationship between the factors in the urban growth process of the metropolitan region.

DOI

[41]
Wei X Q, Ye Y, Zhang Qet al., 2015. Methods for cropland reconstruction based on gazetteers in the Qing Dynasty (1644-1911): A case study in Zhili province, China.Applied Geography, 65: 82-92.61We establish a methodological framework for historical cropland cover reconstruction based on gazetteers.61Zhiliprovince in the Qing dynasty (1644–1911) is the example to apply the methodological framework.61We produce the cropland area data at the county level in 1677, 1755 and 1884 inZhiliprovince.

DOI

[42]
Whelpton J, 2005. A History of Nepal. Cambridge University Press.

[43]
World Bank, 2015.Nepal total population and GDP per capita (current US$), 2015. World Bank, .

[44]
Wu X, Gao J G, Zhang Y Let al., 2017. Land cover status in the Koshi River Basin, Central Himalayas.Journal of Resources and Ecology, 8(1): 10-19.The Koshi River Basin is in the middle of the Himalayas,a tributary of the Ganges River and a very important cross-border watershed.Across the basin there are large changes in altitude,habitat complexity,ecosystem integrity,land cover diversity and regional difference and this area is sensitive to global climate change.Based on Landsat TM images,vegetation mapping,field investigations and 3S technology,we compiled high-precision land cover data for the Koshi River Basin and analyzed current land cover characteristics.We found that from source to downstream,land cover in the Koshi River Basin in 2010 was composed of water body(glacier),bare land,sparse vegetation,grassland,wetland,shrubland,forest,cropland,water body(river or lake) and built-up areas.Among them,grassland,forest,bare land and cropland are the main types,accounting for 25.83%,21.19%,19.31% and 15.09% of the basin's area respectively.The composition and structure of the Koshi River Basin land cover types are different between southern and northern slopes.The north slope is dominated by grassland,bare land and glacier;forest,bare land and glacier are mainly found on northern slopes.Northern slopes contain nearly seven times more grassland than southern slopes;while 97.13% of forest is located on southern slopes.Grassland area on northern slope is 6.67 times than on southern slope.The vertical distribution of major land cover types has obvious zonal characteristics.Land cover types from low to high altitudes are cropland,forest,Shrubland and mixed cropland,grassland,sparse vegetation,bare land and water bodies.These results provide a scientific basis for the study of land use and cover change in a critical region and will inform ecosystem protection,sustainability and management in this and other alpine transboundary basins.

DOI

[45]
Yang X H, Jin X B, Guo B Bet al., 2015. Research on reconstructing spatial distribution of historical cropland over 300 years in traditional cultivated regions of China.Global and Planetary Change, 128: 90-102.61Apply a constrained Cellular Automata model to reconstruct the spatial–temporal distribution of historical cropland61Partitioned reconstruction reflected the spatial difference of cropland evolving rule and rate61Take into account the continuous distribution of cropland and spatial constraints61High-resolution historical cropland patterns reconstructed for traditional cultivated region, China.

DOI

[46]
Zhang X Z, He F N, Li S C, 2013. Reconstructed cropland in the mid-eleventh century in the traditional agricultural area of China: Implications of comparisons among datasets.Regional Environmental Change, 13(5): 969-977.Abstract<br/><p class="a-plus-plus">Reconstructions of historical cropland area and spatial distribution are necessary for studying human effects on the environment due to agricultural development. To understand the current status of reconstructions of cropland area and its spatial distribution in the mid-eleventh century in the traditional agricultural area of China, we compared three available datasets: the historic cropland inventories-based HE dataset, the population-based History Database of the Global Environment (HYDE) dataset, and the PJ dataset. The results indicate that the HYDE and PJ datasets estimated the regional mean cropland area fraction (a ratio of cropland area to total land area, hereafter, CAF) for the study area to be 0.12 and 0.09, respectively, both of which were lower than the HE estimation of 0.18. Moreover, both the HYDE and PJ datasets have a poor ability to capture the spatial distribution of the historical CAF. The HYDE dataset overestimated the cropland area in North China and underestimated the cropland area in the Yangtze River reach. The HYDE dataset also overestimated the cropland area along the great rivers in North China. The PJ dataset underestimated the cropland area in the old agricultural area and overestimated the cropland area in the relatively new agricultural area. These incorrect spatial distributions from the HYDE and PJ datasets mainly resulted from the underestimation of the historical population and an incorrect approach for the spatial allocation of cropland within China. The incorrect approach was mainly derived from a poor understanding of the historic spatial distribution of cropland. Using the expert knowledge of local historians may be an effective method to reduce the uncertainties in the global historic cropland reconstruction.</p><br/>

DOI

Outlines

/