
Journal of Geographical Sciences >
Air transportation in China: Temporal and spatial evolution and development forecasts
Author: Wu Xiangli (1964-), Professor, specialized in urbanization and regional development. E-mail: jndxwxl@163.com
Received date: 2018-01-10
Accepted date: 2018-03-30
Online published: 2018-10-25
Supported by
National Natural Science Foundation of China, No.41171433
Philosophy and Social Science Foundation of China, No.16BJY039
Copyright
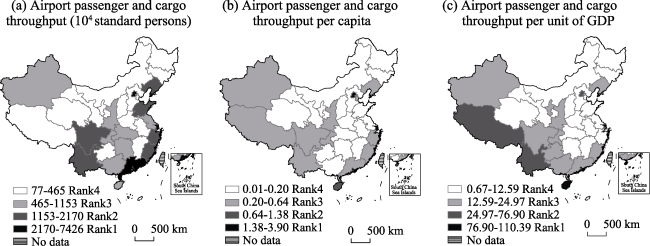
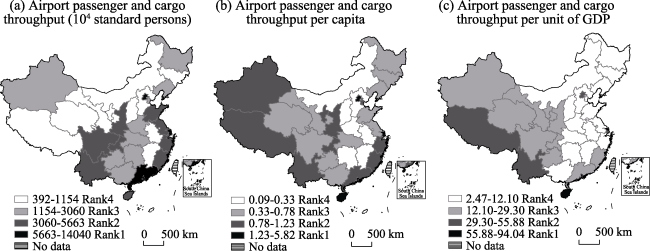
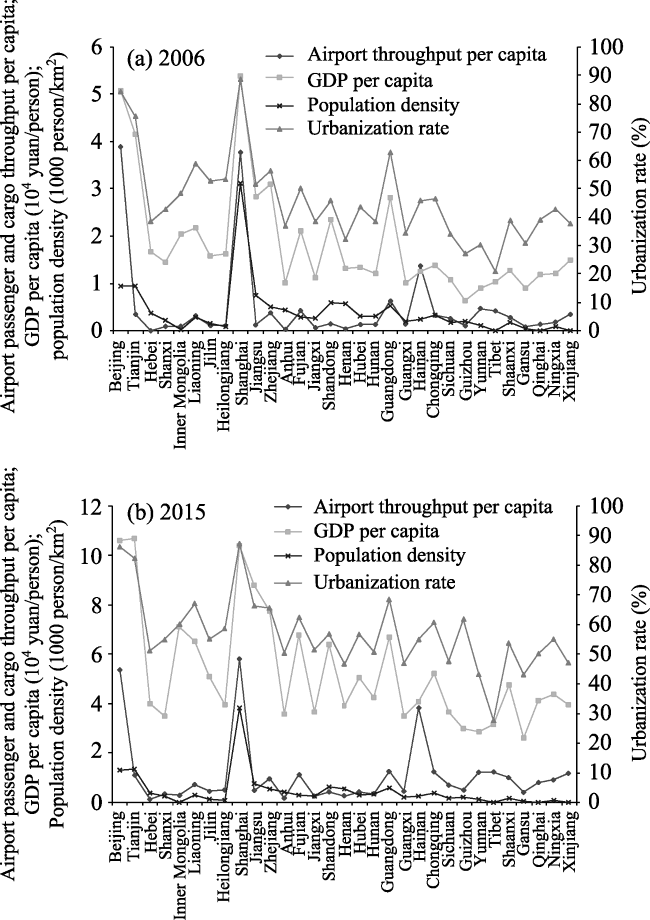
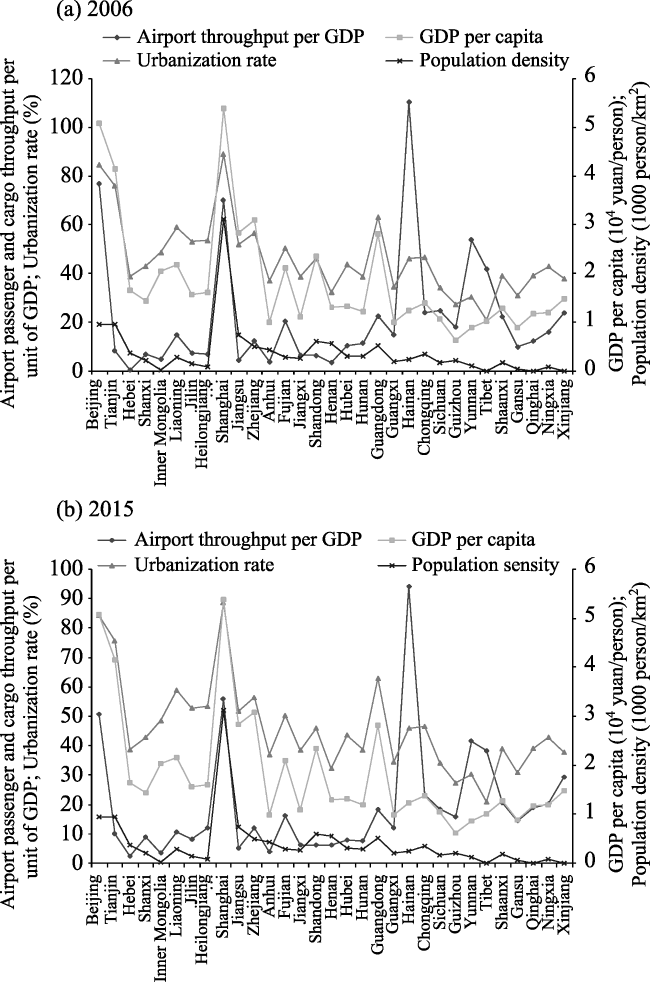
This paper analyses the features and dynamic changes of the spatial layout of air transportation utilization among different provinces in China. It makes use of data for the airport throughput and socio-economic development of every province throughout the country in the years 2006 and 2015, and employs airport passenger and cargo throughput per capita and per unit of GDP as measures of regional air transportation utilization, which is significant for refining indicators of regional air transportation scale and comparing against them. It also analyzes the spatial differences of coupling between the regional air transportation utilization indicators and the key influencing factors on regional air transportation demand and utilization, which include per capita GDP, urbanization rate, and population density. Based on these key influencing factors, it establishes a multiple linear regression model to conduct forecasting of each province’s future airport passenger and cargo throughput as well as throughput growth rates. The findings of the study are as follows: (1) Between 2006 and 2015, every province throughout the country showed a trend of year on year growth in their airport passenger and cargo throughput per capita. Throughput per capita grew fastest in Hebei, with a rise of 780%, and slowest in Beijing, with a rise of 38%. Throughput per capita was relatively high in western and southeastern coastal regions, and relatively low in northern and central regions. Airport passenger and cargo throughput per unit of GDP showed growth in provinces with relatively slow economic development, and showed negative growth in provinces with relatively rapid economic development. Throughput per unit of GDP grew fastest in Hebei, rising 265% between 2006 and 2015, and Hunan had the fastest negative growth, with a fall of 44% in the same period. Southwestern regions had relatively high throughput per unit of GDP, while in central, northern, and northeastern regions it was relatively low. (2) Strong correlation exists between airport passenger and cargo throughput per capita and per capita GDP, urbanization rate, and population density. Throughput per capita has positive correlation with per capita GDP and urbanization rate in all regions, and positive correlation with population density in most regions. Meanwhile, there is weak correlation between airport passenger and cargo throughput per unit of GDP and per capita GDP, urbanization rate, and population density, with positive correlation in some regions and negative correlation in others. (3) Between 2015 and 2025, it is estimated that all provinces experience a trend of rapid growth in their airport passenger and cargo throughput. Inner Mongolia and Hebei will see the fastest growth, rising 221% and 155%, respectively, while Yunnan, Sichuan, and Hubei will see the slowest growth, with increases of 62%, 63%, and 65%, respectively.
WU Xiangli , MAN Shan . Air transportation in China: Temporal and spatial evolution and development forecasts[J]. Journal of Geographical Sciences, 2018 , 28(10) : 1485 -1499 . DOI: 10.1007/s11442-018-1557-y
Table 1 Comparison of the highest, lowest, and average values of airport passenger and cargo throughput and regional air transportation utilization in 2006 and 2015 |
| Year | Value | Airport throughput (Million standard persons) | Airport throughput per capita | Airport throughput per unit of GDP |
|---|---|---|---|---|
| 2006 | Highest | Shanghai 742.55 | Beijing 3.9 | Hainan 110.38 |
| Lowest | Hebei 7.77 | Hebei 0.01 | Hebei 0.68 | |
| 2015 | Highest | Shanghai 1403.98 | Shanghai 5.81 | Haian 94.03 |
| Lowest | Tibet 39.248 | Hebei 0.10 | Hebei 2.47 |
Figure 1 Comparison of airport passenger and cargo throughput and regional air transportation utilization in 2006 |
Figure 2 Comparison of airport passenger and cargo throughput and regional air transportation utilization in 2015 |
Table 2 Comparison of airport passenger and cargo throughput and regional air transportation utilization rank between China’s provinces |
| Province | Airport passenger and cargo throughput rank | Airport throughput per capita rank | Airport throughput per unit of GDP rank |
|---|---|---|---|
| Shandong | 2 | 3 | 4 |
| Jiangsu | 2 | 3 | 4 |
| Hainan | 2 | 1 | 1 |
| Xinjiang | 3 | 2 | 3 |
| Tibet | 4 | 2 | 2 |
Figure 3 Graphs of airport passenger and cargo throughput per capita and per capita GDP, urbanization rate, and population density in 2006 and 2015 |
Figure 4 Graphs of airport passenger and cargo throughput per unit of GDP and per capita GDP, urbanization rate, and population density in 2006 and 2015 |
Table 3 Correlation analysis of regional air transportation utilization and per capita GDP, urbanization rate, and population density in each province |
| Province | Airport passenger and cargo throughput per capita | Airport passenger and cargo throughput per unit of GDP | ||||
|---|---|---|---|---|---|---|
| GDP per capita | Urbanization rate | Population density | GDP per capita | Urbanization rate | Population density | |
| Beijing | 0.964** | 0.972** | 0.986** | -0.982** | -0.905** | -0.948*** |
| Tianjin | 0.952** | 0.939** | 0.967** | -0.202 | -0.219 | -0.151 |
| Hebei | 0.988** | 0.961** | 0.989** | 0.983** | 0.948** | 0.992** |
| Shanxi | 0.970** | 0.994** | 0.946** | 0.542 | 0.690 | 0.531 |
| Inner Mongolia | 0.7220* | 0.694* | 0.690** | 0.144 | 0.118 | 0.114 |
| Liaoning | 0.998** | 0.989** | 0.939** | -0.975** | -0.952** | -0.961** |
| Jilin | 0.974** | 0.945** | 0.903** | 0.015 | 0.408 | -0.067 |
| Heilongjiang | 0.952** | 0.972** | -0.021 | 0.757* | 0.850** | -0.256 |
| Shanghai | 0.961** | 0.039 | 0.897** | -0.857** | -0.141 | -0.862** |
| Jiangsu | 0.992** | 0.969** | 0.954** | 0.122 | 0.078 | 0.125 |
| Zhejiang | 0.981** | 0.961** | 0.907** | -0.496 | -0.514 | -0.576 |
| Anhui | 0.996** | 0.989** | -0.243 | 0.009 | -0.011 | 0.169 |
| Fujian | 0.998** | 0.989** | 0.994** | -0.871** | -0.888** | -0.881** |
| Jiangxi | 0.998** | 0.993** | 0.980** | -0.115 | -0.110 | -0.165 |
| Shandong | 0.991** | 0.992** | 0.993** | -0.542 | -0.468 | -0.495 |
| Henan | 0.978** | 0.980** | 0.459 | 0.937** | 0.945** | 0.510 |
| Hubei | 0.976** | 0.948** | 0.975** | -0.886** | -0.928** | -0.824** |
| Hunan | 0.984** | 0.978** | 0.977** | -0.921** | -0.911** | -0.894** |
| Guangdong | 0.995** | 0.965** | 0.952** | -0.897** | -0.847** | -0.901** |
| Guangxi | 0.992** | 0.987** | -0.148 | -0.850** | -0.840** | 0.255 |
| Hainan | 0.983** | 0.996** | 0.988** | -0.843** | -0.771** | -0.808** |
| Chongqing | 0.996** | 0.990** | 0.995** | -0.525 | -0.538 | -0.532 |
| Sichuan | 0.983** | 0.985** | -0.010 | -0.832** | -0.834** | 0.301 |
| Guizhou | 0.994** | 0.867** | -0.566 | -0.209 | -0.105 | 0.610 |
| Yunnan | 0.916** | 0.962** | 0.950** | -0.724* | -0.722* | -0.755** |
| Tibet | 0.969** | 0.920** | 0.958** | 0.073 | 0.130 | 0.045 |
| Shaanxi | 0.988** | 0.992** | 0.994** | -0.644* | -0.620 | -0.544 |
| Gansu | 0.945** | 0.972** | 0.988** | 0.542 | 0.625 | 0.696* |
| Qinghai | 0.983** | 0.987** | 0.994** | 0.906** | 0.916** | 0.934** |
| Ningxia | 0.991** | 0.996** | 0.995** | 0.722* | 0.758* | 0.976** |
| Xinjiang | 0.982** | 0.968** | 0.960** | 0.680* | 0.705* | 0.670* |
Note: ** represents notable correlation above 0.01, * represents notable correlation above 0.5 |
Table 4 Predictions of each province’s airport passenger and cargo throughput in 2025 |
| Province | 2025 airport passenger and cargo throughput (106 standard persons) | 2015-2025 growth rate | Province | 2025 airport passenger and cargo throughput (106 standard persons) | 2015-2025 growth rate |
|---|---|---|---|---|---|
| Guangdong | 237.05 | 0.7759 | Hubei | 38.90 | 0.6539 |
| Shanghai | 232.82 | 0.6583 | Tianjin | 36.82 | 1.2010 |
| Beijing | 207.13 | 0.7763 | Guangxi | 35.06 | 0.7239 |
| Yunnan | 91.66 | 0.6186 | Heilongjiang | 31.78 | 0.7483 |
| Zhejiang | 90.42 | 0.7479 | Guizhou | 27.92 | 0.6788 |
| Sichuan | 89.68 | 0.6247 | Shanxi | 22.45 | 0.9607 |
| Fujian | 77.79 | 0.8441 | Inner Mongolia | 20.70 | 2.2121 |
| Chongqing | 70.24 | 0.9155 | Jiangxi | 20.36 | 0.9311 |
| Shandong | 69.37 | 0.7510 | Jilin | 20.18 | 0.7494 |
| Shaanxi | 67.16 | 0.8059 | Hebei | 18.80 | 1.5541 |
| Jiangsu | 64.89 | 0.7830 | Gansu | 17.04 | 0.7272 |
| Hainan | 61.75 | 0.7734 | Anhui | 15.69 | 0.7914 |
| Xinjiang | 55.28 | 1.0230 | Ningxia | 12.28 | 1.0781 |
| Liaoning | 53.89 | 0.7612 | Qinghai | 9.78 | 1.1271 |
| Henan | 42.49 | 0.8399 | Tibet | 7.4 | 0.8963 |
| Hunan | 39.42 | 0.7729 |
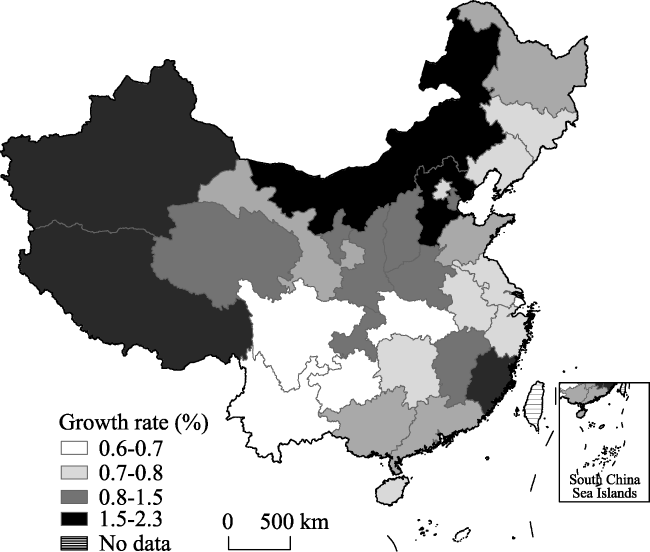
Figure 5 Spatial distribution of airport passenger and cargo throughput growth rates between 2015 and 2025 |
The authors have declared that no competing interests exist.
| [1] |
|
| [2] |
|
| [3] |
|
| [4] |
|
| [5] |
|
| [6] |
|
| [7] |
|
| [8] |
|
| [9] |
|
| [10] |
|
| [11] |
|
| [12] |
|
| [13] |
|
| [14] |
|
| [15] |
|
| [16] |
|
| [17] |
|
| [18] |
|
| [19] |
|
| [20] |
|
| [21] |
|
| [22] |
|
| [23] |
|
| [24] |
|
| [25] |
|
| [26] |
|
| [27] |
|
| [28] |
|
| [29] |
|
| [30] |
|
| [31] |
|
| [32] |
|
/
| 〈 |
|
〉 |