Orginal Article

Assessment and determinants of per capita household CO2 emissions (PHCEs) based on capital city level in China

  • LIU Lina , 1, 2 ,
  • QU Jiansheng , 1, 2* ,
  • ZHANG Zhiqiang 1 ,
  • ZENG Jingjing 1, 2 ,
  • WANG Jinping 1 ,
  • DONG Liping 1 ,
  • PEI Huijuan 1 ,
  • LIAO Qin 1
Expand
  • 1. Information Center for Global Change Studies, Lanzhou Information Center, CAS, Lanzhou 730000, China
  • 2. Key Laboratory of Western China’s Environmental Systems, College of Earth and Environmental Sciences, Lanzhou University, Lanzhou 730000, China
*Corresponding author: Qu Jiansheng, PhD, specialized in sustainable development and energy policy. E-mail:

Author: Liu Lina, PhD, specialized in low-carbon economy and energy policy. E-mail:

Received date: 2017-02-24

  Accepted date: 2017-09-28

  Online published: 2018-10-25

Supported by

National Key Research and Development Program, No.2016YFA0602803

National Natural Science Foundation of China, No.41371537

The Fundamental Research Funds for the Central Universities, No.lzujbky-2016-257

The Fundamental Research Funds for the Central Universities, No.lzu-jbky-2017-it106

Copyright

Journal of Geographical Sciences, All Rights Reserved

Abstract

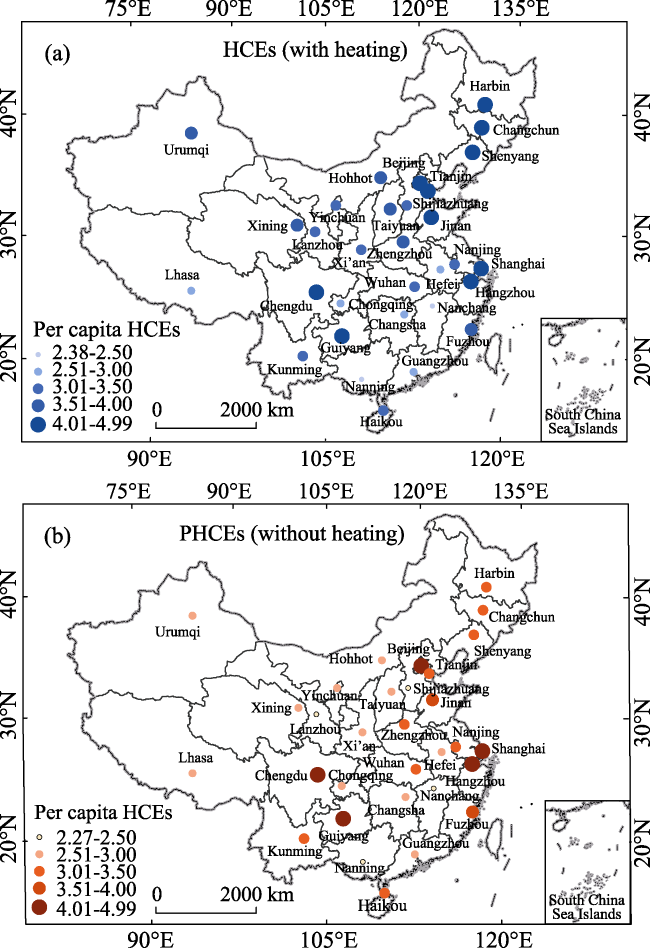
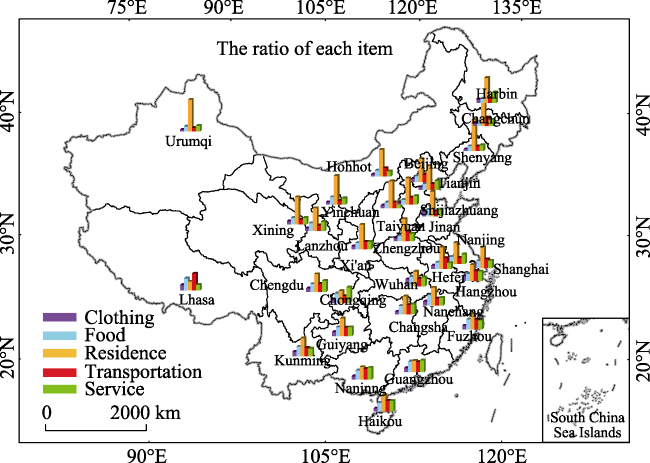
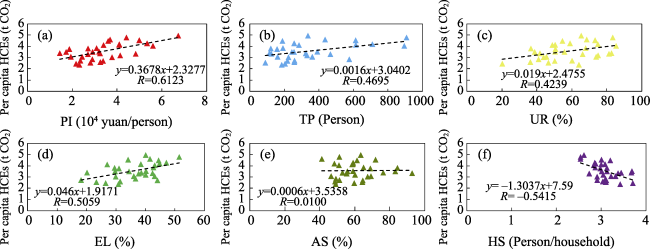
Household CO2 emissions were increasing due to rapid economic growth and different household lifestyle. We assessed per capita household CO2 emissions (PHCEs) based on different household consuming demands (including clothing, food, residence, transportation and service) by using provincial capital city level survey data in China. The results showed that: (1) there was a declining trend moving from eastward to westward as well as moving from northward to southward in the distribution of PHCEs. (2) PHCEs from residence demand were the largest which accounted for 44% of the total. (3) Correlation analysis and spatial analysis (Spatial Lag Model (SLM) and Spatial Error Model (SEM)) were used to evaluate the complex determinants of PHCEs. Per capita income (PI) and household size (HS) were analyzed as the key influencing factors. We concluded that PHCEs would increase by 0.2951% and decrease by 0.5114% for every 1% increase in PI and HS, respectively. According to the results, policy-makers should consider household consuming demand, income disparity and household size on the variations of PHCEs. The urgency was to improve technology and change household consuming lifestyle to reduce PHCEs.

Cite this article

LIU Lina , QU Jiansheng , ZHANG Zhiqiang , ZENG Jingjing , WANG Jinping , DONG Liping , PEI Huijuan , LIAO Qin . Assessment and determinants of per capita household CO2 emissions (PHCEs) based on capital city level in China[J]. Journal of Geographical Sciences, 2018 , 28(10) : 1467 -1484 . DOI: 10.1007/s11442-018-1556-z

1 Introduction

China has become the world’s largest CO2 emitter (Guan et al., 2009). Since 2007, the Chinese government has proposed the ‘ecological civilization’ to reduce its carbon emissions. At the Copenhagen Climate Conference in 2009, the Chinese government established a 40%-45% reducing CO2 emissions intensity target by 2020 based on the level in 2005 due to fast growing CO2 emissions. During the APEC (Asia-Pacific Economic Cooperation) Summit in 2014, China pledged that emissions would peak around 2030 and pledge to peak early. On the one hand, global warming, which was mainly caused by anthropogenic CO2 emissions, affected the sustainable development both in China and in other countries (IPCC, 2006; Dietz et al., 2009). On the other hand, China, as the largest developing country in the world, faced the great pressures on reducing carbon emissions (Liu et al., 2016). As such reasons, studies concerning the nexus between climate change, carbon emissions and the related impacts have been undertaken in the world (Liu et al., 2016; Shen et al., 2016).
Studies of CO2 emissions were concentrated on the industrial sector, but recently, the researches on CO2 emissions reduction have turned to the household sector (Wei et al., 2007; Qu et al., 2013; Wiedenhofer et al., 2017). Vringer and Bolk (1995) first calculated household CO2 emissions from direct and indirect household energy usage in the Netherlands based on the statistical data. After this study, various scholars focused on carbon emissions from residential uses, e.g., that analyzed in Australia (Lenzen, 1998), European Union countries (Reinders et al., 2003; Kerkhof et al., 2009), Brazil (Cohen et al., 2005), USA (Bin and Dowlatabadi, 2005; Underwood, 2013), India (Kadian et al., 2007) and China (Wei et al., 2007; Liu et al., 2011; Zhu et al., 2012; Tian et al., 2014; Qu et al., 2015; Wiedenhofer et al., 2017; Liu et al., 2017). From what mentioned above, a variety of assessment methods for CO2 emissions from household consumption were established, including the IPCC’s Reference Approach (IPCC, 2006; Kadian et al., 2007), the Input-Output Analysis (Liu et al., 2011; Qu et al., 2013), and the Consumer Lifestyle Approach (Bin and Dowlatabadi, 2005; Wei et al., 2007). More and more emissions from human activity were due to the accelerated economic and fast-growth living standards which attributed to the use of more energy both in direct and indirect household consumption (Liu et al., 2011; Zhu et al., 2012; Tian et al., 2014). Tian et al. (2014) showed that CO2 emissions from household sector accounted for 35% of the total in China. Low-carbon consumption and low-carbon lifestyle were crucial ways to achieve its sustainable consumption and sustainable development. It was why transforming household lifestyle was essential to reduce its carbon emission (Wiedenhofer et al., 2017). However, these studies, dating from statistical macro-consumption data, only reflected the difference between regions or nations but they did not reflect the difference among different households (Qu et al., 2013).
Weber and Matthews (2008) found that income and expenditure were the key predictors of CO2 emissions by using the United States’ consumer expenditure survey data. Fahmy et al. (2011) first offered the integrated analysis on household CO2 emissions (HCEs) according to entirely nationally representative survey data including household, private cars, public transportation and the domestic and international aviation energy usage in the UK. Their work demonstrated that CO2 emissions from household energy usage varied in different socio-economic and demographic conditions (Fahmy et al., 2011). Qu et al. (2013) assessed HCEs of arid areas and explored the determinants such as income, family size in China. They reported that HCEs increased with rising income and decreased with larger household size (Qu et al., 2013). Xu et al. (2015) pointed out that income, demography and consuming behavior were the key determinants on urban HCEs by analyzing the questionnaire survey data in the Yangtze River Delta. Li et al. (2016) showed that per capita income and carbon intensity were the main impacts on HCEs in Northwest China. Household, as the basic unit of society, better reflected the inequalities for their differences in consuming demand, income and demographic factors (Qu et al., 2013).
Recently, researchers have turned to focus on the analysis of determinants and mitigation measures on HCEs including LMDI (Logarithmic Mean Divisia Index) model (Zha et al., 2010; Wang et al., 2015; Zhu et al., 2015), STIRPAT (Stochastic Impacts by Regression on Population, Affluence and Technology) model (Wang et al., 2014; Wang et al., 2016), Shapley decomposition (Han et al., 2015), SDA (Structural Decomposition Analysis) model (Yuan et al., 2015), AWD (Adaptive Weighting Divisia) model (Fan et al., 2013), SOFM (self-organizing feature map) model (Fan et al., 2014), and EPDM (Econometric Panel Data Models) (Li et al., 2015; Hao et al., 2016), etc. Various researchers explored the determinants of HCEs based on national, regional, and one city scale. Cities, considered as the main contributors to CO2 emissions, accounted for about 85% of the total in China (Shan et al., 2017). However, previous studies neglected the issue on the determinants of city level HCEs from the spatial regression analysis. Assessment of cities’ HCEs based on survey data was needed for designing related policies and providing effective measures on CO2 emission reduction from different households.
In China, most spatial analysis on CO2 emissions concentrated on energy carbon emissions. Chuai et al. (2012) pointed out that the trend of global spatial autocorrelation on CO2 emissions increased during the 1997-2009 period. Cheng et al. (2014) showed that there was a growing spatial agglomeration in China’s carbon intensity. Energy usage and CO2 emissions from household sector accounted for 27% and 17% of the total amount at the global level, respectively (Nejat et al., 2015). Moreover, CO2 emissions from household sector accounted for 35% of the total in China (Tian et al., 2014). It was vital to explore the impact mechanism of HCEs for setting the carbon reduction targets. In China, urban area, as production and habitation center, was gradually replacing rural area. Many scholars searched for effective carbon mitigation strategies by analyzing urban settlements’ energy consumption patterns (Fan et al., 2012; Golley and Meng, 2012). This paper aimed to further understand the determinants of city level PHCEs by using Spatial Lag Model (SLM) and Spatial Error Model (SEM) based on 31 provincial capital cities’ survey data in China.
Two key questions were addressed. (1) What was the current distribution of PHCEs from provincial capital cities in China? We answered this question through calculating HCEs at per capita indicator based on different household consuming demand. (2) Which factor influenced the distribution of PHCEs? We answered this question in two ways: the first was the correlation analysis comparing the correlation coefficients between PHCEs and the explanatory variables; the second was the spatial regression models (SLM and SEM) evaluating the impacts of different determinants (such as, per capita income (PI), household size (HS), total population (TP), urban and rural structure (UR), education level (EL)) on PHCEs.
The main contributions of this work were as follows: (1) we collected 3543 household survey data by using a simple random sampling technique; (2) we divided PHCEs into five parts based on different household consuming demand including clothing, food, residence, transportation and service; (3) we explored the determinants of PHCEs both with correlation analysis and spatial regression analysis. The results including assessment and determinants of PHCEs yielded deep insights into impacts on PHCEs, which gave certain policy implications to policy-makers and scientific researchers for making a long-term carbon reduction strategy and climate change mitigation.
The remainder of this study was organized as follows. Section 2 presented the study area and methodology. Section 3 gave the assessment of PHCEs from provincial capital cities and discussed the related determinants. Sections 4 and 5 offered discussion and conclusions.

2 Data and methodology

2.1 Data

In this work, we chose 31 provincial capital cities in China as our study area. Three key issues were addressed: (1) we used a simple random sampling technique to select survey samples. Face-to-face interviews were conducted to obtain questionnaire survey data in each provincial capital city. (2) We chose a sampling ratio of 1/20,000 as the criterion in each provincial capital city. This sampling ratio looked small but the samples could give the characteristics of household energy usage and household consuming demand in the research area. The samples were enough for this benchmarking study. (3) We used reliability and validity test to give the availability of data used in this work. Cronbach’s alpha coefficient was 0.73, which was calculated by using Software SPSS22. This showed that the survey data used in this work was reliable.
Based on the aforementioned three questions, 3543 households survey data were analyzed in different provincial capital cities between the end of 2011 and early 2013. Since the data gathered in this work were mostly in 2012, the year 2012 was set as the research period. Interview survey data included: (1) household energy usage and household consumption data consisting of clothing (clothing consumption), food (food consumption), residence (the usage of coal, gas and the consumption of electricity, heating, water and household facilities), transportation (the usage of oil and the consumption of transportation and communication) and service (the consumption of education, culture and recreation, and health and medical services) based on different household consuming demands. (2) The related influencing factors data consisting of per capita income (PI), total population (TP), urban and rural structure (UR), household size (HS), education level (EL) and age structure (AS) were shown in Figure 1. The survey households provided a good representation of the target samples.
Figure 1 The related impacts on per capita household CO2 emissions
Provincial capital city, as one of the most significant cities, had its own unique identity. In the process of accelerated urbanization, energy usage and carbon emissions varied considerably in the future. It was a long-term task for energy conservation and carbon emissions reduction, especially in household sector (Qu et al., 2013; Li et al., 2015). How to reduce CO2 emissions was crucial for administrators and policy-makers in the context of fast-growth urbanization. This work was a pioneering effort to choose provincial capital cities in China as study objectives to examine assessment and determinants on PHCEs.

2.2 Estimation of HCEs

Qu et al. (2013) gave a definition of “Household CO2 emissions” both including direct and indirect emissions from direct household usage and indirect household consumption. Same as the previous studies, household CO2 emissions in this work also included direct and indirect emissions from the household sector. However, the difference was that we divided household CO2 emissions into five parts by comparing different household consuming demand including clothing, food, residence, transportation and service in this work (Figure 2) (Jones et al., 2011; Jones et al., 2013). CPHCEs (per capita clothing household CO2 emissions) represented PHCEs induced by household clothing consumption. FPHCEs (per capita food household CO2 emissions) represented PHCEs induced by household food consumption. RPHCEs (per capita residence household CO2 emissions) represented PHCEs induced in three ways: (1) household coal and gas usage; (2) household electricity and heating consumption and (3) household water and household facilities consumption. TPHCEs (per capita transportation household CO2 emissions) represented PHCEs induced by two ways: (1) household oil including gasoline and diesel usage and (2) household transportation and communication consumption. SPHCEs (per capita service household CO2 emissions) represented PHCEs induced by education, culture and recreation and health, medical service consumption. The formula of assessment on PHCEs was shown as below:
\[PHCEs=CPHCEs+FPHCEs+RPHCEs+TPHCEs+SPHCEs\ (1) \]
where PHCEs, CPHCEs, FPHCEs, RPHCEs, TPHCEs and SPHCEs were the value of PHCEs from total, clothing, food, residence, transportation and service consumption, respectively (t CO2/person).
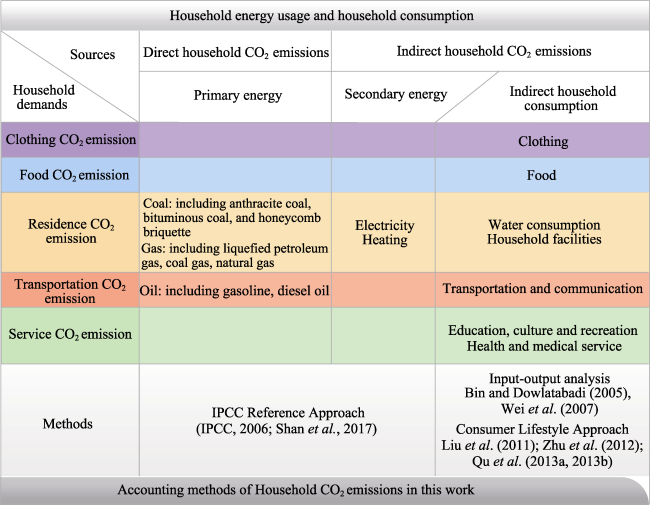
Figure 2 Accounting methods of household CO2 emissions used in this work
Household CO2 emissions from coal, oil, gas, electricity and heating were calculated based on the IPCC’s Reference Approach (IPCC, 2006; Shan et al., 2017).
\[{{E}_{i}}={{F}_{i}}\times NC{{V}_{i}}\times C{{C}_{i}}\times O{{F}_{i}}={{F}_{i}}\times {{C}_{i}}\ (2) \]
where Fi was the energy usage of household (104 t, 108 m3) (i=coal, oil, gas); CCi was the CO2 emission factor of the ith fuel (t CO2/104 t, 108 m3).
\[{{E}_{Elec}}={{F}_{Elec}}\times {{C}_{Elec}}\ (3) \]
where FElec was the electric power consumption (MWh); CElec was the CO2 emission factor of the electricity sector (t CO2/MWh), which came from the Baseline Emission Factor for regional power grids in China.
\[{{E}_{Heat}}={{M}_{Heat}}\times {{F}_{Heat}}\times {{C}_{Heat}}\times {{10}^{-3}}\ (4) \]
where MHeat was the coal consumption per unit area for heating (kg/m2); FHeat was the heating areas (m2); CHeat was the CO2 emission factor (kg CO2/kg), which was derived from Zhang et al. (2013).
Household CO2 emissions from household consumption were calculated by input-output analysis following Bin and Dowlatabadi (2005), Wei et al. (2007) and the consumer lifestyle approach following Liu et al. (2011), Zhu et al. (2012) and Qu et al. (2013).
\[{{E}_{HCj}}=\frac{Ej}{Pj}\times {{\left( I-A \right)}^{-1}}\times {{F}_{HCj}}={{F}_{HCj}}\times {{C}_{HCj}}\ (5) \]
where FHCj was the jth consumption of household (104 yuan); CHCj was the CO2 emissions factor from jth household consumption (t CO2/104 yuan); j was the jth household consumption.
Based on the formulas (2)-(5), RPHCEs, TPHCEs and SPHCEs were calculated as below:
\[RPHCEs={{E}_{Coal}}+{{E}_{Gas}}+{{E}_{Elec}}+{{E}_{Heat}}+{{E}_{Water}}+{{E}_{House}}\ (6) \]
where ECoal, EGas, EElec, EHeat, EWater and EHouse was PHCEs from household coal usage, gas usage, electricity usage, heating usage, water consumption and household facilities consumption, separately (t CO2/person).
\[TPHCEs={{E}_{Oil}}+{{E}_{Trans}}\ (7) \]
where EOil and ETrans were PHCEs from household oil usage and household transportation and communication consumption, separately (t CO2/person).
\[SPHCEs={{E}_{Cul\And Edu}}+{{E}_{Medical}}\ (8) \]
where ECul&Edu and EMedical were PHCEs from household education, culture and recreation consumption and health and medical service consumption, separately (t CO2/person).
Raw data for calculating CO2 emission factors were taken from China Energy Statistical Yearbook 2012 (NBSC, 2013; NDRC, 2007) and Input-output Tables of China 2012 (NBSC, 2015). PHCEs parameters of household fossil fuel usage and household consumption were shown in Table 1.
Table 1 The CO2 emission factors from the household sector used in this work
Items Value Unit Source
Anthracite coal 2.1625 t CO2/104 t Data source: The People’s Republic of China National Greenhouse Gas Inventory (NDRC, 2007);
Calculated by IPCC Reference Approach (IPCC, 2006; Shan et al., 2017).
Bituminous coal 1.9518 t CO2/104 t
Honeycomb briquette 1.6366 t CO2/104 t
Gasoline 3.0425 t CO2/104 t
Diesel oil 3.1469 t CO2/104 t
Coal gas 2.9509 t CO2/104 t
Liquefied petroleum gas 7.0493 t CO2/104 t
Natural gas 21.6502 t CO2/108 m3
Electricity / t CO2/MWh Data source: (CDMC, 2010)
Heating / t CO2/m2 Data source: Zhang et al., 2013
Food 0.77 t CO2/104 yuan Data source: China Energy Statistical Yearbook (NBSC, 2013) and Input- output Tables of China (NBSC, 2015);
Calculated by input-output analysis (Bin and Dowlatabadi, 2005; Wei et al., 2007)
Clothing 1.20 t CO2/104 Yuan
Water 2.13 t CO2/104 Yuan
Transportation and communication 2.33 t CO2/104 Yuan
Education, culture, and recreation 1.09 t CO2/104 Yuan
Health care and medical services 2.13 t CO2/104 Yuan
Household facilities 2.44 t CO2/104 Yuan

2.3 Spatial econometric models

SLM and SEM were introduced to analyze the influencing factors of PHCEs (Anselin, 1992; Chuai et al., 2012; Cheng et al., 2014). SLM reflected the observed values of adjacent areas, whereas SEM emphasized the spatial diffusion effect with spatial autocorrelation in the error terms.
The formula of SLM was shown as below:
\[Y=\rho {{W}_{y}}+\beta X+\varepsilon \ (9) \]
The formula of SEM was shown as below:
\[Y=\beta X+\varepsilon ,\varepsilon =\lambda {{W}_{y}}\varepsilon +\mu \ (10) \]
where Y represented the dependent variable; X represented the independent variables; Wy denoted the spatial weight matrix of n × n; ρ and λ represented the spatial autoregressive and autocorrelative parameter, respectively; β was the coefficient of independent variables; ε and μ were random errors, which were finally represented by a constant C.
Based on the aforementioned analysis, various variables were selected to estimate the relationship between them and PHCEs. Per capita income (PI), as a metric of economic affluence which had the most impact on PHCEs, was chosen in this study (Zha et al., 2010). Total population (TP), urban and rural structure (UR), household size (HS) and age structure (AS) were chosen to represent the demographic factors (Qu et al., 2013; Liu et al., 2017). Education level (EL), as a key factor influencing HCEs, was also identified (Qu et al., 2015; Li et al., 2016).
In this work, PI, TP, UR, HS, EL and AS were selected as the impact factors influencing PHCEs (Table 2). We gave the correlation coefficients between PHCEs and the related factors and then created SLM and SEM for evaluating their impacts on PHCEs in the following analysis.
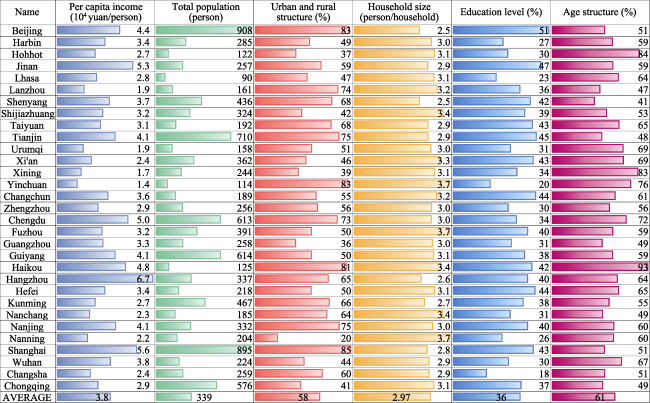
Table 2 The factors influencing PHCEs used in this work
Variables abbreviations Variables Interpretation Unit
PHCEs Per capita household CO2
emissions
Total household CO2 emissions/ population t CO2/person
PI Per capita income Total income/population 104 yuan/person
TP Total population Urban population Person
UR Urban and rural structure The proportion of urban population in total %
HS Household size Average persons in each household Person/household
EL Education level The proportion of population with college and higher-level education %
AS Age structure The proportion of population aged 15-49 %

3 Results

3.1 Assessment of capital city level PHCEs in China

We analyzed the characteristics of annual average PHCEs for all capital cities in China according to the assessment results (Figure 3). The annual average PHCEs of all provincial capital cities were 3.79 t CO2/person, which was related to clothing, food, residence, transportation and service consuming demand, being 0.27 t CO2/person, 0.56 t CO2/person, 1.67 t CO2/person, 0.60 t CO2/person and 0.68 t CO2/person, respectively. We found that PHCEs for residence consuming demand was the largest.
Figure 3 Annual average per capita household CO2 emissions in all capital cities in China (t CO2/person)
PHCEs of different provincial capital cities ranged from 2.38 t CO2/person (Nanchang) to 4.99 t CO2/person (Hangzhou), which differed by a factor of 2.10 times (Figures 4 and 5). We
found an interesting phenomenon that PHCEs decreased obviously in these provincial capital cities located in northern China (such as Xi’an, Lanzhou, Xining, Yinchuan and Urumqi located in Northwest China, Shijiazhuang, Zhengzhou, Taiyuan, Jinan, Tianjin, Beijing and Hohhot mainly located in Central and North China, Harbin, Changchun and Shenyang located in Northeast China) when we removed heating demand of PHCEs from the total. Because these cities needed the centralized heating usage in winter for keeping warm. That was why various provincial capital cities with the highest-group values of PHCEs located in North China.
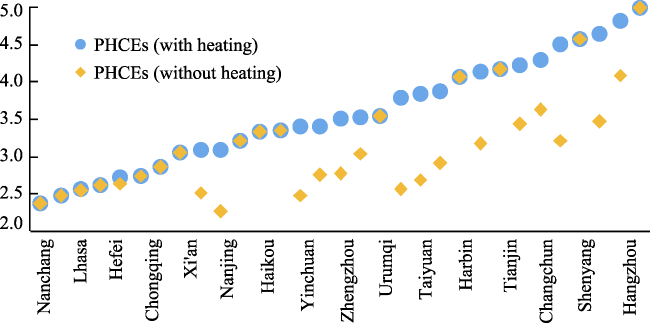
Figure 4 Comparing provincial capital city level PHCEs with heating and without heating consumption in China
Figure 5 Comparing spatial distribution of PHCEs with heating and without heating in provincial capital cities in China
We divided PHCEs into five groups in this work (Figure 5). The lowest-value group was less than 2.50 t CO2/person, which was located in some developing capital cities - Nanchang and Nanning. There were 10 provincial capital cities with the highest-value group (more than 4.01 t CO2/person), which were located in Northeast China (Harbin, Changchun and Shenyang), the Bohai Rim Region (Beijing and Tianjin), Eastern China (Jinan), Yangtze River Delta Region (Shanghai and Hangzhou), and in Southwest China (Chengdu and Guiyang). Interestingly, PHCEs of Guangzhou and Chongqing were similar to that of Lhasa, Hefei and Changsha, ranging from 2.51 to 3.00 t CO2/person. There were 14 provincial capital cities with the mid-value group (from 3.01 to 4.00 t CO2/person), situated in North China (Shijiazhuang, Taiyuan and Hohhot), Central China (Zhengzhou and Wuhan), Eastern China (Nanjing and Fuzhou) and Northwest China (Urumqi, Xining, Yinchuan, Lanzhou and Xi’an) where people needed to burn more coal in winter to keep warm. We found a declining trend moving from the east toward the middle and to the west as well as from the north to the south by comparing the distribution of PHCEs in provincial capital cities. We also had an interesting finding that highest-value group of PHCEs was mainly distributed in the Bohai Rim Region, Yangtze River Delta Region and Southwest China (Chengdu and Guiyang). The highest value group of PHCEs with heating was found in Harbin, Changchun and Shenyang located in Northeast China, while, these areas changed into the mid-value group because we removed heating from the total (Figure 5). Household lifestyle and household demand between different residents who live between South China and North China played a vital role in the contribution of PHCEs.
As noted above, PHCEs were divided by clothing, food, residence, transportation and service based on different household consuming demands. The proportion of each item in total reflected the contribution of various consuming demands to PHCEs between different residents. It clearly showed that clothing consuming demand made the smallest contribution to PHCEs in all provincial capital cities, which with the ratio no more than 15%, especially in Urumqi, Shijiazhuang and Shenyang with the ratio no more than 5%. The ratio of food consuming demand in PHCEs was also small (around 20%); interestingly, the lowest ratio was no more than 10% in Harbin, Shijiazhuang, Shenyang and the highest ratio was more than 20% in Guangzhou, Nanning and Nanchang (Figure 6). Another interesting finding was that residence consuming behavior was the major contributor to PHCEs in all provincial capital cities except Lhasa, Guangzhou and Chongqing. We found that the provincial capital cities with lower PHCEs were also with lower HCEs from residence consuming and with higher HCEs from food consuming.
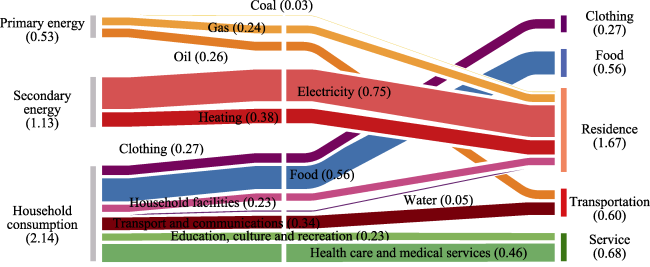
Figure 6 The ratio of each item to total per capita household CO2 emissions from provincial capital cities in China

3.2 Correlation analysis on the relationship between PHCEs and the explanatory variables

3.2.1 The impact of household consumption demand on PHCEs
To better understand the relationship between PHCEs and its consuming demand, in this work, we listed the correlation coefficients between the ratio of different consuming demands and PHCEs. The correlation coefficients of PHCEs versus the ratio of clothing, food, residence, transportation and service consuming demands were all positive, which implied that all these consuming demands contributed to CO2 emissions increasing from household sector (Figure 7).
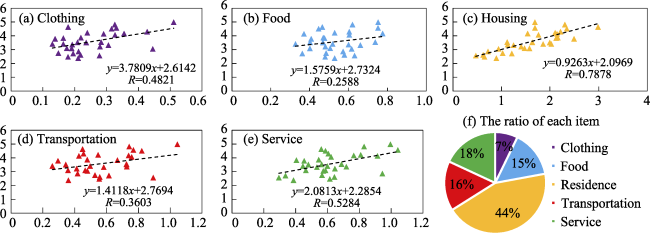
Figure 7 Scatter plots between PHCEs and from clothing (a), food (b), residence (c), transportation (d), service consuming demand (e), and the ratio of each item (f) in the total PHCEs
Comparing the correlation coefficients, we found that the relationships between food consuming demand, transportation consuming demand and PHCEs were rather weak. The relationships between clothing consuming demand, service consuming demand and PHCEs were a bit stronger, but were not very strong. As we expected, the correlation coefficient between PHCEs and residence consuming behavior was very strong, with R equal to 0.7878. That was why the provincial capital cities with lower PHCEs were also with lower HCEs from residence consuming behavior; the provincial capital cities with higher PHCEs were also with higher HCEs from residence consuming behavior. Those richer cities - Beijing, Tianjin, Xi’an, Harbin, Changchun and Shenyang with higher PHCEs also had higher HCEs from residence consuming behavior. However, Guangzhou and Chongqing were rich but had lower PHCEs, the main reason was that the household residents we interviewed had lower residence consuming demand. As for those not rich or poorer cities - Shijiazhuang, Hohhot, Taiyuan, Xining, Yinchuan and Urumqi, they were also with higher PHCEs than that in Guangzhou and Chongqing because the samples we collected had higher PHCEs from residence consuming demand, especially from heating demand in winter.
The ratio of clothing, food, residence, transportation and services consuming behavior to the total average PHCEs (Figure 7) was 7%, 15%, 44%, 16% and 18%, respectively. Moreover, PHCEs from gasoline accounted for 7% of the total PHCEs and occupy 43% in transportation by using private cars. We also found that the PHCEs from residence consuming behavior hold the biggest ratio of the total, while, 70% of them came from coal usage, heating usage and electricity usage. We deemed that PHCEs from housing consumption behavior were the most important driving force for the increased PHCEs of provincial capital cities according to the results of survey data above.
3.2.3 The impact of economic affluence and demographic factors on PHCEs
We listed the correlation coefficients between PHCEs and the related impacts (Figure 8). PI had the most significant positive effect on PHCEs by comparing the relationship between it and the related influencing factors. HS had a negative effect on PHCEs and AS almost had no relationship with PHCEs. TP, UR and EL also had a positive effect on PHCEs, but the importance was less than what PI showed.
Figure 8 Scatter plots between PHCEs and PI-per capita income(a), TP-total population (b), UR-urban and rural structure (c), EL-education level (d), AS-age structure (e); HS-household size (f)
The results showed that CO2 emissions varied due to age structure changes (Han et al., 2015) and increased association with fast-growth urbanization (Li et al., 2015) and high education level (Qu et al., 2013). On the one hand, TP and UR directly impacted residents’ lifestyle, i.e., more energy were used and more household products were purchased, which resulted in more HCEs. Li et al. (2015) pointed out that every 1% increase in urbanization accompanied with 2.9% and 1.1% increase in direct and indirect HCEs, separately. On the other hand, China was in the stage of rapid urbanization and industrialization, which brought more pressures on CO2 emissions reduction. From EL scale, some scholars viewed that higher education level would produce more HCEs than lower education level (Liu et al., 2017), while, others thought that groups with higher education reduced HCEs (Golley and Meng, 2012; Dai et al., 2012). We found that EL had a moderate positive effect on PHCEs according to the results in Figure 8. Among these influential factors of PHCEs above, the coefficients of PI and HS were significant, which indicated that these factors exerted the most influence on PHCEs.

3.3 Spatial analysis on the determinants of PHCEs

First, we chose PI, TP, UR, HS, AS and EL as this work’s significant influencing factors of PHCEs to create SLM and SEM for evaluating their impacts. Then we evaluated the equation of SLM and SEM by using the software GeoDa. In model SLM(i) and SEM(i), two most relevant variables - PI, HS- were included. In model SLM(ii) and SEM(ii), three most relevant variables -PI, HS, EL- were included. In model SLM (iii) and SEM (iii), we included all explanatory variables.
The values of R2, Akaike information criterion (AIC), and Schwartz criterion (SC) (Wooldridge, 2010) were chosen to assess the model fitness (Table 3). Based on the values of R2, AIC and SC between in SLM (i), SLM (ii) and SLM (iii) and in SEM (i), SEM (ii) and SEM (iii), we deemed that the models of SEM with explanatory variables were suitable to better explain the mechanism of PHCEs from provincial capital cities in China.
Table 3 Estimation of influencing factors on per capita household CO2 emissions by SLM and SEM
Explanatory SLM SEM
SLM(i) SLM(ii) SLM(iii) SEM(i) SEM(ii) SEM(iii)
ρ -0.1126 -0.1413 -0.1797**
C 5.5368*** 4.9599*** 4.1512*** 3.8121*** 3.6012*** 3.5437***
PI 0.2693*** 0.1893** 0.1132* 0.3818*** 0.3633*** 0.2951***
HS -0.8135** -0.7774** -0.6680* -0.4058 -0.4027 -0.5114*
EL 0.0230* 0.0173 0.0066 0.0042
TP -0.0006 -0.0001
UR -0.0018** 0.0004
AS 0.0133*
γ 0.6847*** 0.1559*** 0.0102
R2 0.47 0.52 0.59 0.59 0.59 0.61
AIC 55.88 55.26 55.66 49.85 -51.53 55.82
SC 61.62 62.43 67.14 54.15 57.26 65.85

* Significant at 10% level; ** Significant at 5% level; *** Significant at 1% level

The fifth column in Table 3 provided the SEM (i) estimation results. We found that PI was the key positive factor influencing PHCEs and HS was the key negative factor influencing PHCEs. Considering how EL impacted PHCEs, we added the impact factor EL to SEM (ii). We found that the impact of HS on PHCEs was not significant. Considering how economic affluence, demographic factors and education level affected PHCEs, we included all explanatory variables in SEM (iii). Every 1% increase in PI was associated with 0.2951% increase in PHCEs when other impact factors remained unchanged. We deemed that the elastic coefficient of HS’s spatial error was -0.5114, which implied the changes in HS in adjacent cities had negative influences on local PHCEs. HS was the key factor that had a negative effect on PHCEs. Every 1% increase in HS was associated with 0.5114% decrease in PHCEs when other influencing factors unchanged. The coefficients of EL, UR and AS were positive to PHCEs. Every 1% increase in EL, UR and AS could lead to 0.0042%, 0.0004% and 0.0102% increase in PHCEs, with this significant level being not obvious. The elastic coefficient of TP indicated that TP had a positive impact on PHCEs increasing, with the significant level being also not obvious.

4 Discussion

We discussed the analysing results of assessment and determinants of PHCEs based on capital city level in the following aspects.
(1) Residence consuming demand was the key contributor to PHCEs, which accounted for 44% of the total. An interesting finding from this survey was that provincial capital cities with lower PHCEs were also with lower ratio from residence consuming demand and vice versa. A declining trend moved from eastward to westward as well as from northward to southward by comparing the distribution of PHCEs based on capital city level. The results represented here were similar to Tian et al.’s study, whose work was analyzed from the perspective of production and consumption (Tian et al., 2014).
(2) In addition, we found Guangzhou and Chongqing’s PHCEs were similar to Lhasa, Hefei and Changsha’s, in the meanwhile, Chengdu, Guiyang’s PHCEs were more than Guangzhou and Chongqing’s. Why did this phenomenon occur? There were four reasons addressed here: 1) The main reason was that the households we interviewed in Guangzhou and Chongqing had lower household consumption and the households we interviewed in Chengdu and Guiyang had higher household consumption. 2) The samples we interviewed in Guangzhou and Chongqing might be a little bit less than that in other cities, as the results shown in Figure 1, the urbanization of Guangzhou and Chongqing was lower than the average value. 3) The characteristics of investigators and interviewees from different survey areas were also important, such as sexism, racism, marriage, and aging. The same questionnaire from different investigators might have different answers. 4) The consciousness of different samples was also important, e.g., some people were very rich, but they said they purchased less; others were very poor, whilst, they said they purchased more. These reasons induced PHCEs account in this work was not similar to the previous studies. Our work would continue to interview more households in these cities such as Guangdong, Chongqing, Guizhou, Chengdu to make further efforts to test the reality of PHCEs.
(3) Larger amounts of coal and heating were used for keeping warm in winter in northern provincial capital cities. Coal usage and heating usage were the main sources of PHCEs from residence consuming behavior. It was the primary cause of such a declining trend of PHCEs from northward to southward. Meanwhile, temperature difference between summer and winter as well as locational difference between northern China and southern China both had influence on household consuming behavior to a certain degree (Hao et al., 2016). Residents who lived in provincial capital cities of southern China always used electricity for keeping cool in summer, such as the utilization of air conditioners and fans. While, residents who lived in northern China always burned more coal in winter for keeping warm. PHCEs from coal usage, heating usage and electricity usage occupied 70% in the total from residence consuming behavior. Moreover, PHCEs from gasoline accounted for 7% of the total, of which, 43% were produced by private cars. Hence, individual, as the main consumer in the world, should change their ideas from luxurious activities to frugal lifestyle (Wei et al., 2007), such as, purchasing cars with low-gasoline consumption and low-carbon emissions as well as using more environmental-friendly appliances. Carbon labeled products should be considered, as Zhao et al. argued that, carbon labeling scheme took an effective place both in enterprises and industries (Zhao et al., 2016a; Zhao et al., 2016b).
(4) PI had a great impact on PHCEs. Feng et al. (2011) and Han et al. (2015) showed that per capita income had a significant positive effect on per capita CO2 emissions. In normal conditions, household demand would be rapidly grown and household consumption would be increased with the rapid economic growth. PHCEs increased as per capita income increased in provincial capital cities. The results showed that PI had a positive impact on PHCEs from the household sector which was similar to previous studies (Feng et al., 2011; Qu et al., 2013; Han et al., 2015). As shown in this paper, PI played the most important role in PHCEs from provincial capital cities in China. Under the background of economic development, consumers should change their lifestyle to reduce their carbon emissions. The progress of urbanization should be regulated by the government to ensure the sustainable development. Besides, policy-makers should provide suitable suggestions according to the local conditions, as Qu et al. (2013) suggested that, electricity usage and LPG usage in Northwest China would replace the coal usage and petrol usage in the years to come.
(5) HS took a negative role in the increased PHCEs from provincial capital cities in China. Every 1% increase in household size was associated with 0.06% decrease in PHCEs. Qu et al. (2013) pointed out that PHCEs decreased as the household size increased in Northwest China. It showed that large families especially extended families living together presented a promising way to save energy and reduce CO2 emissions. What observation was discussed in China above was also found in U.S. (Underwood, 2013). A switch to a two-child policy has already begun in China. Would this policy bring more carbon emissions from household sector? On the one hand, we suspected that the total HCEs would increase but was only with a minor variation based on the aforementioned results, e.g., children shared their stuffs with their brothers or sisters, such as clothes, toys, books, etc., sustainable utilization could be achieved. On the other hand, we suspected that per capita or per household HCEs would decrease in the future. A family had more members than less, they could cook, travel and watch TV together, etc., which could save energy and cut carbon emissions.
However, some limitations also existed in this study: (i) we just had survey data in one year, which was a lack of continuous data for years; (ii) more and more living garbage was made in cities, yet in this work we did not conduct any analysis about it. Hence, we would continue to delve in PHCEs with the household garbage. Our future study aimed to explore the temporal and spatial determinants on PHCEs which gave more suggestions for policy-makers.

5 Conclusions

(1) In this work, we explored the spatial variations and determinants of PHCEs (per capita household CO2 emissions) from provincial capital cities in China. The average PHCEs was 3.79 t CO2/person, which ranged from 2.38 t CO2/person to 4.99 t CO2/person in different provincial capital cities. There was a declining trend from the east to the west as well as from the north to the south in the distribution of PHCEs. Meanwhile, residence consuming behavior was the major contributor which accounted for 44% of the total.
(2) Based on the correlation analysis and spatial analysis of PHCEs and the related factors, we found that per capita income and household size was the two main impacts on PHCEs. Every 1% increase in PI was associated with 0.2951% increase in PHCEs, whilst, every 1% increase in HS was associated with 0.5114% decrease in PHCEs when other influential factors remained unchanged.
(3) What we presented here is to assess the value of PHCEs and investigate the related impacts by correlation analysis and spatial regression model. Results offered some suggestions and policy implications to support the green development and to make long-term mitigation strategies for coping with climate change.
We deemed that PHCEs varied in different household consuming demands by analyzing the survey data results of PHCEs according to capital city level in China. PHCEs was the largest from residence consuming demand. In the meanwhile, centralized heating usage in winter for keeping warm played an important role in PHCEs increasing. The matter of urgency was to improve coke quality and clean energy technology in heating department. Based on different groups of PHCEs such as Zhejiang and Beijing, these provincial capital cities with higher PHCEs should have more responsibility to reduce their emissions by taking the so-called common but different responsibilities. Per capita income had a great impact on PHCEs from the spatial analysis on the determination of PHCEs. Policy-makers should consider this disparity phenomenon that occurred between different income levels. Frugal lifestyle and consuming behavior needed to be promoted in household sector. More than that, individual, as an important consumer, should change his or her bad lifestyle into good habits, such as saving water, electricity, food and energy. Household size had a great negative impact on PHCEs. It was advisable to start an extended family, e.g., members of family had dinner together and watched TV together which could reduce food waste and also could reduce PHCEs.
Chinese government has pledged to cut its 40%-45% carbon intensity by 2020 based on the 2005 level as well as peaked its CO2 emissions around 2030. Policy-makers should consider the provincial differences by considering the policies responded to climate change when made the related measures. More and more CO2 emissions would be produced as China was at the stage of accelerated urbanization and industrialization. The pressing issue was to improve technology and change household consuming lifestyle to reduce carbon emissions from household sector.

The authors have declared that no competing interests exist.

[1]
Anselin L, 1992. Space and applied econometrics: Introduction.Regional Science and Urban Economics, 22(3): 307-316.No abstract is available for this item.

DOI

[2]
Bin S, Dowlatabadi H, 2005. Consumer lifestyle approach to US energy use and the related CO2 emissions.Energy Policy, 33: 197-208.Historically, a sectoral approach (based on the industrial, transportation, commercial, and residential sectors) has shaped the way we frame and analyze issues of energy conservation and CO mitigation. This sectoral categorization, however, is limited in its capacity to reveal the total impacts of consumer activities on energy use and its related environmental impacts. In this paper, we propose an alternative paradigm, called the Consumer Lifestyle Approach (CLA), to explore the relationship between consumer activities and environmental impacts in the US. Estimates based on our methodology reveal that more than 80% of the energy used and the CO emitted in the US are a consequence of consumer demands and the economic activities to support these demands. Direct influences due to consumer activities (home energy use and personal travel) are 4% of the US GDP, but account for 28% and 41% of US energy use and CO emissions, respectively. Indirect influences (such as housing operations, transportation operations, food, and apparel) involve more than twice the direct energy use and CO emissions. Characterization of both direct and indirect energy use and emissions is critical to the design of more effective energy and CO emission policies. It may also help erode the false dichotomy of hem versus us (industrial polluters versus consumers) references to the locus of responsibility for control of energy use and CO emissions.

DOI

[3]
Cheng Yeqing, Wang Zheye, Ye Xinyueet al., 2014. Spatiotemporal dynamics of carbon intensity from energy consumption in China.Journal of Geographical Sciences, 24(4): 631-650.lt;p>The sustainable development has been seriously challenged by global climate change due to carbon emissions. As a developing country, China promised to reduce 40%-45% below the level of the year 2005 on its carbon intensity by 2020. The realization of this target depends on not only the substantive transition of society and economy at the national scale, but also the action and share of energy saving and emissions reduction at the provincial scale. Based on the method provided by the IPCC, this paper examines the spatiotemporal dynamics and dominating factors of China&#x02019;s carbon intensity from energy consumption in 1997-2010. The aim is to provide scientific basis for policy making on energy conservation and carbon emission reduction in China. The results are shown as follows. Firstly, China&#x02019;s carbon emissions increased from 4.16 Gt to 11.29 Gt from 1997 to 2010, with an annual growth rate of 7.15%, which was much lower than that of GDP (11.72%). Secondly, the trend of Moran&#x02019;s I indicated that China&#x02019;s carbon intensity has a growing spatial agglomeration at the provincial scale. The provinces with either high or low values appeared to be path-dependent or space-locked to some extent. Third, according to spatial panel econometric model, energy intensity, energy structure, industrial structure and urbanization rate were the dominating factors shaping the spatiotemporal patterns of China&#x02019;s carbon intensity from energy consumption. Therefore, in order to realize the targets of energy conservation and emission reduction, China should improve the efficiency of energy utilization, optimize energy and industrial structure, choose the low-carbon urbanization approach and implement regional cooperation strategy of energy conservation and emissions reduction.</p>

DOI

[4]
Chuai Xiaowei, Huang Xianjin, Wang Wanjinget al., 2012. Spatial econometric analysis of carbon emissions from energy consumption in China. Journal of Geographical Sciences, 22(4): 630-642.AbstractBased on energy consumption data of each region in China from 1997 to 2009 and using ArcGIS9.3 and GeoDA9.5 as technical support, this paper made a preliminary study on the changing trend of spatial pattern at regional level of carbon emissions from energy consumption, spatial autocorrelation analysis of carbon emissions, spatial regression analysis between carbon emissions and their influencing factors. The analyzed results are shown as follows. (1) Carbon emissions from energy consumption increased more than 148% from 1997 to 2009 but the spatial pattern of high and low emission regions did not change greatly. (2) The global spatial autocorrelation of carbon emissions from energy consumption increased from 1997 to 2009, the spatial autocorrelation analysis showed that there exists a “polarization” phenomenon, the centre of “High-High” agglomeration did not change greatly but expanded currently, the centre of “Low-Low” agglomeration also did not change greatly but narrowed currently. (3) The spatial regression analysis showed that carbon emissions from energy consumption has a close relationship with GDP and population, R-squared rate of the spatial regression between carbon emissions and GDP is higher than that between carbon emissions and population. The contribution of population to carbon emissions increased but the contribution of GDP decreased from 1997 to 2009. The carbon emissions spillover effect was aggravated from 1997 to 2009 due to both the increase of GDP and population, so GDP and population were the two main factors which had strengthened the spatial autocorrelation of carbon emissions.

DOI

[5]
Cohen C, Lenzen M, Schaeffer R, 2005. Energy requirements of households in Brazil.Energy Policy, 33: 555-562.In this study we determine the total (direct plus indirect) energy requirements of a given set of Brazilian households. We use a generalized input–output model in order to calculate the energy embodied in goods and services purchased by households of different income level in 11 capital cities of Brazil. Our results show that, on average, the total energy intensity of household expenditure increases with income level, although there is a considerable spread in energy intensities within income classes as well as disparities between regions of the country. The total yearly average energy requirement per household in Brazil in 1995–96 was 173.602GJ (61% of which was indirect), with 32.802GJ for the lower income level (66% of which was indirect), and 602.202GJ for the higher income level (62% of which was indirect). Of this total average energy requirement, 76% was required for only three consumption categories: utilities (31%), mobility (28%) and shelter (17%). This analysis calls for the attention that has to be given not only to the direct energy consumption (as motor fuels and electricity, for example) but also to the consumption categories that encompass an important part of the indirect energy requirement of households in capital cities in Brazil.

DOI

[6]
Dai Hancheng, Masui T, Matsuoka Yet al., 2012. The impacts of China’s household consumption expenditure patterns on energy demand and carbon emissions towards 2050.Energy, 50: 736-750.78 Propose two household expenditure patterns considering income rise and urbanization. 78 Much energy and CO2 emissions would be saved in low-carbon consumption scenario. 78 Carbon prices would reduce a lot in low-carbon consumption scenario.

DOI

[7]
Dietz T, Gardner G T, Gilligan Jet al., 2009. Household actions can provide a behavioral wedge to rapidly reduce U.S. carbon emissions.PNAS, 106(44): 18452-18456.

[8]
Fahmy E, Thumim J, White V, 2011. The distribution of UK household CO2 emissions: Interim report. York: The Joseph Rowntree Foundation. Download at https://www.jrf.org.uk/reports.IncomeHousehold typeHousing tenureNumber of workers in household Employment status of HRPAge of HRPSocio-Economic Group of HRP Settlement typeNumber of cars in householdDomestic fuel typeGovernment Office Region

[9]
Fan Jin, Guo Xiumei, Marinova Det al., 2012. Embedded carbon footprint of Chinese urban household: Structure and changes. Journal of Cleaner Production, 33: 50-59.Reducing environmental pressure is a major concern for China but despite the improvements in energy efficiency, its gross carbon dioxide (CO2) emissions have maintained an upward trend, consistent with the Jevons Paradox. A fundamental shift is thus needed at all levels, including the household. This paper explores the embedded carbon footprint (ECF) of Chinese urban households associated with activities, such as food, personal transport, communications, education, recreation, health and hygiene. It uses an input–output model for carbon emissions and 2003–2009 urban household data. The results show that the total ECF emission intensity increases when an individual's consumption is higher than 10,000 Yuan (06). Structural changes are further observed with consumption expenditure above 0610,000: food, clothing and other survival-oriented emissions intensities as well as education, health and development-oriented emissions intensities reduce; transport, recreation, housing and enjoyment-oriented emissions intensities increase or remain stable and the total emissions intensity increases. Currently per capita consumption expenditure of Chinese urban residents exceeds 0610,000 and as income continues to rise, China will remain on a high-carbon track. There is a need for better policies, management and behavioural change and the study provides some policy suggestions, including a carbon quota system to guide individual consumption.

DOI

[10]
Fan Jin, Wu Yanrui, Guo Xiumeiet al., 2014. Regional disparity of embedded carbon footprint and its sources in China: A consumption perspective.Asia Pacific Business Review, 21(1): 130-146.2015). Regional disparity of embedded carbon footprint and its sources in China: a consumption perspective. Asia Pacific Business Review: Vol. 21, Managing China’s Energy Sector: Between the Market and the State, pp. 130-146. doi: 10.1080/13602381.2014.939899

DOI

[11]
Fan Jingli, Liao Hua, Liang Qiaomeiet al., 2013. Residential carbon emission evolutions in urban-rural divided China: An end-use and behavior analysis.Applied Energy, 101: 323-332.The residential sector is the second largest consumer in China with great room for energy consumption growth, as well as the related carbon emissions. Thus, how to reduce the growth rate of carbon emissions is crucial for realizing the target of energy conservation and emission mitigation in the residential sector. Based on a bottom-up framework with survey data and official statistics, this paper examines the changes of aggregate residential carbon intensity, and analyzes its driving factors from an end-use perspective over the period of 1996 2008. The Adaptive Weighting Divisia with rolling base year index specification is applied to identify the quantitative effects of driving components and their further decomposing results of end-use activities. Results show that, the residential aggregate carbon intensity has grown rapidly since 2002 in both urban and rural China. The changes in primary fuel mix for electricity and heat generation have an overall negative but insignificant effect on the residential aggregate carbon intensity, while the effect of final energy structure is positive with a rising tendency. The significant impact of changes in energy intensity shift from negative to positive over time, and contribute more to a decline than to an increase. The driving force arising from the residential end-use mode has the highest contribution to the increase of aggregate carbon intensity. Finally, some policy implications are proposed to effectively slow down the accelerated rate of the residential aggregate carbon intensity. Guiding households towards energy-saving behaviors is recommended as a wise and first policy choice.

DOI

[12]
Feng Zhenhua, Zou Lele, Wei Yiming, 2011. The impact of household consumption on energy use and CO2 emissions in China.Energy, 36(1): 656-670.In this paper, the consumer lifestyle approach is applied to analyze the impact of consumption by urban and rural households on energy use and CO emissions for different regions and income levels in China. Grey Model is used to compare the relationship between energy consumption, consumption expenditure and CO emissions for different lifestyles. The results show that direct energy consumption is diverse for urban households and simple for rural households in China. Direct energy consumption and CO emissions are increasing faster for urban than for rural households. Indirect energy consumption and CO emissions for urban households are much greater than the direct consumption values. The total indirect energy consumption and CO emissions differ by regions and the structures are different, but the latter differences are not obvious. The impact of household income is enormous. Indirect energy consumption and CO emissions are higher for high-income than for low-income households. The structural difference for indirect energy consumption and CO emissions for households with different income levels is significant. The higher the income, the more diverse is the energy consumption and CO emission structure. The structures for indirect energy use and CO emissions are diverse for urban households, but simple for rural households.

DOI

[13]
Golley J, Meng Xin, 2012. Income inequality and carbon dioxide emissions: The case of Chinese urban households. Energy Economics, 34(6): 1864-1872.78 We calculate the per capita carbon dioxide emissions of Chinese urban households. 78 We include the indirect emissions generated via the consumption of all goods. 78 We show that the rich emit more per capita but the poor are more emission intensive. 78 We establish an increasing marginal propensity to emit over the income range. 78 This implies that income redistribution can reduce aggregate household emissions.

DOI

[14]
Guan Dabo, Peters G P, Weber C Let al., 2009. Journey to world top emitter: An analysis of the driving forces of China’s recent CO2 emissions surge.Geophysical Research Letters, 36(4): L04709.China's economy has been growing at an accelerated rate from 2002 to 2005 and with it China's carbon emissions. It is easier to understand the growth in China's carbon emissions by considering which consumption activities - households and government, capital investments, and international trade - drive Chinese production and hence emissions. This paper adopts structural decomposition analysis, a macro-economic approach using data from national statistical offices, to investigate the drivers of China's recent COemissions surge. The speed of efficiency gains in production sectors cannot cope with the growth in emissions due to growth in final consumption and associated production processes. More specifically, Chinese export production is responsible for one-half of the emission increase. Capital formation contributes to one-third of the emission increase. A fast growing component is carbon emissions related to consumption of services by urban households and governmental institutions, which are responsible for most of the remaining emissions.

DOI

[15]
Han Liyan, Xu Xinkuo, Han Lu, 2015. Applying quantile regression and Shapley decomposition to analyzing the determinants of household embedded carbon emissions: Evidence from urban China. Journal of Cleaner Production, 103: 219-230.61Household characteristics impact embedded carbon emissions at different quantiles.61Household members, income and cars contribute considerably to embedded CO2 emissions.61Use of income and wealth has a significant impact on household embedded CO2 emissions.61Education on low-carbon concept will relieve household embedded carbon inequality.61Quantile regression and Shapley decomposition define the points of mitigation policies.

DOI

[16]
Hao Yu, Chen Hao, Wei Yiminget al., 2016. The influence of climate change on CO2 (carbon dioxide) emissions: An empirical estimation based on Chinese provincial panel data.Journal of Cleaner Production, 131: 667-677.The issue of climate change has become an increasing concern for the international community. At the same time, climate change and, particularly, global warming affects the amount of energy required in China and the structure of this demand, thereby influencing the amount of CO2(carbon dioxide) emissions produced. To investigate the possible influence of climate change on China's CO2emissions, this paper utilizes the degree-day method to calculate the heating degree days (HDD) and cooling degree days (CDD) in 29 provinces in China from 1995 to 2011. A series of appropriate econometric models are subsequently estimated to measure the impact of climate change on CO2emissions per capita. To enhance the explanatory power of the estimation results, several indicators, such as income per capita, industry structure, urbanization rate and population density, are incorporated in the estimation equations as control variables. The estimation results indicate that the feedback effect of climate change on China's carbon emissions is statistically significant but not large in magnitude. During the sample period between 1995 and 2011, approximately 1.687% of China's increased total CO2emissions could be attributed to climate change. Moreover, the impacts of climate change on different regions of China are notably different. For example, the influence of HDD on CO2emissions per capita are most significant in the middle and southern regions, while the impacts of CDD are most significant in the eastern and northern regions. However, there is no obvious evidence that climate change has affected CO2emissions in the western region.

DOI

[17]
Intergovernmental Panel on Climate Change (IPCC), 2006.IPCC guidelines for national greenhouse gas inventories.Download at .

[18]
Jones C M, Kammen D M, 2011. Quantifying carbon footprint reduction opportunities for U.S. households and communities.Environmental Science & Technology, 45(9): 4088-4095.Abstract Carbon management is of increasing interest to individuals, households, and communities. In order to effectively assess and manage their climate impacts, individuals need information on the financial and greenhouse gas benefits of effective mitigation opportunities. We use consumption-based life cycle accounting techniques to quantify the carbon footprints of typical U.S. households in 28 cities for 6 household sizes and 12 income brackets. The model includes emissions embodied in transportation, energy, water, waste, food, goods, and services. We further quantify greenhouse gas and financial savings from 13 potential mitigation actions across all household types. The model suggests that the size and composition of carbon footprints vary dramatically between geographic regions and within regions based on basic demographic characteristics. Despite these differences, large cash-positive carbon footprint reductions are evident across all household types and locations; however, realizing this potential may require tailoring policies and programs to different population segments with very different carbon footprint profiles. The results of this model have been incorporated into an open access online carbon footprint management tool designed to enable behavior change at the household level through personalized feedback.

DOI PMID

[19]
Jones C M, Kammen D M, 2013. Spatial distribution of U.S. household carbon footprints reveals suburbanization undermines greenhouse gas benefits of urban population density.Environmental Science & Technology, 48(2): 895-902.Which municipalities and locations within the United States contribute the most to household greenhouse gas emissions, and what is the effect of population density and suburbanization on emissions? Using national household surveys, we developed econometric models of demand for energy, transportation, food, goods, and services that were used to derive average household carbon footprints (HCF) for U.S. zip codes, cities, counties, and metropolitan areas. We find consistently lower HCF in urban core cities (65 40 tCO2e) and higher carbon footprints in outlying suburbs (65 50 tCO2e), with a range from 65 25 to >80 tCO2e in the 50 largest metropolitan areas. Population density exhibits a weak but positive correlation with HCF until a density threshold is met, after which range, mean, and standard deviation of HCF decline. While population density contributes to relatively low HCF in the central cities of large metropolitan areas, the more extensive suburbanization in these regions contributes to an overall net increase in HCF compared to smaller metropolitan areas. Suburbs alone account for 65 50% of total U.S. HCF. Differences in the size, composition, and location of household carbon footprints suggest the need for tailoring of greenhouse gas mitigation efforts to different populations.

DOI PMID

[20]
Kadian R, Dahiya R P, Garg H P, 2007. Energy-related emissions and mitigation opportunities from the household sector in Delhi.Energy Policy, 35: 6195-6211.Urban centers are the major consumers of energy, which is a major source of air pollution. Therefore, an insight into energy consumption and quantification of emissions from urban areas are extremely important for identifying impacts and finding solution to air pollution in urban centers. This paper applies the Long-range Energy Alternatives Planning (LEAP) system for modeling the total energy consumption and associated emissions from the household sector of Delhi. Energy consumption under different sets of policy and technology options are analyzed for a time span of 2001 2021 and emissions of carbon dioxide (CO 2), carbon monoxide (CO), methane (CH 4), non-methane volatile organic compounds (NMVOCs), nitrogen oxides (NO x), nitrous oxide (N 2O), total suspended particulates (TSP) and sulfur dioxide (SO 2) are estimated. Different scenarios are generated to examine the level of pollution reduction achievable by application of various options. The business as usual (BAU) scenario is developed considering the time series trends of energy use in Delhi households. The fuel substitution (FS) scenario analyzes policies having potential to impact fuel switching and their implications towards reducing emissions. The energy conservation (EC) scenario focuses on efficiency improvement technologies and policies for energy-intensity reduction. An integrated (INT) scenario is also generated to assess the cumulative impact of the two alternate scenarios on energy consumption and direct emissions from household sectors of Delhi. Maximum reduction in energy consumption in households of Delhi is observed in the EC scenario, whereas, the FS scenario seems to be a viable option if the emission loadings are to be reduced.

DOI

[21]
Kerkhof A C, Benders R M J, Moll H C, 2009. Determinants of variation in household CO2 emissions between and within countries.Energy Policy, 37(4): 1509-1517.Variation in household CO emissions between and within countries may have important consequences for the equity dimension of climate policies. In this study we aim to identify some determinants of national household CO emissions and their distribution across income groups. For that purpose, we quantify the CO emissions of households in the Netherlands, UK, Sweden and Norway around the year 2000 by combining a hybrid approach of process analysis and input utput analysis with data on household expenditures. Our results show that average households in the Netherlands and the UK give rise to higher amounts of CO emissions than households in Sweden and Norway. Moreover, CO emission intensities of household consumption decrease with increasing income in the Netherlands and the UK, whereas they increase in Sweden and Norway. A comparison of the national results at the product level points out that country characteristics, like energy supply, population density and the availability of district heating, influence variation in household CO emissions between and within countries.

DOI

[22]
Lenzen M, 1998. Primary energy and greenhouse gases embodied in Australian final consumption: An input-output analysis.Energy Policy, 26(6): 495-506.Input utput modeling of primary energy and greenhouse gas embodiments in goods and services is a useful technique for designing greenhouse gas abatement policies. The present paper describes direct and indirect primary energy and greenhouse gas requirements for a given set of Australian final consumption. It considers sectoral disparities in energy prices, capital formation and international trade flows and it accounts for embodiments in the Gross National Expenditure as well as the Gross Domestic Product. Primary energy and greenhouse gas intensities in terms of MJ/$ and kg CO 2 -e/$ are reported, as well as national balances of primary energy consumption and greenhouse gas emissions.

DOI

[23]
Li Jianbao, Huang Xianjin, Yang Honget al., 2016. Situation and determinants of household carbon emissions in Northwest China.Habitat International, 51: 178-187.Household CO 2 emission is one of the main sources of carbon emissions. Reducing this type of CO 2 emissions plays an important role in decreasing global carbon emissions. Based on household CO 2 emission survey data in Northwest China, we analysed the current situation of household CO 2 emissions and produced a map of per capita household CO 2 emissions for each survey location. We also analysed the relationship between per capita household CO 2 emissions and explanatory factors using spatial econometric models. The results showed that 87.56% of the per capita household CO 2 emissions range from 0.3912t to 2.5895t. Carbon intensity and per capita income are the main explanatory factors of household CO 2 emission. High per capita CO 2 emissions are mainly related to carbon intensity, per capita income, January average temperature and urbanization level. The results also revealed the importance of other variables, such as total household population, age structure and July average temperature. This study contributes to the understanding of the main explanatory factors of household CO 2 emission in Northwest China and proposes some emission reduction measures.

DOI

[24]
Li Yanmei, Zhao Rui, Liu Tianshuet al.Liu Tianshu , 2015. Does urbanization lead to more direct and indirect household carbon dioxide emissions? Evidence from China during 1996-2012.Journal of Cleaner Production, 102: 103-114.61Direct and indirect carbon emissions of households are calculated.61Differences in carbon emissions between urban and rural households are identified.61A unidirectional causal relation was found running from urbanization to emissions.61Reasons of why urbanization leads to more household carbon emissions are discussed.61Policy implications for urbanization and carbon emissions are suggested.

DOI

[25]
Liu Lancui, Wu Gang, Wang Jinnanet al., 2011. China’s carbon emissions from urban and rural households during 1992-2007.Journal of Cleaner Production, 19(15): 1754-1762.In China, Rapid economic growth has stimulated fast urban expansion and rural household income and consumption expenditure. In current paper, an input–output method is used to determine the impact of China’s increased urban and rural household consumption on carbon emissions. The results shows that the direct and indirect CO emission from household consumption accounted for more than 40% of total carbon emissions from primary energy utilization in China in 1992–2007. The population increase, expansion of urbanization and the increase of household consumption per capita all contribute to an increase of indirect carbon emissions, while carbon intensity decline mitigates the growth of carbon emissions. Therefore, at the domestic level, household consumption is of great significance for CO emission, which could be mitigated through changing the composition of goods and services consumed by households, and switching to consumption pattern of less carbon-intensive products. The government must consider the substantial contribution of household consumption to carbon emissions when China is encouraging consumption in order to address the current global financial crisis.

DOI

[26]
Liu Lina, Qu Jiansheng, Afton C Set al., 2017. Spatial variations and determinants of per capita household CO2 emissions (PHCEs) in China.Sustainability, 9(17): 1277.

[27]
Liu Yansui, Yan Bin, Zhou Yang, 2016. Urbanization, economic growth, and carbon dioxide emissions in China: A panel cointegration and causality analysis.Journal of Geographical Sciences, 26(2): 131-152.

DOI

[28]
National Bureau of Statistics of China (NBSC), 2013. China Energy Statistical Yearbook 2012. Beijing: China Statistics Press. (in Chinese)

[29]
National Bureau of Statistics of China (NBSC), 2013. China Statistical Yearbook 2012. Beijing: China Statistics Press. (in Chinese)

[30]
National Bureau of Statistics of China (NBSC), 2015. Input-output Tables of China 2012. Beijing: China Statistics Press. (in Chinese)

[31]
National Development and Reform Commission (NDRC), 2007. The People's Republic of China National Greenhouse Gas Inventory. Beijing: China Environmental Science Press. (in Chinese)

[32]
Clean Development Mechanism in China (CDMC), 2010. Baseline Emission Factor for Regional Power Grids in China. Download at

[33]
Nejat P, Jomehzadeh F, Taheri M Met al., 2015. A global review of energy consumption, CO2 emissions and policy in the residential sector (with an overview of the top ten CO2 emitting countries).Renewable and Sustainable Energy Reviews, 43: 843-862.Climate change and global warming as the main human societies threats are fundamentally associated with energy consumption and GHG emissions. The residential sector, representing 27% and 17% of global energy consumption and CO2 emissions, respectively, has a considerable role to mitigate global climate change. Ten countries, including China, the US, India, Russia, Japan, Germany, South Korea, Canada, Iran, and the UK, account for two-thirds of global CO2 emissions. Thus, these countries residential energy consumption and GHG emissions have direct, significant effects on the world environment. The aim of this paper is to review the status and current trends of energy consumption, CO2 emissions and energy policies in the residential sector, both globally and in those ten countries. It was found that global residential energy consumption grew by 14% from 2000 to 2011. Most of this increase has occurred in developing countries, where population, urbanization and economic growth have been the main driving factors. Among the ten studied countries, all of the developed ones have shown a promising trend of reduction in CO2 emissions, apart from the US and Japan, which showed a 4% rise. Globally, the residential energy market is dominated by traditional biomass (40% of the total) followed by electricity (21%) and natural gas (20%), but the total proportion of fossil fuels has decreased over the past decade. Energy policy plays a significant role in controlling energy consumption. Different energy policies, such as building energy codes, incentives, energy labels have been employed by countries. Those policies can be successful if they are enhanced by making them mandatory, targeting net-zero energy building, and increasing public awareness about new technologies. However, developing countries, such as China, India and Iran, still encounter with considerable growth in GHG emissions and energy consumption, which are mostly related to the absence of strong, efficient policy.

DOI

[34]
Qu Jiansheng, Zeng Jingjing, Li Yanet al., 2013. Household carbon dioxide emissions from peasants and herdsmen in northwestern arid-alpine regions, China.Energy Policy, 57: 133-140.This study assessed household CO2 emissions (related to the consumption of necessary and luxury goods and services) of peasants and herdsmen households in arid-alpine regions in Gansu, Qinghai and Ningxia provinces, China. We also explored whether agriculture types, family income and family size have played any role in household CO2 emissions. In order to address these issues, we: (i) developed assessment indicators for household emissions; (ii) conducted semi-structured questionnaire household surveys; and (iii) employed input-output analysis (LOA). The results showed that, the average household CO2 emission per capita is 1.43 tons (t) CO2; the proportion of subsistence emissions (related to the consumption of necessary goods and services) accounts for 93.24%, whereas luxury emissions (generated due to consumption of specific goods and services that are consumed only when household income improves) only account for 6.76%t. Moreover, household CO2 emissions increase with family income and family size, but per capita emissions are inversely related to family size. The highest average household emissions were found in the alpine agricultural and pastoral region (6.18 t CO2), followed by the irrigated agricultural region (6.07 t CO2) and the rain-fed agricultural region (5.34 t CO2). In consideration of insignificant amount of household emissions from these poor and vulnerable groups of the society, this study suggests to follow the principle of fairness while making energy conservation, emission reduction and adaptation policies. (C) 2013 Elsevier Ltd. All rights reserved.

DOI

[35]
Qu Jiansheng, Maraseni T, Liu Linaet al., 2015. A comparison of household carbon emission patterns of urban and rural China over the 17 year period (1995-2011). Energies, 8: 10537-10557.The household sector consumes a large amount of goods and services and is therefore a major source of global carbon emissions. This study aims to analyze per person household carbon emission (HCEs) patterns of urban and rural China over the period from 1995 to 2011. Annual macroeconomic data for the study were obtained from authentic Chinese government sources. Direct HCE estimates for each fossil fuel were obtained using the IPCC's reference approach, and indirect HCEs were calculated by input-output analysis. In 1995, per person HCEs from direct sources for urban and rural China were 0.50 tCO(2) and 0.22 tCO(2), respectively; by 2011, these values had increased to 0.60 tCO(2) and 0.61 tCO(2), an increase of 20% and 177.27%, respectively. Similarly, in 1995, per person HCEs from indirect sources for urban and rural China were 0.43 tCO(2) and 0.16 tCO(2), respectively; by 2011, these values had increased to 1.77 tCO(2) and 0.53 tCO(2), respectively, an increase of 306% and 235%. The reasons for these differences and the sets of policies required to rectify increasing emissions are discussed. If current trends and practices continue, with a RMB1000 increase in per capita income from 2011 levels, per person HCEs in urban and rural China will increase by 0.119 tCO(2) and 0.197 tCO(2), respectively. This result indicates that the sector of society which is most vulnerable will contribute most to China's increasing HCEs. Therefore, while developing energy consumption and emissions reduction policies and programs, principles of fairness and equity need to be followed.

DOI

[36]
Reinders A H M E, Vringer K, Blok K, 2003. The direct and indirect energy requirement of households in the European Union.Energy Policy, 31: 139-153.In this article we evaluate the average energy requirement of households in 11 EU member states. By investigating both the direct (electricity, natural gas, gasoline, etc.) and the indirect energy requirement, i.e. the energy embodied in consumer goods and services, we add to research done on only the direct household energy requirement. Our analysis is mainly based on data of expenditures of households and the associated energy intensities of consumer goods. We found that differences between countries in the total energy requirement of households are mainly due to differences in total household expenditure. In particular, the indirect energy requirement is linearly related to the total household expenditure. The share of direct energy to the total energy requirement in different countries varies from 34% up to 64%. Differences in climate do not fully account for this variation. Corrected for total household expenditure, indirect energy requirement may vary significantly per country in the consumption classes 'food, beverages and tobacco', 'recreation and culture', 'housing', and 'hotels, cafes and restaurants'.

DOI

[37]
Shan Yuli, Guan Dabo, Liu Jianghua et al., 2017. Methodology and applications of city level CO2 emissions accounts in China. Journal of Cleaner Production. . Download at

[38]
Shen Lei, Sun Yanzhi, 2016. Review on carbon emissions, energy consumption and low-carbon economy in China from a perspective of global climate change.Journal of Geographical Sciences, 26(7): 855-870.Accompanying the rapid growth of China's population and economy, energy consumption and carbon emission increased significantly from 1978 to 2012. China is now the largest energy consumer and CO2 emitter of the world, leading to much interest in researches on the nexus between energy consumption, carbon emissions and low-carbon economy. This article presents the domestic Chinese studies on this hotpot issue, and we obtain the following findings. First, most research fields involve geography, ecology and resource economics, and research contents contained some analysis of current situation, factors decomposition, predictive analysis and the introduction of methods and models. Second, there exists an inverted "U-shaped" curve connection between carbon emission, energy consumption and economic development. Energy consumption in China will be in a low-speed growth after 2035 and it is expected to peak between 6.19 12.13 billion TCE in 2050. China's carbon emissions are expected to peak in 2035, or during 2020 to 2045, and the optimal range of carbon emissions is between 2.4 3.3 PgC/year(1 PgC=1 billion tons C) in 2050. Third, future research should be focused on global carbon trading, regional carbon flows, reforming the current energy structure, reducing energy consumption and innovating the low-carbon economic theory, as well as establishing a comprehensive theoretical system of energy consumption, carbon emissions and low-carbon economy.

DOI

[39]
Tian Xin, Chang Miao, Lin Chenet al., 2014. China’s carbon footprint: A regional perspective on the effect of transitions in consumption and production patterns.Applied Energy, 123: 19-28.A better understanding of CO2 emission trends caused by domestic consumption (referred to as the carbon footprint) in China, especially in the context of changes in consumption and production patterns triggered by economic development in recent years, is important to develop effective approaches for curbing the fast-growing emissions. As the various regions in mainland China exhibit great disparities in socioeconomic factors and are thus in different stages of development, this study aims to obtain a regional map of carbon footprints in China, and address the changes, sources, and drivers of regional carbon footprints. Result indicates that regional per-capita carbon footprint varied greatly from 2.9 ton in the Southwest to 8.4 ton in Jingjin in 2007, and this disparity can be attributed to differences in regional income. On average, construction and services accounted for about 70% of the regional footprint in 2007. From a view of contributions from final demand activities, it was found that on average 56% of the regional footprint was associated with investment activity, 35% was related to household consumption, and 9% was attributable to government consumption. The results of structural decomposition show that while changes in consumption patterns have promoted rapid growth in the carbon footprint across all regions, the contribution from changes in production patterns varied widely, depending on what changes in production structure and CO2 intensity improvements were undertaken. Further CO2 intensity improvements and low-carbon optimization of the production structure will be important approaches for curbing the rapid growth of the carbon footprint across all regions of China.

DOI

[40]
Underwood A J, 2013. Household carbon dioxide emissions in the United States: The role of demographic change (Doctoral dissertation, Colorado State University, 2013). ProQuest Dissertations Publishing.

[41]
Vringer K, Blok K, 1995. The direct and indirect energy requirements of households in the Netherlands.Energy Policy, 23(10): 893-910.In this article we evaluate the average energy requirement of households in 11 EU member states. By investigating both the direct (electricity, natural gas, gasoline, etc.) and the indirect energy requirement, i.e. the energy embodied in consumer goods and services, we add to research done on only the direct household energy requirement. Our analysis is mainly based on data of expenditures of households and the associated energy intensities of consumer goods. We found that differences between countries in the total energy requirement of households are mainly due to differences in total household expenditure. In particular, the indirect energy requirement is linearly related to the total household expenditure. The share of direct energy to the total energy requirement in different countries varies from 34% up to 64%. Differences in climate do not fully account for this variation. Corrected for total household expenditure, indirect energy requirement may vary significantly per country in the consumption classes 'food, beverages and tobacco', 'recreation and culture', 'housing', and 'hotels, cafes and restaurants'.

DOI

[42]
Xu Xibo, Tan Yan, Shen Shuanget al., 2015. Urban household carbon emission and contributing factors in the Yangtze River Delta, China.PLoS ONE, 10(4): e0121604.Carbon reduction at the household level is an integral part of carbon mitigation. This study analyses the characteristics, effects, contributing factors and policies for urban household carbon emissions in the Yangtze River Delta of China. Primary data was collected through structured questionnaire surveys in three cities in the region Nanjing, Ningbo, and Changzhou in 2011. The survey data was first used to estimate the magnitude of household carbon emissions in different urban contexts. It then examined how, and to what extent, each set of demographic, economic, behavioral/cognitive and spatial factors influence carbon emissions at the household level. The average of urban household carbon emissions in the region was estimated to be 5.96 tonnes CO2 in 2010. Energy consumption, daily commuting, garbage disposal and long-distance travel accounted for 51.2%, 21.3%, 16.0% and 11.5% of the total emission, respectively. Regulating rapidly growing car-holdings of urban households, stabilizing population growth, and transiting residents low-carbon awareness to household behavior in energy saving and other spheres of consumption in the context of rapid population aging and the growing middle income class are suggested as critical measures for carbon mitigation among urban households in the Yangtze River Delta.

DOI PMID

[43]
Wang Shaojian, Fang Chuanglin, Li Guangdong, 2015. Spatiotemporal characteristics, determinants and scenario analysis of CO2 emissions in China using provincial panel data.PLoS ONE, 10(9): e0138666.This paper empirically investigated the spatiotemporal variations, influencing factors and future emission trends of China CO2 emissions based on a provincial panel data set. A series of panel econometric models were used taking the period 1995 2011 into consideration. The results indicated that CO2 emissions in China increased over time, and were characterized by noticeable regional discrepancies; in addition, CO2 emissions also exhibited properties of spatial dependence and convergence. Factors such as population scale, economic level and urbanization level exerted a positive influence on CO2 emissions. Conversely, energy intensity was identified as having a negative influence on CO2 emissions. In addition, the significance of the relationship between CO2 emissions and the four variables varied across the provinces based on their scale of economic development. Scenario simulations further showed that the scenario of middle economic growth, middle population increase, low urbanization growth, and high technology improvement (here referred to as Scenario BTU), constitutes the best development model for China to realize the future sustainable development. Based on these empirical findings, we also provide a number of policy recommendations with respect to the future mitigation of CO2 emissions.

DOI PMID

[44]
Wang Zhaohua, Yang Lin, 2014. Indirect carbon emissions in household consumption: Evidence from the urban and rural area in China.Journal of Cleaner Production, 78: 94-103.61We analyze resident CO2 emissions in the perspective of energy ecological footprint.61This paper quantifies indirect CO2 emissions by CLA and NPP.61Using improved STIRPAT model, we empirically analyze the influencing factors.61Consumption structure becomes the dominant factor affecting the energy use.61Urban residents' consuming pattern has important effect on reducing CO2 emissions.

DOI

[45]
Wang Zhaohua, Liu Wei, Yin Jianhua, 2015. Driving forces of indirect carbon emissions from household consumption in China: An input-output decomposition analysis. Nat Hazards, 75(2): 257-272.Human activities have become a major source of Earth’s climate change, which brings the rise of surface air temperature and subsurface ocean temperature. Therefore, promoting sustainable consumption and production patterns is imperative to minimize the use of natural resources and reduce emissions of pollutants. This study uses Economic Input–Output Life-Cycle Assessment method and structural decomposition model to identify the driving forces that influence the changes in carbon emissions from China’s residential consumption in the context of sustainable consumption. The findings of the study are as follows: (1) indirect carbon emissions from Chinese household consumption increase rapidly over time; (2) the largest carbon dioxide emitting sector turns from agriculture sector in 1992 into service sector in 2007; (3) the consumption level and the emission intensity are the main drivers that influence the change in indirect carbon emissions; and (4) the factor of consumption level presents positive effect on the emissions, while the emission intensity effect plays a negative role. Besides, the factors of urbanization, production structure, population size and consumption structure also promote the rapid increase in carbon emissions.

DOI

[46]
Weber C L, Matthews H S, 2008. Quantifying the global and distributional aspects of American household carbon footprint.Ecological Economics, 66(2/3): 379-391.Analysis of household consumption and its environmental impact remains one of the most important topics in sustainability research. Nevertheless, much past and recent work has focused on domestic national averages, neglecting both the growing importance of international trade on household carbon footprint and the variation between households of different income levels and demographics. Using consumer expenditure surveys and multi-country life cycle assessment techniques, this paper analyzes the global and distributional aspects of American household carbon footprint. We find that due to recently increased international trade, 30% of total US household CO 2 impact in 2004 occurred outside the US. Further, households vary considerably in their CO 2 responsibilities: at least a factor of ten difference exists between low and high-impact households, with total household income and expenditure being the best predictors of both domestic and international portions of the total CO 2 impact. The global location of emissions, which cannot be calculated using standard input utput analysis, and the variation of household impacts with income, have important ramifications for polices designed to lower consumer impacts on climate change, such as carbon taxes. The effectiveness and fairness of such policies hinges on a proper understanding of how income distributions, rebound effects, and international trade affect them.

DOI

[47]
Wei Yiming, Liu Lancui, Fan Yinget al., 2007. The impact of lifestyle on energy use and CO2 emission: An empirical analysis of China’s residents.Energy Policy, 35: 247-257.Based on the application of a Consumer Lifestyle Approach (CLA), this paper quantifies the direct and indirect impact of lifestyle of urban and rural residents on China's energy use and the related CO emissions during the period 1999 2002. The results show that approximately 26 per cent of total energy consumption and 30 per cent of CO emission every year are a consequence of residents lifestyles, and the economic activities to support these demands. For urban residents the indirect impact on energy consumption is 2.44 times greater than the direct impact. Residence; home energy use; food; and education, cultural and recreation services are the most energy-intensive and carbon-emission-intensive activities. For rural residents, the direct impact on energy consumption is 1.86 times that of the indirect, and home energy use; food; education, and cultural recreation services; and personal travel are the most energy-intensive and carbon-emission-intensive activities. This paper provides quantitative evidence for energy conservation and environmental protection focused policies. China's security for energy supply is singled out as a serious issue for government policy-makers, and we suggest that government should harmonize the relationships between stakeholders to determine rational strategies.

DOI

[48]
Wiedenhofer D, Guan Dabo, Liu Zhuet al., 2017. Unequal household carbon footprints in China. Nature Climate Change, 7: 75-80.No abstract is available for this item.

DOI

[49]
Wooldridge J, 2010. Econometric Analysis of Cross Section and Panel Data. 2nd ed. Massachusetts: MIT Press.

[50]
World Bank Group, 2016. down

[51]
Yuan Bolong, Ren Shenggang, Chen Xiaohong, 2015. The effects of urbanization, consumption ratio and consumption structure on residential indirect CO2 emissions in China: A regional comparative analysis. Applied Energy, 140: 94-106.Based on analysis of input–output energy and household expenditure data (IO-EA-expenditure), this paper calculates China’s indirect carbon emissions from residential consumption in 2002 and 2007, by region. Then a new Structural Decomposition Analysis (SDA) model is proposed to investigate the regional variations of impacts of urbanization, consumption ratio and consumption structure on residential indirect CO2emissions in China during 2002–2007. As the results suggest, expansion of urbanization and upgrade of consumption structure play important roles in the growth of residential indirect emissions. Transformation of consumption ratio, contributing the most to emissions in the eastern region, reduces indirect emissions in all regions to a certain extent. The persistent decline of carbon emission intensity still contributes significantly to the decrease in emissions and the rise of per capita consumption plays a dominant role in the growth of residential indirect emissions. Based on empirical results, this article provides policy suggestions which can help reduce China’s residential indirect CO2emissions.

DOI

[52]
Zha Donglan, Zhou Dequn, Zhou Peng, 2010. Driving forces of residential CO2 emissions in urban and rural China: An index decomposition analysis. Energy Policy, 38(7): 3377-3383.There exist many differences between urban and rural China among which residential CO emissions arising from energy consumption is a major one. In this paper, we estimate and compare the energy related CO emissions from urban and rural residential energy consumption from 1991 to 2004. The logarithmic mean Divisia index decomposition analysis is then applied to investigate the factors that may affect the changes of the CO emissions. It is found that energy intensity and the income effects, respectively, contributed most to the decline and the increase of residential CO emissions for both urban and rural China. In urban China, the population effect was found to contribute to the increase of residential CO emissions with a rising tendency. However, in rural China, the population effect for residential CO emissions kept decreasing since 1998.

DOI

[53]
Zhang Yan, Chen Taizheng, Qin Yaochen, 2013. Spatial pattern and the influencing factors of CO2 emissions from urban residents direct energy consumption.Journal of Henan University (Natural Science), 43(2): 161-167. (in Chinese)Based on statistical data of the year 2009,the amount of CO2 emissions from residents' direct energy consumption was estimated in each prefectural-level cities in China.CO2 emissions at different scales of spatial pattern and its influencing factors were analyzed.Results are as follows.There are distribution differences in the quantity of urban residents' CO2 emissions per capita from direct energy consumption at different spatial scales.From the regional perspective,the northeast and east regions are more than those in the central and western regions,the north more than the south.From the provincial perspective,the provinces in the northern high latitudes are more than those in south,the four central provinces without central heating are lowest.From the city level,the cities in the northern higher latitudes and the Pearl River Delta are more than other cities.There are also distribution differences in the structure of urban residents' CO2 emissions per capita at different spatial scales.Northern cities are dominated by central heating and power,southern cities by power and transportation,northeast cities by the main central heating,east cities by power and transportation,and cities in central and western areas are of relatively homogeneous composition.Urban residents' CO2 emissions per capita from direct energy consumption show spatial differences in the direction of east-west and north-south in the role of economy and climatic.Urban size influences the quantity of CO2 emissions per capita from transportation.

[54]
Zhao Rui, Min Ning, Geng Yonget al., 2016. Allocation of carbon emissions among industries/sectors: An emissions intensity reduction constrained approach. Journal of Cleaner Production, 142(4): 3083-3094.61The overall reduction of carbon emissions is allocated to 41 industrial sectors.61An input-output analysis with entropy weighting is applied to the allocation.61A carbon reduction labeling scheme is proposed to embody the responsibility for emissions reduction.61Policy implications are given on the allocation of carbon emissions.

DOI

[55]
Zhao Rui, Zhou Xiao, Jin Qiaoet al., 2016. Enterprises’ compliance with government carbon reduction labelling policy using a system dynamic approach. Journal of Cleaner Production, 163: 303-319.

[56]
Zhu Qin, Peng Xizhe, Wu Kaiya, 2012. Calculation and decomposition of indirect carbon emissions from residential consumption in China based on the input-output model.Energy Policy, 48: 618-626.78 We build the input–output model of indirect carbon emissions from residential consumption. 78 We calculate the indirect emissions using the comparable price input–output tables. 78 We examine the impacts on the indirect emissions using the structural decomposition method. 78 The change in the consumption structure showed a weak positive effect on the emissions. 78 China's population size is no longer the main reason for the growth of the emissions.

DOI

[57]
Zhu Qin, Wei Taoyuan, 2015. Household energy use and carbon emissions in China: A decomposition analysis.Environmental Policy and Governance, 25(5): 316-329.Although its per capita carbon emissions are still relatively low, China’s aggregated carbon emissions have grown by nearly 4-fold in the last three decades, and now it is the biggest CO2 emitter in the world. There are many reasons for this emissions growth, and much emphasis has been placed on industrial development, but previous research has estimated that 40% of the growth in Chinese CO2 emissions over the 15 years to 2007 can be attributed to household energy consumption. In this paper, we conduct a decomposition analysis to show that in the period from 1978 to 2008 nearly 60% of the growth in Chinese household emissions can be attributed to the increasing number of households and 40% to increasing emissions per household. We also show that over this period emissions growth in urban households has been six times that of rural households. These results have important implications for policy makers seeking to promote reductions in China’s CO2 emissions, relating for example to family planning and urbanization.

DOI

Outlines

/