Orginal Article

Village-level multidimensional poverty measurement in China: Where and how

  • WANG Yanhui , 1, 2, 3 ,
  • CHEN Yefeng 1, 2, 3 ,
  • CHI Yao 1, 2, 3 ,
  • ZHAO Wenji 1, 2, 3 ,
  • HU Zhuowei 1, 2, 3 ,
  • DUAN Fuzhou , 1, 2, 3*
Expand
  • 1. Beijing Key Laboratory of Resource Environment and Geographic Information System, Capital Normal University, Beijing 100048, China
  • 2. Key Laboratory of 3-Dimensional Information Acquisition and Application, Ministry of Education, Capital Normal University, Beijing 100048, China
  • 3. State Key Laboratory Incubation Base of Urban Environmental Processes and Digital Simulation, Capital Normal University, Beijing 100048, China
*Corresponding author: Duan Fuzhou (1979-), PhD and Associate Professor, specialized in 3S modeling and application. E-mail:

Author: Wang Yanhui (1977-), PhD and Professor, E-mail:

Received date: 2017-10-20

  Accepted date: 2017-12-10

  Online published: 2018-10-25

Supported by

National Natural Science Foundation of China, No.41771157

National Key Research and Development Program of China, No.2018YFB0505402

Scientific Research Project of Beijing Education Committee, No.KM201810028014

Capacity Building for Sci-Tech Innovation-Fundamental Scientific Research Funds, No.025185305000/192

Copyright

Journal of Geographical Sciences, All Rights Reserved

Abstract

Village is an important implementation unit of national poverty alleviation and development strategies of rural China, and identifying the poverty degree, poverty type and poverty contributing factors of each poverty-stricken village is the precondition and guarantee of taking targeted measures in poverty alleviation strategies of China. To respond it, we construct a village-level multidimensional poverty measuring model, and use indicator contribution degree indices and linear regression method to explore poverty factors, while adopting Least Square Error (LSE) model and spatial econometric analysis model to identify the villages’ poverty types and poverty difference. The case study shows that: (1) Spatially, there is obvious territoriality in the distribution of poverty-stricken villages, and the poverty-stricken villages are concentrated in contiguous poverty-stricken areas. The areas with the highest VPI, in a descending order, are Gansu, Yunnan, Guizhou, Guangxi, Hunan, Qinghai, Sichuan, and Xinjiang. (2) The main factors contributing to the poverty of poverty-stricken villages in rural China include road construction, terrain type, frequency of natural disasters, per capita net income, labor force ratio, and cultural quality of labor force. The main causes of poverty include underdeveloped road construction conditions, frequent natural disasters, low level of income, and labor conditions. (3) Chinese poverty-stricken villages include six main subtypes, and most poverty-stricken villages are affected by multiple poverty-forming factors, reflected by a relatively high proportion of the three-factor dominant type, four-factor coordinative type, and five-factor combinative type. (4) There exist significant poverty differences in terms of geographical location and policy support, and the governments still need to carry out targeted poverty alleviation measures according to local conditions. The research can not only draw a macro overall poverty-reduction outline of impoverished villages in China, but also depict the specific poverty characteristics of each village, helping the government departments of poverty alleviation at all levels to mobilize all kinds of anti-poverty resources.

Cite this article

WANG Yanhui , CHEN Yefeng , CHI Yao , ZHAO Wenji , HU Zhuowei , DUAN Fuzhou . Village-level multidimensional poverty measurement in China: Where and how[J]. Journal of Geographical Sciences, 2018 , 28(10) : 1444 -1466 . DOI: 10.1007/s11442-018-1555-0

1 Introduction

Poverty is a global problem. As the largest developing country, China has a large population living in poverty, making poverty elimination a long-term process, which affects the effectiveness of the global poverty reduction work (Wang and Chen, 2017). Rural poverty has always been a focus of the Chinese government, which has worked to formulate poverty alleviation and development strategies (Duclos et al., 2009; SCC, 2011; Lu, 2012). Since the reform and opening up, China’s rural anti-poverty efforts have achieved remarkable results. However, a “bottleneck,” where the rate of poverty reduction reduces and the pressure of poverty alleviation increases, eventually emerged. In 2011, China raised the poverty line and set a 2300 yuan per capita net income as a new national rural poverty alleviation standard, resulting in the fact that the number of poor people in China increased from 26.88 million to 128 million, marking a new stage for the Chinese anti-poverty campaign (Yang, 2012). At the end of 2016, there were still 128,000 poverty-stricken villages and 45,750,000 farmers living below the poverty line in China, according to 2016 China’s poverty alleviation and development yearbook. Meanwhile, “taking targeted measures in poverty alleviation” mechanism has changed from a “flood irrigation for all regions” general support pattern to a “drip irrigation at certain points” specific one, accompanying with the target scale unit of poverty alleviation transferring from the county to the village. Taking targeted measures in village-level poverty alleviation that focused on the overall development of the whole village has been regarded as a key measure of rural poverty alleviation work in the new stage. Therefore, further investigations of the village-level poverty characteristic are needed to respond to national targeted poverty alleviation strategy, make every effort to improve the overall life quality of the poor, and enable the sustainable development of the villages (Grays, 2005; Yang, 2012; Wang and Qian, 2017).

2 Literature review

To date, many scholars have adopted regional poverty methodologies and multidimensional poverty theories to conduct a number of academic studies on rural poverty (Alkire and Foster, 2010; Guedes et al., 2012; Betti et al., 2015; Wang and Wang, 2016). It was also demonstrated that GIS is a useful tool to identify environmental factors that influence poverty and spatial statistics is an effective method in revealing similarities and dissimilarities of poverty in household and regional units (Thongdara et al., 2012; Wang and Chen, 2017). Moreover, in terms of detecting poverty contributing factors, there are indeed diversified poverty contributing factors, indicating that poverty is driven not only by individual’s own characteristics, but also by the environment where they live, i.e., economic development, social development and ecological environment. Therefore, some poverty factors analysis methods came from statistical regression, e.g., Orthogonal Least Squares (OLS) regression analysis and multiple linear regression (Thongdara et al., 2012; Behruz et al., 2014; Peirovedin et al., 2016).
In China, many scholars and organizations focused on exploring the spatial distribution and contributing factors of poverty. For example, Liu and Xu (2015) studied vulnerability - sustainable livelihoods geographical framework for county-scale multidimensional poverty identification and classification in Chinese rural areas. Luo et al. (2016) performed a GIS analysis on the spatial distribution pattern and evolution of local poverty-stricken villages in 11 poverty-stricken counties of Qinba (Qinling-Daba) mountainous area, and quantitatively analyzed their impact factors of poverty. With the help of Chinese household survey data, Olivia et al. (2011) examined the relationship between poverty and environmental variables in rural areas of Shaanxi. Pei et al. (2015) estimated the poverty level in Liupan mountainous area by measuring the poverty tolerance index, FGT index, and poverty index. Liu and Li (2015) studied poverty causes of Hubei ethnic regions in Wuling area using a linear regression model. Chen (2013) performed an in-depth analysis of the rural poverty mechanism from the perspective of transaction cost and designed a poverty alleviation strategy for the mountainous area. Wang et al. (2014) calculated village-level multidimensional poverty degree in Neixiang County using the “A-F” method proposed by Alkire and Foster (2010), and analyzed the village-level poverty characteristics and their spatial distribution pattern. Zhao (2015) analyzed the spatial factors of the poverty trap in contiguous poor areas by combining the TOPSIS model and so-called obstacle degree model in terms of geographical capital theory.
Generally speaking, the present China-related study focused on county-level poverty analysis, e.g., poverty degree, spatial distribution pattern, and the factors causing poverty. However, due to the relative lack of statistical information in China’s administrative villages, China’s comprehensive ‘Entire-village Advancement’ regional poverty reduction strategy still lacks a global quantitative classification on village-level regional poverty type. As for the spatial distribution of poverty-stricken villages from the perspective of China’s national level, the measurement and analysis of village-level regional poverty has been rare.
In view of this background, this paper will try to answer the following questions: in terms of poverty-stricken villages in China, how to measure their poverty degrees? How to determine their poverty types? How to examine their spatial distribution? How to understand China’s village-level poverty characteristics? That’s to say, this paper will take the poverty- stricken village as the regional research unit, adopting “entire-village advancement” data issued by the Chinese government during the 12th Five-Year Plan period of China (2011- 2015), to construct a multidimensional integrated poverty model for measuring the poverty degree and the poverty type of poverty-stricken villages, as well as their spatial distribution across the country, so as to examine the national zoning pattern of poverty-stricken villages and provide technical support for the national strategy of overall poverty alleviation in 2020.

3 Study area and materials

3.1 Study area

Totally, there are 53,758 villages involved in this study, covering 13 contiguous destitute areas, 27 provinces, 1311 counties, as shown in Figure 1. From a historical point of anti-poverty view, these 13 contiguous destitute areas mostly belong to old revolutionary areas, ethnic minority areas, frontier areas, and have been considered as the main battlefield of poverty alleviation of China due to their “centralized contiguous” and “special difficult” poverty characteristics (Wang and Chen, 2017). After decades of development, the problems of survival, food and clothing of rural residents in these areas have been basically solved, and the remarkable achievements have been gained in education, health care, public services, environmental protection, etc., however, there are still several critical problems that can be epitomized by weak infrastructure, social undertakings lagging behind, lack of public services and insufficiency of industrial development (Wang and Chi, 2016). In terms of physical geography, most of them are covered by the Loess Plateau, Qinghai-Tibet Plateau, southwest rocky desertified area, and other harsh natural conditions, facing the severe challenges of eventual storm fortification, financial trouble and poverty-relief as well as return to poverty. Poverty alleviation in these areas will determine the success or failure in China’s national anti-poverty strategies. Therefore, comprehensive development and evaluation means are especially needed to lift them out of poverty. In addition, what needs to be explained is that Tibet is excluded from the study due to regional data privacy.
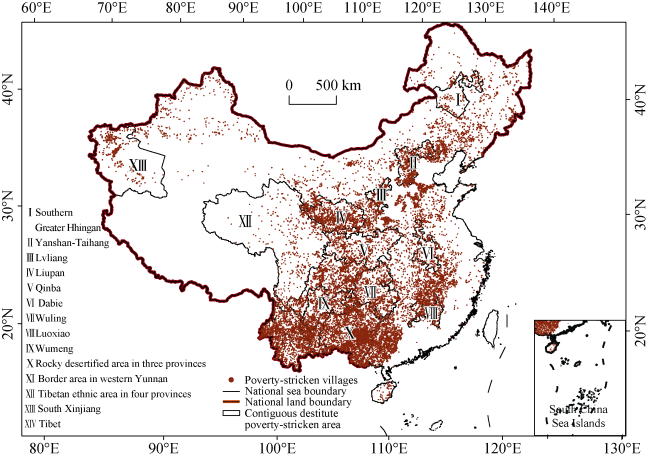
Figure 1 Distribution of the sampling sites in China

3.2 Data description

There are two parts of data in this study, one is economic data and the other is geographical data. The economic data mainly comes from “Entire-village Advancement” archived village dataset, i.e., “village sheets”, issued by State Council Leading Group Office of Poverty Alleviation and Development of China in 2014. The “village sheets” list the basic monitoring information of each administrative village, including economic development, production and living conditions, infrastructure, education, medical facilities and social security, etc. Meanwhile, we acquired China statistics yearbook of the same period to support the further poverty analysis.
Geographical data used here is 1:250,000 national fundamental geographic dataset of China, supporting the comprehensive evaluation and thematic poverty representation of poverty characteristics. Before being used in this study, all these data had been preprocessed in ArcGIS 10.2 by adopting geo-referencing, vectorization, removing coarse data, and so on.

4 Methods

China’s current anti-poverty strategies claimed to take targeted measures in “Entire-village Advancement” poverty alleviation to promote village-level overall and comprehensive development, overcoming poverty targeting deviation and ineffective utilization of poverty alleviation resources (Wang and Chen, 2017). Meanwhile, poverty’s overall situation in rural China has already changed fundamentally, lying in that poverty is no longer only caused by traditional economic lags, but mainly by spatial poverty contributing factors that comprehensively reflect economic disadvantage, social and political disadvantage, ecological disadvantage from three perspectives of economy, society and environment (Hentschel et al., 2000; Higgins et al., 2010; Liu et al., 2016; Wang et al., 2017). Therefore, as far as poverty-stricken villages are concerned, the examination on their poverty characteristics also shows a specialized demand on the spatial distribution of poverty and the relationship between poverty and surrounding environment (Hentschel et al., 2000; Bird et al., 2007; Wang and Chen, 2017). In this context, we conduct a multidimensional poverty detection from the combined views of spatial economics and new economic geography, and integrate a series of indicators to synthesize special development capital and then to determine whether there exist certain poverty types by measuring village-level multidimensional poverty degree and analyzing their poverty factors.

4.1 Village-level multidimensional poverty degree measurement

From the perspective of the harmonious and sustainable development of humans and land resource, both the geographical and socioeconomic factors affecting the development of poor villages were comprehensively screened to design a multidimensional village-level poverty index system, aiming at measuring comprehensive poverty level of each village, as well as providing data basis for poverty contributing factor analysis.
Therefore, for the comprehensive evaluation of relative poverty levels from the natural and socioeconomic aspects of each administrative village, we considered the basic requirements of comprehensive, objective, scientific nature and operability of index selection, and the fairness, multidimensional integration, policy relevance, data availability and other comprehensive needs, (Harun, 2011; Ravallion, 2011; Alkire and Santos, 2013; Liu et al., 2016; Wang and Chen, 2017), a candidate set of multidimensional poverty assessment index systems for administrative villages - including factors such as nature, ecological environment, economics, and social security - was constructed. The candidate indices were selected according to the correlation of the indices and the requirements of the division index. Finally, a measurement index system of village-level multidimensional poverty was determined (Wang and Chen, 2017). As shown in Table 1, it consisted of 6 dimensions and 20 indices, i.e., X1-X6 and X11-X61, respectively.
Table 1 Village-level multidimensional poverty measurement indicators
Dimension No. Indicator Indicator implication
Geographical environment (X1) X11 Distance from the nearest town’s bazaar The distance from the village to the nearest town’s bazaar (km)
X12 Terrain type Terrain type of the village (namely, plain, hilly, plateau, basin)
X13 Frequency of exposure to natural disasters The frequency of natural disasters in the village
Administrative village’s feature (X2) X21 Village historical features Whether the village is an old revolutionary base spot, or ethnic minorities gathering one, or border one, or not
X22 Population density Population density of the village (headcount/km2)
Production and living condition (X3) X31 Per cultivated area Per cultivated area in the village (mu)
X32 Road access ratio The ratio of natural villages traveling by motor vehicle roads to all natural villages in an administrative village (%)
X33 Electricity access ratio The ratio of the households accessing to electricity to all the households in an administrative village (%)
X34 Phone access ratio The ratio of households accessing to electricity to all the households in an administrative village (%)
Radio and television access ratio The ratio of households accessing to radio and television to all the households in an administrative village (%)
X35 Safe drinking water access ratio The ratio of the households access to safe drinking water to all the households in an administrative village (%)
X36 Sanitary toilet facilities access ratio The ratio of the households access to sanitary toilet facilities to all the households in an administrative village (%)
X37 Dangerous building ratio The ratio of the households with dangerous buildings to all the households in an administrative village (%)
Labor force (X4) X41 Ratio of labor force The ratio of labor forces to all population in an administrative village
X42 Ratio of labor-out The ratio of migrant labors to all labor forces in an administrative village
X43 Ratio of illiterate labor forces The ratio of illiterate labors to all labor forces in an administrative village
“Yulu Plan” participation ratio The ratio of those labor forces participating in “Yulu Plan” to all the labor forces (%)
Medical facilities and social security
(X5)
X51 Clinics per one thousand people The clinic number that per one thousand people have in an administrative village
X52 Doctors per one thousand people The number of doctors that per one thousand people have in an administrative village
X53 Population ratio in the New Rural Co-operative Medical Insurance of China The ratio of population taking part in the new rural co-operative medical insurance of China to all population in an administrative village (%)
X54 Population ratio in rural social endowment insurance The ratio of population taking part in rural social endowment insurance to all population in an administrative village (%)
Economic development (X6) X61 Per capita net income Per capita net income in an administrative village
Then, we use the index grade classification method to normalize the different dimensional indices, and the index value is divided into grades 1-5 in the index system. A higher grade indicates more severe poverty (Chen et al., 2016). Further, a subjective and objective weighting method combining analytic hierarchy process (AHP) and entropy weight method (Wang and Chen, 2017), which takes into account the preferences of the decision maker, but also reduces the weight of the subjective randomness, was used to measure the importance of each dimension and index.
The last step is to use the integrated sum method to calculate the village-level multidimensional integrated poverty index (VPI) by the formula:
\[VPI=20\underset{i=1}{\overset{n}{\mathop \sum }}\,\left( \underset{j=1}{\overset{m}{\mathop \sum }}\,{{I}_{ij}}{{\omega }_{ij}} \right){{\omega }_{i}}\ (1) \]
where n indicates the number of dimensions, Iij indicates the normalized index value of the ith dimension, m represents the value of the index corresponding to i dimensions, ωij represents the weighting of the index, ωi represents the dimension weights, and 20 is the constant used to eliminate small digital effects and increase the difference between the data.

4.2 Poverty factors analysis

A poverty index contribution analysis and linear regression analysis of the index and the incidence of poverty were combined to explore the contributing factors to poverty in China’s poverty-stricken villages. Different poverty index factors can effectively reflect the contribution of every poverty-stricken village; however, they can easily be affected by a subjective model design. Meanwhile, a linear regression analysis of the index and the incidence of poverty can statistically describe the differences in poverty factors more objectively, but cannot provide the specific causes of poverty in every poverty-stricken village and is more susceptible to the data dispersion limit. Therefore, this study combined the two methods to analyze the causal factors of poverty in Chinese poverty-stricken villages and perform cross-validation.
(1) Index contribution degree
Contribution degree Cxij (the contribution of index j to VPI) and contribution comprehensive ranking \(\overline{{{R}_{ij}}}\) were used to express the degree of influence of the expression index on the poverty of the poverty-stricken village, so as to analyze significant factors of poverty-stricken villages and their regional differences. The formula is described as follows:
\[{{C}_{xij}}\text{=}\frac{20{{\omega }_{ij}}{{I}_{xij}}}{VP{{I}_{x}}}\times 100\text{ }\!\!%\!\!\text{ }\ (2) \]
where Cxij represents the contribution degree index j for the ith dimension to poverty degree of the xth village of index I, ωij represents the weighting of index j for the ith dimension, Ixij represents the standardized score of index j for the ith dimension and the xth village, and VPIx represents the village-level poverty index of the xth village.
To analyze the differences in poverty-contributing effects of the studied indicators in a given area, we used the formula
\[\overline{{{R}_{ij}}}=\underset{x=1}{\overset{n}{\mathop \sum }}\,{{{R}_{xij}}}/{n}\;\ (3) \]
where Rxij represents the ranking of contribution degree the jth index among the contributing degrees of the 20 indices for the ith dimension and the xth village, n represents the number of studied sample villages, and \(\overline{{{R}_{ij}}}\) represents the average ranking of contributing degree of the jth index for the ith dimension among all indices.
(2) Linear regression analysis
We used linear regression analysis to study the interdependence of multiple variables, which not only establishes a rigorous mathematical model for prediction, but also expresses the relationship between variables. With the incidence of poverty in poverty-stricken villages as the dependent variable and indicators in Table 1 as independent variables, the linear regression method was used to test the relationship between the incidence of poverty and the indices, which analyzed the major poverty-contributing factors complementarily to index contribution degree method.

4.3 Poverty type analysis

Based on significant factors for poverty from the index level for impoverished villages as described in the above sections, the Least Square Error (LSE) model was implemented to analyze the types of poverty in the poverty-stricken villages from the dimension level. The principle of the LSE model is to find the minimum variance between the sample and the actual distribution of the sample (Wang and Chen, 2017). The formula is described as follows:
${{S}^{2}}=\frac{1}{n}\underset{i=1}{\overset{n}{\mathop \sum }}\,{{({{x}_{i}}-{{y}_{i}})}^{2}} (4)$
where S2 represents the variance, xi represents the poverty contribution of a dimension of the poverty-stricken village, and yi represents the poverty contribution of the poverty-stricken village in a given dimension.
By referring to Formula 2, the dimensions of the impoverished village were ranked in descending order of contribution to VPI. Then, the variance of each ranked contribution degree and contribution of each theoretical model was calculated and arranged in descending order (for the single-factor dominant type, only 1 dimension exists, and the contribution degrees of all other dimensions are 0). Finally, the theoretical model with the least variance was determined to be the type of poverty of the poverty-stricken villages. The dimensions with nonzero theoretical contributions were the poverty-contributing dimensions, demonstrating the poverty type (e.g., single-factor dominant type, dual-factor driving type, three-factor dominant type, four-factor coordinative type, five-factor combinative type, six-factor comprehensive type) and specific dimensions of poverty in poverty-stricken villages (e.g., geographical environment, administrative village characteristics, production and living conditions, labor conditions, medical and health social security, economic development).

4.4 Spatial econometric analysis

(1) Spatial kernel density estimation
As a non-parametric way to estimate the probability density function of a random variable from fundamental data smoothing problems, the objective of kernel density estimation (KDE) is to produce a smooth density surface of point events over space by computing event intensity as density estimation (Schnabel and Tietje, 2003; Serra-Sogas, 2003; Xie and Yan, 2008). Compared to spatial separation view, KDE is a more reliable and desirable hotspot analysis technique used for analyzing the first order properties of a point event distribution, and can aid in the determination of the number of clusters through the examination of contours at different levels of inclusion as means of looking for structure at different scales of spatial resolution (Lu, 1998; Xie and Yan, 2008). KDE can be calculated in a 2-D space as follows (Xie and Yan, 2008):
\[\lambda (s)=\sum\limits_{i=1}^{n}{\frac{1}{\pi {{r}^{2}}}k\left( \frac{{{d}_{is}}}{r} \right)}\ (5) \]
where λ(s) is the density at location s, r is the search radius (bandwidth) of the KDE, n is the number of sampling points, and k is the weight of a point i at distance dis to location s. k is usually modeled as a kernel function of the ratio between dis and r. In this study, we used a kernel with a Gaussian function to explore the aggregation distribution of different poverty type.
(2) Theil-T difference analysis
To measure the effectiveness and efficacy of third-party departments on the anti-poverty development, Theil-T coefficient was introduced here to conduct inter-class and intra-class difference analysis. Compared with other diversity analysis (e.g., Gini coefficient and variable coefficient), Theil-T coefficient model could break down the overall differences (Tt) of the research area into inter-regional differences (Tr) and intra-regional differences (Ta), so that the gap or inequality between different types of counties can be better revealed (Theil and Sorooshian, 1979; Wang and Wang, 2016). The formulas are described as follows:
Overall difference: Tt = Tr + Ta (6)
Inter-regional difference: \[{{T}_{r}}=\sum\limits_{i=1}^{n}{{{Y}_{i}}\log \frac{{{Y}_{i}}}{{{P}_{i}}}}\ (7) \]
Intra-regional difference: \[{{T}_{a}}=\underset{i=1}{\overset{n}{\mathop \sum }}\,{{Y}_{i}}\underset{j=1}{\overset{n}{\mathop \sum }}\,{{Y}_{ij}}log\frac{{{Y}_{ij}}}{{{P}_{ij}}}\ (8) \]
where n refers to the number of the classes after each village has been classified; Yi represents the portion of the villages in Class i in the given indicator; Pi represents the ratio of the given villages in class i to the whole villages in the study area. Yij and Pij represent the given indicator’s poverty contribution portion of village j in the class i, and ratio of the village j to all villages in class i, respectively. The larger the Theil-T Index, the bigger the differences of poverty level, and vice versa.

5 Results

5.1 Comprehensive poverty distribution of impoverished villages

In terms of equal-interval classification, the village-level multidimensional poverty index (VPI) was classified into 5 poverty levels, i.e., mild, relative, medium, high, extreme poverty. As shown in Figure 2, poverty level of poverty-stricken villages follows a normal-right distribution, presenting an “olive-shaped” structure with a shape of “large middle, and small at two ends”. The peak point of VPIs is slightly higher than that of the standard normal distribution curve, indicating that there exist more villages with medium poverty than those with mild or extreme poverty. On the other hand, the VPI peak deviates from the standard normal distribution curve to the right, overall indicating that the poverty depth of the villages is relatively high.
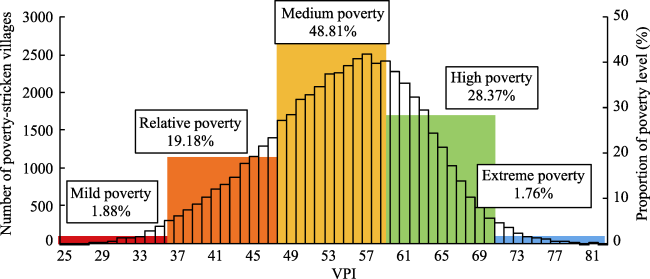
Figure 2 VPI frequency statistics of poverty-stricken villages in China
Meanwhile, from Figure 3, it can be seen that China’s poorest villages are mostly located in the western region, including Gansu, Yunnan, Guizhou, Guangxi, Hunan, Qinghai, Sichuan, and Xinjiang, listed by VPI in descending order. Poverty levels and poverty sizes of different counties are obviously increasing from east to west, and are closely related to the development level of the regional economy. We also find that poverty-stricken villages tend to be concentrated in areas with high VPI scores and are mostly located in contiguous poor areas. These areas featured the densest distribution of poverty-stricken villages, the most concentrated poor population, and the most severe poverty conditions. Dense aggregation of poverty-stricken villages was also found in the following contiguous destitute areas: Lvliang, Liupan and Tibetan areas in four provinces (Sichuan, Yunnan, Gansu and Qinghai), Wumeng, and Wuyi. In provinces such as Chongqing, Shaanxi, Henan, Hubei, Anhui, Hebei, Shandong, and Liaoning, noncontiguous distribution of poor areas are also observed. These results indicate the differences in both the scale of China’s poverty-stricken villages and the distribution of poverty levels. With worsening poverty, the poverty-stricken villages tend to concentrate in remote locations with steep terrain and contiguous fragile ecology.
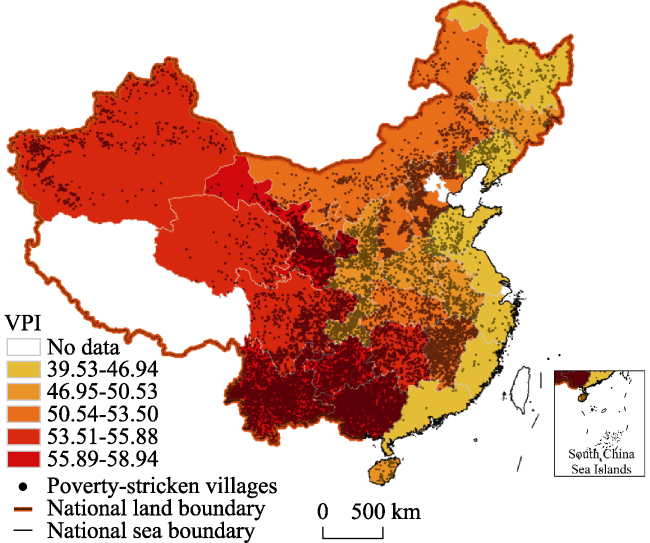
Figure 3 The spatial distribution of poverty-stricken villages in China

5.2 Causal factors of poverty in impoverished villages

5.2.1 General analysis of causal factors of poverty
Among all measured indicators for poverty-stricken villages in China, indices (ranked in descending order of contribution degree) include road access ratio (X32), terrain type (X12), frequency of exposure to natural disasters (X13), per capita net income (X61), ratio of labor force (X41), labor illiterate labor forces (X43), and proportion of labor-out (X42). In order to comprehensively consider the individual differences among poverty-stricken villages, indices ranking 1-20 according to contribution degree to poverty were determined and listed in Table 2. It can be seen that: 1) From the analysis of poverty index contribution and average ranking trends, the primary reasons for the poverty of the poverty-stricken villages included natural environment disadvantages, abominable terrain conditions, inconvenient traffic environment, and frequent natural disasters, all of which limit the development potential of the poverty-stricken villages. The second reason was related to disadvantages in human labor, including unbalanced personnel structure, relatively poor labor quality, and limited employment environment, all impeding the poverty alleviation of poverty-stricken villages.
Limited market connectivity and inadequate infrastructure also affected the development of poverty-stricken villages. 2) By comparing the contribution and average ranking of the analyzed indicators, it can be seen that both showed generally similar trends, but with some differences in individual indicators. For example, the contribution of road access ratio (proportion of road construction) was higher than that of terrain type, while terrain type had a higher ranking, indicating that traffic problems more profoundly affect China’s overall poverty, but terrain conditions are the primary cause for the development of the poverty-stricken villages. There is a similar relationship between the per capita net income and the proportion of the labor force, indicating that the difference in poverty was more reflected in income, while the internal influence was mainly contributed by labor force status.
In addition, linear regression analysis was used to analyze the influencing factors of poverty incidence, with goodness-of-fit of linear regression equation of R2 = 0.622, F = 6841.308, sig = 0.000. Thus, the regression results were significant; the t-test suggested that indicators were significant at the 0.01 level. Type of poverty-stricken village and population density were excluded from the model due to lack of significance. As indicated in Table 2, the results of the Beta analysis of the linear regression standardized coefficient featuring the importance of indicators showed significantly positive and negative effects of the indicators on the incidence of poverty, which met our assumptions and was in line with the actual situation. The statistical results showed that the factors affecting the incidence of poverty were, in descending order, per capita net income (X61), road access ratio (X32), labor illiterate labor force (X43), frequency of natural disasters (X13), terrain type (X12), ratio of migrant labor force (X42), and ratio of labor force (X41). The most significant poverty indicators impacting poverty-stricken villages were similar to the results of the index contribution and average ranking method, which shows that the modeling-based cause analysis results had good reliability and objectivity.
Table 2 The statistics of rural poverty contributing factors
Indicator X32 X12 X13 X61 X41 X43 X42 X37 X11 X54
Contribution degree (%) 14.82 12.80 9.50 8.25 7.95 6.97 6.22 5.73 5.31 4.26
Average ranking 2.61 2.59 4.89 5.82 5.35 6.88 7.61 7.72 8.14 9.94
Beta -0.220 0.164 0.168 -0.363 -0.157 -0.191 -0.158 0.116 0.038 -0.093
Indicator X36 X21 X31 X35 X34 X22 X53 X33 X52 X51
Contribution degree (%) 3.41 3.35 2.51 2.35 1.83 1.53 0.89 0.87 0.84 0.60
Average ranking 10.72 11.17 12.07 13.45 13.98 15.18 17.68 17.71 17.13 19.37
Beta -0.081 / -0.009 -0.060 -0.086 / -0.035 -0.041 -0.035 -0.074
5.2.2 Main causes of poverty
From Table 2, the poverty contributing factors that most influenced the poverty conditions in poverty-stricken villages were selected for analysis. We found that the main factors leading to the poverty of poverty-stricken villages were road construction, natural disasters, income level, and labor force (ranked in descending order of contribution degree).
(1) Road access status
From Figure 4a, it is evident that road construction was generally underdeveloped in poverty-stricken villages in China, especially in the southwest regions (Yunnan, Guizhou, Sichuan, and Chongqing), the central regions south of Hunan and Hubei, the western part of Xinjiang, and the northern part of Inner Mongolia. Road construction significantly impacted poverty. These areas are mostly plateau and mountainous areas, such as Hengduan Mountains in Sichuan and Yunnan, Yunnan-Guizhou Plateau in Yunnan, Guizhou and Guangxi, Qinling Mountains, Wuling Mountains, and Dabie Mountains; Greater Khingan Range in northern Inner Mongolia; and Tianshan Mountains in Xinjiang. Figure 4b shows that poverty caused by poor road construction (difficulty of access) was closely related to terrain-related poverty. Harsh terrain environment increased the cost of road construction accessing to the poverty-stricken villages, hindering poverty alleviation in local areas. These findings suggest that integrating various types of agricultural funds to improve the administrative road infrastructure is particularly important for speeding up the implementation of the whole village project.
(2) Natural disaster
Figure 4c shows that the poverty-stricken villages affected by serious natural disasters were mainly concentrated in Xinjiang, Inner Mongolia, Qinghai, Sichuan, Yunnan, and Jiangxi. Various types of natural disasters occur frequently in these areas, mainly including meteorological disasters such as drought, flood, cold wave, and dry-hot wind, and biological disasters such as animal epidemic situations and wheat disease. Comparing the distribution pattern of other influencing factors in Figure 4, we found that the impact of income and labor force on poverty was relatively small; the main cause of poverty in these areas was the limitation of the natural environment. It is the high degree of overlap between the rural poor areas and ecologically fragile areas prone to natural disasters that results in the high population vulnerability of these areas.
(3) Income level
From the spatial distribution of the contribution of income indicators shown in Figure 4d, it can be seen that the areas seriously affected by income level were concentrated in southern Xinjiang and the border area between Qinghai and Sichuan. A comprehensive comparative analysis of other poverty factors showed that the contribution degree distributions of labor quality index and income were most similar. The significant influence of income on the southern part of the Qinghai-Sichuan border area was related to the remote location and geographical isolation, as well as relatively conservative culture; all of these factors caused relatively low cultural quality for the local people and the resulting lower income levels. Overall, the cause of long-term poverty in poor areas of China is not limited to a relatively low level of income, but is influenced by multiple factors, including natural environment, social environment, and labor conditions, which have limited the development potential of poor rural areas and trapped them in long-term poverty.
(4) Labor force status
It can be seen from Figures 4e and 4f that the areas with poor labor conditions were mainly distributed in the western region - especially in both southern Xinjiang and Tibetan ethnic area in four provinces (Sichuan, Yunnan, Gansu and Qinghai). The two contiguous destitute areas were located in deep inland areas, and the remote location restricted the development of infrastructure and basic education. The per capita education period in these areas was only around seven years. Meanwhile, the relatively closed geographical environment prevented communication with the outside world, and conservative and backward ideas remained. These factors led to the unbalanced local structure of the poor population and the low cultural quality of the labor force. A similar situation was also found in other areas of the poverty-stricken villages, mostly located in 14 contiguous poverty-stricken areas and surrounded by mountainous areas with a closed geographical environment.
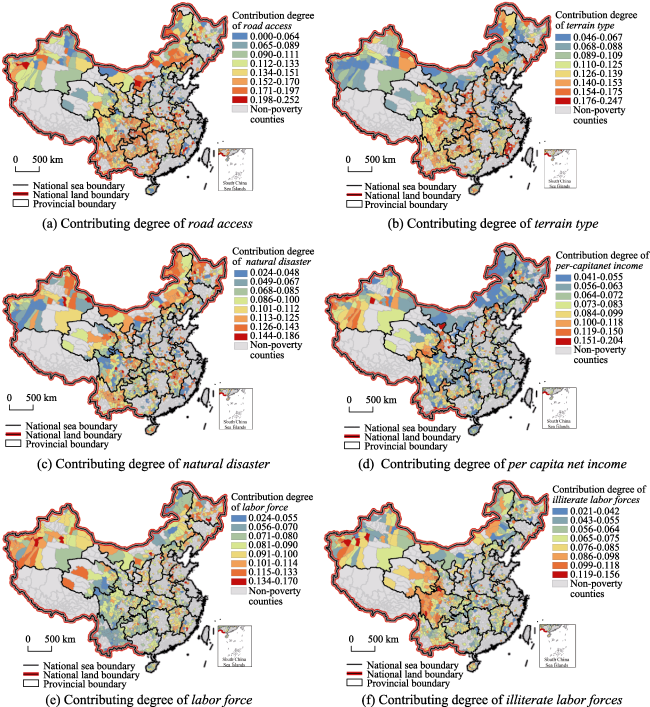
Figure 4 Spatial distribution of the main factors leading to rural poverty in China

5.3 Poverty type of impoverished villages

5.3.1 Overall analysis
In the present study, the LSE model was used to determine the types of poverty in the poverty-stricken villages of China, and the impacting degree on each dimension of poverty type was analyzed. The results are presented in Table 3. It can be seen that the poverty type of underdeveloped villages in China can be divided into 6 categories: single-factor dominant type, dual-factor driving type, three-factor dominant type, four-factor coordinative type, five-factor combinative type, and six-factor comprehensive type. The three-factor dominant type is most widely distributed, covering over half of all studied poverty-stricken villages. Moreover, villages were usually affected by multiple poverty-causing factors, while the single-factor dominant type was only attributed to 0.14% of villages, indicating a complex poverty-contributing situation in China and suggesting that poverty alleviation should be realized by local-specific measures targeting the major problems of local areas. Targeted support should be provided by implementing the innovative methods of poverty alleviation and development proposed by the 13th Five-Year Plan released by the Chinese government in 2016.
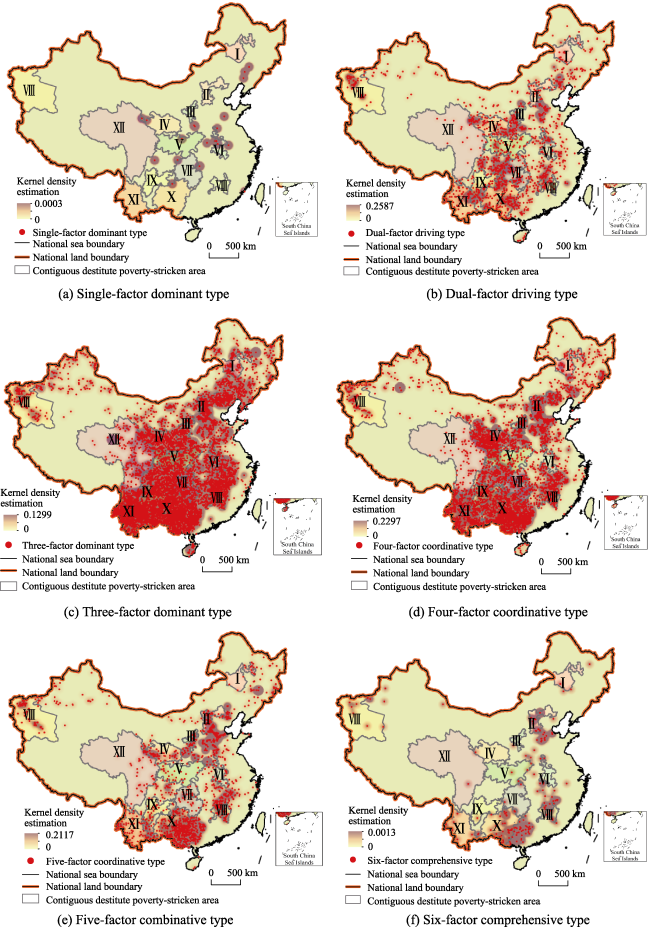
Table 3 Distribution of poverty types and poverty contributing factors
Poverty type Average VPI Poor village ratio (%) G-probability (%) V-probability (%) P-probability (%) L-probability (%) M-probability (%) E-probability (%)
Single-factor dominant type 36.99 0.14 50.00 0.00 29.17 20.83 0.00 0.00
Dual-factor driving type 48.46 8.24 81.67 1.98 69.15 46.37 0.33 0.50
Three-factor dominant type 55.67 53.33 97.64 5.69 95.41 94.80 3.28 3.18
Four-factor coordinative type 56.28 28.99 98.34 33.92 96.45 98.12 32.59 40.58
Five-factor combinative type 54.34 8.36 99.40 79.17 98.00 99.23 65.43 58.78
Six-factor comprehensive type 51.58 0.94 100.00 100.00 100.00 100.00 100.00 100.00
Sum 55.08 100.00 96.63 20.59 93.71 92.09 17.64 19.36

Note: G-, V-, P-, L-, M- and E- respectively represent in turn geographical environment, village characteristic, production and living condition, labor force, medical facilities and social security, economic development. G-, V-, P-, L-, M- and E- probability denote the contributing degree of each dimension causing poverty in their corresponding poverty types, respectively.

5.3.2 Classification analysis
Poor villages with the same poverty type may have different subtypes due to internal differences in poverty-contributing dimensions, therefore, analysis of the inherent characteristics of each type of poverty and its subcategories can reveal the specific distribution of the poverty-stricken villages in China.
(1) Single-factor dominant type has only 0.14% of studied poverty-stricken villages. According to the different causes of poverty, this type can be further divided into geographical environment factor dominant, production and living condition dominant, and labor force dominant. No poverty-stricken village had administrative characteristics, medical and health insurance, or economic development as a dominant factor. Based on the probabilities of these factors, the ranking can be described as geographical environment > production and living conditions > labor force. From Figure 5a, we can see that such poverty-stricken villages were mostly located outside of the contiguous poverty-stricken areas but near poor mountainous areas. Compared with the average VPI scores of different types of poverty-stricken villages in Table 5, the poverty degree of the single-factor dominant type was relatively low, indicating that very few “extreme” examples of poverty-stricken villages were formed due to a lack of resources; these suffered from a lack of adequately maintained geographical environment, production and living conditions, and labor resources. However, such impoverished villages were generally located outside of contiguous poverty-stricken areas, indicating relatively high potential poverty alleviation, which could be implemented by improving the shortage of certain resources.
(2) Dual-factor driving type, accounting for 8.24% of poverty-stricken villages, with a total of 12 dual-factor driving types, is summarized as follows: G-V, G-P, G-L, G-M, G-E, V-P, V-L, P-L, P-M, P-E, L-M, and L-E, among which G-P, G-L, and P-L subtypes were most widely distributed (probability ranking: G-P subtype > G-L subtype > P-L subtype), with combined coverage of 97.17% of Type 2. As shown in Figure 5b, poverty-stricken villages of this type were mainly located in Yanshan Mountain-Taihang Mountain, Lvliang Mountain, Dabie Mountain, Wuling Mountain, Luoxiao Mountain, rocky desertifed areas in Yunnan-Guizhou-Guangxi, border area in western Yunnan and southern Xinjiang.
(3) Three-factor dominant type, accounting for over half (53.33%) of the overall poverty-stricken villages; the main type of poverty-stricken villages in China. A total of 19 subtypes can be divided due to combinations of poverty-forming factors, among which the G-P-L subtype accounted for the highest proportion (88.19%), followed by the G-V-L subtype (2.40%), G-V-P (1.77%), and G-P-M (1.72%); coverage of all remaining subtypes accounted for 5.92%. As shown in Figure 5c, this type of poverty-stricken village was widely distributed throughout China, with contiguous poverty-stricken areas as a center. The poverty level of this type of village was generally high, indicating that such areas are under the combined pressure of different disadvantages, including geographical location, ecology, and socioeconomic disadvantages, which together form a long-lasting poverty trap. The features of high degree of poverty and multiple disadvantages were also observed in the four-factor coordinative type and five-factor combinative type.
Figure 5 The spatial layout of different types of stricken-poverty villages in China
(4) Four-factor coordinative type, accounting for 28.99% of the studied villages, with 16 subtypes. The three main subtypes were G-V-P-L, G-P-L-M, and G-P-L-E, accounting for 92.94% of the four-factor coordinative type. This type presented the most severe degree of poverty among the six types of poverty-stricken villages and a highly concentrated distribution in China compared with the three-factor dominant type, occurring mainly in contiguous poverty-stricken areas.
(5) Five-factor combinative type, accounting for 8.36% of the studied villages, with 6 subtypes. The main subtypes, in descending order, can be described as follows: G-V-P-M-L > G-V-P-L-E > G-P-L-M-E > G-V-L-M-E > G-V-P-M-E > V-P-L-M-E, among which the first three accounted for 96.63% of this type. As indicated in Figure 5e, this type was mainly distributed in Guangxi, Jiangxi, Hebei, Henan, Shanxi, and Shaanxi. Cause analysis showed that these areas were located more deeply inland, with relatively good geographical location and natural environment conditions. However, compared with eastern coastal areas, these areas were disadvantaged in terms of transportation cost, infrastructure, public services, population structure, and social concept. The coexistence of advantages and disadvantages made the poverty-forming causes of these villages more complex.
(6) Six-factor comprehensive type, accounting for only 0.94% of the poverty-stricken villages, featuring multiple causes with equal contributing degrees. The average VPI of such poverty-stricken villages was 51.58, lower than the average level of Chinese poverty-stricken villages and representing a moderate to mild level of poverty. These villages were mostly located outside of contiguous poverty-stricken areas. The comprehensive condition indicates that although the development of this type of poverty-stricken village has been lacking, it is relatively easy to improve.

5.4 Poverty difference in poverty-stricken villages

5.4.1 Poverty difference in geographical location
In this paper, the Hu Huanyong Line (hereafter Hu Line) was introduced as a dividing line of geographical location for analysis of the comprehensive characteristic differences between impoverished villages in northwestern and southeastern China. The Hu Line was proposed by a famous Chinese geographer Hu Huanyong in 1935 and recognized as an important dividing line of China’s population, geography, economy, climate, and terrain. It has been widely recognized and cited at home and abroad (Chen et al., 2016).
(1) Difference in poverty status. As indicated in Figure 6a, poverty-stricke villages were mostly located southeast of the Hu Line. The distribution of poverty degree VPI in Figure 6b shows that the poverty degree was more severe in southeastern China. In addition, it can be seen from Figure 6 that only 13.49% of the poverty-stricken villages were located northwest of the Hu Line, with an average VPI score of 58.87, significantly higher than the average score (52.49) in the southeast. Cause analysis showed that due to differences in the process of “Whole-village Advancement,” information missing has been found with northwest regions where poverty alleviation was more difficult to perform, resulting in the low poverty proportion in the southwest. On the other hand, since regions southeast of the Hu Line contributed 94% of the population and GDP value, and covered 43% of the national land (not including Hong Kong, Macao and Taiwan for now), the extreme unbalanced distribution of population and economics also led to China’s poverty-stricken village on the northwestern side of the Hu Line with sparse distribution, high degree of poverty in its intensive distribution; and southeast with concentrated distribution and low poverty degree.
(2) Difference in poverty-forming causes. The six main poverty-forming causes mentioned above were analyzed, and the results are presented in Table 4. It can be seen that: 1) The contributing degree of road construction, terrain type, and frequency of natural disasters was higher southeast of the Hu Line than the northwest. 2) The per capita net income and the contribution of labor quality index were higher northwest of the Hu Line than southeast, indicating that the influence of income and labor force was more significant to the northwest. 3) The contribution rate of labor force was similar on both sides of the Hu Line. 4) The contribution ratio of the six main poverty-forming factors was generally higher southeast of the Hu Line than northwest, indicating that the poor areas were relatively concentrated in the southeast, making the formulation of poverty alleviation strategies easier. 5) Theil index comparison among the poverty-forming factors showed that the relative influence of the factors was: income > labor quality > labor ratio > disaster > road construction > terrain.
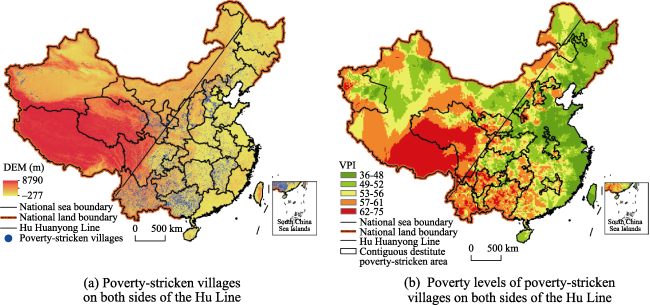
Table 4 The statistics of poverty difference in geographical locations of China
Poverty characteristics Geographical location differences
Northwest of the Hu Line Southeast of the Hu Line Tt Ta Tr
Poverty status Number of villages 6942 44519 / / /
Average VPI 57.87 52.49 0.331 0.046 0.285
Contribution degree of poverty- forming causes Road access ratio (%) 12.78% 13.69% 0.320 0.013 0.307
Terrain type (%) 11.39% 12.41% 0.320 0.012 0.308
Frequency of exposure to natural disasters (%) 9.27% 9.79% 0.346 0.014 0.331
Per capita net income (%) 8.49% 7.495 0.317 0.031 0.287
Labor force ratio (%) 8.48% 8.50% 0.344 0.010 0.334
Illiterate labor forces (%) 7.59% 6.86% 0.349 0.028 0.321
Poverty type Single-factor dominant type (%) 0.05% 0.43% 2.687 0.064 2.623
Dual-factor driving type (%) 9.48% 10.63% 0.753 0.011 0.742
Three-factor dominant type (%) 49.64% 54.38% 0.382 0.012 0.370
Four-factor coordinative type (%) 30.33% 25.54% 0.506 0.036 0.470
Five-factor combinative type (%) 9.83% 8.03% 0.814 0.040 0.774
Six-factor comprehensive type (%) 0.67% 0.99% 1.274 0.001 1.273
(3) Difference in poverty type. Comparison of poverty types of the poverty-stricken villages on the two sides of the Hu Line (Table 4) showed that: 1) The proportion of poverty-stricken villages of the single-factor driving type was only 0.05% in the northwest, compared with 0.43% in the southeast, suggesting that the poverty-forming causes in the northwest are more complex. 2) The skewed normal distribution for both sides of the Hu Line is shown in Figure 6, with the peak value of the southeastern part being more “concentrated” indicating that the poverty type of the southeastern was more “homogenized” than the northeastern counterpart. 3) Ta index comparison among the poverty-forming factors showed that the difference in poverty types for the both sides of the Hu Line was: single-factor dominant type > five-factor combinative type > four-factor coordinative type > three-factor dominant type > dual-factor driving type > six-factor comprehensive type.
Figure 6 Poverty difference in geographical locations of China
Comprehensive analysis showed that regions northwest of the Hu Line were more landlocked and remotely located, with geographical location limitations such as higher transportation cost, more severe biological environment, and more dangerous terrain conditions, contributing to the higher degree of poverty and more complex poverty-causing factors, and the resulting higher pressure of poverty alleviation.
5.4.2 Poverty differences in policy support
“Whole-village Advancement” is an important innovation pattern in the development of the poverty alleviation work in China. It provides an important means for the promotion of new rural construction and development of poverty alleviation by fully integrating all kinds of development resources, improving the production and living conditions of farmers, and enhancing the rural ecological development (Wang and Chen, 2017). In this study, the poverty differences in policy support were examined in terms of the “Whole-village Advancement” implementation status of the villages.
(1) Difference in poverty conditions. Table 5 shows that the average VPI scores of poverty-stricken villages where “Whole-village Advancement” has been implemented were lower than the national average, indicating that the development of these poverty-stricken villages was above average national development. The average VPI of poverty-stricken villages where “Whole-village Advancement” is currently implemented was higher than the national average, but is expected to decrease over time due to the currently applied poverty alleviation policy. The VPI scores of villages where the policy has not yet been implemented were between the above two, which may be attributed to the fact that “Whole-village Advancement” is more likely to be implemented in places with deeper poverty and higher priority. The lower degree of poverty in villages where “Whole-village Advancement” was implemented compared with villages where the policy was not yet implemented also suggested the significance of the policy. A comparison of VPI scores among different groups in Tables 4 and 5 showed that the differences in political support were lower than geographical differences, indicating that poverty was mainly influenced by the limitations of geographic resources, and suggesting that poverty alleviation will be a long process.
Table 5 The statistics comparison in policy support in terms of “Whole-village Advancement”
Poverty characteristics Policy support differences (“Whole-village Advancement”)
Already implemented Being implemented Not yet implemented Ta Tr Te
Poverty status Number of villages 8264 19967 23230 / / /
Average VPI value 54.16 55.63 54.92 0.619 0.018 0.601
Contribution degree of poverty-forming causes Road access ratio (%) 13.64% 14.65% 14.80% 0.651 0.014 0.636
Terrain type (%) 13.92% 12.57% 13.07% 0.638 0.020 0.618
Frequency of exposure to natural disasters (%) 9.84% 9.66% 9.31% 0.661 0.018 0.643
Per capita net income (%) 7.77% 8.34% 7.84% 0.626 0.023 0.603
Labor force ratio (%) 8.30% 7.95% 8.08% 0.663 0.019 0.644
Ratio of illiterate labor forces (%) 6.86% 6.98% 6.85% 0.655 0.021 0.633
Poverty type Single (%) 0.22% 0.06% 0.18% 2.728 0.021 2.706
Two-factor driving (%) 9.97% 7.22% 8.50% 1.208 0.028 1.181
Three-factor dominant (%) 48.71% 55.49% 53.11% 0.745 0.016 0.729
Four-factor coordinative (%) 32.15% 27.82% 28.88% 0.852 0.022 0.830
Five-factor combinative (%) 8.19% 8.44% 8.35% 1.304 0.022 1.282
Six-factor comprehensive (%) 0.76% 17.31% 0.98% 1.974 0.004 1.970
(2) Difference in poverty-forming factors. 1) Comprehensive comparison among the three groups of poverty-stricken villages (ones where “Whole-village Advancement” policy has been implemented, is being implemented, and has not yet been implemented) showed that, with the progress of the policy, the road construction, income, and quality of labor increased gradually. 2) Terrain constraints, natural disasters, and the proportion of the labor force showed little improvement over a short period under “Whole-village Advancement” policy. 3) Theil index comparison among the poverty-forming factors showed that the Tr coefficient was the highest for the contribution degree of per capita net income index, indicating that “Whole-village Advancement” worked efficiently to improve income in poor areas.
(3) Difference in poverty types. Among villages that already implemented “Whole-village Advancement,” the proportion of single-factor dominant type and dual-factor driving type was the highest, and the proportion of five-factor combinative type and six-factor comprehensive type was the lowest, indicating that “Whole-village Advancement” procedures improved some of the development constraints of poverty villages, and the development conditions of the poverty-stricken villages are gradually improving.
Comprehensive analysis showed that the implementation of “Whole-village Advancement” helped improve the development environment of the poverty-stricken villages and increase the income of the poor areas, and is therefore an important step in China's poverty alleviation work.

6 Policy implications

Aiming at the problems of reducing the poverty rate, the “elite capture” of the financial resources in the countryside, the low utilization rate of poverty alleviation resources and the insufficiency of poverty alleviation means, one of the goals of China’s national targeted poverty alleviation strategy is to realize the accurate identification, targeted aid, precise management and accurate assessment of the impoverished village. To accurately implement the poverty alleviation work, we must first overcome the three difficult problems of “support who”, “who will help” and “how to help”.
The relevant research in this paper can provide some technical support and practice help for accurate recognition of poverty-stricken villages. First, using VPI multidimensional poverty measurement model and GIS spatial analysis technology, the relative poverty degree and its spatial distribution of poverty-stricken villages can be more finely obtained on the basis of “whether it is poverty-stricken or not”, to better solve the problem of “supporting who” and their priority. Second, through quantitative analysis to the causes of poverty and poverty types, it can dig into the causes of poverty at the village-level scale, further reveal the distribution characteristics and formation mechanism of the spatial poverty trap, so as to adopt more targeted measures to maximize the utilization of poverty alleviation resources and to solve the problem of “how to help” better. Third, through the research on national large-regional poor village, it can not only draw a more macro overall poverty outline of impoverished villages in China, but also depict the specific poverty characteristics of each village, which can help the government departments of poverty alleviation at all levels to mobilize social poverty alleviation, social poverty alleviation and industry poverty alleviation resources, and provide guidance to help solve the problem of “who will be supported”.
For example, it is found from the results of the paper that, for the poverty “hardest hit”, Gansu, Yunnan, Guizhou and other regions, need properly “tilt” national financial resources that play the role of macroeconomic regulation and redistribution of benefits. The poverty-stricken villages in rural China are poor in many factors, and most of them have restricted factors, such as bad access condition, poor natural environment, low income and low labor cultural quality. Therefore, according to the poverty characteristics of impoverished villages, the corresponding supporting strategies should be formulated to optimize the use of poverty alleviation resources. Through the integration of all kinds of development resources, the “Whole-village Advancement” work can effectively improve the rural development by integrating all kinds of development resources, and further implementation of similar poverty alleviation strategies are also needed.

7 Discussion and conclusions

In this study, we designed a comprehensive multidimensional poverty measurement model, analyzed the poverty-forming factors and poverty types using the index contribution model and LSE model, and characterized the differences among poverty-stricken villages in different geographical locations and policy support conditions. The results showed that: (1) The areas with the highest VPI, in descending order, are Gansu, Yunnan, Guizhou, Guangxi, Hunan, Qinghai, Sichuan, and Xinjiang. The poverty level of a poverty-stricken village is related to the level of regional economic development. Spatially, there is obvious territoriality in the distribution of poverty-stricken villages, and the villages are concentrated in contiguous poverty-stricken areas. (2) The main factors contributing to the poverty of poverty-stricken villages include road construction, terrain type, frequency of natural disasters, per capita net income, labor force ratio, and cultural quality of labor force. The main causes of poverty included underdeveloped road construction conditions, frequent natural disasters, low level of income, and confined labor conditions. (3) Chinese poverty-stricken villages include six main subtypes: single-factor dominant type (0.14% of poverty-stricken villages), dual-factor driving type (8.24%), three-factor dominant type (53.33%), four-factor coordinative type (28.99%), five-factor combinative type (8.36%), and six-factor comprehensive type (0.94%). The results indicate that most Chinese poverty-stricken villages are affected by multiple poverty-forming factors, reflected by the relatively high proportion of the three-factor dominant type, four-factor coordinative type, and five-factor combinative type. (4) Significant differences were observed in poverty-stricken villages located on different sides of the Hu Line. The number of poverty-stricken villages in the northwest region is relatively small, but with a higher overall level of poverty and more complex causes for poverty. The proportion of poverty caused by multiple factors was higher as well, resulting in higher poverty alleviation pressure. The number of poverty-stricken villages in the southeast was larger, but with a relatively lower poverty level, more concentrated poverty-forming causes, and better potential of alleviating poverty. (5) The work of “Whole-village Advancement” has achieved certain poverty alleviation effect, promoted the local development environment and improved the road access, income, labor quality and other development constraints, but still need to further local conditions to carry out targeted work.
Due to a lack of data sources and the limitations of data acquisition, our study sample did not include non-impoverished villages, so we were not able to analyze the differences between poor and non-impoverished villages. Hopefully, this will be improved in future studies.

The authors have declared that no competing interests exist.

[1]
Alkire S, Foster J, 2010. Counting and multidimensional poverty measurement.Journal of Public Economics, 95(7): 476-487.This paper proposes a new methodology for multidimensional poverty measurement consisting of an identification method ρk that extends the traditional intersection and union approaches, and a class of poverty measures Mα. Our identification step employs two forms of cutoff: one within each dimension to determine whether a person is deprived in that dimension, and a second across dimensions that identifies the poor by ‘counting’ the dimensions in which a person is deprived. The aggregation step employs the FGT measures, appropriately adjusted to account for multidimensionality. The axioms are presented as joint restrictions on identification and the measures, and the methodology satisfies a range of desirable properties including decomposability. The identification method is particularly well suited for use with ordinal data, as is the first of our measures, the adjusted headcount ratio M0. We present some dominance results and an interpretation of the adjusted headcount ratio as a measure of unfreedom. Examples from the US and Indonesia illustrate our methodology.

DOI

[2]
Alkire S, Santos M E, 2013. A multidimensional approach: Poverty measurement & beyond. Social Indicator Research, 112(2): 239-257Introduction to the Special Issue Poverty has probably always been understood as a multidimensional problem, yet traditionally it has been measured with one dimension: income. Here we refer to income in a general way. It may actually be income, or consumption, or expenditure. The assumption was that the income level could capture fairly well whether people were able to achieve certain minimum thresholds in a variety of dimensions such as nutrition, clothing and housing. Interestingly, however, the dominant method to compute the income poverty line estimates the cost of a food basket which provides with the minimum amount of calorie intake for a representative adult and incorporates the non-food items by expanding this cost by the inverse of the Engel coefficient, estimated for the group of people whose income is just above the cost of the basic food basket. The Engel coefficient is given by the ratio of expenditure in food items to total expenditure. Thus there is not an estimation of the ...

DOI

[3]
Behruz M Y, Mehdi C, Zahra Y, 2014. Analysis of the factors affecting the spatial distribution of poverty in rural areas, by emphasizing on the economic-social characteristics, case study: Mahmoudabad village, Shahin Dej Town Ship. Geography and Territorial Spatial Arrangement, 4(13): 83-95.From the past times, rural areas as the basic communications have had a major role in the formation and flourishing of civilizations and decline of a great number of civilizations, is concerned to the destruction of villages and disregarding them as basic elements of production, and economic prosperity. At the present, one of the main elements of the production and environmental decline and inefficiency is poverty.So the study to identify poverty reasons and presenting solutions is essential. The present study analyzes the factors affecting the spatial distribution of poverty in rural areas, by emphasizing on the economic- social characteristics. This study is of applied one and from the view point of nature and method is of descriptive 鈥 analytical one.The method for collecting information is of library and field data collection (questionnaires, interviews) and descriptive statistics (mean, standard deviation) and inferential statistics were applied for analyzing information.The present research population is the families of Mahmoudabad county , located in West Azarbaijan Shahindezh township. The county has 26 villages with population in 2011 Census with 8206 Population and 2154 Households. With respect to the spread of the under study area and for detailed and accurate study, 11 villages were selected by Kocharan modified formula and distributed between different population classes of the village through classification sampling method. The results show that the elements of assets, education and banking credit are the most important factors affecting the spatial distribution of poverty in the study area.

[4]
Betti G, Gagliardi F, Lemmi Aet al., 2015. Comparative measures of multidimensional deprivation in the European Union.Empirical Economics, 49(3): 1071-1100.This paper proposes new fuzzy measures of monetary poverty and also non-monetary deprivation, providing an economic interpretation of the parameters involved. For non-monetary deprivation, the paper provides a step-by-step procedure: dimensions or groupings of initial items of deprivation are identified using explanatory and confirmatory factor analyses, and a weighting system is applied for the aggregation of individual items into the dimension they represent. The methodology is applied to European Union countries using European Union-Statistics on Income and Living Conditions (EU-SILC) data for the 2011 survey wave.

DOI

[5]
Bird K, McKay A, Shinyekwa I, 2007. Isolation and poverty: The relationship between spatially differentiated access to goods and services and poverty. Overseas Development Institute.

[6]
Chen M X, Li Y, Gong Y Het al., 2016. The population distribution and trend of urbanization pattern on two sides of Hu Huanyong population line: A tentative response to Premier Li Keqiang.Acta Geographica Sinica, 71(2): 179-193. (in Chinese)In November, 2014, Premier Li Keqiang raised a problem about Hu Huanyong population line(hereinafter referred to as "Hu line"), when visiting the exhibition of sciences of human settlements in National Museum of China, which was called "Premier's Question" by the press. Hence, Hu line has become a highlight currently, and aroused great controversy and different views. Aiming at such dilemma of cognition, this paper gives a general review of the origins of Hu line, which was put forward by the famous population geographer Hu Huanyong in 1935, under the background of a debate on the surplus of domestic population. Based on population census data and GIS platform, the paper analyzes the change of population scale,proportion and density in both southeast and northwest sides of Hu line. The results indicate that the population urbanization and migration do not change the pattern of population distribution determined by Hu line. On such basis, the pattern that the population density of southeast part is large, while that of northwest part is relatively small will not radically change over a longer period, and the pattern that urban agglomeration is mainly located in southeast part as well. The long- term existence of Hu line depends on integrated physical geographical conditions, like climate. At the meantime, this paper argues that the core issue of the Premier's concern is solvable, by positive policy guidance and reasonable spatial organization. It is definitely promising for western China to realize a higher level of modernization and a better quality of urbanization, and central region as well.

DOI

[7]
Chen Z W, 2013. Empirical research on causes of rural poverty and mechanism of poverty alleviation in mountain area: Transaction cost perspective [D]. Wuhan: Huazhong Agricultural University. (in Chinese)

[8]
Deng W J, 2013. Classifying stricken-poverty villages and developing poverty pointedly.Rural Economy, (5): 42-44. (in Chinese)

[9]
Duclos J Y, Araar A, Giles J, 2010. Chronic and transient poverty: Measurement and estimation, with evidence from China.Journal of Development Economics, 91(2): 266-277.The paper contributes to the measurement of poverty and vulnerability in three ways. First, it proposes a new approach to separating poverty into chronic and transient components. Second, it provides corrections for the statistical biases introduced when using a small number of periods to estimate the importance of vulnerability and transient poverty. Third, it applies these tools to the measurement of chronic and transient poverty in China using a rich panel data set that extends over 17 years. Alternative measurement techniques are found to yield significantly different estimates of the relative importance of chronic and transient poverty. The precision of the estimates is also considerably enhanced by simple statistical corrections.

DOI

[10]
Grays L C, Moseley W G, 2005. A geographical perspective on poverty-environment interactions. The Geographical Journal, 171(1): 9-23.Berkeley Electronic Press Selected Works

DOI

[11]
Guedes G R, Brondízio E S, Barbieri A Fet al. 2012. Poverty and inequality in the rural Brazilian Amazon: A multidimensional approach.Human Ecology, 40(1): 41-57.This paper analyses poverty and inequality dynamics among smallholders along the Transamazon Highway. We measure changes in poverty and inequality for original settlers and new owners, contrasting income-based with multidimensional indices of well-being. Our results show an overall reduction in both poverty and inequality among smallholders, although poverty decline was more pronounced among new owners, while inequality reduction was larger among original settlers. This trend suggests that families have an initial improvement in livelihood and well-being which tends to reach a limit later-a sign of structural limitations common to rural areas and maybe a replication of boom and bust trends in local economies among Amazonian municipalities. In addition, our multidimensional estimates of well-being reveal that some economically viable land use strategies of smallholders (e. g., pasture) may have important ecological implications for the regional landscape. These findings highlight the public policy challenges for fostering sustainable development among rural populations.

DOI PMID

[12]
Harun U, 2011. A two-stage feature selection method for text categorization by using information gain, principal component analysis and genetic algorithm.Knowledge-Based Systems, 24(7): 1024-1032.Text categorization is widely used when organizing documents in a digital form. Due to the increasing number of documents in digital form, automated text categorization has become more promising in the last ten years. A major problem of text categorization is its large number of features. Most of those are irrelevant noise that can mislead the classifier. Therefore, feature selection is often used in text categorization to reduce the dimensionality of the feature space and to improve performance. In this study, two-stage feature selection and feature extraction is used to improve the performance of text categorization. In the first stage, each term within the document is ranked depending on their importance for classification using the information gain (IG) method. In the second stage, genetic algorithm (GA) and principal component analysis (PCA) feature selection and feature extraction methods are applied separately to the terms which are ranked in decreasing order of importance, and a dimension reduction is carried out. Thereby, during text categorization, terms of less importance are ignored, and feature selection and extraction methods are applied to the terms of highest importance; thus, the computational time and complexity of categorization is reduced. To evaluate the effectiveness of dimension reduction methods on our purposed model, experiments are conducted using the k-nearest neighbour (KNN) and C4.5 decision tree algorithm on Reuters-21,578 and Classic3 datasets collection for text categorization. The experimental results show that the proposed model is able to achieve high categorization effectiveness as measured by precision, recall and F-measure. (C) 2011 Elsevier B.V. All rights reserved.

DOI

[13]
Hentschel J, Lanjouw J O, Lanjouw Pet al., 2000. Combining census and survey data to trace the spatial dimensions of poverty: A case study of Ecuador.The World Bank Economic Review, 14(1): 147-165.Poverty maps provide information on the spatial distribution of living standards. They are an important tool for policymakers, who rely on them to allocate transfers and inform policy design. Poverty maps are also an important tool for researchers, who use them to investigate the relationship between distribution within a country and growth or other economic, environmental, or social outcomes. A major impediment to the development of poverty maps has been that needed data on income or consumption typically are available only from relatively small surveys. Census data have the required sample size but generally do not have the required information. This article uses the case of Ecuador to demonstrate how sample survey data can be combined with census data to yield predicted poverty rates for the population covered by the census. These poverty rates are found to be precisely measured, even at fairly disaggregated levels. However, beyond a certain level of spatial disaggregation, standard errors rise rapidly.

DOI

[14]
Higgins K, Bird K, Harris D, 2010. Policy responses to the spatial dimensions of poverty. ODI Working Paper 328. London: Overseas Development Institute.

[15]
Liu L N, Li J J, 2015. Research on present situation and affecting factors of poverty based on village scale in Wuling ethnic areas of Hubei province.Journal of Huazhong Agricultural University (Social Sciences Edition), (2): 126-132. (in Chinese)The article described the overall poor situation of administrative villages in Wuling ethnic areas of Hubei province,and used the linear regression model to make empirical test to affecting factors of the poverty incidence and re-poverty-stricken rate.Results showed that minority population rate positive effects on incidence of poverty obviously and no effect on re-poverty-stricken rate.The labor illiteracy and half illiteracy rates had significant positive effects on both of them.Labor output rate had negative effect on poverty rate;the but positive effects on re-poverty-stricken rate.The rate of culture activity room and clinic had significant negative influences on poverty rate;the rate of cultural activity room had no effect on re-poverty-stricken rate yet the clinic rate had significant negative influences on it.Furthermore,the rate of tap water and asphalt road had great negative effects on poverty rate;but the rate of asphalt road and electricity had no effect on re-poverty-stricken rate.Accordingly,suggestions on promoting the poverty alleviation and development of Wuling ethnic areas were proposed as follows,increasing investment in education to raise comprehensive quality of resident's population;improving the labor export strategy and enhancing their capacities of anti-poverty;adjusting measures to local conditions and improving the population plan of poverty alleviation in ethnic areas;establishing database of village-level poverty to form a new poverty alleviation situation.

[16]
Liu Y H, Xu Y, 2015. Geographical identification and classification of multi-dimensional poverty in rural China.Acta Geographica Sinica, 70(6): 991-1007. (in Chinese)Developing methods for measuring multi- dimensional poverty and improving the accuracy of poverty identification have been the hot topics in international poverty research for decades. In light of the academic thoughts of the vulnerability and sustainable livelihood analysis framework, this paper establishes an index system and a method for geographical identification of multi- dimensional poverty, and carries out a county- level identification in rural China. Furthermore, this study makes a comparison between the identification result, income poverty and the latest designated poor regions by the Chinese government. At last, the identified multi-dimensional poor counties are classified by the similarity of poverty reduction measures.The results show that:(1) Taking the vulnerability and sustainable livelihood analysis framework proposed by DFID as theoretical basis, we build an index system of multi-dimensional poverty identification to reflect the farmers' livelihoods that multiple factors work on. It is feasible to develop a composite Multi- dimensional Development Index(MDI) for the integrated method of geographical identification of multi-dimensional poverty in rural China.(2) A total of 655 counties are identified as multi- dimensional poor counties. They are concentrated and jointly distributed in space, in which the Tibetan Plateau and its neighboring areas of three prefectures in southern Xinjiang, western Loess Plateau, mountainous and gully areas in western Yunnan and Sichuan, are suffering greatly from poverty. Besides, poor counties are mainly in Wumeng-Daliang mountainous areas, Yunnan-Guizhou-Guangxi rocky desertification areas, border mountainous areas in Yunnan, Wuling mountainous areas, QinlingDaba mountainous areas, Shanxi-Shaanxi gully areas and Yanshan-Taihang mountainous areas.(3) In comparison to the latest designated poor counties, this paper targets at poor counties with more disadvantages at both single and multiple dimensions. Some 71.79% of designated poor counties overlap with identified poor counties. By contrast, the majority of the designated poor counties located in mountainous areas of central or eastern China do not belong to identified poor counties because of much less disadvantage/deprivation dimensions. However, the identified poor counties, which are mainly distributed in marginal areas of plateau or mountainous areas in western China, and suffering from multiple dimensions of disadvantages and deprivations, are not included in the designated poor counties.(4) According to the disadvantage/deprivation situation of different dimensions, multidimensional poor counties are classified into eight types, i.e., lack of financial capital, lack of human capital, lack of infrastructure, lack of both financial capital and infrastructure, lack of both human capital and infrastructure, lack of means/strategies of livelihoods, lack of living condition, and lack of development condition.

DOI

[17]
Liu Y S, Zhou Y, Liu J L, 2016. Regional differentiation characteristics of rural poverty and targeted poverty alleviation strategy in China.Bulletin of Chinese Academy of Sciences, 31(3): 269-278. (in Chinese)Poverty is a challenge facing all countries and the international community as a whole. Narrowing the rural-urban gap and eliminating poverty to ultimately achieve common prosperity is an ideal that humanity constantly pursues. China has long insisted the government-led to promote poverty reduction and constantly bring forth theoretical,organization,and institutional innovation of poverty relief in practice,and explored a road of poverty alleviation and development with Chinese characteristics that captures the world's attention,contributing significantly to the global effort to eliminate poverty. However,at present China still have 70.17 million poor people in rural areas,becoming the biggest weakness for building moderately prosperous society. This study deeply analyzed and investigated the basic characteristics of Chinese rural poverty in the new era and then revealed the laws of territorial differentiation of rural poverty,and explored the leading factors and the main sticking points of rural poverty. Finally,we proposed some problem-oriented policy implications for poverty alleviation in China. Results showed that China has still large poor populations with the characteristics of wide distribution and deep poverty,and it is more and more difficult to leave the remaining poor population out of poverty by conventional measures. The phenomenon on poverty and returning to fall into poverty again for the poor who have got rid of poverty induced by disease,disability,and natural disasters are very universal. The remaining poor population gradually gathered towards the central-western deep mountain,alpine areas,minority areas,and border areas,with coexistence of impoverished households,poor villages,poverty counties and areas. The proportion of poor people in the northwestern and southeastern regions of the Hu Huanyong line was 16.4% and 83.6%,respectively. The crux of the persistent poverty in rural China was largely due to harsh natural conditions,poor regional location,infrastructure backwardness,uneven regional development,and inaccurate early anti-poverty policies and measures. These findings demonstrated that it is urgent to innovate the institutional mechanisms for anti-poverty and promote scientifically the targeted poverty alleviating strategy in China. In present,five important aspects need to be strengthened further to implement China's targeted poverty alleviation strategy:(1) Deepening the frontier theory and practical exploration of the targeted poverty alleviation;(2) Strengthening the institution establishment,management innovation and platform creation of the targeted poverty alleviation;(3) Attaching importance to summarizing the new modes emerging in the process of poverty alleviation and development for different region types;(4) Creating a multi-target system for the assessment of targeted poverty alleviation and its dynamic evaluation mechanism;(5) Integrated planning and long-term design of the strategy for shaking off poverty and sustainable development in the rural areas.

[18]
Lu C, 2012. Poverty and Development in China: Alternative Approaches to Poverty Assessment. New York: Routledge.No abstract is available for this item.

DOI

[19]
Lu Y,1998. Spatial cluster analysis for point data: Location quotients versus kernel density. Department of Geography, State University of New York at Buffalo. .

[20]
Luo Q, Fan X S, Gao Get al., 2016. Spatial distribution of poverty village and influencing factors in Qinba Mountains. Economic Geography, 36(4): 126-132. (in Chinese)With the strategic adjustment of rural poverty reduction policy, poverty village is becoming the important spatial object of the rural poverty reduction. In the 11 counties of Qinba mountains as the study area, this paper applies GIS technology to investigate the pattern and evolution characteristics of spatial distribution, and analyzes quantitatively influencing factors. The results shows that poverty villages are spatial agglomeration in the Qinba mountains,and present the pattern of "big scattered, small concentration". Compared with 2004, there is the smaller spatial agglomeration and more agglomeration center in 2014. Reservoir region is the main place to gather, and as time goes on the distribution shifts the area from the reservoir and near to the town. On the analysis of influence factors, poisson regression shows that natural geographical features, geographical location, accessibility of public service and social institutional factors have significant influences on poverty level. But over time, the role of specific factors present some new changes, and the same factor presents significant differences.

[21]
Olivia S, Gibson J, Rozelle Set al., 2011. Mapping poverty in rural China: How much does the environment matter?Environment and Development Economics, 16(2): 129-153.

[22]
Pei Y B, Liu X P, Li Y Het al., 2015. Investigation and analysis of villages in extreme spatial poverty in Liupan mountain contiguous areas: A case study of Xiji, Ningxia province.Research of Agricultural Modernization, 36(5): 748-754. (in Chinese)Based on the field survey data in Xiji, Ningxia Province of the poverty rate, the poverty gap ratio, the SPG index, and the poverty affordability index, this paper empirically analyzed the poverty situation of the sampled villages.Results show that the overall dynamic convergence degree among Engel coefficient, poverty rate and poverty gap ratio are higher in the landform areas and the ethnic villages. In addition, the poverty affordability index and the SPG index,which measures the poverty intensity, present declining trends, indicating very positive sign for poverty alleviation.Meanwhile, the poverty alleviation time of the landform areas and ethnic villages is shortening each year, implying significant achievement of poverty alleviation. However, the poverty breadth, depth and intensity of poverty villages in Loess hilly-gully region is among the highest and poverty alleviation are still a very challenging burden. Therefore to better target the villages in extreme poverty requires a well-designed multi-dimensional questionnaire, poverty relieve policies with consideration of balance, regional characteristic, regional resource endowments. It also requires a dynamic technology monitoring system and an innovative management system.

DOI

[23]
Peirovedin M R, Mahdavi M, Ziyari Y, 2016. An analysis of effective factors on spatial distribution of poverty in rural regions of Hamedan province.International Journal of Geography & Geology, 5(5): 86-96.

[24]
Ravallion M, 2011. On multidimensional indices of poverty.Journal of Economic Inequality, 9(2): 235-248.The contribution of recent "multidimensional indices of poverty" may not be as obvious as one thinks. There are two issues in assessing that contribution: whether one believes that a single index can ever be a sufficient statistic of poverty, and whether one aggregates in the space of "attainments," using prices when appropriate, or "deprivations," using weights set by the analyst. The paper argues that we should aim for a credible set of multiple indices rather than a single multidimensional index. Partial aggregation will still be necessary, but ideally the weights should be consistent with well-informed choices by poor people.

DOI

[25]
SCC, 2011. China Rural Poverty Alleviation and Development Program (2011-2020). Beijing: The State Council of China. (in Chinese)

[26]
Schnabel U, Tietje O, 2003. Explorative data analysis of heavy metal contaminated soil using multidimensional spatial regression.Environmental Geology, 44(8): 893-904.To obtain data on heavy metal contaminated soil requires laborious and time-consuming data sampling and analysis. Not only has the contamination to be measured, but also additional data characterizing the soil and the boundary conditions of the site, such as pH, land use, and soil fertility. For an integrative approach, combining the analysis of spatial distribution, and of factors influencing the contamination, and its treatment, the Mollifier interpolation was used, which is a non-parametric kernel density regression. The Mollifier was capable of including additional independent variables (beyond the spatial dimensions x and y) in the spatial interpolation and hence explored the combined influence of spatial and other variables, such as land use, on the heavy metal distribution. The Mollifier could also represent the interdependence between different heavy metal concentrations and additional site characteristics. Although the uncertainty measure supplied by the Mollifier at first seems somewhat unusual, it is a valuable feature and supplements the geostatistical uncertainty assessment.

DOI

[27]
Serra-Sogas N, O’Hara P D, Canessa Ret al., 2008. Visualization of spatial patterns and temporal trends for aerial surveillance of illegal oil discharges in western Canadian marine waters.Marine Pollution Bulletin, 56(5): 825-833.This paper examines the use of exploratory spatial analysis for identifying hotspots of shipping-based oil pollution in the Pacific Region of Canada’s Exclusive Economic Zone. It makes use of data collected from fiscal years 1997/1998 to 2005/2006 by the National Aerial Surveillance Program, the primary tool for monitoring and enforcing the provisions imposed by MARPOL 73/78. First, we present oil spill data as points in a “dot map” relative to coastlines, harbors and the aerial surveillance distribution. Then, we explore the intensity of oil spill events using the Quadrat Count method, and the Kernel Density Estimation methods with both fixed and adaptive bandwidths. We found that oil spill hotspots where more clearly defined using Kernel Density Estimation with an adaptive bandwidth, probably because of the “clustered” distribution of oil spill occurrences. Finally, we discuss the importance of standardizing oil spill data by controlling for surveillance effort to provide a better understanding of the distribution of illegal oil spills, and how these results can ultimately benefit a monitoring program.

DOI PMID

[28]
Theil H, Sorooshian C, 1979. Components of the change in regional inequality.Economics Letters, 4(2): 191-193.The change in regional inequality can be decomposed in terms of per capita income changes and population changes. Application to U.S. data for states and larger regions shows that the regional inequality decline from 1970 to 1977 is wholly due to per capita income changes.

DOI

[29]
Thongdara R, Samarakoon L, Shrestha R Pet al., 2012. Using GIS and spatial statistics to target poverty and improve poverty alleviation programs: A case study in northeast Thailand.Applied Spatial Analysis and Policy, 5(2): 157-182.AbstractVarious poverty alleviation programs have helped reduce poverty in Thailand, yet the poverty gap still remains, specifically in rural areas in the north and northeast of the country. The major barrier to poverty alleviation policies and strategies is the weakness of identifying where the poor are, thereby targeting poverty interventions. This paper investigates the potential of descriptive statistics, the geographic information system (GIS), and spatial autocorrelation in recognizing poverty association of a site selected in the northeast Thailand, including identifying factors that influence rural poverty, and investigating underlying factors and spatial associations of poverty at the rural household level. Results showed that 70% of the households sampled in the study area were poor, and nearly half of their income generated was from farming. Factors influencing farm income were examined by regression statistics and it was found that farm income is related to area cultivated, rice yield, livestock and learning experience of farmers. It was demonstrated that GIS is a useful tool to identify environmental factors that influence poverty and spatial autocorrelation is an effective method in revealing similarities and dissimilarities of poverty in household units. Use of these two technologies to identify factors underlying rural poverty was analyzed and possible use of the findings in poverty alleviation programs was presented. Drawbacks and limitations in Thailand poverty alleviation plans and programs were discussed and suggestions were made to improve these programs using GIS and spatial autocorrelation.

DOI

[30]
Wang C, Fei Z H, 2015. Study on the relative deprivation of the relocated farmer households in the process of whole-village advance: A case study of Dazhu village.Journal of Southwest University (Natural Science Edition), 37(4): 41-46. (in Chinese)An investigation was made of 300 relocated farmer households in Dazhu village-a demonstrative village in the whole-village advance drive in Hechuan of Chongqing municipality.Based on the resulting data,a relative deprivation index system was constructed and the relative deprivation of the relocated farmers in the process of whole-village advance was quantitatively studied with the relative deprivation theory.The results showed that the relative deprivation of a relocated farmer was associated with the proportion of the income of the household from its agricultural production activity in its total family income.Farmer households of the agricultural specialization development type experienced the strongest relative deprivation,followed in order by those of the agricultural diversification development type,the part-time development type,the non-agriculture diversification type and the non-agricultural specialization development type.In spatial terms,the comprehensive relative deprivation index diminished from the middle of the village to its north and south.Significant differences existed in the relative deprivation indexes between different types of farmer households,while farmer households of the same type showed similar relative deprivation or relative satisfaction,though the degree might be different.

[31]
Wang Y, Chen Y, 2017. Using VPI to measure poverty-stricken villages in China.Social Indicators Research, 133(3): 833-857.Abstract Revealing the comprehensive poverty levels and spatial diversities of poverty-stricken villages is a prerequisite for “Entire-village Advancement” anti-poverty policy of China. In response, we build a multidimensional poverty assessment model from the perspective of spatial poverty, adopting VPI (village-level poverty index) to examine multiscale and multidimensional situations and characteristics of poverty-stricken villages in rural China, then adopting spatial geostatistics to explore their multidimensional and multiscale spatial point pattern distribution. Further, we also introduce LSE model to examine their poverty types. Our tests show that, Firstly, the validity and reliability of the VPI model can be justified in terms of village-level targeting ratio and policy-coverage ratio. Then, the poverty level of poverty-stricken villages follows a normal-right distribution, presenting an “olive” structure with a shape of “large middle, and small at two ends”, poverty levels and poverty sizes of different counties obviously increasing from east to west, and different classifications of counties also representing different poverty levels. On the other hand, there exists three kinds of multi-scale poverty clusters among different contiguous destitute areas, namely, clustering-randomness-dispersion, randomness-clustering and dispersion/randomness distribution. Villages with poverty type of three-factor dominance account for over 50 % of the total villages, their poverty are mainly caused by harsh geographical environment, disadvantaged production and living conditions, and poor labor forces. This research helps know well about the relationships among different villages from the multiscale and multidimensional views, so as to provide decision basis for optimal development and reorganization of the poverty-stricken villages in rural China, which is of vital practical significance to make overall arrangement of rural development-oriented poverty elimination and to boost new round of precise poverty elimination and new countryside construction.

DOI

[32]
Wang Y, Chi Y, 2016. Measuring spatiotemporal changes of rural basic public service in poverty-stricken area of China. International Regional Science Review, 9: 1-30. doi: 10.1177/0160017616665671.

[33]
Wang Y, Qian L, 2017. A PPI-MVM model for identifying poverty-stricken villages: A case study from Qianjiang district in Chongqing, China. Social Indicators Research, 130(2): 497-522.To support China’s national poverty alleviation strategies, it is urgent to develop a scientific method for identifying the poverty-stricken villages and the contributing factors. Based on the...

DOI

[34]
Wang Y, Wang B, 2016. Multidimensional poverty measure and analysis: A case study from Hechi city, China.SpringerPlus, 5(1): 1-25.Aiming at the anti-poverty outline of China and the human–environment sustainable development, we propose a multidimensional poverty measure and analysis methodology for measuring the poverty-stricken counties and their contributing factors. We build a set of multidimensional poverty indicators with Chinese characteristics, integrating A–F double cutoffs, dimensional aggregation and decomposition approach, and GIS spatial analysis to evaluate the poor’s multidimensional poverty characteristics under different geographic and socioeconomic conditions. The case study from 11 counties of Hechi City shows that, firstly, each county existed at least four respects of poverty, and overall the poverty level showed the spatial pattern of surrounding higher versus middle lower. Secondly, three main poverty contributing factors were unsafe housing, family health and adults’ illiteracy, while the secondary factors include fuel type and children enrollment rate, etc., generally demonstrating strong autocorrelation; in terms of poverty degree, the western of the research area shows a significant aggregation effect, whereas the central and the eastern represent significant spatial heterogeneous distribution. Thirdly, under three kinds of socioeconomic classifications, the intra-classification diversities ofH,A, andMPIare greater than their inter-classification ones, while each of the three indexes has a positive correlation with both the rocky desertification degree and topographic fragmentation degree, respectively. This study could help policymakers better understand the local poverty by identifying the poor, locating them and describing their characteristics, so as to take differentiated poverty alleviation measures according to specific conditions of each county.

DOI PMID

[35]
Wang Y H, Qian L Y, Chen Y Fet al.,2017. Multidimensional and comprehensive poverty measurement of poverty-stricken counties from the perspective of ecological poverty.Chinese Journal of Applied Ecology, 28(8): 2677-2686. (in Chinese)

[36]
Wang Y H, Qian L Y, Duan F Zet al., 2015. An analysis on multidimensional poverty measurement and research on its spatial distribution pattern: A case study from Neixiang county.Population & Economics, 5: 114-120. (in Chinese)Effective targeting at the poor is now a primary problem to be solved to alleviate poverty in special poverty-stricken rural areas. Taken a key country from national contiguous special povertystricken areas Neixiang county as a study area,a "dual cutoff"method is proposed to measure and analyze the multidimensional poverty at village scale. With the help of the settlements density at the village scale and spatialization model which deal with the multidimensional poverty measurement and analyze the spatial distribution patterns of the poverty systematically at the village scale. The results indicate that: The main poverty factors are income,health and education; The spatial distributions of the poors are mainly concentrated on the south of the country town,the poverty intensity is deeper in the central-north part than that of other parts in Neixiang county.

[37]
Xie Z X, Yan J, 2008. Kernel density estimation of traffic accidents in a network space.Computers, Environment and Urban Systems, 32(5): 396-406.A standard planar Kernel Density Estimation (KDE) aims to produce a smooth density surface of spatial point events over a 2-D geographic space. However, the planar KDE may not be suited for characterizing certain point events, such as traffic accidents, which usually occur inside a 1-D linear space, the roadway network. This paper presents a novel network KDE approach to estimating the density of such spatial point events. One key feature of the new approach is that the network space is represented with basic linear units of equal network length, termed lixel (linear pixel), and related network topology. The use of lixel not only facilitates the systematic selection of a set of regularly spaced locations along a network for density estimation, but also makes the practical application of the network KDE feasible by significantly improving the computation efficiency. The approach is implemented in the ESRI ArcGIS environment and tested with the year 2005 traffic accident data and a road network in the Bowling Green, Kentucky area. The test results indicate that the new network KDE is more appropriate than standard planar KDE for density estimation of traffic accidents, since the latter covers space beyond the event context (network space) and is likely to overestimate the density values. The study also investigates the impacts on density calculation from two kernel functions, lixel lengths, and search bandwidths. It is found that the kernel function is least important in structuring the density pattern over network space, whereas the lixel length critically impacts the local variation details of the spatial density pattern. The search bandwidth imposes the highest influence by controlling the smoothness of the spatial pattern, showing local effects at a narrow bandwidth and revealing hot spots at larger or global scales with a wider bandwidth. More significantly, the idea of representing a linear network by a network system of equal-length lixels may potentially lead the way to developing a suite of other network related spatial analysis and modeling methods.

DOI

[38]
Yang S, 2012. Poverty reduction in China: The contribution of popularizing primary education. China & World Economy, 20(1): 105-122.Using the instrumental variable model and the regression discontinuity approach, this paper explores how access to primary education affects the Chinese labor market and helps people to escape poverty. Several important findings are obtained. The popularization of primary education has significantly reduced poverty in China, especially in urban areas. In contrast, the Compulsory Education Law has not been well implemented for older children in rural areas. In addition, the labor market premium for completing primary education is much larger in urban areas than in rural areas. Poor rural school quality might explain this rural rban disparity. Effort needs to be made to further reduce poverty by ensuring adequate financial resources for primary education in poor areas and improving school quality in rural China.

DOI

[39]
Zhao Y, 2015. Research on the spatial poverty trap of concentrated contiguous areas with particular difficulties on basis of the geographic capital: Taking Longde county of Ningxia for example[D].Yinchuan: Ningxia University. (in Chinese)

Outlines

/