Orginal Article

The poverty dynamics in rural China during 2000-2014: A multi-scale analysis based on the poverty gap index

  • REN Qiang , 1, 3 ,
  • HUANG Qingxu 1, 2 ,
  • HE Chunyang , 1, 2* ,
  • TU Mengzhao 1, 3 ,
  • LIANG Xiaoying , 4*
Expand
  • 1. Center for Human-Environment System Sustainability (CHESS), State Key Laboratory of Earth Surface Processes and Resource Ecology (ESPRE), Beijing Normal University, Beijing 100875, China
  • 2. School of Natural Resources, Faculty of Geographical Science, Beijing Normal University, Beijing 100875, China
  • 3. Academy of Disaster Reduction and Emergency Management, Faculty of Geographical Science, Beijing Normal University, Beijing 100875, China
  • 4. College of Urban and Environmental Science, Northwest University, Xi’an 710127, China
*Corresponding author: He Chunyang, Professor, E-mail: ; Liang Xiaoying, Associate Professor, E-mail:

Author: Ren Qiang, PhD Candidate, E-mail:

Received date: 2018-03-05

  Accepted date: 2018-04-13

  Online published: 2018-10-25

Supported by

National Basic Research Program of China, No.2014CB954302

National Natural Science Foundation of China, No.41621061, No.41671086

Copyright

Journal of Geographical Sciences, All Rights Reserved

Abstract

As the largest developing country in the world, China’s rural areas face many poverty-related issues. It is imperative to assess poverty dynamics in a timely and effective manner in China’s rural areas. Therefore, we used the poverty gap index to investigate the poverty dynamics in China’s rural areas during 2000-2014 at the national, contiguous poor areas with particular difficulties and county scales. We found that China made significant achievements in poverty alleviation during 2000-2014. At the national scale, the number of impoverished counties decreased by 1428, a reduction of 97.28%. The rural population in impoverished counties decreased by 493.94 million people or 98.76%. Poverty alleviation was closely associated with economic development, especially with industrial development. Among all 15 socioeconomic indicators, the industrial added value had the highest correlation coefficient with the poverty gap index (r = -0.458, p<0.01). Meanwhile, the inequality of income distribution in the out-of-poverty counties has been aggravated. The urban-rural income gap among the out-of-poverty counties increased by 1.67-fold, and the coefficient of variation in rural per-capita income among the out-of-poverty counties also increased by 9.09%. Thus, we argued that special attention should be paid to reducing income inequality for sustainable development in China’s rural areas.

Cite this article

REN Qiang , HUANG Qingxu , HE Chunyang , TU Mengzhao , LIANG Xiaoying . The poverty dynamics in rural China during 2000-2014: A multi-scale analysis based on the poverty gap index[J]. Journal of Geographical Sciences, 2018 , 28(10) : 1427 -1443 . DOI: 10.1007/s11442-018-1554-1

1 Introduction

Poverty is a condition characterized by the severe scarcity of basic human needs for food, clothing and shelter (UN, 2017). Obtaining the basic necessities of life is a fundamental aspect of human well-being (Kates, 2011; Wu, 2013). Reducing poverty is the first goal of the 17 Sustainable Development Goals, which were agreed upon by all 193 member states of the United Nations in 2015 (UN, 2015). As the largest developing country in the world, China faces a series of poverty-related problems, such as the large extent of poverty-stricken areas, an enormous rural impoverished population and a high degree of poverty (Liu et al., 2016). China has the world’s third largest impoverished population, following India and Nigeria (NBS, 2015). In 2012, the impoverished population in China’s rural areas reached 87.34 million, accounting for approximately 10% of the world’s impoverished population. In 2016, the Chinese State Council implemented the targeted poverty alleviation to eliminate poverty (TSC, 2016). Therefore, identifying and analyzing the poverty plays a fundamental role in the policy making of the targeted poverty alleviation (Liu et al., 2016; Ren et al., 2018).
Assessing the poverty dynamics in China across scales is of great importance for understanding the characteristics of poverty dynamics comprehensively and formulating targeted policies accordingly (Liu et al., 2017). First, the contiguous poor areas with particular difficulties (CPAPDs) are the main battlefields for poverty alleviation, while the county is the basic unit for assessing and eliminating the poverty (TSC, 2011; TSC, 2016). Analyzing the poverty dynamics among the national, CPAPD and county scales can reveal the full picture and the regional differences of poverty dynamics in China. Second, multi-scale analysis of the poverty dynamics meets the demands of the targeted poverty alleviation in China. The strategy of the targeted poverty alleviation in China requires to assess the poverty dynamics in an accurate manner and establish a hierarchical system for the targeted poverty alleviation (Liu et al., 2016). Thus, a cross-scale analysis will be helpful for the establishment of the hierarchical system.
Two types of measures are currently used to assess poverty dynamics in rural areas. One measure is the multidimensional poverty index, which usually considers the dimensions of economy, education and health. This type of measure can provide a comprehensive evaluation of the poverty dynamics in rural areas (Sen, 1999; Yang et al., 2015; Liu and Xu, 2016). However, there are difficulties in selecting appropriate indicators to represent a given dimension of poverty, also acquiring necessary and comparable data on a long-term basis, and integrating multidimensional indicators in a reasonable way (Liu and Xu, 2016). The other type of measure is the single-dimensional poverty index, such as poverty headcounts and the incidence of poverty, which are recorded in statistical yearbooks. In comparison to the multidimensional poverty index, the single-dimensional poverty index is easier in terms of obtaining the data and is used more widely (Liu and Xu, 2016). Therefore, previous studies primarily used the single-dimensional poverty index to assess the poverty dynamics in China’s rural areas on different scales (Glauben et al., 2012; You, 2014). For example, Liu et al. (2017) measured the poverty dynamics in China’s rural areas at the provincial scale from 1978 to 2014 using poverty headcounts and at the CPAPD scale from 2006 to 2014 using the incidence of poverty. They found that the poverty headcounts and the incidences of poverty decreased substantially during the studied periods. However, the assessment of poverty dynamics in China’s rural areas concentrates primarily at the national, provincial or CPAPD scales, and remains inadequate at the county scale due to the difficulties of acquiring long-term data. Nevertheless, the basic unit of poverty assessment and government support in China is the county (Li et al., 2016; Liu and Xu, 2016). Thus, long-term poverty dynamics in China’s rural areas should be evaluated comprehensively across different scales using an effective indicator.
Defined as the difference between the poverty line and per-capita income, the poverty gap index is an effective indicator for assessing poverty dynamics. First, the poverty gap index is one of the most basic indices for assessing poverty in the economic dimension and is widely used in poverty assessment (TSC, 2011; UN, 2015). For example, Ferreira et al. (2016) revealed that approximately 890 million people, or 12.7% of the world population, were living in impoverished conditions in 2012 based on the poverty gap index. Ward (2016) found that the incidence of poverty in China’s rural areas fell by nearly 60% from 1991 to 2006 based on the $2/day poverty line. Chen et al. (2015) calculated the poverty alleviation performance among the CPAPDs and found that poverty alleviation in the Liupan Mountain area was the highest in 2012. Second, the calculation of the poverty gap index only requires data on per-capita income, which is a basic statistical record that can be obtained at the county level across China. Therefore, the poverty gap index can be used to assess the poverty dynamics in China’s rural areas effectively from the county scale to the national scale.
The main objective of this study is to assess the poverty dynamics in China’s rural areas from 2000 to 2014 at the national, CPAPD and county scales using the poverty gap index. To achieve this goal, we first calculated the poverty gap index in 2000 and 2014 at the county scale based on the international poverty line. Then, the poverty dynamics in China’s rural areas were analyzed on three scales from 2000 to 2014. Finally, we explored the driving forces of poverty alleviation and monitored the changes in the equality of income distribution during the course of poverty alleviation in China’s rural areas. Our findings will be helpful for addressing the challenge of poverty alleviation in China.

2 Study area and data

2.1 Study area

The study area is China’s mainland, which includes 2217 counties (Figure 1). In 2014, the total population reached 1.45 billion, including rural population of 682 million and urban population of 768 million. The per-capita income in China’s rural areas was $1622.46. The rural impoverished population was 70.17 million, accounting for 7.20% of the total rural population (NBS, 2015).
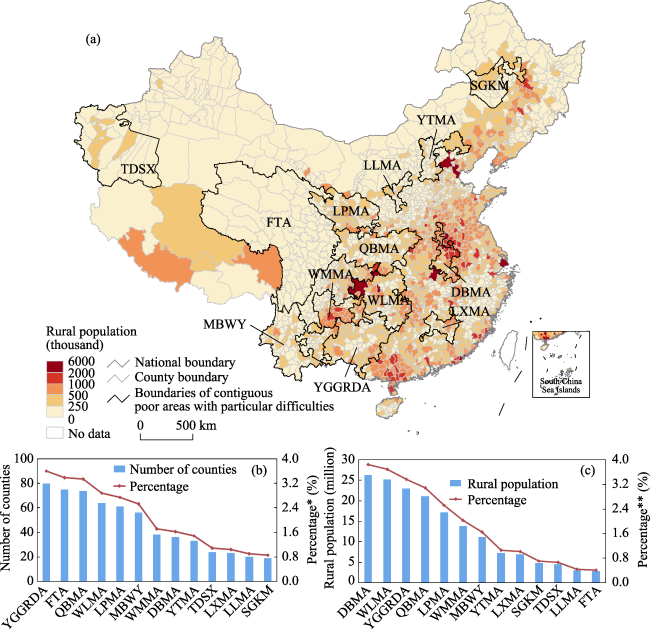
Figure 1 The study area. (a) Spatial pattern of the rural population in China in 2014; (b) The number of counties among the CPAPDs. The percentage is the proportion of the number of counties for each CPAPD to the number of counties in China; (c) Rural population among the CPAPDs. The percentage is the proportion of the rural population for each CPAPD to the rural population in China. Notes: The 13 CPAPDs in China include the three districts of south Xinjiang (TDSX), the four Tibetan-inhabited areas (FTA), the Mountainous borderland of western Yunnan (MBWY), the Liupan Mountain area (LPMA), the Qinba Mountain area (QBMA), the Wuling Mountain area (WLMA), the Wumeng Mountain area (WMMA), the Yunnan-Guizhou-Guangxi rocky desertification area (YGGRDA), the Lvliang Mountain area (LLMA), the Yanshan-Taihang Mountain area (YTMA), the Dabie Mountain area (DBMA), the Luoxiao Mountain area (LXMA), and the south Greater Khingan Mountains (SGKM).
We analyzed the poverty dynamics in China’s rural areas on three scales (i.e., the national, CPAPD and county scales). The CPAPDs are poverty-stricken areas that were identified by the Chinese State Council in 2012 (TSC, 2012). Characterized by concentrated rural impoverished people and a high incidence of poverty, the 14 CPAPDs consist of Liupan Mountain area, Qinba Mountain area, Wuling Mountain area and other 11 areas, which cover 680 counties and involve 21 provincial-level areas, with a total area of 2.84×10⁷ km2. In 2014, there were 248 million people in the CPAPDs, including 161 million people in rural areas, and the per-capita income was $1177.65 (NBS, 2015). Tibet, Hong Kong, and Macau were excluded from the analysis due to the lack of the population and socioeconomic data at the county scale. Accordingly, we focused on 13 CPAPDs without the CPAPD of Tibet.

2.2 Data

Three types of data were used in this research. First, rural population data at the county scale in 2000 and 2014 were obtained from the Statistical Database of Economic and Social Development (SDESD) within the National Knowledge Infrastructure of China (http://tongji.cnki.net/kns55/). For the counties with missing rural population data in Heilongjiang, Hebei, Henan, Yunnan and Guizhou in 2014, we estimated the missing data using the rural population projection method developed by the United Nations (UN, 1980; Zhou, 1995). Specifically, we calculated the difference between the urban and rural population growth rates based on the census data in 2000 and 2010 for these counties. Then, with the assumption that the difference between the urban and rural population growth rates remained constant, we estimated the rural population in 2014 based on the total population at the county scale. Second, socioeconomic data on the per-capita income of rural households in 2000 and 2014 were collected from the SDESD and county government work reports. Third, auxiliary data, including the administrative boundaries of all CPAPDs and counties in China at a scale of 1:4,000,000, were gathered from the National Geomatics Center of China (http://ngcc.sbsm.gov.cn).

3 Methods

3.1 Calculating the poverty gap index

Following the approach developed by Clark et al. (1981), we calculated the poverty gap index with the following formula:
\[{{G}^{t}}=Z-{{I}^{t}}\ (1) \]
where Gt is the poverty gap index in year t. Z refers to the international poverty line. We used the poverty line proposed by the World Bank in 2015, which is $1.9/day (WB, 2015). It is the per-capita income of rural households in year t. We converted the original unit of income, RMB yuan, into US dollars using the exchange rate on January 1, 2014 from the Bank of China (1 US dollar equals 6.0969 RMB yuan) (http://srh.bankofchina.com/search/whpj/search.jsp).
To eliminate the impact of price changes on identifying impoverished counties, we applied the price deflator to convert the per-capita income in 2000 to the comparable price in the base year 2014 (Ravallion et al., 2009). The comparable price \(I_{2014}^{2010}\) can be expressed as follows:
\[I_{2014}^{2000}=I_{real}^{2000}\cdot D_{2014}^{2000}\ (2) \]
where \(I_{real}^{2000}\) is the price in 2000. \(D_{2014}^{2000}\) is the price deflator in the base year 2014. The value of the price deflator can be obtained from the China Statistical Yearbook.

3.2 Analyzing poverty dynamics on multiple scales

According to the Millennium Development Goals of the UN (2015), we divided all counties into groups based on the poverty gap index. When the poverty gap index, Gt, is less than 0, the county is not impoverished. When Gt is equal to or larger than 0, the county is impoverished. Following the methods used by Chen et al. (2016), we drew a frequency histogram of the poverty gap indices for all impoverished counties and divided them into three levels (i.e., slight, moderate and extreme poverty) using the equal interval method. The process can be expressed as follows:
\[Clas{{s}^{t}}=\left\{ \begin{matrix} \begin{matrix} 1 & 0\le {{G}^{t}}<0.2Z\ \ \ \ \ \\ \end{matrix} \\ \begin{matrix} 2 & 0.2Z\le {{G}^{t}}<0.4Z \\ \end{matrix} \\ \begin{matrix} 3 & 0.4Z\le {{G}^{t}}\ \ \ \ \ \ \ \ \ \ \\ \end{matrix} \\ \end{matrix} \right.\ (3) \]
where Classt is the poverty level in year t. Z refers to the international poverty line. “1,” “2” and “3” represent slight, moderate, and extreme poverty, respectively.
Finally, using the number of identified impoverished counties and the rural populations in those counties, we analyzed the pattern of impoverished counties in China’s rural areas in 2000 and its changes from 2000 to 2014 at the national, CPAPD, and county scales.

4 Results

4.1 Poverty pattern in 2000

In 2000, nearly two-thirds of counties in China were impoverished (Table 1 and Figure 2a). There were 1468 impoverished counties, accounting for 66.25% of all counties in China. The rural population in the impoverished counties was 500.12 million people, accounting for 64.01% of the total rural population in China. The impoverished counties mainly gathered in the remote mountainous regions, border regions and ethnic minority regions of central and western China, such as the Yunnan-Guizhou-Guangxi rocky desertification area, the four Tibetan-inhabited areas, and the Qinba Mountain area (Table 1 and Figure 2a). The lack of natural endowments, poor geographic condition and fragile ecological environment were the main factors behind the poverty (Liu et al., 2016).
Table 1 The poverty pattern in rural China in 2000
Region Extremely
impoverished counties
Moderately impoverished counties Slightly
impoverished counties
Total
Number Rural population (million) Number Rural population (million) Number Rural population (million) Number Rural population (million)
China 609 159.63 369 156.58 490 183.91 1468 500.12
CPAPDs 444 118.54 108 48.26 46 17.53 598 184.34
YGGRDA 76 19.52 4 1.30 0 0 80 20.83
FTA 57 3.20 11 0.46 6 0.17 74 3.83
QBMA 55 19.04 13 5.20 6 2.97 74 27.21
WLMA 36 13.98 19 13.60 9 4.63 64 32.21
LPMA 54 15.60 5 1.42 1 0.10 60 17.12
MBWY 42 8.95 14 3.68 0 0 56 12.63
WMMA 32 14.00 5 1.66 1 0.53 38 16.19
DBMA 9 5.51 21 16.67 6 3.90 36 26.09
YTMA 19 4.43 6 1.66 7 2.03 32 8.11
TDSX 22 4.36 2 0.29 0 0 24 4.65
LXMA 14 4.52 3 1.07 5 1.75 22 7.34
LLMA 19 3.20 1 0.08 0 0 20 3.28
SGKM 9 2.23 4 1.19 5 1.44 18 4.85

Note: Please refer to Figure 1 for the abbreviations of the CPAPDs in China.

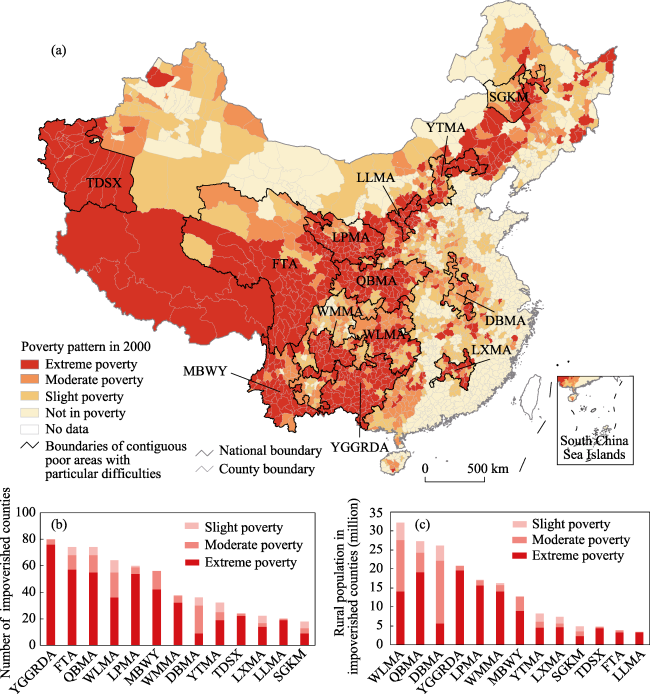
Figure 2 The poverty pattern in China in 2000. (a) The poverty pattern in China; (b) The number of impoverished counties among the CPAPDs; (c) The rural population among the CPAPDs. Notes: Please refer to Figure 1 for the abbreviations of the CPAPDs in China.
At the national scale, the number of the extremely impoverished counties was the largest, followed by the slightly and moderately impoverished counties. There were 609 extremely impoverished counties, accounting for 41.49% of all impoverished counties. The rural population in the extremely impoverished counties totaled 159.6 million, accounting for 31.92% of the total rural population in those counties. The numbers of slightly and moderately impoverished counties were 490 and 369, respectively, including 183.9 million and 156.6 million people, respectively, for the rural population.
At the CPAPD scale, the percentage of the impoverished counties to all the CPAPD counties was higher than that at the national scale. In 2012, nearly all counties in the CPAPDs were impoverished in 2000 (Table 1 and Figure 2a). There were 598 impoverished counties, accounting for 99.17% of all counties in the CPAPDs. There were 184.34 million people living in impoverished counties, accounting for approximately 99.46% of the total population in the CPAPDs. Among the 13 CPAPDs, the number of impoverished counties exceeded 70 among three CPAPDs (i.e., the Yunnan-Guizhou-Guangxi rocky desertification area, the four Tibetan-inhabited area, and the Qinba mountain area) (Figure 2b). In addition, the rural populations in the four CPAPDs, i.e., the Wuling mountain area, the Qinba mountain area, the Dabie mountain area, and the Yunnan-Guizhou-Guangxi rocky desertification area were larger than 20 million (Figure 2c).
At the CPAPD scale, the number of the extremely impoverished counties was the largest, followed by the moderately and slightly impoverished counties. The result also suggested that the degree of poverty was more severe at the CPAPD scale. The number of extremely impoverished counties was 444, accounting for 74.29% of all impoverished counties in the CPAPDs, whereas the proportion of the extremely impoverished counties to the total impoverished counties at the national scale was 41.49%. The rural population in the extremely impoverished counties was 118.54 million. That is to say, 64.31% of the total rural population in the impoverished counties at the CPAPD scale was in the extremely impoverished counties. This number was twice as large as the proportion at the national scale. The numbers of moderately and slightly impoverished counties were 108 and 46, respectively, including 48.26 million and 17.53 million people, respectively, for the rural population.

4.2 Poverty dynamics from 2000 to 2014

China made great strides in poverty alleviation from 2000 to 2014 (Table 2 and Figure 3a). During this period, the number of the impoverished counties declined substantially from 1468 to 40, a 97.28% decrease. The rural population in the impoverished counties decreased from 500.12 million in 2000 to 6.18 million in 2014, with a rate of 98.76%. The out-of- poverty counties were mainly located in southwest China, such as the Yunnan-Guizhou- Guangxi rocky desertification area, the four Tibetan-inhabited areas and the Qinba Mountain area (Table 2 and Figure 3a).
Table 2 The dynamics of poverty alleviation in rural China from 2000 to 2014
Region Extremely
impoverished counties
Moderately impoverished counties Slightly
impoverished counties
Total
Number Rural population (million) Number Rural population (million) Number Rural population (million) Number Rural population (million)
China 608 159.60 362 155.73 458 178.59 1428 493.92
CPAPDs 443 118.51 101 47.41 22 13.12 566 179.04
YGGRDA 76 19.52 4 1.30 0 0 80 20.83
FTA 57 3.20 11 0.46 -1 -0.25 67 3.41
QBMA 55 19.04 11 4.88 1 1.27 67 25.19
WLMA 36 13.98 19 13.60 9 4.63 64 32.21
LPMA 54 15.60 4 1.12 -4 -1.10 54 15.62
MBWY 42 8.95 14 3.68 -2 -0.12 54 12.51
WMMA 31 13.97 5 1.66 1 0.53 37 16.16
DBMA 9 5.51 21 16.67 6 3.90 36 26.09
YTMA 19 4.43 6 1.66 7 2.03 32 8.11
TDSX 22 4.36 2 0.29 -1 -0.17 23 4.48
LXMA 14 4.52 3 1.07 5 1.75 22 7.34
SGKM 9 2.23 4 1.19 5 1.44 18 4.85
LLMA 19 3.20 -3 -0.15 -4 -0.80 12 2.25

Note: Please refer to Figure 1 for the abbreviations of the CPAPDs in China.

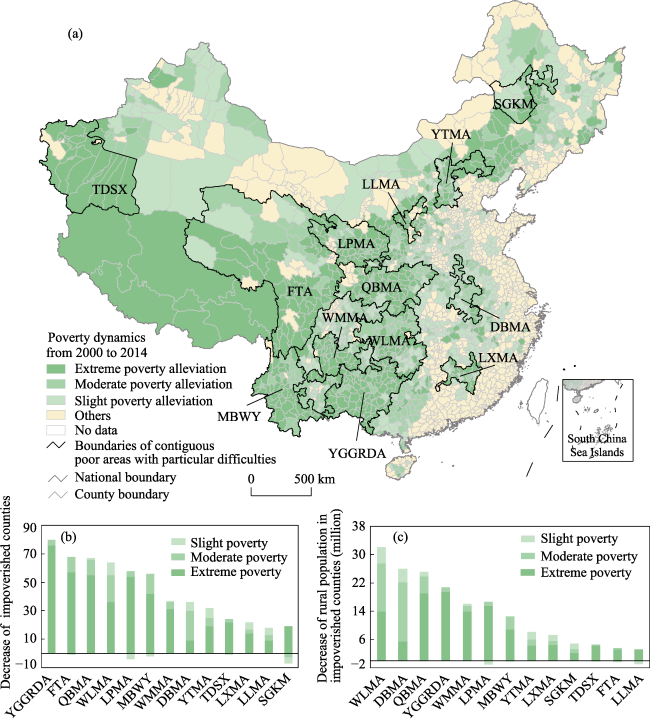
Figure 3 Poverty dynamics in China from 2000 to 2014. (a) Poverty dynamics in China; (b) The decrease in the number of impoverished counties among the CPAPDs; (c) The decrease in the rural population of impoverished counties among the 13 CPAPDs. Note: Please refer to Figure 1 for the abbreviations of the CPAPDs in China.
The numbers of extremely, moderately and slightly impoverished counties decreased at the national scale. The number of extremely impoverished counties decreased by 608, and their rural population dropped by 159.6 million. The number of moderately and slightly impoverished counties decreased by 362 and 458, respectively, with their rural populations dropping by 155.73 million and 178.59 million, respectively.
The number of impoverished counties decreased at the CPAPD scale, although the reduction rate was slightly lower than rate at the national scale. During 2000-2014, the number of impoverished counties declined from 598 in 2000 to 32 in 2014, which represents a 94.65% reduction, nearly 3% lower than the reduction rate at the national scale. During this period, the rural population in the impoverished counties decreased from 184.34 million to 5.30 million, a 97.12% reduction, which was also 1.55% lower than the reduction rate at the national scale. Among the 13 CPAPDs, the number of the out-of-poverty counties reached over 60 among four CPAPDs, i.e., the Yunnan-Guizhou-Guangxi rocky desertification area, the four Tibetan-inhabited areas, the Qinba Mountain area, and the Wuling Mountain area (Table 2 and Figure 3b). Meanwhile, the rural population in the impoverished counties decreased by over 20 million among four CPAPDs, i.e., the Wuling mountain area, the Dabie mountain area, the Qinba mountain area and the Yunnan-Guizhou-Guangxi rocky desertification area (Table 2 and Figure 3c).
The number of extremely, moderately and slightly impoverished counties also decreased at the CPAPD scale, which was similar to the trend at the national scale. The number of extremely impoverished counties decreased by 443, with the rural population dropping by 118.51 million. The numbers of moderately and slightly impoverished counties dropped by 101 and 22, with their rural populations decreasing by 47.41 million and 13.12 million, respectively. However, the number and the rural population of the moderately and slightly impoverished counties increased in some CPAPDs. For example, the number of moderately and slightly impoverished counties in the Lvliang Mountain area increased by 3 and 4. Accordingly, the rural population of the moderately and slightly impoverished counties in this CPAPD increased by 0.15 million and 0.80 million, respectively.

5 Discussion

5.1 The assessment is legitimate based on the poverty gap index

Selecting an appropriate poverty line plays an important role in understanding poverty dynamics (Ravallion et al., 2009). Currently, in addition to the $1.9/day poverty line we used in this study, there are several widely used poverty lines (Dzanku et al., 2015; Ferreira et al., 2016). For example, the World Bank proposed the $1/day and $1.25/day poverty lines in 1990 and 2008, respectively (WB, 1990; Ravallion et al., 2009). The Chinese government also proposed several national poverty lines, which were equivalent to $0.30/day, $0.55/day, and $1.03/day (NBS, 2015). However, when using different poverty lines, assessments of poverty dynamics varied greatly (Table 3). For instance, the difference in the number of impoverished counties between the $0.30/day poverty line and the $1.9/day poverty line was 1465 in 2000, and the corresponding difference in rural population was 499.44 million people. Similarly, the difference in the number of the out-of-poverty counties between the two poverty lines was 167 from 2000 to 2014, and the difference in rural population was 45.70 million people. The $1.9/day poverty line set by the World Bank considers residents’ expenditures for meeting their minimum food demands among the world’s poorest countries (Klasen et al., 2016). This poverty line was also adopted in the United Nations poverty assessment and the Sustainable Development Goals (Ferreira et al., 2016). Thus, we chose the $1.9/day poverty line to evaluate poverty dynamics in China.
Table 3 The impacts of different poverty lines on poverty evaluation
Poverty lines Value
($/day)
Differences between different poverty lines and the $1.9/day poverty line
in evaluating poverty
2000 2014 2000-2014
Number of impoverished counties Rural population (million) Number of impoverished counties Rural population (million) Number of impoverished counties Rural population
(million)
The Chinese poverty line (2000-2007) 0.30 1465 499.44 40 6.20 1425 493.15
The Chinese poverty line (2008-2010) 0.55 1443 495.65 40 6.20 1403 488.35
The Chinese poverty line in 2011 1.03 987 381.16 39 6.17 948 349.85
The $1.00/day international poverty line 1 1033 396.04 39 6.17 994 367.93
The $1.25/day international poverty line 1.25 753 301.73 36 6.02 717 250.88

Note: We used the average value of the poverty lines from 2000 to 2007 to represent the poverty line during this period because the fluctuation of the poverty lines was small. Similarly, we used the average value of the poverty lines from 2008 to 2010 to represent the poverty line during the corresponding period.

Meanwhile, following the method proposed by Liu and Xu (2016), we validated our results by comparing the differences in the poverty gap index between the impoverished counties and the non-impoverished counties designated by the Chinese government and between counties within the CPAPDs and counties outside the CPAPDs (Table 4). The results indicated that the impoverished counties identified by the poverty gap index were consistent with the impoverished counties designated by the national government. Specifically, the differences in the poverty gap index between the impoverished counties and the non-impoverished counties designated by the Chinese government were highly significant. The t-test yielded t values of -38.83 in 2000 and -43.32 in 2014 (p<0.01) between the two groups of counties. The differences in the poverty gap index between the counties within the CPAPDs and the counties outside the CPAPDs were also highly significant (p<0.01) from 2000 to 2014. The t values were -40.51 in 2000 and -38.19 in 2014.
Table 4 Validation of the poverty gap index for identifying the impoverished counties designated by the government
Year Indicators Poverty gap index
Impoverished counties Non-impoverished counties Counties within the CPAPDs Counties outside the CPAPDs
2000 Mean -2.70 -340.76 -6.27 -344.87
Standard deviation 785.13 1693.44 688.20 1709.29
t-value Significantly different, t = -38.83** Significantly different, t = -40.51**
2014 Mean -708.56 -1482.68 -744.92 -1481.56
Standard deviation 1499.10 3615.26 1843.68 3635.89
t-value Significantly different, t = -43.32** Significantly different, t = -38.19**

**p<0.01

In addition, we also found the rural population in the impoverished counties was significantly correlated with the rural impoverished population recorded in the Poverty Monitoring Report of Rural China at the CPAPD scale (Figure 4). Specifically, the correlation coefficient between the rural population in the impoverished counties and the rural impoverished population in 2010 was 0.79 (p<0.01). The correlation coefficient between the decrease in the rural population in the impoverished counties and the decrease in rural impoverished population from 2010 to 2014 was 0.71 (p<0.01). Thus, the rural population in the impoverished counties can reflect the pattern and dynamics of poverty in China effectively.
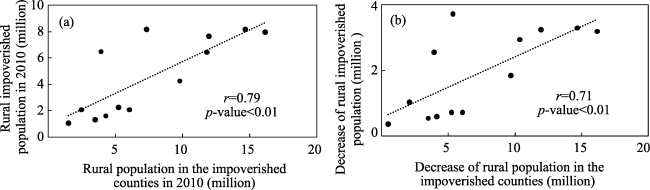
Figure 4 The relationship between the rural population in the impoverished counties and the rural impoverished population recorded in the Poverty Monitoring Report of Rural China. (a) The relationship between the rural population in the impoverished counties and the rural impoverished population in 2010; (b) The relationship between the decrease of the rural population in the impoverished counties and the decrease of rural impoverished population from 2010 to 2014. The dotted lines were the linearly fitted trend lines.

5.2 Economic development was the major factor associated with poverty alleviation in China

Previous studies have confirmed that economic development, infrastructure construction and demographic structure optimization can promote the poverty alleviation effectively. For example, Ravallion et al. (2007) revealed that economic development was the major factor of the poverty alleviation in China. Albert et al. (2010) found that infrastructure construction was helpful for income growth and poverty alleviation. Chen et al. (2016) confirmed that demographic structure optimization had the positive impacts on poverty alleviation. To verify the relationships between poverty alleviation and these factors quantitatively, following the method used by Tao et al. (2015) and Li et al. (2016), we chose 15 socioeconomic indicators from three dimensions (i.e., economy, infrastructure and population) and analyzed their relationships with the poverty gap index using Pearson’s correlation analysis. The results suggested that poverty alleviation was closely associated with economic development, especially with industrial development (Table 5). At the national scale, the correlation coefficients between the poverty gap index and the economic indicators were between -0.340 and -0.458 (p<0.01), which were higher than the correlation coefficients between the poverty gap index and most other indicators. Among all economic indicators, the correlation between the poverty gap index and industrial added value was the highest, with a correlation coefficient of -0.458 (p<0.01).
Table 5 Relationships between the poverty gap index and the selected socioeconomic indicators
Dimension Indicator Correlation coefficient at the national scale Correlation coefficient at the CPAPD scale
Economy Gross national product -0.456** -0.178**
Agricultural added value -0.317** -0.159**
Industrial added value -0.458** -0.231**
Service added value -0.367** -0.060
Total output value of large-scale industrial enterprises -0.399** -0.119**
Number of large-scale industrial enterprises -0.340** -0.164**
Government revenue -0.391** -0.097*
Infrastructure Fixed asset investment `-0.356** -0.085**
Loans of banking system at year end -0.310** -0.035
Government expenditure -0.216** -0.065
Fixed phone subscribers -0.141** -0.087*
The number of hospital beds -0.082** -0.003
The number of social welfare institution beds -0.136** -0.134**
Population Urban population -0.076** -0.040
Rural population 0.103** 0.072**

*significant at the 0.05 level, ** significant at the 0.01 level

At the CPAPD scale, the results also showed that the poverty gap index was significantly correlated with most economic indicators. Among all economic indicators, the correlations between the poverty gap index and five indicators (for example, the gross national product, the agricultural added value and the industrial added value) passed the significance test of 0.01, with correlation coefficients ranging from -0.119 to -0.231. The correlation between the poverty gap index and public finance income passed the significance level of 0.05, with a correlation coefficient of -0.097. Among all economic indicators, the correlation between the poverty gap index and industrial added value was the highest, with a correlation coefficient of -0.231 (p<0.01). However, the correlation coefficients between the poverty gap index and socioeconomic indicators at the CPAPD scale were smaller than the corresponding correlation coefficients at the national scale. This indicated that the driving factors of poverty alleviation were different among CPAPDs, and place-based poverty alleviation strategies were needed for different CPAPDs.

5.3 The inequality of income distribution was exacerbated during poverty alleviation in China

The equality of income distribution raises long-term socioeconomic and political concerns and is beneficial for regional sustainable development (Rodríguez-Pose and Hardy, 2015; Chen et al., 2016; Zhou et al., 2016). Following the study performed by You and Zhang (2017), we further evaluated the changes in the equality of income distribution during the course of poverty alleviation in China by using the urban-rural income gap and the coefficient of variation in per-capita rural income among the out-of-poverty counties from 2000 to 2014.
We found that the inequality of income distribution among the out-of-poverty counties was aggravated (Table 6). During poverty alleviation in China from 2000 to 2014, the urban-rural income gap of the out-of-poverty counties widened from $1025.60 in 2000 to $2736.47 in 2014, a 1.67-fold increase. The inequality of income distribution was more severe at the CPAPD scale. The urban-rural income gap among the out-of-poverty counties in the CPAPDs increased from $1061.03 in 2000 to $2899.83 in 2014, an approximately three-fold increase.
Table 6 Changes in the urban-rural income gap among the out-of-poverty counties from 2000 to 2014
Region Urban-rural income gap Changes in the urban-rural income gap
2000 (US dollar) 2014 (US dollar) 2000-2014 (US dollar) Rate of change (%)
China 1025.60 2736.47 1710.87 166.83%
CPAPDs 1061.03 2899.83 1838.80 173.29%
TDSX 900.29 3505.22 2604.93 289.33%
FTA 922.93 3362.53 2439.60 264.35%
WLMA 1245.88 4019.26 2773.38 222.59%
LLMA 765.63 2417.95 1652.32 215.79%
LPMA 945.89 2579.67 1633.78 172.71%
WMMA 983.29 2535.22 1551.77 157.81%
YGGRDA 1071.86 2718.59 1646.74 153.63%
DBMA 841.90 2125.34 1283.44 152.44%
QBMA 934.74 2257.38 1322.48 141.48%
MBMA 1191.75 2848.66 1656.91 139.03%
LXMA 991.49 2257.70 1266.22 127.71%
YTMA 988.37 2016.60 1028.23 104.04%
SGKM 805.00 1610.98 805.98 100.12%

Note: Please refer to Figure 1 for the abbreviations of the CPAPDs in China.

In terms of the coefficient of variation in per-capita rural income, the results also indicated that the inequality of income distribution among the out-of-poverty counties was exacerbated during the course of poverty alleviation from 2000 to 2014. The coefficient of variation in per-capita rural income increased from 0.22 in 2000 to 0.24 in 2014, with an increase of 9.09%. At the CPAPD scale, the coefficients of variation in per-capita rural income among four CPAPDs (i.e., the three districts of south Xinjiang, the Liupan Mountain area, the Yunnan-Guizhou-Guangxi rocky desertification area and the Wuling Mountain area) increased by 0.21, 0.04, 0.01 and 0.01, respectively, with growth rates of 75.00%, 16.18%, 7.14% and 4.55%, respectively.

5.4 Policy implications

In rural China, national anti-poverty policies play a critical role in poverty alleviation (Liu et al., 2016; Lo et al., 2016; Rogers, 2014) (Table 7). In 2000, the Chinese government implemented “China’s Rural Poverty Alleviation and Development Outline (2000-2010)” (TSC, 2001), which was followed by “China’s Rural Poverty Alleviation and Development Outline (2010-2014)” (TSC, 2011). With the goal of lifting the country’s rural impoverished population out of poverty by 2020, these outlines stressed that the government should reduce poverty by promoting economic development and implementing poverty assessment and government support at the county scale. In accordance with previous studies (Liu et al., 2017), our study showed that China made great strides toward poverty alleviation from 2000 to 2014 under the guidance of these outlines. From 2000 to 2014, the number of impoverished counties decreased from 1468 to 40, representing a reduction of 97.28%. The rural population in impoverished counties also decreased from 500.12 million to 6.18 million, representing a reduction of 98.76%.
Table 7 Major poverty alleviation policies in China
Policy Publication date Key scale Targets
China’s Rural Poverty Alleviation and Development Outline (2001-2010) 2001 County Lifting the rural impoverished population out of poverty at the county scale through economic development
China’s Rural Poverty Alleviation and Development Outline (2010-2020) 2011 County Lifting the rural impoverished population out of poverty at the county scale through economic development, especially in the impoverished counties designated by the Chinese government and the counties in the CPAPDs
Suggestions about Poverty Alleviation in Rural Areas by the Innovation of Mechanism 2013 Village and household Lifting the rural impoverished population out of poverty at the individual scale using targeted poverty alleviation measures
From January 2014 onward, the anti-poverty campaign in China started to focus on poverty alleviation at the individual scale and the inequality of income distribution during poverty alleviation. For example, in December 2013, the State Council released “Suggestions for Poverty Alleviation in Rural Areas by the Mechanism Innovation,” which stated that the Chinese government should implement targeted poverty alleviation measures at the village scale. Our results also supported that economic poverty at the county level had been almost eliminated in rural China, with only 40 counties remaining impoverished in 2014. However, the inequality of income distribution in the out-of-poverty counties was exacerbated. The urban-rural income gap among the out-of-poverty counties increased by 1.67-fold, and the coefficient of variation in per-capita rural income among the out-of-poverty counties also increased by 9.09%. Thus, we suggest that targeted poverty alleviation measures should be implemented at the individual scale. In addition, special attention should be paid to reducing income inequity to realize sustainable development in China’s rural areas.

5.5 Future perspectives

This study has several limitations. First, the poverty gap index can measure poverty from the economic dimension and cannot be used to measure poverty conditions from other dimensions (e.g., the environmental and social dimensions). Second, we counted the rural population in impoverished counties due to the limitations of the data. We cannot assess poverty status at the individual scale. However, our findings on poverty alleviation dynamics are useful for addressing the poverty challenge in China, considering that they are consistent with previous research (Liu et al., 2017).
In the future, multidimensional poverty indices can be used to assess poverty dynamics from the environmental, economic, and social dimensions (Alkire and Santos, 2014; Alkire and Seth, 2015). Field surveys can be undertaken in the poverty-stricken areas to analyze poverty dynamics at the individual scale. Meanwhile, we can also use remotely sensed images and large-scale data to assess long-term, large-scale poverty dynamics (Jean and Burke, 2016).

6 Conclusions

We used the poverty gap index to investigate the poverty dynamics in China’s rural areas during 2000-2014 at the national, CPAPD and county scales. We found China made great strides in poverty alleviation during this period. In 2000, the number of impoverished counties was 1468, accounting for two-thirds of the counties in China. The rural population in the impoverished counties was 500.12 million, which represented approximately 64% of the total rural population in China. From 2000 to 2014, the number of impoverished counties decreased by 97.28%, while the rural population in the impoverished counties decreased by 98.76%. At the CPAPD scale, the number of impoverished counties declined from 598 in 2000 to 32 in 2014, which represents a 94.65% reduction. During this period, the rural population in the impoverished counties decreased from 184.34 million to 5.30 million, a 97.12% reduction. However, there were still some impoverished counties in some CPAPDs in 2014, such as the Lvliang Mountain area, the Qinba Mountain area and the four Tibetan-inhabited areas, to which special attention should be paid.
The study confirmed that economic development was a major factor that affected poverty alleviation. At the national scale, the correlation coefficients between the poverty gap index and the economic indicators ranged from -0.340 to -0.458 (p<0.01), which were higher than the correlation coefficients between the poverty gap index and most other indicators. Among all economic indicators, the correlation between the poverty gap index and industrial added value was the highest, with a correlation coefficient of -0.458 (p<0.01). At the CPAPD scale, economic development was still the major factor that affected poverty alleviation. The correlation coefficients between the poverty gap index and the economic indicators ranged from -0.060 to -0.231 (p<0.01). However, the correlation coefficients at the CPAPD scale were lower than the corresponding correlation coefficients at the national scale, which indicated that different strategies were needed for the poverty alleviation in a given CPAPD.
The inequality of income distribution was intensified during poverty alleviation between 2000 and 2014 in China. The urban-rural income gap among the out-of-poverty counties increased by 1.67-fold, and the coefficient of variation in per-capita rural income among the out-of-poverty counties also increased by 9.09%. Thus, we suggest that special attention should be paid to reducing income inequity to realize sustainable development in China’s rural areas.

The authors have declared that no competing interests exist.

[1]
Alkire S, Santos M E, 2014. Measuring acute poverty in the developing world: Robustness and scope of the multidimensional poverty index. World Development, 59(1): 251-274.This paper presents the Multidimensional Poverty Index (MPI), a measure of acute poverty, understood as a person inability to meet minimum international standards in indicators related to the Millennium Development Goals and to core functionings. It constitutes the first implementation of the direct method to measure poverty for over 100 developing countries. After presenting the MPI, we analyze its scope and robustness, with a focus on the data challenges and methodological issues involved in constructing and estimating it. A range of robustness tests indicate that the MPI offers a reliable framework that can complement global income poverty estimates.

DOI

[2]
Alkire S, Seth S, 2015. Multidimensional poverty reduction in India between 1999 and 2006: Where and how? World Development, 72: 93-108.India has witnessed high economic growth since the 1980s, and a confirmed reduction in monetary poverty, particularly in poorer states. Poverty, however, has multiple dimensions. This paper thoroughly analyzes the change in multidimensional poverty in India between 1999 and 2006. We find a strong reduction in national poverty and each of its dimensions, but this has not been uniform across regions, castes, or religions. Probing further, we analyze changes in the distribution among the poor people nationally as well as within population subgroups. We find strong reductions among the poorer population nationally, but slower progress for most of the poorest groups.

DOI

[3]
Chen J, Wang Y, Wen Jet al.2016. The influences of aging population and economic growth on Chinese rural poverty. Journal of Rural Studies, 47: 665-676.61This paper integrates data to explore Chinese rural poverty.61As a useful tool, GB2 fits Chinese rural income distribution very well.61Decoupling model is employed to evaluate different factors on rural poverty.61Economic growth cannot eradicate the rural poverty effectively.61Aging population has become the key issue of Chinese rural poverty.

DOI

[4]
Chen W, Feng D, Chu X, 2015. Study of poverty alleviation effects for Chinese fourteen contiguous destitute areas based on entropy method. International Journal of Economics and Finance, 7(4): 89-98.

[5]
Dzanku F M, Jirström M, Marstorp H, 2015. Yield gap-based poverty gaps in rural Sub-Saharan Africa. World Development, 67: 336-362.Given Africa challenge of feeding a growing population, narrowing yield gaps is an efficient way of raising production under covariate constraints. Using household panel data from 21 regions in eight sub-Saharan African countries, this article unravels the determinants of yield gaps. It also tests the hypothesis that poverty gaps are increasing with yield gaps. The results suggest that yield gaps are increasing with cultivated area; that yield differences are reducing with fertilizer use, particularly when combined with improved seeds in low production potential regions; that poverty gaps are increasing with yield gaps, particularly in low production potential regions.

DOI

[6]
Ferreira F H G, Chen S, Dabalen Aet al., 2016. A global count of the extreme poor in 2012: Data issues, methodology and initial results. The Journal of Economic Inequality, 14(2): 141-172.The 2014 release of a new set of purchasing power parity (PPP) conversion factors (PPPs) for 2011 has prompted a revision of the World Bank’s international poverty line. In revising the line, we have sought to minimize changes to the real purchasing power of the earlier $1.25 line (in 2005 PPPs), so as to preserve the integrity of the goalposts for international targets such as the Sustainable Development Goals (SDGs) and the World Bank’s twin goals – which were set with respect to that line. In particular, the new line was obtained by inflating the same fifteen national poverty lines – originally used by Ravallion et al. (World Bank Econ. Rev. 23 (2): 163–184 2009 ) to construct the $1.25 line – to 2011 prices in local currency units, and then converting them to US dollars using 2011 PPP conversion factors. With a small approximation, this procedure yields a new international poverty line of $1.90 per person per day. In combination with other changes described in the paper, this revision leads to relatively small changes in global poverty incidence for 2011: from 14.5 % using the old method to 14.1 % using the new method. In 2012, the new reference year for the global count, we find 12.7 % of the world’s population, or 897 million people, are living in extreme poverty. There are changes in the regional composition of poverty, but they are also relatively small. This paper documents methodological decisions taken in the process of updating both the poverty line and the consumption and income distributions at the country level, including issues of inter-temporal and spatial price adjustments. It also describes various caveats and limitations of the approach taken.

DOI

[7]
Fu Bojie, Yu Dandan, Lv Nan, 2017. An indicator system for biodiversity and ecosystem services evaluation in China.Acta Ecologica Sinica, 32(2): 341-348. (in Chinese)Assessment of biodiversity and ecosystem services can provide important base for ecosystem management and decision making. Indicator systems are major tools for scientific assessments. However,no unified indicator systems and methods have been developed for evaluation of biodiversity and ecosystem services in China. It brings poor comparability of evaluation results among different regions and some difficulty in regional and national integration studies. Therefore,it is urgent to establish a scientific,systematic,standard indicator system for evaluation of biodiversity and ecosystem services in China at present. In this paper,we propose the principles of establishing evaluation indicator system,and establish an indicator system for biodiversity and ecosystem services evaluation in China on the basis of the main research outcome in biodiversity and ecosystem services and the cascade relations of biodiversity-ecosystem structure-process and functionecosystem services.

DOI

[8]
Glauben T, Herzfeld T, Rozelle Set al.2012. Persistent poverty in rural China: Where, why, and how to escape? World Development, 40(4): 784-795.Using rural household panel data from three Chinese provinces, this paper identifies determinants of long-term poverty and tests the duration dependence on the probability to leave poverty. Special emphasis is given to the selection of the poverty line and inter-regional differences across provinces. Results suggest that the majority of population seems to be only temporary poor. However, the probability to leave poverty for those who were poor is differently affected by poverty duration across provinces ranging from no duration dependence in Zhejiang to highly significant duration dependence in Yunnan. The number of nonworking family members, education, and several village characteristics seem to be the most important covariates.

DOI

[9]
Jean N, Burke M, Xie Met al., 2016. Combining satellite imagery and machine learning to predict poverty. Science: 353(6301): 790.Reliable data on economic livelihoods remain scarce in the developing world, hampering efforts to study these outcomes and to design policies that improve them. Here we demonstrate an accurate, inexpensive, and scalable method for estimating consumption expenditure and asset wealth from high-resolution satellite imagery. Using survey and satellite data from five African countries—Nigeria, Tanzania, Uganda, Malawi, and Rwanda—we show how a convolutional neural network can be trained to identify image features that can explain up to 75% of the variation in local-level economic outcomes. Our method, which requires only publicly available data, could transform efforts to track and target poverty in developing countries. It also demonstrates how powerful machine learning techniques can be applied in a setting with limited training data, suggesting broad potential application across many scientific domains.

DOI PMID

[10]
Kates R W, 2011. What kind of a science is sustainability science? Proceedings of the National Academy of Sciences of the United States of America, 108(49): 19449-19450.Sustainability science, as described by the PNAS website, is “…an emerging field of research dealing with the interactions between natural and social systems, and with how those interactions affect the challenge of sustainability: meeting the needs of present and future generations while substantially reducing poverty and conserving the planet's life support systems.” Over the past 7 y, PNAS has published over 300 papers in its unique section on sustainability science and has received and reviewed submissions for many hundreds more. What kind of a science is sustainability science?The article by Bettencourt and Kaur (1) on the evolution and structure of...

DOI PMID

[11]
Klasen S, Krivobokova T, Greb Fet al., 2016. International income poverty measurement: Which way now? The Journal of Economic Inequality, 14(2): 199-225.

[12]
Li J, Liu Z, He Cet al., 2016. Are the drylands in northern China sustainable? A perspective from ecological footprint dynamics from 1990 to 2010. Science of The Total Environment, 553: 223-231.61The EF of the DNC was estimated at multiple scales from 1990 to 2010.61The EF increased from 0.35to 1.26billiongha with an annual growth rate of 6.6%.61Water withdrawal increased from 133.29to 153.23km3along with the growth of EF.61The DNC was unsustainable due to the rapid increases of EF and water withdrawal.

DOI PMID

[13]
Li Y, Su B, Liu Y, 2016. Realizing targeted poverty alleviation in China: People’s voices, implementation challenges and policy implications.China Agricultural Economic Review, 8(3): 443-454.Purpose - The Chinese Government initiates the targeted poverty alleviation strategy to lift 70.17 million population out of poverty in five years time until 2020. The purpose of this paper is to investigate how the targeted poverty alleviation policy was implemented. The investigation focusses on the people's voices, implementation challenges and implications for policy making and improvement. Design/methodology/approach - A nationwide survey covering 2,075 households in 22 impoverished counties of 13 provinces was carried out in August, 2015, providing rich statistics and evidence for the paper. Literature review of China's poverty alleviation history is also made to lay a research basis for the study. Findings - There are diverse needs of the impoverished households of different ages and different poverty causes. The defects of the policy are revealed such as the impractical way of accurate poverty identification, the existence of poverty-returning problem and passive poverty alleviation. Originality/value - The study of the paper investigates the current challenges for carrying out the targeted poverty alleviation and indicates implications for policy improvement. These contribute to the effectiveness and efficiency of the targeted poverty alleviation policy in China.

DOI

[14]
Liu Y, Liu J, Zhou Y, 2017. Spatio-temporal patterns of rural poverty in China and targeted poverty alleviation strategies. Journal of Rural Studies, 52: 66-75.

[15]
Liu Y, Xu Y, 2016. A geographic identification of multidimensional poverty in rural China under the framework of sustainable livelihoods analysis. Applied Geography, 73: 62-76.61A method for identification of multidimensional poverty was established.61The method better reflects the impact of multiple factors on people’s livelihood.61The method targets at counties both in economic and multidimensional poverty.61Natural basis is still the key determination for China’s multidimensional poverty.61The method can improve the effectiveness and sustainability of poverty reduction.

DOI

[16]
Liu Yansui, Zhou Yang, Liu Jilai, 2016. Regional differentiation characteristics of rural poverty and targeted poverty alleviation strategy in China. Bulletin of Chinese Academy of Sciences, 3: 269-278. (in Chinese)Poverty is a challenge facing all countries and the international community as a whole. Narrowing the rural-urban gap and eliminating poverty to ultimately achieve common prosperity is an ideal that humanity constantly pursues. China has long insisted the government-led to promote poverty reduction and constantly bring forth theoretical,organization,and institutional innovation of poverty relief in practice,and explored a road of poverty alleviation and development with Chinese characteristics that captures the world's attention,contributing significantly to the global effort to eliminate poverty. However,at present China still have 70.17 million poor people in rural areas,becoming the biggest weakness for building moderately prosperous society. This study deeply analyzed and investigated the basic characteristics of Chinese rural poverty in the new era and then revealed the laws of territorial differentiation of rural poverty,and explored the leading factors and the main sticking points of rural poverty. Finally,we proposed some problem-oriented policy implications for poverty alleviation in China. Results showed that China has still large poor populations with the characteristics of wide distribution and deep poverty,and it is more and more difficult to leave the remaining poor population out of poverty by conventional measures. The phenomenon on poverty and returning to fall into poverty again for the poor who have got rid of poverty induced by disease,disability,and natural disasters are very universal. The remaining poor population gradually gathered towards the central-western deep mountain,alpine areas,minority areas,and border areas,with coexistence of impoverished households,poor villages,poverty counties and areas. The proportion of poor people in the northwestern and southeastern regions of the Hu Huanyong line was 16.4% and 83.6%,respectively. The crux of the persistent poverty in rural China was largely due to harsh natural conditions,poor regional location,infrastructure backwardness,uneven regional development,and inaccurate early anti-poverty policies and measures. These findings demonstrated that it is urgent to innovate the institutional mechanisms for anti-poverty and promote scientifically the targeted poverty alleviating strategy in China. In present,five important aspects need to be strengthened further to implement China's targeted poverty alleviation strategy:(1) Deepening the frontier theory and practical exploration of the targeted poverty alleviation;(2) Strengthening the institution establishment,management innovation and platform creation of the targeted poverty alleviation;(3) Attaching importance to summarizing the new modes emerging in the process of poverty alleviation and development for different region types;(4) Creating a multi-target system for the assessment of targeted poverty alleviation and its dynamic evaluation mechanism;(5) Integrated planning and long-term design of the strategy for shaking off poverty and sustainable development in the rural areas.

[17]
Lo K, Xue L, Wang M, 2016. Spatial restructuring through poverty alleviation resettlement in rural China. Journal of Rural Studies, 47: 496-505.61Poverty alleviation resettlement (PAR) is a key type of spatial restructuring in rural China.61PAR has two spatial forms: long-distance resettlement and short-distance resettlement.61The type of spatial forms is an important factor shaping the outcome of resettlement.

DOI

[18]
NBS (National Bureau of Statistics), 2015. Poverty Monitoring Report of Rural China. Beijing: China Statistics Press. (in Chinese)

[19]
Park A, Wang S, 2010. Community-based development and poverty alleviation: An evaluation of China’s poor village investment program.Journal of Public Economics, 94(9/10): 790-799.We conduct the first systematic evaluation of the world's largest community-based development program hina's flagship poverty alleviation program began in 2001 which finances public investments in designated poor villages based on participatory village planning. We use matching methods and a panel household and village data set with national coverage to compare changes from 2001 to 2004 in designated poor villages that began plan investments and in designated poor villages that had yet to begin plan investments. We find that the program significantly increased both government- and village-financed investments. While the program did not increase the income or consumption of poorer households, it did increase the income and consumption of richer households by 6.1 to 9.2%. We also find suggestive evidence that governance matters in the distribution of program benefits. Relative gains were greater for richer households in villages with more educated leaders, and higher quality village committees delivered greater benefits to both richer and poorer households.

DOI

[20]
Ravallion M, Chen S, 2007. China’s (uneven) progress against poverty.Journal of Development Economics, 82(1): 1-42.

[21]
Ravallion M, Chen S, Sangraula P, 2009. Dollar a day revisited. The World Bank Economic Review, 23(2): 163-184.

[22]
Ren Qiang, He Chunyang, Huang Qingxuet al., 2018. The poverty dynamics in the agro-pastoral transitional zone in northern China: A multiscale perspective based on the poverty gap index.Resources Science, 40(2): 404-416. (in Chinese)The Agro-Pastoral Transitional Zone in Northern China(APTZNC) is one of the most impoverished areas in China. Accurately assessing poverty dynamics in the APTZNC is of significance to regional sustainable development. We used the poverty gap index to investigate the dynamics of poverty in the APTZNC from 2000 to 2014 at three scales: regional, sub-regional and county scales. The results showed that all impoverished counties were lifted out of poverty from2000 to 2014 based on the poverty gap index. At the county scale, the number of impoverished counties decreased by 167 from 2000 to 2014, and the population in impoverished counties decreased by 45.70 million. Specifically, the number of impoverished counties decreased from 167 in 2000 to 10 in 2010, a reduction of 94.01%. The population in impoverished counties decreased from 45.70 million in 2000 to 2.73 million in 2010, a reduction of 94.03%. From 2010 to 2014, the number of impoverished counties decreased by 10 and the population in impoverished counties decreased by 2.73 million. We also found that poverty alleviation from 2000 to 2014 was closely related with economic development. Among all indicators, public fiscal revenue had the highest correlation with poverty alleviation(r =-0.51, P 0.01). Meanwhile, difference in incomes between urban and rural residents in the out-of-poverty areas increased from 4 455.27 CNY in2000 to 11 104.71 CNY in 2014, a 2.11-fold increase. The coefficient of variation in per-capita rural income among out-of-poverty counties also increased from 0.24 in 2000 to 0.34 in 2014, an increase of 41.67%. Thus, we suggest that special attention should be paid to reducing income inequity during targeted poverty alleviation to ensure sustainable development of the APTZNC.

[23]
Rodríguez-Pose A, Hardy D, 2015. Addressing poverty and inequality in the rural economy from a global perspective. Applied Geography, 61: 11-23.61Progress on rural poverty, inequalities and food security has been limited.61Traditional place-neutral approaches have largely failed to deliver.61Integrated, territorial approaches (TA) have become more mainstream as a result.61Agriculture and diversification based strategies go hand in hand.61Pressing need to elevate spatial inequalities in the post-2015 development agenda.

DOI

[24]
Rogers S, 2014. Betting on the strong: Local government resource allocation in China’s poverty counties. Journal of Rural Studies, 36: 197-206.61Qualitatively examines the pattern of resource allocation in one of China's poverty counties.61The political economy of China's poverty counties aggravates inequality and does little to address entrenched poverty.61China's poverty alleviation strategy and its fiscal policy are working against each other.61China's requires a needs-based poverty alleviation strategy at household or individual scales, attuned to inequality.

DOI

[25]
Sen A, 1999. Development as Freedom. Oxford: Oxford University Press.

[26]
Stephen C, Richard H, David U, 1981. On indices for the measurement of poverty. The Economic Journal, 91(362): 515-526.This paper generalizes the poverty index introduced by Sen and demonstrates that (i) for every homothetic social evaluation function there is one relative poverty index, (ii) Sen's index is a relative poverty index and corresponds to a Gini social evaluation function, (iii) for every translatable social evaluation function there is one absolute poverty index, and (iv) ethical content in these poverty indices requires that the social evaluation function be structured so that any group of poor people is strictly separable from anyone richer.

DOI

[27]
Tao S, Fang J, Zhao Xet al., 2015. Rapid loss of lakes on the Mongolian Plateau.Proceedings of the National Academy of Sciences of the United States of America, 112(7): 2281-2286.Abstract Lakes are widely distributed on the Mongolian Plateau and, as critical water sources, have sustained Mongolian pastures for hundreds of years. However, the plateau has experienced significant lake shrinkage and grassland degradation during the past several decades. To quantify the changes in all of the lakes on the plateau and the associated driving factors, we performed a satellite-based survey using multitemporal Landsat images from the 1970s to 2000s, combined with ground-based censuses. Our results document a rapid loss of lakes on the plateau in the past decades: the number of lakes with a water surface area >1 km(2) decreased from 785 in the late 1980s to 577 in 2010, with a greater rate of decrease (34.0%) in Inner Mongolia of China than in Mongolia (17.6%). This decrease has been particularly pronounced since the late 1990s in Inner Mongolia and the number of lakes >10 km(2) has declined by 30.0%. The statistical analyses suggested that in Mongolia precipitation was the dominant driver for the lake changes, and in Inner Mongolia coal mining was most important in its grassland area and irrigation was the leading factor in its cultivated area. The deterioration of lakes is expected to continue in the following decades not only because of changing climate but also increasing exploitation of underground mineral and groundwater resources on the plateau. To protect grasslands and the indigenous nomads, effective action is urgently required to save these valuable lakes from further deterioration.

DOI PMID

[28]
TSC (The State Council), 2001. China’s Rural Poverty Alleviation and Development Outline (2001-2010). . China’s Rural Poverty Alleviation and Development Outline (2001-2010). (in Chinese)

[29]
TSC (The State Council), 2011. China’s Rural Poverty Alleviation and Development Outline (2011-2020). . China’s Rural Poverty Alleviation and Development Outline (2011-2020). (in Chinese)

[30]
TSC (The State Council), 2012. The List of Counties in the Contiguous Poor Areas with Particular Difficulties. (in Chinese)

[31]
TSC (The State Council), 2016. The Conference on Poverty Alleviation and Development Was Held in Beijing. (in Chinese)

[32]
UN (United Nations), 1980. Patterns of Urban and Rural Population Growth. New York: Oxford University Press.

[33]
UN (United Nations), 2015, Transforming Our World: The 2030 Agenda for Sustainable Development, United Nations, New York

[34]
UN (United Nations), 2017. Poverty. .

[35]
Ward P S, 2016. Transient poverty, poverty dynamics, and vulnerability to poverty: An empirical analysis using a balanced panel from rural China. World Development, 78: 541-553.In this paper, we suggest that an alternative view would be to consider the effects of these reforms on changing the chronic nature of poverty and reducing household vulnerability to poverty. Using a balanced panel from rural China from 1991 through 2006, we find that most poverty among our sample has shifted from being chronic in nature to being transient, with households either shifting into a state of being non-poor moving in and out of poverty. Among our sample, vulnerability to poverty has been declining over time, but the declines are not uniform over time or space. We decompose household vulnerability status into two proximate causes: low expected income and high income variability, finding vulnerability increasingly due to income variability. Additionally, we demonstrate that vulnerable households have very different characteristics than non-vulnerable households.

DOI PMID

[36]
WB, 1990. World Development Report 1990: Poverty. New York: Oxford University Press.

[37]
WB, 2015. Ending Poverty and Sharing Prosperity: Progress and Policies. The World Bank.With 2015 marking the transition from the Millennium to the Sustainable Development Goals, the international community can celebrate many development successes since 2000. Three key challenges stand out: the depth of remaining poverty, the unevenness in shared prosperity, and the persistent disparities in non-income dimensions of development. First, the policy discourse needs to focus more directly on the poorest among the poor. While pockets of ultra-poverty exist around the world, Sub-Saharan Africa is home to most of the deeply poor. To make depth a more central element in policy formulation, easy-to-communicate measures are needed, and this note attempts a step in this direction with person-equivalent measures of poverty. Second, the eradication of poverty in all of its forms requires steady growth of the incomes of the bottom 40 percent. Yet, economic growth, a key driver of shared prosperity, may not be as buoyant as before the global financial crisis. Third, unequal progress in non-income dimensions of development requires addressing widespread inequality of opportunity, which transmits poverty across generations and erodes the pace and sustainability of progress for the bottom 40. To meet these challenges, three ingredients are core to the policy agenda: sustaining broad-based growth, investing in human development, and insuring the poor and vulnerable against emerging risks.

[38]
Wu J, 2013. Landscape sustainability science: Ecosystem services and human well-being in changing landscapes. Landscape Ecology, 28(6): 999-1023.AbstractThe future of humanity depends on whether or not we have a vision to guide our transition toward sustainability, on scales ranging from local landscapes to the planet as a whole. Sustainability science is at the core of this vision, and landscapes and regions represent a pivotal scale domain. The main objectives of this paper are: (1) to elucidate key definitions and concepts of sustainability, including the Brundtland definition, the triple bottom line, weak and strong sustainability, resilience, human well-being, and ecosystem services; (2) to examine key definitions and concepts of landscape sustainability, including those derived from general concepts and those developed for specific landscapes; and (3) to propose a framework for developing a science of landscape sustainability. Landscape sustainability is defined as the capacity of a landscape to consistently provide long-term, landscape-specific ecosystem services essential for maintaining and improving human well-being. Fundamentally, well-being is a journey, not a destination. Landscape sustainability science is a place-based, use-inspired science of understanding and improving the dynamic relationship between ecosystem services and human well-being in changing landscapes under uncertainties arising from internal feedbacks and external disturbances. While landscape sustainability science emphasizes place-based research on landscape and regional scales, significant between landscape interactions and hierarchical linkages to both finer and broader scales (or externalities) must not be ignored. To advance landscape sustainability science, spatially explicit methods are essential, especially experimental approaches that take advantage of designed landscapes and multi-scaled simulation models that couple the dynamics of landscape services (ecosystem services provided by multiple landscape elements in combination as emergent properties) and human well-being.

DOI

[39]
Yang Zhen, Jiang Qi, Liu Minhuiet al., 2015. Multi-dimensional poverty measure and spatial pattern of China’s rural residents. Economic Geography, 35(12): 148-153. (in Chinese)Poverty is one of the important problems, which the government and academic circles focus on for a long term.From the perspective of life consumption, based on the theory of Engel and extended linear expenditure system model,this study establishes multi- dimensional poverty measure model to make the empirical analysis to the spatial pattern of poverty and its causes of rural residents in every province of China. The findings show that: 1) The rural residents in China have a big difference in the basic needs of eight consumption dimensions. "Necessity demand" is higher; "developmental demand" is low; actual expenditure of all dimensions have the positive relation with income growth. 2)The actual expenditure in each dimension is generally higher than the expenditure of basic demand in corresponding dimensions. Relative poverty index has obvious differences in different dimensions and regions. The poverty level of eastern provinces is generally low; the central is second; and the poverty level of western areas is generally high. 3) With the lower education level of rural residents and the higher agricultural status, the poverty index of corresponding regions is higher. Poverty index will be lowered by the increase of the farmers' income, non-agriculture income structure, and the increase of per capita cultivated land. To a certain extent, natural disasters increase the farmers' opportunities to go out to earn the non-agricultural income, which can decrease the regional poverty index.

[40]
You H, Zhang X, 2017. Sustainable livelihoods and rural sustainability in China: Ecologically secure, economically efficient or socially equitable? Resources, Conservation and Recycling, 120: 1-13.Sustainable production and consumption in the rural regions remains a barely tried yet important issue for contributing to rural sustainability these days. In particular, the sustainable livelihood of rural farmers has not been fully investigated for those in rural areas with high agricultural pollution emissions and a poor ecological quality of agricultural production in China. Also affected are farmers with a low living standard and output, or suffer from social inequity. The sustainable livelihood security (SLS) index therefore provides a useful means of identifying the existence of the conditions necessary for sustainable livelihood or sustainable development. Using the fuzzy comprehensive method, this paper aims to assess the level of sustainable livelihood security of China provincial farmers and its three components of ecological security, economic efficiency and social equity. A SLS index is established and the entropy weight method used to determine the weight of the indices and analyze spatial distribution. The results indicate that the sustainable livelihood security index and its components vary between provincial regions, with the western provinces being most adversely affected, sustainable livelihood, economic efficiency and social equity being the least secure (or relatively insecure) in the western provinces while economic efficiency is most secure (or relatively secure) in the eastern and middle provinces, and social equity most secure in the eastern provinces. Concluding remarks suggest policies designed to improve the sustainable livelihood security of farmers according to local regional circumstances.

DOI

[41]
You J, 2014. Poverty dynamics in rural China revisited: Do assets matter? Journal of Economic Policy Reform, 17(4): 322-340.This paper uses an asset-based approach to examine poverty dynamics in rural China over the period 1989–2006. The analysis documents a significant structural component in the poverty dynamics of households. The lack of profitable agricultural asset accumulation plays an unneglectable role in causing households to be trapped in persistent poverty. The escape from poverty is increasingly dominated by stochastic upward mobility rather than by structural movement in terms of asset accumulation. This could threaten the prospect of poverty reduction in rural China. It is argued that future reform and policy-making should pay more attention to building households’ asset base.

DOI

[42]
Zhou S, Liu Y, Kwan M P, 2016. Spatial mismatch in post-reform urban China: A case study of a relocated state-owned enterprise in Guangzhou. Habitat International, 58: 1-11.Accompanying rapid urbanization and economic transformation, the reconstruction of inner city in urban China has been taking place during recent decades. However, the social and geographic inequality resulted from such reconstruction and experienced by minority groups has received less attention to date. To address this, a case study using individual-level data based on a survey of a relocated state-owned enterprise (SOE) in Guangzhou was conducted. The study shows that similar to other cities in the world, the spatial mismatch that results in long and time-consuming commuting as well as lower quality of life exists. It has considerable adverse impact on the low- and middle-income employees of the relocated enterprise. However, it was not social or racial segregation but institutional transformation that brought about the spatial mismatch in China. Based on the dual economic system in China, both the planned and market systems played important roles in the enterprise's relocation and their employees' daily lives. Institutional barriers associated with the welfare system had a great impact on the geographic immobility of its employees. These include the retirement and medical insurance systems inherited from the planned economy and the supply of work unit buses, which rendered employees more attached to and dependent on their enterprise. However, these provisions were big burdens to the enterprise which reduced their profit and led to lower spatial mobility of its lower-income employees.

DOI

[43]
Zhou Yixing, 1995. Urban Geography. Beijing: The Commercial Press. (in Chinese)

Outlines

/