
Journal of Geographical Sciences >
Comparison of ecosystem services provided by grasslands with different utilization patterns in China’s Inner Mongolia Autonomous Region
Author: Du Bingzhen (1981-), PhD Candidate, specialized in ecosystem services, ecological restoration, and eco- compensation. E-mail: dubingzhen@hotmail.com
Received date: 2017-05-23
Accepted date: 2017-10-23
Online published: 2018-10-25
Supported by
National Natural Science Foundation of China, No.41671517
National Key Research and Development Program of China, No.2016YFC0503700
Copyright
Although several previous studies in Inner Mongolia examined the effects of ecological conservation on the delivery of ecosystem services, they were often limited in scope (few ecosystem services were assessed) and often suffered from confounding by spatial variation. In this study, we examined the impact of conservation measures (changes in grassland utilization patterns) on the provision of selected ecosystem services in three types of grasslands (meadow steppe in Hulun Buir, typical steppe in Xilin Gol, and semi-desert steppe in Ordos) in Inner Mongolia. We examined five utilization patterns: no use (natural grasslands), light use, moderate use, intensive use, and recovery sites (degraded sites protected from further use). Through household surveys and vegetation and soil surveys, we measured the differences in ecosystem services among the different grassland utilization patterns. We also identified spatial factors that confounded the quantification of ecosystem services in different types of grasslands. We found that light use generally provided high levels of ecosystem services in meadow steppe and typical steppe, with the main differences in the supporting ecosystem services. Surprisingly, we found no consistently positive impacts of strict conservation activities across the sites, since the results varied spatially and with respect to differences in the land-use patterns. Our study suggests that appropriate grassland utilization patterns can enhance the supply of ecosystem services and reduce negative effects on both household livelihoods and the environment.
DU Bingzhen , ZHEN Lin , HU Yunfeng , YAN Huimin , DE GROOT Rudolf , LEEMANS Rik . Comparison of ecosystem services provided by grasslands with different utilization patterns in China’s Inner Mongolia Autonomous Region[J]. Journal of Geographical Sciences, 2018 , 28(10) : 1399 -1414 . DOI: 10.1007/s11442-018-1552-3
Table 1 Characteristics of the five grassland utilization patterns in Inner Mongolia |
| Utilization pattern | Features | Degree of use | Source |
|---|---|---|---|
| No use | - Natural grassland - No degradation - No grazing (no sign of trampling or livestock dung) | None | Literature reviews Expert interviews Remote sensing data (comparison of images from 1995, 2000, 2005, and 2010) Field observations (density of dung, traces of grazing) Household surveys (no. of livestock in their pasture, grazing locations, activities) |
| Light use | - Occasional use (<4 months from April to November) - Seasonal grazing or rotational grazing - Livestock number controlled | + | |
| Moderate use | - Continuous use from April to November - Seasonal grazing - Livestock number controlled | ++ | |
| Intensive use | - Continuous use from April to November - Mowing for winter fodder - No grazing control measures | +++ | |
| Recovery | - Fencing used to exclude livestock and protect the grassland - Grazing prohibition - Used to be a seriously degraded area - Recovering from degradation | None |
Table 2 Proposed indicators for assessing ecosystem services under the different grassland utilization patterns |
| Ecosystem function | Ecosystem service | Selected indicators | Data sources | Grassland management implications |
|---|---|---|---|---|
| Provisioning | Meat | No. of livestock | Livelihood survey | Food provision, livelihood sustainability |
| Raw materials | Fodder | |||
| Fuel | Dry dung | |||
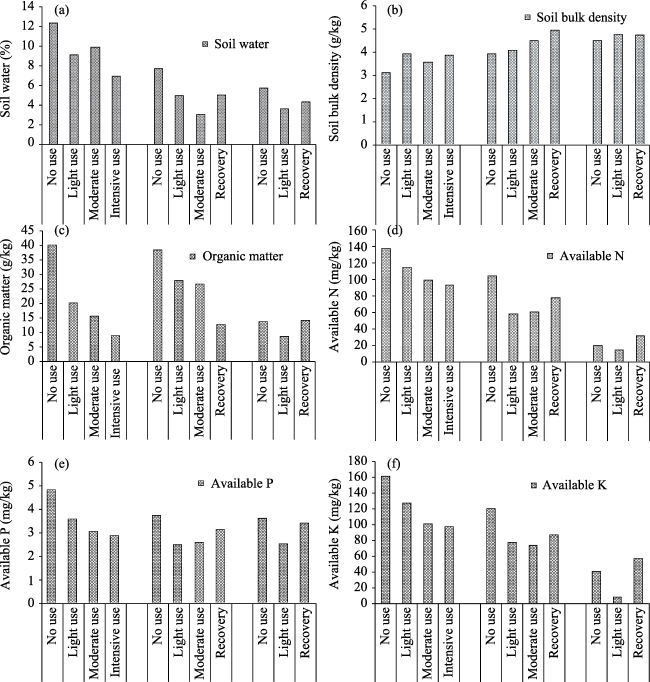
| Regulating | Soil retention | Soil bulk density Soil water content | Field sampling plots | Erosion defense, security, agricultural production |
| Soil nutrients | Soil organic matter (SOM) Available nitrogen (AN) Available phosphorus (AP) Available potassium (AK) | Fertile soils, decomposition of organic matter | ||
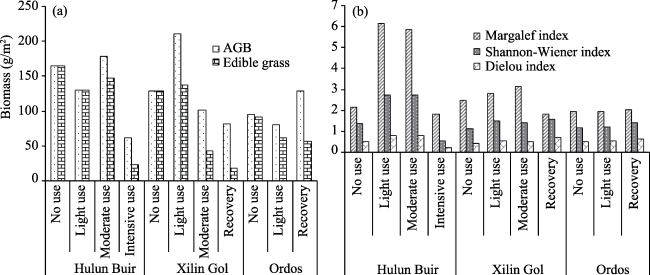
| Supporting | Primary production | Aboveground biomass (AGB) Proportion of edible biomass | Field sampling plots | Silage, hay for livestock, food for wild species |
| Habitat (biodiversity) | Margalef (species richness) index Shannon-Wiener (species diversity) index Pielou (species evenness) index | Safeguarding of natural heritage Functional diversity |
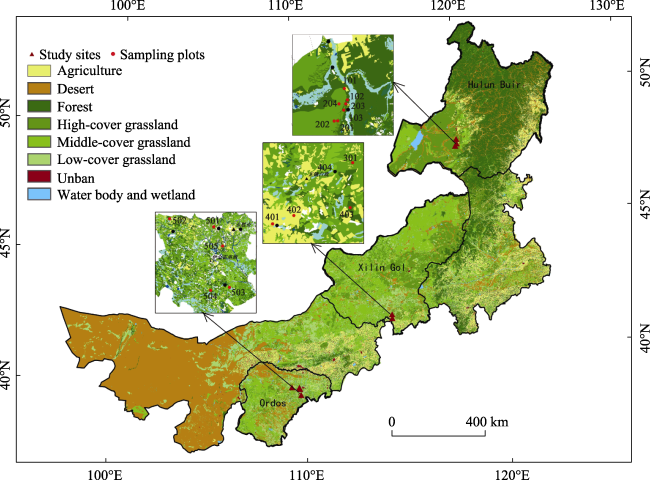
Figure 1 Location of the study area and map of the study sites. Grassland types: high-cover, vegetation cover >50%; medium-cover, vegetation cover between 25% and 50%; low-cover, vegetation cover <25%. Numbers in the inset maps refer to the study plot numbers |
Table 3 Basic characteristic of the study plots |
| Location | Plota number | Longitude (°N) | Latitude (°E) | Tb (℃) | Pc (mm) | No. of species | Type of grassland | Soil type | Utilization intensity |
|---|---|---|---|---|---|---|---|---|---|
| Hulun Buir | 101 | 119.8 | 48.89 | ‒1 | 329.5 | 22 | Meadow steppe | Medium/light loam | None |
| 102 | 119.81 | 48.82 | ‒0.9 | 334.0 | 17 | Meadow steppe | Medium/light loam | Intensive | |
| 103 | 119.77 | 48.77 | ‒0.8 | 336.5 | 44 | Meadow steppe | Medium/light loam | Moderate | |
| 201 | 119.71 | 48.72 | ‒0.7 | 338.3 | 32 | Meadow steppe | Medium/heavy loam | None | |
| 202 | 119.68 | 48.72 | ‒0.7 | 337.5 | 33 | Meadow steppe | Heavy/medium loam | None | |
| 203 | 119.79 | 48.8 | ‒0.8 | 334.9 | 16 | Meadow steppe | Light/sandy loam | Intensive | |
| 204 | 119.74 | 48.81 | ‒0.9 | 333.3 | 42 | Meadow steppe | Medium/light loam | Light | |
| Xilin Gol | 301 | 115.14 | 42.33 | 3.3 | 217.0 | 23 | Typical steppe | Sandy loam | Light |
| 401 | 114.88 | 42.21 | 3.4 | 210.2 | 10 | Typical steppe | Light/sandy loam | Recovery (5 years) | |
| 402 | 114.95 | 42.22 | 3.4 | 210.9 | 15 | Typical steppe | Light/sandy loam | Moderate | |
| 403 | 115.12 | 42.23 | 3.3 | 217.6 | 24 | Typical steppe | Light loam | None | |
| Ordos | 501 | 109.79 | 39.84 | 7.1 | 248.1 | 20 | Semi-desert steppe | Light loam | None |
| 502 | 109.32 | 39.92 | 7.2 | 219.8 | 19 | Semi-desert steppe | Sandy loam | Recovery (10 years) | |
| 503 | 109.92 | 39.36 | 7.1 | 230.1 | 20 | Semi-desert steppe | Dense sand, sandy loam | Recovery (8 years) | |
| 504 | 109.72 | 39.34 | 7.1 | 225.6 | 26 | Semi-desert steppe | Sandy loam, dense sand | Light | |
| 505 | 109.87 | 39.69 | 7.1 | 247.5 | 17 | Semi-desert steppe | Light loam, sandy loam | Recovery (7 years) |
a Locations of the plots are shown in Figure 1. b T is the annual average temperature (℃), were obtained from meteorological stations in Inner Mongolia in 2011. c P is the annual average precipitation (mm), were obtained from meteorological stations in Inner Mongolia in 2011. |
Table 4 Household consumption of provisioning services |
| Consumptions | Study site a | ||||
|---|---|---|---|---|---|
| Hulun Buir (n=66) | Xilin Gol (n=71) | Ordos (n=72) | Overall (n=209) | ||
| Livestock (no. per household, % of total) | |||||
| Sheep | 52.0 (68.2) | 2.4 (27.0) | 2.4 (8.9) | 18.0 (49.5) | |
| Goats | 3.2 (4.2) | 0.2 (2.2) | 6.0 (22.3) | 3.2 (8.8) | |
| Cattle | 18.0 (23.6) | 4.2 (47.2) | 0.8 (3.0) | 7.3 (20.1) | |
| Chickens | 3.0 (3.9) | 2.0 (22.5) | 16.9 (62.8) | 7.5 (20.6) | |
| Pigs | 0.1 (0.1) | 0.1 (1.1) | 0.8 (3.0) | 0.4 (1.1) | |
| Total livestock | 76.3 (100) | 8.8 (100) | 26.9 (100) | 37.3 (100) | |
| Meat (kg per capita per year, % of total) | |||||
| Mutton-beef | 97.2 (76.3) | 65.6 (82.5) | 35.7 (39.5) | 65.3 (66.4) | |
| Other meatb | 30.1 (23.6) | 13.9 (17.5) | 54.7 (60.5) | 33.1 (33.6) | |
| Total meat | 127.3 (100) | 79.5 (100) | 90.4 (100) | 98.4 (100) | |
| Fuel (per capita per year) | |||||
| Dry dung (kg) | 2878.6 | 265.2 | 199.4 | 1407.5 | |
| Coal (kg) | 2063.6 | 690.6 | 922.4 | 1203.9 | |
| Electricity (CNY) | 84.4 | 135.9 | 215.0 | 146.9 | |
a n represents the number of households surveyed. b Other meat includes pork, chicken, and fish. |
Table 5 Scores for ranking ecosystem in the three parts of the study area as a funnction of grassland utilization patterns(intensities)a |
 |
Table 6 Differences in mean soil properties among the three parts of the study area (AK, available potassium; AN, available nitrogen; AP, available phosphorus; SOM, soil organic matter) |
| Site | Soil bulk density (g/kg) | SOM (g/kg) | Soil water content (%) | |||
|---|---|---|---|---|---|---|
| Average | S.E. | Average | S.E. | Average | S.E. | |
| Hulun Buir (meadow steppe) | 3.40 | 0.35 | 24.98 | 17.23 | 10.04 | 4.47 |
| Xilin Gol (typical steppe) | 4.50 | 0.59 | 23.4 | 12.68 | 5.22 | 4.65 |
| Ordos (semi-desert steppe) | 4.60 | 0.26 | 13 | 3.24 | 4.52 | 2.12 |
| Site | AN (mg/kg) | AP (mg/kg) | AK (mg/kg) | |||
| Average | S.E. | Average | S.E. | Average | S.E. | |
| Hulun Buir | 114.18 | 31.63 | 4.1 | 1.17 | 130.29 | 9.14 |
| Xilin Gol | 64.94 | 33.94 | 3.11 | 0.54 | 93.50 | 20.11 |
| Ordos | 24.10 | 15.31 | 3.24 | 0.46 | 44.4 | 30.88 |
| Site | Margalef index (species richness) | Shannon-Wiener index (species diversity) | Pielou index (species evenness) | |||
| Average | S.E. | Average | S.E. | Average | S.E. | |
| Hulun Buir | 3.83 | 1.87 | 1.87 | 0.82 | 0.61 | 0.21 |
| Xilin Gol | 2.20 | 0.55 | 1.29 | 0.30 | 0.51 | 0.14 |
| Ordos | 2.00 | 0.89 | 1.92 | 1.31 | 0.58 | 0.27 |
S.E: standard error |
Appendix 1 List of potential ecosystem services for assessment based on the results of our literature review |
| Service/functions | Services | de Groot et al. (2002) | MEA (2005) |
|---|---|---|---|
| Production function/service | Food | X | X |
| Raw material | X | ||
| Genetic resources | X | ||
| Fresh water | X | ||
| Fuel | X | ||
| Habitat/supporting service | Refugium functions | X | |
| Nursery | X | ||
| Primary production | X | ||
| Maintenance of genetic diversity | X | ||
| Regulating function/service | Gas regulation | X | X |
| Climate regulation | X | X | |
| Pollination | X | ||
| Water regulation | X | ||
| Water supply | X | ||
| Soil retention | X | ||
| Nutrient regulation | X | ||
| Disturbance prevention | X | ||
| Biological control | X | X | |
| Water purification | X | ||
| Information/cultural service | Aesthetic information | X | X |
| Recreation | X | X | |
| Spiritual and historic information | X | X | |
| Cultural and artistic information | X | ||
| Science and education | X | X |
Appendix 2 Soil properties as a function of study region and land utilization intensity. Abbreviations: AK, available potassium; AN, available nitrogen; AP, available phosphorus; SOM, soil organic matter |
Appendix 3 Vegetation traits as a function of the study region and utilization intensity. (A) Primary production supporting services (AGB, total aboveground biomass). (B) Habitat supporting services (biodiversity) |
The authors have declared that no competing interests exist.
| [1] |
|
| [2] |
|
| [3] |
|
| [4] |
|
| [5] |
|
| [6] |
|
| [7] |
|
| [8] |
|
| [9] |
|
| [10] |
|
| [11] |
|
| [12] |
|
| [13] |
|
| [14] |
|
| [15] |
|
| [16] |
|
| [17] |
|
| [18] |
|
| [19] |
|
| [20] |
|
| [21] |
|
| [22] |
|
| [23] |
|
| [24] |
|
| [25] |
|
| [26] |
MEA (
|
| [27] |
MEA (
|
| [28] |
|
| [29] |
NDRC, 2014. “Opinions on improving the policy of returning grazing to grassland” is the latest guidance to implementing the policy of “returning grazing to grassland”, which Joint release by the National Development and Reform Commission, National Ministry of Finance and National Ministry of Agriculture (in Chinese).
|
| [30] |
|
| [31] |
|
| [32] |
|
| [33] |
|
| [34] |
|
| [35] |
|
| [36] |
|
| [37] |
|
| [38] |
|
| [39] |
|
| [40] |
|
| [41] |
|
| [42] |
|
| [43] |
|
| [44] |
|
| [45] |
|
| [46] |
|
/
| 〈 |
|
〉 |