
Journal of Geographical Sciences >
Spatio-temporal variations of the flood mitigation service of ecosystem under different climate scenarios in the Upper Reaches of Hanjiang River Basin, China
Author: Wang Pengtao (1988-), PhD, specialized in climate change and ecosystem services. E-mail: wnpengtao@126.com
Received date: 2017-05-15
Accepted date: 2017-12-08
Online published: 2018-10-25
Supported by
Natural Science Basic Research Plan in Shaanxi Province of China, No.2017JQ4009
National Natural Science Foundation of China, No.41601182, No.41471097
National Social Science Foundation of China, No.14AZD094
Key Project of Chinese Ministry of Education, No.15JJD790022
The National Key Research and Development Plan of China, No.2016YFC0501601
The Science and Technology Service Network Initiative Project of Chinese Academy of Sciences, No.KFJ-STS-ZDTP-036
Fundamental Research Funds for the Central University, No.GK201703053
Copyright
Extreme rainstorm and the subsequent flood increasingly threaten the security of human society and ecological environment with aggravation of global climate change and anthropogenic activity in recent years. Therefore, the research on flood mitigation service (FMS) of ecosystem should be paid more attention to mitigate the risk. In this paper, we assessed FMS in the Upper Reaches of Hanjiang River (URHR), China from 2000 to 2014 using the Soil Conservation Service Curve Number (SCS-CN) model, and further simulated the future FMS under two climate scenarios (in 2020 and 2030). The results reveal that the FMS presented a fluctuating rising trend in the URHR from 2000 to 2014. The FMS in southern URHR was higher than that of northern URHR, and the change rate of FMS in the upstream of URHR (western URHR) was higher than the downstream of URHR (eastern URHR). The future FMS under scenarios of Medium-High Emissions (A2) and Medium-Low Emissions (B2) will decrease consistently. As land use/land cover changes in the URHR are negligible, we concluded that the change in FMS was mainly driven by climate change, such as storm and runoff. Our study highlights that climate scenarios analysis should be incorporated into the assessment of hydrologic-related services to facilitate regional water resources management.
Key words: ecosystem services; scenario analysis; climate change; SCS-CN model; Hanjiang River
WANG Pengtao , ZHANG Liwei , LI Yingjie , JIAO Lei , WANG Hao , YAN Junping , LÜ Yihe , FU Bojie . Spatio-temporal variations of the flood mitigation service of ecosystem under different climate scenarios in the Upper Reaches of Hanjiang River Basin, China[J]. Journal of Geographical Sciences, 2018 , 28(10) : 1385 -1398 . DOI: 10.1007/s11442-018-1551-4
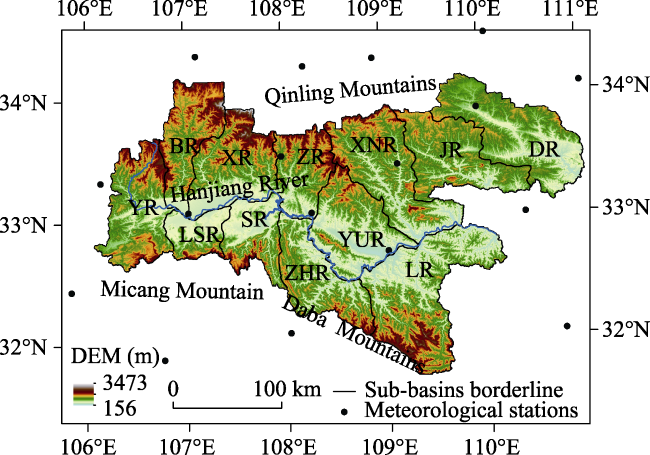
Figure 1 Location and 12 sub-basins of the Upper Reaches of Hanjiang River (URHR), China. These sub-basins are Yanghe River (YR), Baohe River (BR), Xuhe River (XR), Ziwuhe River (ZR), Xunhe River (XNR), Jinqian River (JR), Danjiang River (DR), Lengshuihe River (LSR), Shuangmahe River (SR), Zhuhe River (ZHR), Yuehe River (YR), Lanhe River (LR), respectively |
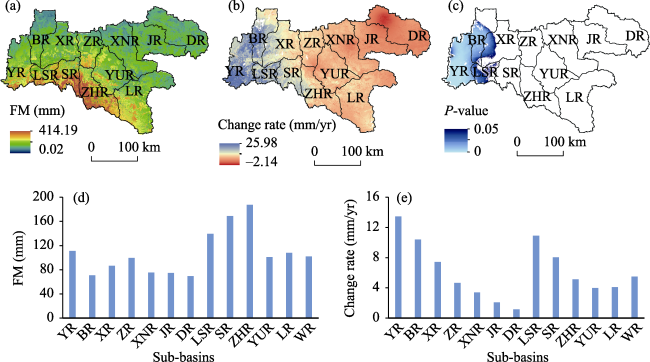
Figure 2 Spatial patterns of annual FMS (a), change rate (b), the significant level (c) and sub-basins distribution of annual average (d) and change rate (e) of flood mitigation service in the URHR. In (d) and (e), WR represents the whole region (URHR). |
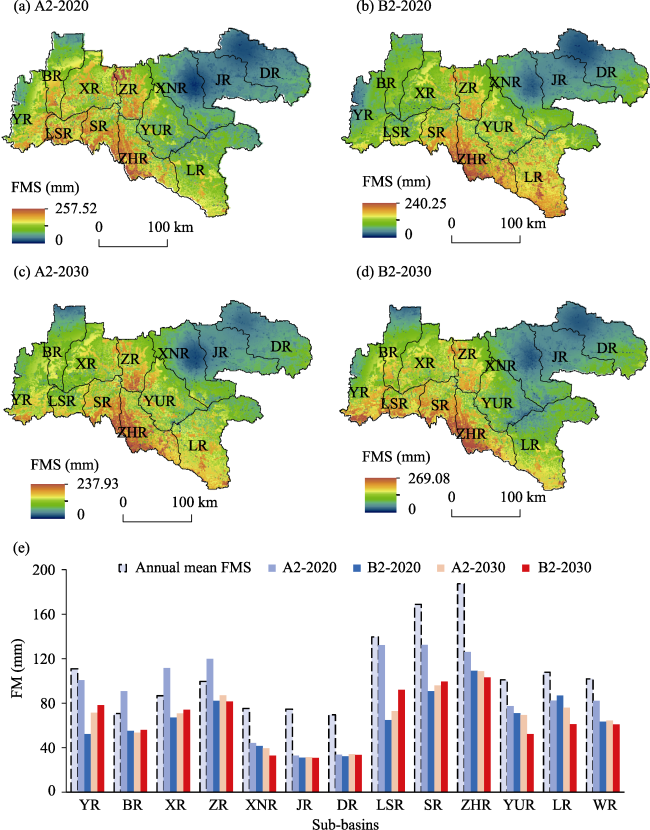
Figure 3 The flood mitigation map under climate change scenarios in the URHR: A2-2020 (a), B2-2020 (b), A2-2030 (c), B2-2030 (d) and sub-basins distribution in scenarios (e). In (e), WR represents the whole region (URHR). |
Table 1 The transfer matrix of land use/land cover in URHR from 2000 to 2014 (km2) |
| Land cover | Grassland | Wetland | Cropland | Artificial land | Bare land | Woodland | Decrease |
|---|---|---|---|---|---|---|---|
| Grassland | 367.25 | 1.25 | 0 | 0 | 0 | 0 | 1.25 |
| Wetland | 0 | 328 | 1.25 | 0 | 6.25 | 0 | 7.5 |
| Cropland | 0 | 11.06 | 12629.19 | 41.81 | 2.44 | 351.38 | 406.69 |
| Artificial land | 0 | 0 | 0 | 401.69 | 0 | 0 | 0 |
| Bare land | 0 | 24.56 | 0 | 0 | 245.69 | 0 | 24.57 |
| Woodland | 0 | 0 | 0 | 0 | 2.5 | 48412.57 | 2.5 |
| Increase | 0 | 36.88 | 1.25 | 41.81 | 11.19 | 351.38 | - |
| Net change | -1.25 | 29.38 | -405.44 | 41.81 | -13.38 | 348.88 | - |
| Relative change (%) | -0.34 | 8.56 | -3.02 | 10.41 | -4.54 | 0.72 | - |
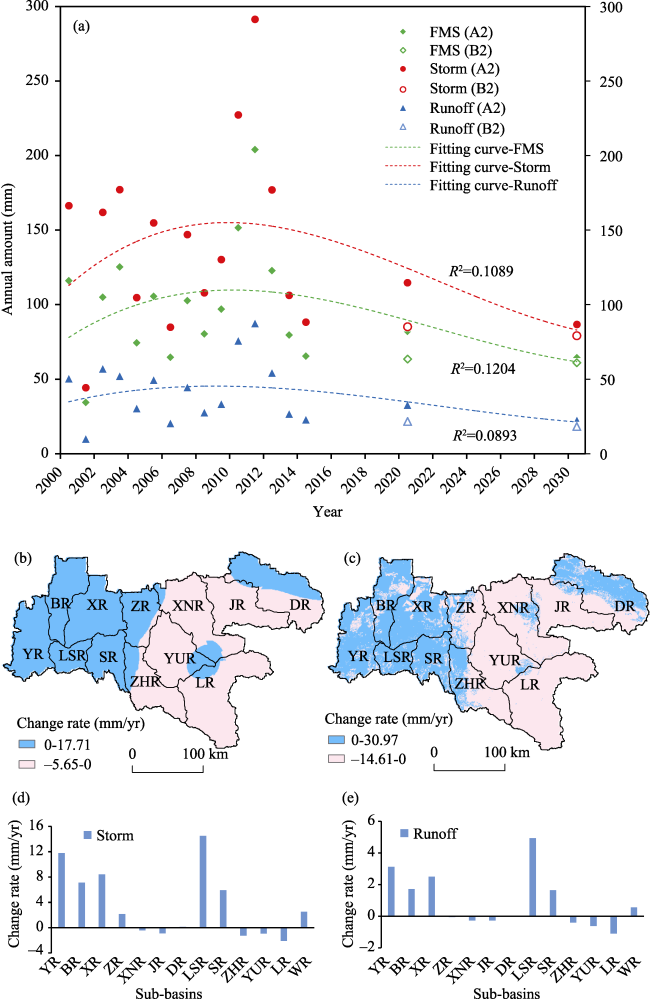
Figure 4 Temporal variations of storm and runoff (a), spatial variations of storm change slope (b), spatial variations of runoff change slope (c), storm change slope of sub-basins (d) and runoff change slope of sub-basins (e). In (d) and (e), WR represents the Whole Region (URHR). |
The authors have declared that no competing interests exist.
| [1] |
|
| [2] |
|
| [3] |
|
| [4] |
|
| [5] |
|
| [6] |
|
| [7] |
|
| [8] |
|
| [9] |
|
| [10] |
|
| [11] |
|
| [12] |
|
| [13] |
|
| [14] |
|
| [15] |
|
| [16] |
|
| [17] |
|
| [18] |
|
| [19] |
|
| [20] |
|
| [21] |
|
| [22] |
|
| [23] |
|
| [24] |
|
| [25] |
|
| [26] |
|
| [27] |
|
| [28] |
|
| [29] |
|
| [30] |
|
| [31] |
|
| [32] |
|
| [33] |
|
| [34] |
|
| [35] |
|
| [36] |
|
| [37] |
|
| [38] |
|
| [39] |
|
| [40] |
|
| [41] |
|
| [42] |
|
| [43] |
|
| [44] |
|
| [45] |
|
| [46] |
|
| [47] |
|
| [48] |
|
| [49] |
|
| [50] |
|
| [51] |
|
| [52] |
|
| [53] |
USDA, 1985. National Engineering Handbook, Section 4, Hydrology. United States Department of Agriculture, Soil and Conservation Service, Washington, DC.
|
| [54] |
|
| [55] |
|
| [56] |
|
| [57] |
|
| [58] |
|
| [59] |
|
| [60] |
|
| [61] |
|
| [62] |
|
/
| 〈 |
|
〉 |