Special Issue: Geopolitical Environment Simulation on the Belt and Road Region

Influences of environmental changes on water storage variations in Central Asia

  • HU Weijie , 1, 3 ,
  • LIU Hailong , 2, * ,
  • BAO Anming 1 ,
  • Attia M. El-Tantawi 1, 4
Expand
  • 1. State Key Laboratory of Desert and Oasis Ecology, Xinjiang Institute of Ecology and Geography, CAS, Urumqi 830011, China
  • 2. School of Resources and Environment, University of Electronic Science and Technology of China, Chengdu 611731, China
  • 3. CAS Research Center for Ecology and Environment of Central Asia, Urumqi 830011, China
  • 4. Institute of African Research and Studies, Cairo University, Giza 12613, Egypt
*Corresponding author: Liu Hailong (1974-), Professor, specialized in hydrology and water resources. E-mail:

Author: Hu Weijie (1990-), Research Intern, specialized in hydrology and water resources. E-mail:

Received date: 2017-07-24

  Online published: 2018-07-20

Supported by

National Natural Science Foundation of China, No.51569027

No.41371419

International Partnership Program of the Chinese Academy of Sciences, No.131551KYSB20160002

Special Institute Main Service Program of the Chinese Academy of Sciences, No.TSS-2015-014-FW-1-2

Copyright

Journal of Geographical Sciences, All Rights Reserved

Abstract

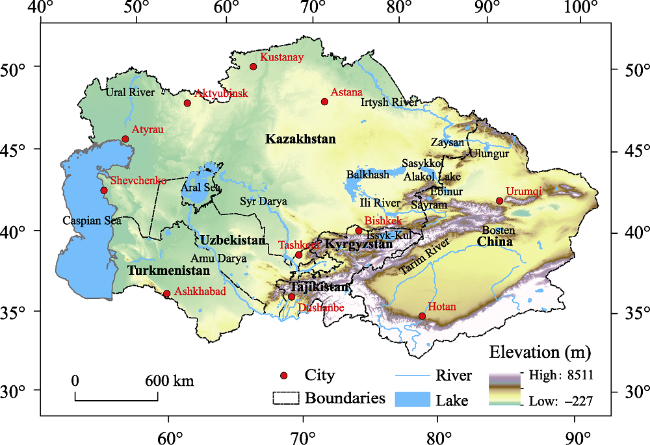
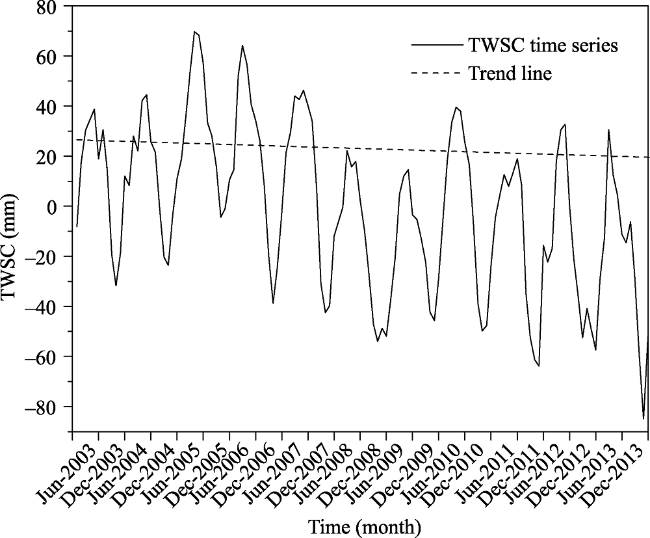
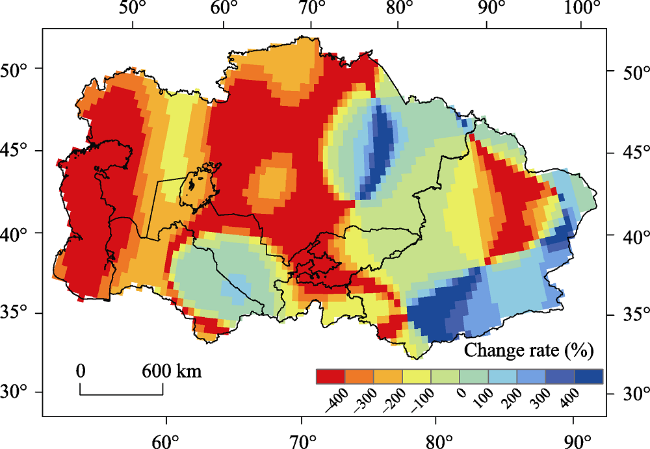
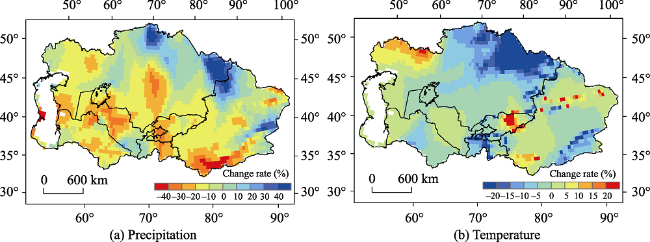
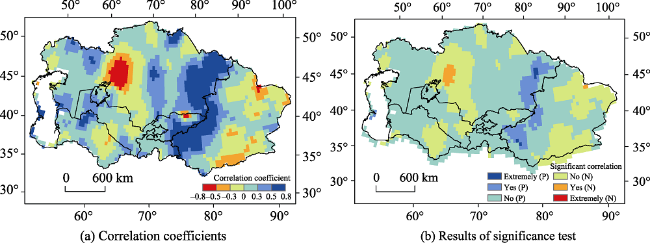
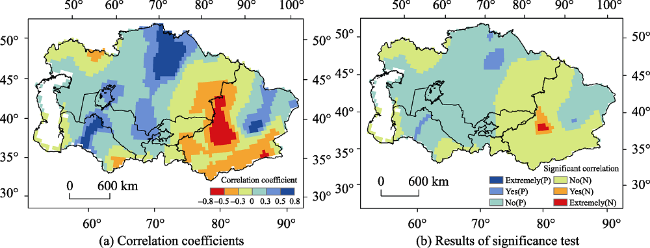
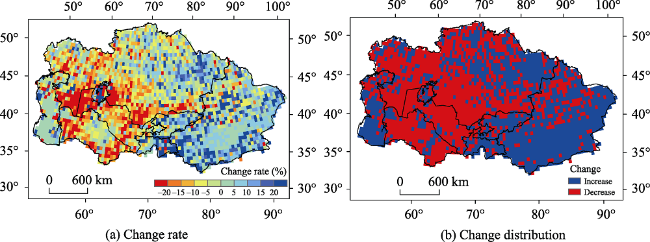
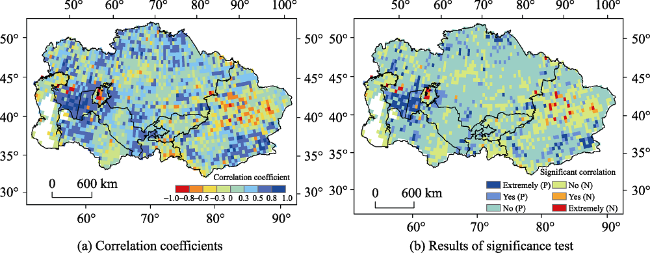
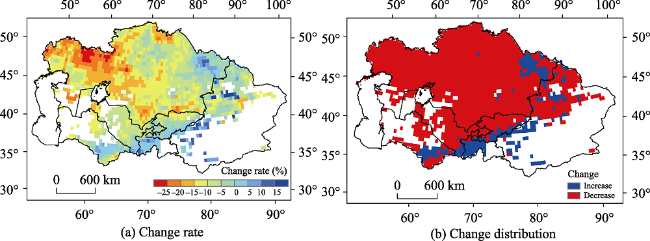
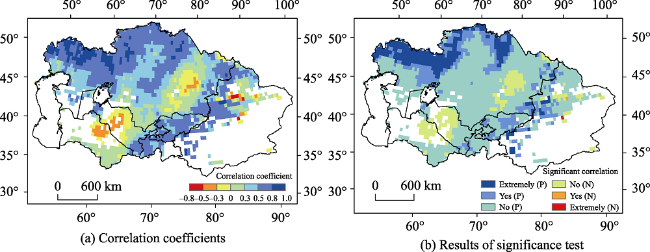
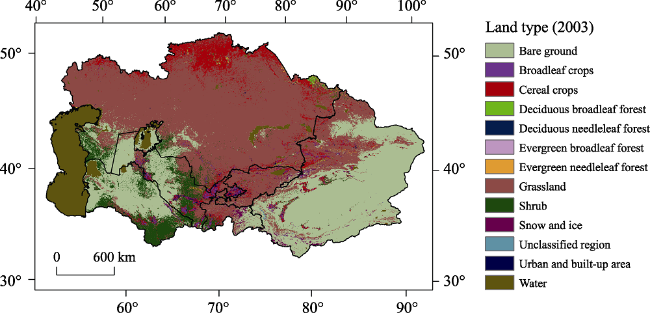
The spatio-temporal pattern of the global water resource has significantly changed with climate change and intensified human activities. The regional economy and ecological environment are highly affected by terrestrial water storage (TWS), especially in arid areas. To investigate the variation of TWS and its influencing factors under changing environments, the response relationships between TWS and changing environments (climate change and human activities) in Central Asia have been analyzed based on the Gravity Recovery and Climate Experiment (GRACE) data, Climatic Research Unit (CRU) climate data and Moderate Resolution Imaging Spectroradiometer (MODIS) remote sensing data products (MOD16A2, MOD13A3 and MCD12Q1) from 2003 to 2013. The slope and Pearson correlation analysis methods were used. Results indicate that: (1) TWS in about 77 % of the study area has decreased from 2003 to 2013. The total change volume of TWS is about 2915.6 × 108 m3. The areas of decreased TWS are mainly distributed in the middle of Central Asia, while the areas of increased TWS are concentrated in the middle-altitude regions of the Kazakhstan hills and Tarim Basin. (2) TWS in about 5.91% of areas, mainly distributed in the mountain and piedmont zones, is significantly positively correlated with precipitation, while only 3.78% of areas show significant correlation between TWS and temperature. If the response time was delayed by three months, there would be a very good correlation between temperature and TWS. (3) There is a significantly positive relationship between TWS and Normalized Difference Vegetation Index (NDVI) in 13.35% of the study area. (4) The area of significantly positive correlation between TWS and evapotranspiration is about 31.87%, mainly situated in mountainous areas and northwestern Kazakhstan. The reduction of regional TWS is related to precipitation more than evaporation. Increasing farmland area may explain why some areas show increasing precipitation and decreasing evapotranspiration. (5) The influences of land use on TWS are still not very clear. This study could provide scientific data useful for the estimation of changes in TWS with climate change and human activities.

Cite this article

HU Weijie , LIU Hailong , BAO Anming , Attia M. El-Tantawi . Influences of environmental changes on water storage variations in Central Asia[J]. Journal of Geographical Sciences, 2018 , 28(7) : 985 -1000 . DOI: 10.1007/s11442-018-1517-6

1 Introduction

In arid and semiarid regions where the ecological environment is extremely vulnerable, terrestrial water storage (TWS) has important influences on the regional climate change and ecological environment (Liu et al., 2013; Zhang et al., 2012). TWS changes have become one of the major limiting factors for socio-economic development (Cao et al., 2015; Long et al., 2014; Ramillien et al., 2005). Therefore, studying the spatial and temporal variations of TWS is important in informing sustainable utilization of regional water resources and sustainable socio-economic development.
TWS comprises groundwater, soil moisture, surface water bodies (lakes, rivers and reservoirs), glaciers, snow water equivalent, and canopy water storage (Syed et al., 2008). Global water storage is distributed extremely unevenly in time and space, and shows variable trends (Long et al., 2015; Schmidt et al., 2006; Yang et al., 2013). Existing studies have indicated a decreasing trend in TWS in Central and South Asia (Singh et al., 2012; Tangdamrongsub et al., 2011), of 0.42 ± 0.12 cm·a-1 in the Tianshan region, China (Yang and Chen, 2015). Conversely, TWS in the Tarim River Basin shows a generally increasing trend (Yang et al., 2015). Glacier and snowmelt are the main important water resources in arid and semiarid regions in Central Asia (Sorg et al., 2012; Chen et al., 2015) where TWS was remarkably affected by climate change (Immerzeel et al., 2010; Sorg et al., 2012). In the study area, glaciers and snow are the main components of TWS as the most beginning of rivers originate from the Tianshan Mountains (Aizen et al., 1997). The results of recent researches indicated that the glacier and snow have different upward or downward tendency, glacier and snowmelt decreased TWS in the mountain and basin regions (Matsuo and Heki, 2010) but increased it in the surrounding basin area (Yang et al., 2015).
Changes in land water reserves are mainly influenced by climate change and human activities. Research shows significant correlation between water storage changes and temperature, precipitation and snow water equivalent in Central and South Asia (Tangdamrongsub et al., 2011), and the precipitation in the Amazon Basin has a close relationship with TWS change (Frappart et al., 2013). In the Tarim River Basin, rainfall, runoff and evapotranspiration are major factors affecting the water storage (Yang et al., 2015), which is consistent with the results of the Amazon Basin (Chen et al., 2009). TWS changes in 23 major basins around the world were analyzed by Syed et al. (2008), which showed that for water storage changes, evapotranspiration plays a key role in middle altitude regions while snowmelt in high altitude regions and precipitation are dominant factors in the tropical zone. Human activities also play an important role in TWS changes. For example, anthropogenic factors, El Niño-Southern Oscillation (ENSO) and precipitation affected water storage changes in the Nile Basin and Ganges River Basin (Awange et al., 2014; Khandu et al., 2016). The dominant contributor to the TWS excess was found to be intensive surface water irrigation in the middle and southeastern Yangtze River Basin (Huang et al., 2015). On a macro scale, TWS changes are significantly related to vegetation and land use in Northern Eurasia (De et al., 2015; Velicogna et al., 2015). Thus, current research mainly focuses on single climatic factors or human activities, and mostly on humid and semihumid regions, while comprehensive studies of arid areas are limited.
TWS can be determined through in situ observations, but this is limited to small areas and partial components, such as soil moisture and snow water equivalent (Cayan, 1996; Robock et al., 2000; Serreze et al., 1999). It is more difficult to monitor water resources at large scales (Alley et al., 2002; Lettenmaier and Famiglietti, 2006). Microwave satellite sensors can provide estimates of surface (upper few cm) soil moisture and only in locations where vegetation is sparse (Gao et al., 2004; Njoku et al., 2003). The accuracy of simulations using land surface models is limited by the difficulty in obtaining the required parameters (Dijk et al., 2013; Huang et al., 2015). Gravity recovery and climate experiment (GRACE) data have alleviated the shortcomings of the above methods, and could quantify the variations of terrestrial water storage from space. Previous studies have suggested that GRACE accuracy is high enough to resolve mass variations for large river basins or regions of several hundred kilometers extension (Wahr et al., 2004; Velicogna and Wahr, 2006) allowing the possibility of quantitative studies of TWS changes at large or medium scale. Until now, GRACE data have been widely used to study water storage changes (Luthcke et al., 2006; Rodell et al., 2009; Tapley et al., 2004). Many studies indicate that TWS changes estimated using GRACE data are consistent with the results simulated by hydrologic models (Han et al., 2010; Mohamed et al., 2011; Velicogna and Wahr, 2006). Thus, GRACE is an important data source for studying changes in regional water storage.
As a vulnerable ecological region, the gap between supply and demand of water in Central Asia has increased with climate change and intensified human activities in recent years (Bernauer and Siegfried, 2012; Siegfried et al., 2012). However, the studies paid little attention to the impact of climate change on regional TWS variations in Central Asia. In order to explore the relationship between water supply and demand we used GRACE data, CRU climate data and remote sensing datasets including evapotranspiration, vegetation index and land use from 2003 to 2013. Using slope and Pearson correlation analysis methods, we have investigated temporally and spatially response relationships between TWS variation and environmental change focusing on climate change and human activities in Central Asia.

2 Study area

The area defined as Central Asia covers five countries of the former Soviet Union (Kazakhstan, Kyrgyzstan, Tajikistan, Uzbekistan, and Turkmenistan) as well as Xinjiang, an autonomous region in northwestern China (Deng and Chen, 2016). It is largely confined within 34°34′-55°43′N and 46°49′-96°37′E (Figure 1) and covers about 601×104 km2, making up about a third of all arid areas in the world (Chen et al., 2008). Located at the center of Eurasia, far from the oceans, with a dry climate, Central Asia belongs to a typical continental climate zone. The annual mean temperature of Central Asia is 4-8℃ (Lioubimtseva and Henebry, 2009), the annual mean precipitation is 100-400 mm (De Pauw, 2008), and the evapotranspiration is up to 900-1500 mm (Qin, 1999). Large quantities of glaciers and permanent snow form “wet islands” in arid inland mountains, and are a main recharge source of rivers and lakes in plains during the dry season. The study area has a total population of 65 million, and cultivated land, natural vegetation and water body cover 70.1 × 10⁴ km2, 313.2 × 10⁴ km2, and 13.8 × 10⁴ km2 of the area, respectively (Chen et al., 2013).
Figure 1 Study area of Central Asia

3 Data and methods

3.1 Data sources

In this study, the spatial and temporal variations of TWS in Central Asia were analyzed using GRACE (Level2 RL05 GSM) products published by the Center for Space Research (University of Texas at Austin) from January 2003 to December 2013 (http://icgem. gfz-potsdam.de/ICGEM/TimeSeries.html).
Meteorological data (2003-2013) used in this paper were produced by the Climate Research Unit (CRU TS v.3.23), University of East Anglia (http://www.cru.uea.ac.uk/cru/ data/hrg/). Evapotranspiration data (MOD16A2) were provided by the Numerical Terra dynamic Simulation Group (NTSG), University of Montana (http://www.ntsg.umt.edu/project/ mod16). The Shuttle Radar Topography Mission (SRTM) data were used as a digital elevation model. The dataset was provided by International Scientific & Technical Data Mirror Site, Computer Network Information Center, CAS (http://datamirror.csdb.cn). Both NDVI data (MOD13A3) and Land-Use and Land-Cover Change (LUCC) data (MCD12Q1) were downloaded from the Goddard Space Flight Center, NASA (https://ladsweb.nascom.nasa. gov/data/search.html). The temporal and spatial resolutions of data used in this study were given in Table 1.
Table 1 Data information
Data name Temporal resolution Spatial resolution
GRACE Monthly 1° × 1°
CRU Monthly 0.5° × 0.5°
MOD16A2 Monthly 1km × 1km
MOD13A3 Monthly 1km × 1km
MCD12Q1 Yearly 500 m × 500 m
DEM 90 m × 90 m

3.2 Data processing

The monthly spherical harmonics coefficients of GRACE gravity were converted into the equivalent water height by Matlab; then these data and the climate data (precipitation and temperature) from CRU were transformed into raster data to analyze the TWS by ArcGIS. Filling missing data was done using mean value method, a simple and rapid method to interpolate missing data, which does not affect the estimate of the mean value. MODIS data processing (mosaicking, extracting, converting, transforming, resampling, and recoding) was dependent on the MODIS Reprojection Tool (MRT). Data analysis was achieved using ENVI 5.1 and ArcGIS10.2 provided by Environmental Systems Research Institute (ESRI), Inc.

3.3 Calculation of TWS changes based on GRACE data

Terrestrial water storage could be estimated according to the GRACE spherical harmonic coefficients at monthly time-scales (Wahr et al., 1998). TWS fluctuations would bring changes in gravity field. This change can be expressed by spherical harmonic coefficients. So, water density could be obtained through gravity field, and be transformed into equivalent water height. The equation of equivalent water height with gravity spherical harmonic coefficients is listed as follows (Yang and Chen, 2015):
$\Delta H(\theta ,\phi )=\frac{2a{{\rho }_{ave}}\pi }{3{{\rho }_{_{W}}}}\sum\limits_{l=0}^{N}{\sum\limits_{m=0}^{l}{\frac{2l+1}{1+{{k}_{l}}}{{W}_{l}}{{P}_{lm}}(cos\theta \text{)}}}[\Delta {{C}_{lm}}cos(m\phi )+\Delta {{S}_{lm}}sin(m\phi )]$ (1)
where H is equivalent water height, θ is the latitude, φ is the longitude, a is the equatorial radius, ρave is the mean density of the Earth, ρw is the density of water, kl is the Loew coefficient, Clm and Slm are the coefficients of the gravity spherical harmonics coefficients (Stokes’ coefficients), and Plm(cosθ) is the lth degree and mth order fully-normalized Legendre function, with maximum degree l and order m, expanded to 60, Wl is the weight function, which can be obtained by the following recursion formula:
${{W}_{\text{0}}}=\frac{1}{2\pi },$ ${{W}_{1}}=\frac{1}{2\pi }\left[ \frac{1+{{e}^{-2b}}}{1-{{e}^{-2b}}}-\frac{1}{b} \right],$ ${{W}_{l\text{+1}}}=-\frac{2l+1}{b}{{W}_{l}}+{{W}_{l-\text{1}}},$ $b=\frac{ln2}{1-cos\left( r/a \right)}$
where a is the equatorial radius, and r is the Gaussian smooth radius (r =300 km in this paper).

3.4 Slope analysis method

In order to analyze the fluctuation characteristics of TWS, precipitation, temperature, NDVI and evapotranspiration with time, the slope analysis method was applied to calculate the changing trends. The formula used is as below (Wang et al., 2010):
$Slp=\frac{N\sum\limits_{i=1}^{N}{i{{X}_{i}}}-\left( \sum\limits_{i=1}^{N}{i} \right)\left(\sum\limits_{i=1}^{N}{{{X}_{i}}}\right)}{N\sum\limits_{i=1}^{N}{{{i}^{2}}}-{{\left( \sum\limits_{i=1}^{N}{i} \right)}^{2}}}$ (2)
where Slp is the change slope, i is the corresponding time for Xi (i = 1, in the year of 2003), and N is the quantity of samples (i.e., number of years, N=11, in this paper). If Slp > 0, the response relationship between the variables would be a positive trend, otherwise, it would be a negative trend.

3.5 Pearson correlation analysis method

Climate factors, vegetation and land use affect TWS along with time and space. The variables are assumed to be independent and continuous, and in a normal distribution, the Pearson correlation analysis method was used to discuss the close links between these variables in this study. The formula is as follows (Zhou et al., 2016):
$r=\frac{N\sum\limits_{i=1}^{N}{{{X}_{i}}{{Y}_{i}}}-\sum\limits_{i=1}^{N}{{{X}_{i}}}\sum\limits_{i=1}^{N}{{{Y}_{i}}}}{\sqrt{N\sum\limits_{i=1}^{N}{{{X}_{i}}^{2}-{{\left( \sum\limits_{i=1}^{N}{{{X}_{i}}} \right)}^{2}}}}\sqrt{N\sum\limits_{i=1}^{N}{{{Y}_{i}}^{2}-{{\left( \sum\limits_{i=1}^{N}{{{Y}_{i}}} \right)}^{2}}}}}$ (3)
where r is the Pearson correlation coefficient, i is the corresponding time for Xi and Yi (i = 1, in the year of 2003), and N is the number of years (N=11, in this paper). The coefficient r ranges from -1 to 1, and the greater the value of | r |, the higher the correlation. There is weak correlation when | r | is less than 0.3, low correlation when greater than 0.3 and less than 0.5, moderate correlation when greater than 0.5 and less than 0.8, and high correlation when greater than 0.8 (Suo et al., 2009).

4 Results and discussion

4.1 Temporal and spatial variations of TWSC in Central Asia

In order to analyze the temporal and spatial variations of the terrestrial water storage changes (TWSC) in Central Asia, the monthly and inter-annual TWSC during 2003-2013 were calculated.
4.1.1 Temporal variations of TWSC
Based on equation (1), the earth’s surface density was calculated using spherical harmonic coefficients of gravity field. It was converted into equivalent water height, which represents TWSC. The monthly TWSC is shown in Figure 2.
Figure 2 Temporal variations of TWS
TWS anomalies in the GRACE dataset (Figure 2) show a decreasing trend from January 2003 to December 2013, with a slope of -4.85 mm·a-1. The maximum positive anomaly of TWS of 69.61 mm occurred in April 2005, while the minimum negative anomaly of about -84.90 mm occurred in November 2013. Before 2005, TWS increased at a rate of 5.04 mm·a-1, then it began to decrease. The largest decrease of -24.24 mm·a-1 occurred from 2006 to 2008. Afterwards, the decreasing trend slowed down to -5.39 mm·a-1. Over the whole period, the reduction of TWS in volume was 2915.6 × 108 m3.
4.1.2 Spatial variations of TWSC
The first monthly mean values of TWS were calculated every year. Based on the results, the inter-annual variation trend of TWS was obtained. To study the spatial variations in TWSC, the percentage change in the inter-annual variation from 2003 to 2013 compared with TWS in 2003 was computed (Figure 3).
Figure 3 Spatial variations of TWS
Figure 3 shows a decreasing trend in TWS in most parts of Central Asia from 2003 to 2013, and the overall decrease in the west is larger than in the east. The TWS increases are mainly over the northeast of Turkmenistan, the southeast of Uzbekistan, east of Kazakhstan and east of Xinjiang, China. Further analysis revealed a decreasing trend in TWS in 77.04% of Central Asia from 2003 to 2013, and the rate of decrease is more than 400% in the Caspian Sea and its coastal lowlands, the middle of the five Central Asian countries and the north of Xinjiang, China. These areas account for 41.92% of the areas where TWS decreased. While in 22.96% of Central Asia TWS increases, the rate of increase is less than 100% in 46.4% of the above regions and greater than 400% in only 13.44% of the areas in the east of Kazakhstan, the southeast of the Tarim Basin and the west of the Kunlun Mountains. TWS changes may attribute to the melting of glaciers in the upper reach of the Amu Darya River and Ili River as a result of global warming and the changes affecting the terminal lake - Balkhash Lake.
TWS can be described by the water balance equation ΔW=P-R-E, where ΔW is terrestrial water storage, P is precipitation, R is runoff, and E is evapotranspiration. Vegetation has close relationship with precipitation, runoff and evapotranspiration. Temperature also greatly affects evapotranspiration. On the other hand, the human activities altered the water resource redistribution and the land use types. So the factors influencing the water storage variations in Central Asia, including climate change, vegetation change and human activities, are discussed in the following section.

4.2 The influence of climate change on TWSC in Central Asia

To study the influence of climate change on TWSC, the spatial variations of climatic factors were analyzed. The mean correlation coefficients between TWS and both climatic elements of precipitation and temperature were calculated.
4.2.1 Fluctuation characteristics of regional climate
Previous studies have shown that the climate in Central Asia has become warmer and more humid in recent years (Chen et al., 2011; Hu et al., 2014). Accordingly, precipitation and temperature variables were selected to analyze the effects of climate change on TWSC. The change rates of precipitation and temperature (based on the absolute value of 2003) were calculated. The spatial characteristics of climate change are shown in Figure 4.
Figure 4 Spatial variations of climatic factors
Figure 4a indicates that precipitation increased in 72.89% and decreased in 27.11% of Central Asia. The areas where precipitation decreased are mainly distributed in the central zone of Uzbekistan, the east of Tajikistan, the west of Kyrgyzstan, south-central Kazakhstan, the south of the Tarim Basin and the west of the Kunlun Mountains. The precipitation data shows an increasing trend in northern and eastern Kazakhstan, northwestern and eastern Xinjiang, China from 2003 to 2013. Figure 4b shows a decreasing trend in temperature in about 64.71% of Central Asia from 2003 to 2013, mainly over northeastern Kazakhstan, central Tajikistan and southeastern Xinjiang. The temperature increase is below 5% in about 73.93% of the region, while the temperature increased more significantly in the northern Turgay Plateau and to the west of it, central Kyrgyzstan and sporadic areas in north-central Xinjiang.
4.2.2 Relationship between climate change and TWSC in Central Asia
To analyze the relationships between TWSC and climate change, the Pearson correlation analysis method was used to calculate the correlation coefficients between TWS and precipitation and temperature. Then, significance tests were carried out (significant when P<0.05; extremely significant when P<0.01). The results are shown in Figures 5 and 6.
In Figure 5a, the mean correlation coefficient is 0.38, indicating low correlation between TWS and precipitation in Central Asia. The variables are positively correlated in 70.82% of the study area. There is weak positive correlation in 55.08% and moderate positive correlation in 18.72% of these areas. The east of Kazakhstan, the west of the Tianshan Mountains in Xinjiang and the northwest of the Tarim Basin are the main regions showing a moderate positive correlation. Mostly, there are weakly negative correlations between TWS and precipitation.
Figure 5 Response relationship between TWS and precipitation
The test results in Figure 5b indicate that TWS is significantly and positively correlated with precipitation mainly in mountainous areas and their piedmont zones in eastern Kazakhstan and western Tianshan of Xinjiang and the basin in front of it. The areas of significant and positive correlation account for about 5.92% of Central Asia. In the eastern part of Kazakhstan, higher elevations result in more rainfall, thus precipitation has become the decisive factor for TWSC. Figures 3 and 4a show that TWS in piedmont areas is recharged by precipitations in mountains. The rainfall in the Altai Mountains significantly increased while TWS in the Balkhash Lake Basin most significantly increased. To the northeast of the Aral Sea, a significantly negative correlation was found between TWS and precipitation in the Turgay Valley, which makes up 1.01% of Central Asia. In this area, TWS decreased even with more precipitation and less evapotranspiration. Human activities may explain the phenomenon observed.
Overall, TWS is weakly correlated with temperature and the mean correlation coefficient is 0.15. Figure 6a shows that the areas where they are positively correlated account for about 57.42% of Central Asia. For these areas, 62.56% showed weakly positive correlation and only 11.31% showed a moderate positive correlation, mostly in west-central Turkmenistan and the north of Kazakhstan. The negatively correlated area covers 42.58% of Central Asia, with weak correlation occupying 62.67%. In western Tianshan of Xinjiang and its southern slope, it makes up 6.9% of the area where TWS is negatively correlated with temperature, the correlation is moderate. Figure 6b indicates that the regions where TWS and temperature are significantly correlated are scattered and only account for 3.78% of Central Asia.
Figure 6 Response relationship between TWS and temperature
Precipitation and TWS reached a maximum almost at the same time, but peak temperature lagged peak TWS by about three months. When the temperature data time series was moved forward by three months, the mean correlation coefficient between TWS and temperature was 0.78, which represents a high correlation. This is because the precipitation can directly and quickly affect TWS, while the influence of temperature on TWS has to get through evapotranspiration in Central Asia.

4.3 Relationship between vegetation change and TWSC in Central Asia

To investigate the influence of vegetation change on TWSC, the changing trend of vegetation index and the correlation between evapotranspiration and TWSC were analyzed.
4.3.1 Effects of vegetation change on TWS
Using the aforementioned methods to analyze the changing trend and correlation, the relationship between vegetation index and TWS was analyzed. The results are shown in Figures 7 and 8.
Figure 7 shows that, in the study area, the NDVI is generally higher in the east and lower in the west from 2003 to 2013. The areas where the NDVI is higher are mainly distributed over the east of Kazakhstan, Kyrgyzstan, Tajikistan, Turkmenistan and Xinjiang, China. These areas make up 50.09% of Central Asia, however NDVI increased by less than 10% in 59.9% of these areas. In the Pamirs, the Tianshan and the Kunlun mountains of Xinjiang, the NDVI showed an obvious increase. On the other hand, the NDVI decreased in 49.91% of Central Asia, mainly on the east coast of the Caspian Sea, the areas surrounding the Aral Sea, and the deserts in five countries of southeast Central Asia.
Figure 7 Spatial variations of vegetation index (NDVI)
In Figure 8a, TWS and vegetation index are weakly correlated, with a mean correlation coefficient of 0.14. The variables are positively correlated in 74.7% of the study area. The correlation is moderate or high in 30.49% of the aforementioned areas, mostly on the east coast of the Caspian Sea, the areas surrounding the Aral Sea and in southeastern Xinjiang. The regions where there is negative correlation between TWS and vegetation index cover 25.3% of Central Asia, of which 67.51% are weakly correlated. Most of the areas with moderate or high correlation are in the Pamirs, and the middle Tianshan of Xinjiang, which occupy 13.56% of the zones with negative correlation. From Figure 8b, in 13.35% of the research areas, TWS is significantly or extremely significantly correlated with the vegetation index. These areas are mostly located in the desert regions between the Caspian Sea and Aral Sea. The effects of water on vegetation variations are most remarkable in deserts.
Figure 8 Response relationship between TWS and vegetation
After shifting the NDVI data time series forward by two months, the correlation coefficient between TWSC and NDVI is up to 0.71, namely, a moderate correlation. This showsthat vegetation growth lags behind TWSC by about two months.
4.3.2 Effects of evapotranspiration on TWS
In this section, the methods used to analyze the impacts of climate change on TWS were used to investigate the spatial variations of evapotranspiration (Figure 9) and the relationship with TWS (Figure 10). Evapotranspiration in areas without any vegetation coverage was not calculated for MOD16A2 products, and its value was set as null in water, desert and the Gobi area.
Figure 9 Spatial variations of evapotranspiration
Figure 10 Response relationship between TWS and evapotranspiration
Figure 9 shows an increasing trend in the evapotranspiration in only 12.07% of areas (mainly the east and southeast) from 2003 to 2013. 62.33% of areas have trends lower than 5%. The areas with decreasing trends account for 87.93% of Central Asia. The reduction rates are lower than 15% in 66.11% of these areas, and greater than 20% in 8.31% of these areas. The main regions of significantly decreased evapotranspiration are the Turgay Plateau and northwest of the Plateau.
The correlations between TWS and evapotranspiration are positive in 90.69% of Central Asia (Figure 10a). Among those areas, 51.55% show moderate or high correlation, mostly in the northern Turgay Plateau and to the west of it. However, in 9.31% of areas, mainly the Balkhash Lake Basin and desert areas of southern Central Asia, the two variables are negatively correlated. Some 73.26% of negative correlations is weak.
Figure 10b shows significant or extremely significant correlations between TWS and evapotranspiration in 31.87% of the study area, mainly in the grassland of northwestern Kazakhstan and mountainous areas.
Even in conditions of decreased evapotranspiration, TWS shows a declining trend in mountainous regions, the Turgay Plateau and to its west. Reduced precipitation plays a leading role. Decreasing evapotranspiration with increasing temperature in this area is consistent with the “evaporation paradox” (Brutsaert and Parlange, 1998). TWS in plains in northern Kazakhstan decreases with reduced rainfall and evapotranspiration. The increased surface area of arable land may be the main factor explaining this relationship.

4.4 Effects of human activities on TWSC

LUCC was used as an index to reflect human activities. The raw data is acquired from MCD12Q1 data, processed by MRT. According to the Plant Functional Type classification system, determined by a supervised decision tree classification method, 13 types of land use are identified in Central Asia. Figure 11 shows the land use map of the study area in 2003. After summing up the area of each type between 2003 and 2013, the correlation coefficients between TWS and the area of each type were computed. The percentage of land use types in 2003 and the correlation coefficients are shown in Table 2.
Figure 11 Land use map of Central Asia in 2003
Table 2 LUCC of Central Asia and correlation coefficients with TWS
Land use type Percentage (%) Changed area (×104 km2) Correlation coefficients
Water 8.05 -2.20 0.81
Evergreen needle-leaf forest 0.21 2.49 -0.76
Evergreen broad-leaf forest 0.02 -0.06 0.56
Deciduous needle-leaf forest 0.05 -0.22 0.75
Deciduous broad-leaf forest 0.17 0.25 -0.62
Shrub land 6.39 -8.19 0.37
Grassland 47.37 8.36 -0.36
Cereal crops 6.10 -5.44 0.55
Broad-leaf crops 1.08 2.32 -0.58
Urban and built-up area 0.34 0.0005 -0.50
Snow and ice 0.70 1.23 -0.27
Bare land 29.44 1.66 -0.15
Unclassified region 0.09 -0.19 0.40
As shown in the land use map (Figure 11), grassland makes up 47.37% of Central Asia, mostly distributed in Kazakhstan, Kyrgyzstan and northwestern Xinjiang, China. The area of bare land is only second to the grassland area, with a percentage of 29.44%, mainly covering the desert of southern Central Asia and Xinjiang. The Caspian Sea is the largest water body, accounting for 8.05% of the study area. The shrub land and the cereal crops that are mainly distributed in northern Kazakhstan cover 6.39% and 6.10% of the area. Other land use types cover less than 1%.
Table 2 shows the highest land cover changes from 2003 to 2013 in grassland and shrub land, affecting areas of 8.36 × 10⁴ km2 and -8.19 × 10⁴ km2, respectively. But we found low correlations between LUCC and TWS, with correlation coefficients of -0.36 and 0.37, respectively. Areas of water, evergreen needle-leaf forest, cereal and broad-leaf crops changed by more than 2 × 10⁴ km2, with correlation coefficients with TWS greater than 0.5, namely moderate correlations. The other types of land use changed a little, and the areas of forest are moderately correlated with TWS. In summary, TWS is negatively associated with land use types whose areas increased and positively associated with the area decrease of land usetypes. Therefore, an analysis of correlations between TWS and land use only considering the area change is not sufficient, and the impacts of human activities on TWSC should be the focus of further research.

5 Conclusions

Based on the slope and Pearson correlation analysis methods, the temporal and spatial variations of TWS were analyzed using GRACE data from 2003 to 2013. The influence of climate change, evapotranspiration and human activities on TWSC in time and space were discussed, using remote sensing data including climate data, evapotranspiration, vegetation index and land use. The conclusions are as follows:
From 2003 to 2013, TWS in Central Asia increased first and then decreased with time, the volume of decreased TWS totaling about 2915.6 × 108 m3. In about 77 % of Central Asia, TWS showed a decreasing trend from 2003 to 2013. The trend is more pronounced in middle-altitude regions of western and middle Central Asia and parts of the Tianshan Mountains in Xinjiang. The change rates are less than 100% over 46.4% of the areas where TWS increased. TWS significantly increased in the middle-altitude regions of the Kazakhstan hills and Tarim Basin.
The mean correlation coefficient between TWS and precipitation is 0.38. These variables, either significantly or extremely significantly, are positively correlated in mountain and piedmont regions, which account for 5.91% of Central Asia. The rainfall in mountainous areas is the main supply source of TWS in piedmont regions, while water storage in the Turgay Valley may be mainly affected by human activities. Air temperature has a weak effect on TWS with a mean correlation coefficient of 0.15, with significant correlation coefficients in only 3.78% of the study area. There is a three-month lag between temperature change and TWSC.
The mean correlation coefficient between TWS and NDVI is 0.14 overall. Correlations are positive and significant or extremely significant in 13.35% of the study area, mainly in the desert between the Caspian Sea and Aral Sea. In this region, the effect of water on vegetation is remarkable, and the response of NDVI to TWS lags by two months.
Significant or highly significant positive correlation was found between TWS and evapotranspiration in 31.87% of Central Asia, mostly the mountainous areas and northwestern Kazakhstan. The decrease of regional TWS is related to the decrease in precipitation rather than evaporation. Even in conditions of precipitation increase and evapotranspiration decrease, TWS still decreases in the north of Kazakhstan. The main reason may be the increase in farmland area.
The effects of land use and land cover change on TWS are analyzed in this paper, but this lacks the consideration of a response mechanism between these variables. Exploring how land use changes affect TWS will be the focus of a future study.

The authors have declared that no competing interests exist.

[1]
Aizen V B, Aizen E M, Melack J Met al., 1997. Climatic and hydrologic changes in the Tien Shan, Central Asia.Journal of Climate, 10(6): 1393-1404.

DOI

[2]
Alley W M, Healy R W, La B J W,et al. 2002. Flow and storage in groundwater systems.Science, 296(5575): 1985-1990.The dynamic nature of groundwater is not readily apparent, except where discharge is focused at springs or where recharge enters sinkholes. Yet groundwater flow and storage are continually changing in response to human and climatic stresses. Wise development of groundwater resources requires a more complete understanding of these changes in flow and storage and of their effects on the terrestrial environment and on numerous surface-water features and their biota.

DOI PMID

[3]
Awange J L, Forootan E, Kuhn Met al., 2014. Water storage changes and climate variability within the Nile Basin between 2002 and 2011.Advances in Water Resources, 73: 1-15.Understanding water storage changes within the Nile’s main sub-basins and the related impacts of climate variability is an essential step in managing its water resources. The Gravity Recovery And Climate Experiment (GRACE) satellite mission provides a unique opportunity to monitor changes in total water storage (TWS) of large river basins such as the Nile. Use of GRACE-TWS changes for monitoring the Nile is, however, difficult since stronger TWS signals over the Lake Victoria Basin (LVB) and the Red Sea obscure those from smaller sub-basins making their analysis difficult to undertake. To mitigate this problem, this study employed Independent Component Analysis (ICA) to extract statistically independent TWS patterns over the sub-basins from GRACE and the Global Land Data Assimilation System (GLDAS) model. Monthly precipitation from the Tropical Rainfall Measuring Mission (TRMM) over the entire Nile Basin are also analysed by ICA. Such extraction enables an in-depth analysis of water storage changes within each sub-basin and provides a tool for assessing the influence of anthropogenic as well as climate variability caused by large scale ocean–atmosphere interactions such as the El Ni09o Southern Oscillation (ENSO) and the Indian Ocean Dipole (IOD). Our results indicate that LVB experienced effects of both anthropogenic and climate variability (i.e., a correlation of 0.56 between TWS changes and IOD at 95% confidence level) during the study period 2002–2011, with a sharp drop in rainfall between November and December 2010, the lowest during the entire study period, and coinciding with the drought that affected the Greater Horn of Africa. Ethiopian Highlands (EH) generally exhibited a declining trend in the annual rainfall over the study period, which worsened during 2007–2010, possibly contributing to the 2011 drought over GHA. A correlation of 0.56 was found between ENSO and TWS changes over EH indicating ENSO’s dominant influence. TWS changes over Bar-el-Ghazal experienced mixed increase–decrease, with ENSO being the dominant climate variability in the region during the study period. A remarkable signal is noticed over the Lake Nasser region indicating the possibility of the region losing water not only through evaporation, but also possibly through over extraction from wells in the Western Plateau (Nubian aquifer).

DOI

[4]
Bernauer T, Siegfried T, 2012. Climate change and international water conflict in Central Asia.Journal of Peace Research, 49(1): 227-239.We engage in a critical assessment of the neo-malthusian claim that climatic changes can be an important source of international tensions, in the extreme even militarized interstate disputes. The most likely scenario is conflict over water allocation in international catchments shared by poorer, less democratic, and politically less stable countries, governed by weak international water management institutions, and exposed to severe climatic changes. The Syr Darya corresponds quite well to all these characteristics. If the neo-malthusian specter of conflict over water is empirically relevant, we should see signs of this in the Syr Darya. The riparian countries of the Aral Sea basin have experienced international disputes over water allocation ever since the USSR collapsed and, with it, existing water management institutions and funding. The worst such dispute concerns the Syr Darya, one of the two largest rivers in Central Asia. Based on hydrological data and other information we find that the only existing international water management institution in the Syr Darya has failed. Based on a coupled climate, land-ice and rainfall-runoff model for the Syr Darya, we then examine whether, in the absence of an effective international water allocation mechanism, climate change is likely to make existing international tensions over water allocation worse. We find that climate change-induced shifts in river runoff, to which the Uzbek part of the Syr Darya catchment is particularly vulnerable, and which could contribute to a deterioration of already strained Kyrgyz zbek relations, are likely to set in only in the medium to long term. This leaves some time for the riparian countries to set up an effective international framework for water allocation and prevention of climate-induced geohazards. By implication, our findings suggest that a climate change-induced militarized interstate dispute over water resources in Central Asia is unlikely.

DOI

[5]
Brutsaert W, Parlange M B, 1998. Hydrologic cycle explains the evaporation paradox.Nature, 396(6706): 30.The evaporation of water, measured using evaporation pans, has been decreasing in the past few decades over large areas with different climates. The common interpretation is that the trend is related to increasing cloudiness, and that it provides an indication of decreasing potential evaporation and a decreasing terrestrial evaporation component in the hydrologic cycle. Here we show that, although these studies are valuable, pan evaporation has not been used correctly as an indicator of climate change.

DOI

[6]
Cao Y, Nan Z, Cheng G, 2015. GRACE gravity satellite observations of terrestrial water storage changes for drought characterization in the arid land of northwestern China.Remote Sensing, 7(1): 1021-1047.

DOI

[7]
Cayan D R, 1996. Inter-annual climate variability and snowpack in the western United States.Journal of Climate, 9(5): 928-948.

DOI

[8]
Chen F H, Huang W, Jin L Yet al., 2011. Spatiotemporal precipitation variations in the arid Central Asia in the context of global warming.Science China Earth Sciences, 54(12): 1812-1821.This study analyzed the temporal precipitation variations in the arid Central Asia (ACA) and their regional differences during 1930–2009 using monthly gridded precipitation from the Climatic Research Unit (CRU). Our results showed that the annual precipitation in this westerly circulation dominated arid region is generally increasing during the past 80 years, with an apparent increasing trend (0.7 mm/10 a) in winter. The precipitation variations in ACA also differ regionally, which can be divided into five distinct subregions (I West Kazakhstan region, II East Kazakhstan region, III Central Asia Plains region, IV Kyrgyzstan region, and V Iran Plateau region). The annual precipitation falls fairly even on all seasons in the two northern subregions (regions I and II, approximately north of 45°N), whereas the annual precipitation is falling mainly on winter and spring (accounting for up to 80% of the annual total precipitation) in the three southern subregions. The annual precipitation is increasing on all subregions except the southwestern ACA (subregion V) during the past 80 years. A significant increase in precipitation appeared in subregions I and III. The long-term trends in annual precipitation in all subregions are determined mainly by trends in winter precipitation. Additionally, the precipitation in ACA has significant interannual variations. The 2–3-year cycle is identified in all subregions, while the 5–6-year cycle is also found in the three southern subregions. Besides the inter-annual variations, there were 3–4 episodic precipitation variations in all subregions, with the latest episodic change that started in the mid- to late 1970s. The precipitations in most of the study regions are fast increasing since the late 1970s. Overall, the responses of ACA precipitation to global warming are complicated. The variations of westerly circulation are likely the major factors that influence the precipitation variations in the study region.

DOI

[9]
Chen J L, Wilson C R, Tapley B D,et al. 2009. 2005 drought event in the Amazon River basin as measured by GRACE and estimated by climate models.Journal of Geophysical Research Atmospheres, 114(B5): 3093-3107.1] Satellite gravity measurements from the Gravity Recovery and Climate Experiment (GRACE) provide new quantitative measures of the 2005 extreme drought event in the Amazon river basin, regarded as the worst in over a century. GRACE measures a significant decrease in terrestrial water storage (TWS) in the central Amazon basin in the summer of 2005, relative to the average of the 5 other summer periods in the GRACE era. In contrast, data-assimilating climate and land surface models significantly underestimate the drought intensity. GRACE measurements are consistent with accumulated precipitation data from satellite remote sensing and are also supported by in situ water-level data from river gauge stations. This study demonstrates the unique potential of satellite gravity measurements in monitoring large-scale severe drought and flooding events and in evaluating advanced climate and land surface models.

DOI

[10]
Chen X, 2008. Land Use/Cover Change in Arid Areas in China. Beijing: Science Press, 180-201. (in Chinese)

[11]
Chen X, Bai J, Li X,et al. 2013. Changes in land use/land cover and ecosystem services in Central Asia during 1990-2009.Current Opinion in Environmental Sustainability, 5(1): 116-127.Ecosystem service is an emerging hot topic in the field of ecology. Temporal and spatial variations in human-induced land use change and climate variability have resulted in regional differences in dryland ecosystem services. Such information, however, is not enough. It is necessary to better understand such variations of ecosystem services to support policy-making and management in dryland areas. In the research, a case study was conducted in the ecologically vulnerable region of Central Asia. Land use and land cover change, net primary productivity (NPP), actual evapotranspiration (AET) and crop production were selected for evaluation. Substantial conversion of farmland to natural vegetation from 1990 to 2000 had led to a considerable decrease in farmland and crop production in the same period. With the reclamation of abandoned farmland in the recent 10 years, the crop production restored and reached a high and stable level. The NPP of farmland was significantly higher than that of natural vegetation. Despite of the decrease in precipitation, the NPP increased in 2000 with the rise of temperature. The AET was higher in the northern and eastern part than in the central area of Central Asia, and the mean AET of farmland was greatly lower than that of natural vegetation.

DOI

[12]
Chen Y, Li Z, Fan Yet al., 2015. Progress and prospects of climate change impacts on hydrology in the arid region of Northwest China.Environmental Research, 139: 11-19.61The sharp increasing of temperature has turned to hiatus since the 21st century.61Precipitation sharply increased in 1987, since then has been in a high volatility.61Negative effects of global warming on the ecology have been highlighted.61The amount of surface water will probably remain at a high state of fluctuation.

DOI PMID

[13]
De K M, Henebry G M, Owsley B Cet al., 2015. Using multiple remote sensing perspectives to identify and attribute land surface dynamics in Central Asia 2001-2013.Remote Sensing of Environment, 170: 48-61.61Expanding change analysis into the thermal regions of the EM spectrum is informative.61Central Asia's land surface changes as a result of anthropogenic and weather impacts.61Greater declines in vegetation were observed for areas with lower human influence.61Most greening of vegetation occurs for areas with intermediate human influence.

DOI

[14]
De P E, 2008. ICARDA regional GIS datasets for Central Asia: Explanatory notes. GIS Unit Technical Bulletin. International Center for Agricultural Research in the Dry Areas (ICARDA), Aleppo.

[15]
Deng H, Chen Y, 2016. Influences of recent climate change and human activities on water storage variations in Central Asia.Journal of Hydrology, 544: 46-57.Terrestrial water storage (TWS) change is an indicator of climate change. Therefore, it is helpful to understand how climate change impacts water systems. In this study, the influence of climate change on TWS in Central Asia over the past decade was analyzed using the Gravity Recovery and Climate Experiment satellites and Climatic Research Unit datasets. Results indicate that TWS experienced a decreasing trend in Central Asia from 2003 to 2013 at a rate of -4.44卤2.2 mm/a, and that the maximum positive anomaly for TWS (46 mm) occurred in July 2005, while the minimum negative anomaly (32.5 mm) occurred in March 2008-August 2009. The decreasing trend of TWS in northern Central Asia (-3.86 0.63 mm/a) is mainly attributed to soil moisture storage depletion, which is driven primarily by the increase in evapotranspiration. In the mountainous regions, climate change exerted an influence on TWS by affecting glaciers and snow cover change. However, human activities are now the dominant factor driving the decline of TWS in the Aral Sea region and the northern Tarim River Basin.

DOI

[16]
Dijk A I J M V, Peña-Arancibia J L, Wood E Fet al., 2013. Global analysis of seasonal streamflow predictability using an ensemble prediction system and observations from 6192 small catchments worldwide.Water Resources Research, 49(5): 2729-2746.ABSTRACT [1] Ideally, a seasonal streamflow forecasting system would ingest skilful climate forecasts and propagate these through calibrated hydrological models initialized with observed catchment conditions. At global scale, practical problems exist in each of these aspects. For the first time, we analyzed theoretical and actual skill in bimonthly streamflow forecasts from a global ensemble streamflow prediction (ESP) system. Forecasts were generated six times per year for 1979 2008 by an initialized hydrological model and an ensemble of 1 resolution daily climate estimates for the preceding 30 years. A post-ESP conditional sampling method was applied to 2.6% of forecasts, based on predictive relationships between precipitation and 1 of 21 climate indices prior to the forecast date. Theoretical skill was assessed against a reference run with historic forcing. Actual skill was assessed against streamflow records for 6192 small (<10,000 km2) catchments worldwide. The results show that initial catchment conditions provide the main source of skill. Post-ESP sampling enhanced skill in equatorial South America and Southeast Asia, particularly in terms of tercile probability skill, due to the persistence and influence of the El Ni o Southern Oscillation. Actual skill was on average 54% of theoretical skill but considerably more for selected regions and times of year. The realized fraction of the theoretical skill probably depended primarily on the quality of precipitation estimates. Forecast skill could be predicted as the product of theoretical skill and historic model performance. Increases in seasonal forecast skill are likely to require improvement in the observation of precipitation and initial hydrological conditions.

DOI

[17]
Frappart F, Ramillien G, Ronchail J, 2013. Changes in terrestrial water storage versus, rainfall and discharges in the Amazon basin.International Journal of Climatology, 33(14): 3029-3046.This study examines how the interannual variability of rainfall impacts the land water storage in the Amazon basin during the 2003 2010 time span at monthly time-scale using respectively, Tropical Rainfall Measuring Mission (TRMM) and Gravity Recovery And Climate Experiment (GRACE) satellite observations. Monthly estimates of GRACE-based terrestrial water storage (TWS) are compared to (1) TRMM rainfall, (2) in situ discharges at the outlet of the major sub-basins of the Amazon over 2003 2010 to characterize the redistribution of precipitation on land water. The time-variations of land water storage derived from GRACE are consistent with those of rainfall and discharges at basin and sub-basin scales even at interannual time-scales (correlation generally greater than 0.7). The study of the relationship between these two quantities reveals large differences in terms of rainfall amount, water storage, time delays, resulting of the water transport among the sub-basins of the Amazon. The analysis of GRACE data has enabled identification of the signature of the recent extreme climatic events (droughts of 2005 and 2010, flood of 2009) on the land water storage, in terms of spatial patterns and intensity. These results are in good agreement with what was observed on independent datasets (water levels and discharges, vegetation activity, forest fires, and drought index), highlighting the interest of gravimetry from space missions for the characterization of the interannual variability of the TWS. GRACE data offer the unique opportunity to monitor the hydrological cycle in ungauged basins where reliable observations of rainfall and discharges are missing.

DOI

[18]
Gao H, Wood E F, Drusch Met al., 2004. Using a microwave emission model to estimate soil moisture from ESTAR observations during SGP99.Journal of Hydrometeorology, 5(1): 49-63.The 1999 Southern Great Plains Hydrology Experiment (SGP99) provides comprehensive datasets for evaluating microwave remote sensing of soil moisture algorithms that involve complex physical properties of soils and vegetation. The Land Surface Microwave Emission Model (LSMEM) is presented and used to retrieve soil moisture from brightness temperatures collected by the airborne Electronically Scanned Thinned Array Radiometer (ESTAR) L-band radiometer. Soil moisture maps for the SGP99 domain are retrieved using LSMEM, surface temperatures computed using the Variable Infiltration Capacity (VIC) land surface model, standard soil datasets, and vegetation parameters estimated through remote sensing. The retrieved soil moisture is validated using field-scale and area-averaged soil moisture collected as part of the SGP99 experiment, and had a rms range for the area-averaged soil moisture of 1.8% 2.8% volumetric soil moisture.

DOI

[19]
Han S C, Yeo I Y, Alsdorf Det al., 2010. Movement of Amazon surface water from time-variable satellite gravity measurements and implications for water cycle parameters in land surface models.Geochemistry Geophysics Geosystems, 11(9): 1-20.1] The large-scale observations of terrestrial water storage from GRACE satellites over the Amazon are analyzed with land surface model (LSM) outputs of runoff and soil moisture. A simple yet effective runoff routing method based on a continuity equation is implemented to model horizontal transport of surface water within the Amazon basin. The GRACE observations are analyzed separately for soil moisture and surface water storages (generated from runoff), relying on their distinct spatial patterns, being disperse for soil moisture and localized for surface water. Various effective velocities for storage transport are tested against the GRACE observations. When the model runoff is routed with an uniform velocity of 30 cm/s, the annual variation of the resulting surface water storage is generally found to be larger than the satellite measurements and ground gauge data by a factor of 1.5 or higher. The peak annual anomaly of surface water storage is observed around the midstream of the Amazon main stem. However, the runoff routing simulations present the peak amplitude consistently around the delta (downstream), unless the increasing velocity in a downstream region is used. As complements to the ground gauge data, the satellite observations provide unique 090004spatial090005 information of water cycle parameters. Our analysis indicates possible shortcomings in the certain LSM mass transport scheme between atmosphere and land surface, particularly the production of too large seasonal variations in runoff (and maybe too little variations in evapotranspiration), and the dynamic characteristics of surface water transport within the Amazon basins.

DOI

[20]
Hu Z, Zhang C, Hu Q,et al. 2014. Temperature changes in Central Asia from 1979 to 2011 based on multiple datasets.Journal of Climate, 27(3): 1143-1167.The arid and semiarid region in central Asia is sensitive and vulnerable to climate variations. However, the sparse and highly unevenly distributed meteorological stations in the region provide limited data for understanding of the region’s climate variations. In this study, the near-surface air temperature change in central Asia from 1979 to 2011 was examined using observations from 81 meteorological stations, three local observation validated reanalysis datasets of relatively high spatial resolutions, and the Climate Research Unit (CRU) dataset. Major results suggested that the three reanalysis datasets match well with most of the local climate records, especially in the low-lying plain areas. The consensus of the multiple datasets showed significant regional surface air temperature increases of 0.36°–0.42°Cdecade-1 in the past 33 years. No significant contributions from declining irrigation and urbanization to temperature change were found. The rate is larger in recent years than in the early years in the study period. Additionally, unlike in many regions in the world, the temperature in winter showed no increase in central Asia in the last three decades, a noticeable departure from the global trend in the twentieth century. The largest increase in surface temperature was occurring in the spring season. Analyses further showed a warming center in the middle of the central Asian states and weakened temperature variability along the northwest–southeast temperature gradient from the northern Kazakhstan to southern Xinjiang. The reanalysis datasets also showed significant negative correlations between temperature increase rate and elevation in this complex terrain region.

DOI

[21]
Huang Y, Salama M, Krol M Set al., 2015. Estimation of human-induced changes in terrestrial water storage through integration of GRACE satellite detection and hydrological modeling: A case study of the Yangtze River basin.Water Resources Research, 51(10): 8494-8516.

DOI

[22]
Immerzeel W W, Beek L P H V, Bierkens M F P, 2010. Climate change will affect the Asian water towers.Science, 328(5984): 1382-1385.More than 1.4 billion people depend on water from the Indus, Ganges, Brahmaputra, Yangtze, and Yellow rivers. Upstream snow and ice reserves of these basins, important in sustaining seasonal water availability, are likely to be affected substantially by climate change, but to what extent is yet unclear. Here, we show that meltwater is extremely important in the Indus basin and important for the Brahmaputra basin, but plays only a modest role for the Ganges, Yangtze, and Yellow rivers. A huge difference also exists between basins in the extent to which climate change is predicted to affect water availability and food security. The Brahmaputra and Indus basins are most susceptible to reductions of flow, threatening the food security of an estimated 60 million people.

DOI PMID

[23]
Khandu, Forootan E, Schumacher M,et al. 2016. Exploring the influence of precipitation extremes and human water use on total water storage (TWS) changes in the Ganges-Brahmaputra-Meghna River Basin.Water Resources Research, 52(3): 2240-2258.Climate extremes such as droughts and intense rainfall events are expected to strongly influence global/regional water resources in addition to the growing demands for freshwater. This study examines the impacts of precipitation extremes and human water usage on total water storage (TWS) over the Ganges-Brahmaputra-Meghna (GBM) River Basin in South Asia. Monthly TWS changes derived from the Gravity Recovery And Climate Experiment (GRACE) (2002–2014) and soil moisture from three reanalyses (1979–2014) are used to estimate new extreme indices. These indices are applied in conjunction with standardized precipitation indices (SPI) to explore the impacts of precipitation extremes on TWS in the region. The results indicate that although long-term precipitation do not indicate any significant trends over the two subbasins (Ganges and Brahmaputra-Meghna), there is significant decline in rainfall (9.065±654.0 mm/decade) over the Brahmaputra-Meghna River Basin from 1998 to 2014. Both river basins exhibit a rapid decline of TWS from 2002 to 2014 (Ganges: 12.265±653.4 km3/yr and Brahmaputra-Meghna: 9.165±652.7 km3/yr). While the Ganges River Basin has been regaining TWS (5.465±652.2 km3/yr) from 2010 onward, the Brahmaputra-Meghna River Basin exhibits a further decline (13.065±653.2 km3/yr) in TWS from 2011 onward. The impact of human water consumption on TWS appears to be considerably higher in Ganges compared to Brahmaputra-Meghna, where it is mainly concentrated over Bangladesh. The interannual water storage dynamics are found to be strongly associated with meteorological forcing data such as precipitation. In particular, extreme drought conditions, such as those of 2006 and 2009, had profound negative impacts on the TWS, where groundwater resources are already being unsustainably exploited.

DOI

[24]
Lettenmaier D P, Famiglietti J S, 2006. Hydrology: Water from on high.Nature, 444(444): 562-563.

DOI

[25]
Lioubimtseva E, Henebry G M, 2009. Climate and environmental change in arid Central Asia: Impacts, vulnerability, and adaptations.Journal of Arid Environments, 73(11): 963-977.Vulnerability to climate change and other hazards constitutes a critical set of interactions between society and environment. As transitional economies emerging from the collapse of the Soviet Union, the republics of Central Asia are particularly vulnerable due to (1) physical geography (which dominated by temperate deserts and semi-deserts), (2) relative underdevelopment resulting from an economic focus on monoculture agricultural exports before 1991, and (3) traumatic social, economic, institutional upheavals following independence. Aridity is expected to increase across the entire Central Asian region, but especially in the western parts of Turkmenistan, Uzbekistan, and Kazakhstan. Temperature increases are projected to be particularly high in summer and fall, accompanied by decreases in precipitation. We examine the concepts of vulnerability, adaptation, and mitigation in the context of climate change in Central Asia. We explore three major aspects of human vulnerability ood security, water stress, and human health nd propose a set of indicators suitable for their assessment. Non-climatic stresses are likely to increase regional vulnerability to climate change and reduce adaptive capacity due to resource deployment to competing needs.

DOI

[26]
Long D, Longuevergne L, Scanlon B R, 2015. Global analysis of approaches for deriving total water storage changes from GRACE satellites.Water Resources Research, 51(4): 2574-2594.Abstract Increasing interest in use of GRACE satellites and a variety of new products to monitor changes in total water storage (TWS) underscores the need to assess the reliability of output from different products. The objective of this study was to assess skills and uncertainties of different approaches for processing GRACE data to restore signal losses caused by spatial filtering based on analysis of 1° × 1° grid-scale data and in 60 river basins globally. Results indicate that scaling factors from six LSMs, including GLDAS-1 four models (Noah2.7, Mosaic, VIC, and CLM 2.0), CLM 4.0, and WGHM, are similar over most of humid, subhumid, and high-latitude regions but can differ by up to 100% over arid and semiarid basins and areas with intensive irrigation. Temporal variability in scaling factors is generally minor at the basin scale except in arid and semiarid regions, but can be appreciable at the 1° × 1° grid scale. Large differences in TWS anomalies from three processing approaches (scaling factor, additive, and multiplicative corrections) were found in arid and semiarid regions, areas with intensive irrigation, and relatively small basins (e.g., ≤200,000 km2). Furthermore, TWS anomaly products from gridded data with CLM4.0 scaling factors and the additive correction approach more closely agree with WGHM output than the multiplicative correction approach. This comprehensive evaluation of GRACE processing approaches should provide valuable guidance on applicability of different processing approaches with different climate settings and varying levels of irrigation.

DOI

[27]
Long D, Shen Y, Sun A, et al.2014. Drought and flood monitoring for a large karst plateau in Southwest China using extended GRACE data.Remote Sensing of Environment, 155(1): 145-160.61An ANN model is developed to extend GRACE total water storage changes back to 1979.61Trends in three-decade total water storage changes in SW China are examined.61The most extreme drought in 2010 and severe flooding in 2008 are examined.61The developed approach is able to hindcast and predict total water storage change.

DOI

[28]
Luthcke S B, Zwally H J, Abdalati W,et al. 2006. Recent Greenland ice mass loss by drainage system from satellite gravity observations.Science, 314(5803): 1286-1289.

DOI

[29]
Matsuo K, Heki K, 2010. Time-variable ice loss in Asian high mountains from satellite gravimetry.Earth and Planetary Science Letters, 290(1/2): 30-36.Substantial amount of glacial ice is considered to be melting in the Asian high mountains. Gravimetry by GRACE satellite during 2003–2009 suggests the average ice loss rate in this region of 47 ± 12 Gigaton (Gt) yr 61 1, equivalent to 65 0.13 ± 0.04 mm yr 61 1 sea level rise. This is twice as fast as the average rate over 65 40 years before the studied period, and agrees with the global tendency of accelerating glacial loss. Such ice loss rate varies both in time and space; mass loss in Himalaya is slightly decelerating while those in northwestern glaciers show clear acceleration. Uncertainty still remains in the groundwater decline in northern India, and proportion of almost isostatic (e.g. tectonic uplift) and non-isostatic (e.g. glacial isostatic adjustment) portions in the current uplift rate of the Tibetan Plateau. If gravity increase associated with ongoing glacial isostatic adjustment partially canceled the negative gravity trend, the corrected ice loss rate could reach 61 Gt yr 61 1.

DOI

[30]
Mohamed A, Mohamed S, John Wet al., 2011. Integration of GRACE (Gravity Recovery and Climate Experiment) data with traditional data sets for a better understanding of the time-dependent water partitioning African watersheds.Geology, 39(5): 479-482.ABSTRACT Monthly (71 months) Gravity Recovery and Climate Experiment (GRACE) gravity field solutions acquired over North and Central Africa (August 2002 uly 2008) were destriped, smoothed (250 km; Gaussian), and converted to equivalent water thickness. These data were analyzed in a geographic information system environment together with relevant data sets (e.g., topography, geology, remote sensing) to assess the utility of GRACE for monitoring elements of hydrologic systems on local scales. The following were observed over the Niger, Congo, and Nile Basins: (1) large persistent anomalies (standard deviation, SD > 10 cm) on SD images over periods of 2 7 yr; (2) anomalous areas originate at mountainous source areas that receive high precipitation, extend downslope toward mountain foothills, and often continue along main channels, wetlands, or lakes that drain these areas; (3) time-series analyses over anomalous areas showed that seasonal mass variation lags behind seasonal precipitation; and (4) seasonal mass variations showed progressive shift in phase and decrease in amplitude with distance from the mountainous source areas. Results indicate that (1) the observed temporal mass variations are largely controlled by elements of the hydrologic cycle (e.g., runoff, infiltration, groundwater flow) and have not been obscured by noise, as previously thought; and (2) it is possible to use GRACE to investigate the temporal local responses of a much larger suite of hydrologic systems (watersheds, lakes, rivers, and marshes) and domains (source areas and lowlands) within watersheds and subbasins worldwide.

DOI

[31]
Njoku E G, Jackson T J, Lakshmi V,et al. 2003. Soil moisture retrieval from AMSR-E.IEEE Transactions on Geoscience & Remote Sensing, 41(2): 215-229.The Advanced Microwave Scanning Radiometer (AMSR-E) on the Earth Observing System (EOS) Aqua satellite was launched on May 4, 2002. The AMSR-E instrument provides a potentially improved soil moisture sensing capability over previous spaceborne radiometers such as the Scanning Multichannel Microwave Radiometer and Special Sensor Microwave/Imager due to its combination of low frequency and higher spatial resolution (approximately 60 km at 6.9 GHz). The AMSR-E soil moisture retrieval approach and its implementation are described in this paper. A postlaunch validation program is in progress that will provide evaluations of the retrieved soil moisture and enable improved hydrologic applications of the data. Key aspects of the validation program include assessments of the effects on retrieved soil moisture of variability in vegetation water content, surface temperature, and spatial heterogeneity. Examples of AMSR-E brightness temperature observations over land are shown from the first few months of instrument operation, indicating general features of global vegetation and soil moisture variability. The AMSR-E sensor calibration and extent of radio frequency interference are currently being assessed, to be followed by quantitative assessments of the soil moisture retrievals.

DOI

[32]
Qin B Q, 1999. A preliminary investigation of lake evolution in 20-century in Inland Mainland Asia with relation to the global warming.Journal of Lake Science, 11(1): 11-19. (in Chinese)

DOI

[33]
Ramillien G, Frappart F, Cazenave A,et al. 2005. Time variations of land water storage from an inversion of 2 years of GRACE geoids.Earth & Planetary Science Letters, 235(1/2): 283-301.By delivering monthly maps of the gravity field, the GRACE project allows the determination of tiny time variations of the Earth's gravity and particularly the effects of fluid mass redistributions at the surface of the Earth. However, GRACE data represent vertically integrated gravity measurements, thus are the sum of all mass redistributions inside the Earth's system (atmosphere, oceans and continental water storage, plus solid Earth). In this paper, we apply a generalized least-squares inverse approach, previously developed by [1] [G. Ramillien, A. Cazenave, O. Brunau, Global time-variations of hydrological signals from GRACE satellite gravimetry, Geophys. J. Int. 158 (2004) 813 826.], to estimate, from the monthly GRACE geoids, continental water storage variations (and their associated uncertainties) over a 2-year time span (April 2002 to May 2004). Tests demonstrating the robustness of the method are presented, including the separation between liquid water reservoirs (surface waters + soil moisture + groundwaters) and snow pack contributions. Individual monthly solutions of total land water storage from GRACE, with a spatial resolution of 660 km, are presented for the 2-year time span. We also derive the seasonal cycle map. We further estimate water volume changes over eight large river basins in the tropics and compare with model predictions. Finally, we attempt to estimate an average value of the evapotranspiration over each river basin, using the water balance equation which links temporal change in water volume to precipitation, evapotranspiration and runoff. Amplitudes of the GRACE-derived evapotranspiration are regionally consistent to the predictions of global hydrological models.

DOI

[34]
Robock A, Vinnikov K Y, Srinivasan G,et al. 2000. The global soil moisture data bank.Bulletin of the American Meteorological Society, 81(6): 1281-1300.The Global Soil Moisture Data Bank, a Web site (http://climate.envsci.rutgers.edu/soil_moisture) dedicated to collection, dissemination, and analysis of soil moisture data from around the globe, is described. The data bank currently has soil moisture observations for over 600 stations from a large variety of global climates, including the former Soviet Union, China, Mongolia, India, and the USA...

DOI

[35]
Rodell M, Velicogna I, Famiglietti J S, 2009. Satellite-based estimates of groundwater depletion in India.Nature, 460(7258): 999-1003.Groundwater is a primary source of fresh water in many parts of the world. Some regions are becoming overly dependent on it, consuming groundwater faster than it is naturally replenished and causing water tables to decline unremittingly. Indirect evidence suggests that this is the case in northwest India, but there has been no regional assessment of the rate of groundwater depletion. Here we use terrestrial water storage-change observations from the NASA Gravity Recovery and Climate Experiment satellites and simulated soil-water variations from a data-integrating hydrological modelling system to show that groundwater is being depleted at a mean rate of 4.0 +/- 1.0 cm yr(-1) equivalent height of water (17.7 +/- 4.5 km(3) yr(-1)) over the Indian states of Rajasthan, Punjab and Haryana (including Delhi). During our study period of August 2002 to October 2008, groundwater depletion was equivalent to a net loss of 109 km(3) of water, which is double the capacity of India's largest surface-water reservoir. Annual rainfall was close to normal throughout the period and we demonstrate that the other terrestrial water storage components (soil moisture, surface waters, snow, glaciers and biomass) did not contribute significantly to the observed decline in total water levels. Although our observational record is brief, the available evidence suggests that unsustainable consumption of groundwater for irrigation and other anthropogenic uses is likely to be the cause. If measures are not taken soon to ensure sustainable groundwater usage, the consequences for the 114,000,000 residents of the region may include a reduction of agricultural output and shortages of potable water, leading to extensive socioeconomic stresses.

DOI PMID

[36]
Schmidt R, Schwintzer P, Flechtner F,et al. 2006. GRACE observations of changes in continental water storage.Global & Planetary Change, 50(1): 112-126.Signatures between monthly global Earth gravity field solutions obtained from GRACE satellite mission data are analyzed with respect to continental water storage variability. GRACE gravity field models are derived in terms of Stokes' coefficients of a spherical harmonic expansion of the gravitational potential from the analysis of gravitational orbit perturbations of the two GRACE satellites using GPS high–low and K-band low–low intersatellite tracking and on-board accelerometry. Comparing the GRACE observations, i.e., the mass variability extracted from temporal gravity variations, with the water mass redistribution predicted by hydrological models, it is found that, when filtering with an averaging radius of 750 km, the hydrological signals generated by the world's major river basins are clearly recovered by GRACE. The analyses are based on differences in gravity and continental water mass distribution over 3- and 6-month intervals during the period April 2002 to May 2003. A background model uncertainty of some 35 mm in equivalent water column height from one month to another is estimated to be inherent in the present GRACE solutions at the selected filter length. The differences over 3 and 6 months between the GRACE monthly solutions reveal a signal of some 75 mm scattering with peak values of 400 mm in equivalent water column height changes over the continents, which is far above the uncertainty level and about 50% larger than predicted by global hydrological models. The inversion method, combining GRACE results with the signal and stochastic properties of a hydrological model as ‘a priori’ in a statistical least squares adjustment, significantly reduces the overall power in the obtained water mass estimates due to error reduction, but also reflects the current limitations in the hydrological models to represent total continental water storage change in particular for the major river basins.

DOI

[37]
Serreze M C, Clark M P, Armstrong R L,et al. 1999. Characteristics of the western United States snowpack from snowpack telemetry (SNOTEL) data.Water Resources Research, 35(7): 2145-2160.Daily station data from U.S. Department of Agriculture snowpack telemetry (SNOTEL) archives through the 1995/1996 season are used to examine the climatic characteristics of snow water equivalent (SWE) for the mountainous western United States and linkages with precipitation (PRE) and temperature. Quality control procedures were developed to screen outliers in each variable. SWE for April 1 at the SNOTEL sites compares favorably with colocated snow course values. Regional differences in the seasonal cycle of SWE are discussed in terms of winter-half precipitation, temperature, and the corresponding SWE/PRE ratio. The percentage of annual precipitation represented by snowfall is highest for the Sierra Nevada (67%), northwestern Wyoming (64%), Colorado (63%), and Idaho/western Montana (62%) sectors, manifesting high SWE/PRE ratios and winter-half precipitation maxima. Lower percentages for the Pacific Northwest (50%) and Arizona/New Mexico (39%) reflect lower ratios and, especially for the latter region, a larger fraction of PRE falling outside of the accumulation season. Interannual variability in SWE in the colder inland regions is primarily controlled by available precipitation. For the warmer Pacific coast regions and Arizona/New Mexico the more important factor is the SWE/PRE ratio, illustrating the sensitivity of these areas to climate change.

DOI

[38]
Siegfried T, Bernauer T, Guiennet R, et al.2012. Will climate change exacerbate water stress in Central Asia?Climatic Change, 112(3): 1-19.How much will climate change damage the European economy? Which geographical areas would be the most affected? Which sectors are most vulnerable? Where and why will there be gains from climate change? How sectoral policies should be changed to consider climate impacts and adaptation? These questions are relevant for designing and prioritising adaptation strategies, as stressed by the European Commission White Paper on Adaptation (European Commission 2009 ). Within that context, the main motivation of the PESETA research project (Projection of Economic impacts of climate change in Sectors of the European Union based on boTtom-up Analysis) has been to contribute to a better understanding of the possible physical and economic impacts induced by climate change in Europe over the 21st century, paying particular attention to the sectoral and geographical dimensions of impacts (Ciscar et al. 2009 ; Ciscar et al. 2011a ). There are two approaches in the literature used to estimate the economic imp ...

DOI

[39]
Singh A, Seitz F, Schwatke C, 2012. Inter-annual water storage changes in the Aral Sea from multi-mission satellite altimetry, optical remote sensing, and GRACE satellite gravimetry.Remote Sensing of Environment, 123(4): 187-195.The estimation of water storage variations in lakes is essential for water resource management activities in a region. In areas of ungauged or poorly gauged water bodies, satellite altimetry acts as a powerful tool to measure changes in surface water level. Remote sensing provides images of temporal coastline variations, and a combination of both measurement techniques can indicate a change in water volume. In this study variations of the water level of the Aral Sea were computed for the period 2002 2011 from the combination of radar and laser satellite altimetry data sets over the lake. The estimated water levels were analyzed in combination with coastline changes from Landsat images in order to obtain a comprehensive picture of the lake water changes. In addition to these geometrical observations temporal changes of water storage in the lake and its surrounding were computed from GRACE satellite gravimetry. With respect to its temporal evolution the GRACE results agree very well with the geometrical changes determined from altimetry and Landsat. The advancing desiccation until the beginning of 2009 and a subsequent abrupt gain of water in 2009 2010 due to exceptional discharge from Amu Darya can clearly be identified in all data sets.

DOI

[40]
Sorg A, Bolch T, Stoffel M,et al. 2012. Climate change impacts on glaciers and runoff in Tien Shan (Central Asia).Nature Climate Change, 2(10): 725-731.Climate-driven changes in glacier-fed streamflow regimes have direct implications on freshwater supply, irrigation and hydropower potential. Reliable information about current and future glaciation and runoff is crucial for water allocation and, hence, for social and ecological stability. Although the impacts of climate change on glaciation and runoff have been addressed in previous work undertaken in the Tien Shan (known as the 'water tower of Central Asia'), a coherent, regional perspective of these findings has not been presented until now. In our study, we explore the range of changes in glaciation in different climatic regions of the Tien Shan based on existing data. We show that the majority of Tien Shan glaciers experienced accelerated glacier wasting since the mid-1970s and that glacier shrinkage is most pronounced in peripheral, lower-elevation ranges near the densely populated forelands, where summers are dry and where snow and glacial meltwater is essential for water availability. The annual glacier area shrinkage rates since the middle of the twentieth century are 0.38-0.76% per year in the outer ranges, 0.15-0.40% per year in the inner ranges and 0.05-0.31% per year in the eastern ranges. This regionally non-uniform response to climate change implies that glacier shrinkage is less severe in the continental inner ranges than in the more humid outer ranges. Glaciers in the inner ranges react with larger time lags to climate change, because accumulation and thus mass turnover of the mainly cold glaciers are relatively small. Moreover, shrinkage is especially pronounced on small or fragmented glaciers, which are widely represented in the outer regions. The relative insensitivity of glaciers in the inner ranges is further accentuated by the higher average altitude, as the equilibrium line altitude ranges from 3'500 to 3'600 masl in the outer ranges to 4'400 masl in the inner ranges. For our study, we used glacier change assessments based both on direct data (mass balance measurements) and on indirect data (aerial and satellite imagery, topographic maps). Latter can be plagued with high uncertainties and considerable errors. For instance, glaciated area has been partly overestimated in the Soviet Glacier catalogue (published in 1973, with data from the 1940s and 1950s), probably as a result of misinterpreted seasonal snowcover on aerial photographs. Studies using the Soviet Glacier catalogue as a reference are thus prone to over-emphasize glacier shrinkage. A valuable alternative is the use of continued in situ mass balance and ice thickness measurements, but they are currently conducted for only a few glaciers in the Tien Shan mountains. Efforts should therefore be encouraged to ensure the continuation and re-establishment of mass balance measurements on reference glaciers, as is currently the case at Karabatkak, Abramov and Golubin glaciers. Only on the basis of sound data, past glacier changes can be assessed with high precision and future glacier shrinkage can be estimated according to different climate scenarios. Moreover, the impact of snowcover changes, black carbon and debris cover on glacier degradation needs to be studied in more detail. Only with such model approaches, reflecting transient changes in climate, snowcover, glaciation and runoff, can appropriate adaptation and mitigation strategies be developed within a realistic time horizon.

DOI

[41]
Suo Y, Wang Z, Liu C,et al. 2009. Relationship between NDVI and precipitation and temperature in middle Asia during 1982-2002.Resources Science, 28(12): 1145-1152.The five countries in Middle Asia lie in the center of Eurasia. Most part of this region is arid and semi-arid zone with sparse vegetation cover. The study of the vegetation dynamics and environmental change in this region is important to the research of environment and climate in China. This paper explored the vegetation dynamics and its relationship with major climatic factors in middle Asia by using AVHRR-NDVI dataset at 8km spatial resolution and CRU climate data set at 0.5 spatial resolution between 1982 and 2002. These two datasets were unified to the same spatial resolution of 8km and Alberta geographic projection. The trend analysis showed that 53 percent of the land cover was relatively stable, with a very small NDVI change of 0.005 NDVI per year. These regions, especially the two large deserts, were mainly in the center of Middle Asia. Forty percent of the land had a NDVI up-trend of more than 0.0005 NDVI per year, which was mainly in the north and south of Middle Asia, while only 6 percent of the land had a NDVI down-trend of less than 0.0005 NDVI per year. The analysis on land cover types indicated that evergreen forest and alpine grass (steppe) were among the best up-trend group with NDVI gains more than 0.0014 and 0.0009 per year, while the p values are 0.001 and 0.001 respectively. There were no obvious changes in deciduous forest, grass, crop and steppified desert. To investigate the possible driving forces, correlation analysis was conducted between AVHRR-NDVI and major climatic factors, which are precipitation and temperature. In 49 percent of the area, especially in the forest steppe in north Middle Asia, annual average AVHRR-NDVI was closely related to the annual precipitation, especially that in spring and summer. Only 17.78 percent of the area is related to the annual average temperature with a validation coefficient of more than 0.05. Annually speaking, the positive correlation coefficient of evergreen forest, alpine grass with the annual average temperature is relatively low, with the correlation coefficients of 0.432 and 0.557 as well as p value of 0.052 and 0.009 respectively. The positive correlation coefficient of crop and grass with annual precipitation are comparatively low with R values of 0.511and 0.476 as well as p values of 0.018 and 0.029 respectively. The R value between NDVI and precipitation for deciduous forest was 0.415 in summer and 0.461 in winter, while the p value was 0.01 in summer and 0.461 in winter. The positive correlation coefficient of re-vegetated desert cover with precipitation in spring is relatively lower with the R value of 0.415 and the p value of 0.0061.

DOI

[42]
Syed T H, Famiglietti J S, Rodell M,et al. 2008. Analysis of terrestrial water storage changes from GRACE and GLDAS.Water Resources Research, 44(2): 339-356.1] Since March 2002, the Gravity Recovery and Climate Experiment (GRACE) has provided first estimates of land water storage variations by monitoring the time-variable component of Earth's gravity field. Here we characterize spatial-temporal variations in terrestrial water storage changes (TWSC) from GRACE and compare them to those simulated with the Global Land Data Assimilation System (GLDAS). Additionally, we use GLDAS simulations to infer how TWSC is partitioned into snow, canopy water and soil water components, and to understand how variations in the hydrologic fluxes act to enhance or dissipate the stores. Results quantify the range of GRACE-derived storage changes during the studied period and place them in the context of seasonal variations in global climate and hydrologic extremes including drought and flood, by impacting land memory processes. The role of the largest continental river basins as major locations for freshwater redistribution is highlighted. GRACE-based storage changes are in good agreement with those obtained from GLDAS simulations. Analysis of GLDAS-simulated TWSC illustrates several key characteristics of spatial and temporal land water storage variations. Global averages of TWSC were partitioned nearly equally between soil moisture and snow water equivalent, while zonal averages of TWSC revealed the importance of soil moisture storage at low latitudes and snow storage at high latitudes. Evapotranspiration plays a key role in dissipating globally averaged terrestrial water storage. Latitudinal averages showed how precipitation dominates TWSC variations in the tropics, evapotranspiration is most effective in the midlatitudes, and snowmelt runoff is a key dissipating flux at high latitudes. Results have implications for monitoring water storage response to climate variability and change, and for constraining land model hydrology simulations.

DOI

[43]
Tangdamrongsub N, Hwang C, Kao Y C, 2011. Water storage loss in Central and South Asia from GRACE satellite gravity: Correlations with climate data.Natural Hazards, 59(2): 749-769.AbstractRecent decrease of water supply in central Asia and south Asia affects billions of people here. By filtering the errors at higher frequency components and correcting for the contaminated components, we enhance the monthly GRACE gravity fields to improve the determination of change in equivalent water height (EWH). The water storage changes from GRACE and the GLDAS hydrology model all show decreasing trends in this region. At the annual and inter-annual time scales, significant correlations between the variations in EWH and the variations in temperature, precipitation and snow equivalent height are found, especially at high altitude stations, suggesting that climate change is the driving factor for the water depletion in central Asia and south Asia.

DOI

[44]
Tapley B D, Bettadpur S, Ries J C,et al. 2004. GRACE measurements of mass variability in the Earth system.Science, 305(5683): 503-505.

DOI

[45]
Velicogna I, Wahr J, 2006. Measurements of time-variable gravity show mass loss in Antarctica.Science, 311(5768): 1745-1756.Using measurements of time-variable gravity from the Gravity Recovery and Climate Experiment satellites, we determined mass variations of the Antarctic ice sheet during 2002-2005. We found that the mass of the ice sheet decreased significantly, at a rate of 152 ± 80 cubic kilometers of ice per year, which is equivalent to 0.4 ± 0.2 millimeters of global sea-level rise per year. Most of this mass loss came from the West Antarctic Ice Sheet.

DOI PMID

[46]
Wahr J, Molenaar M, Bryan F, 1998. Time variability of the earth’s gravity field: Hydrological and oceanic effects and their possible detection using grace.Journal of Geophysical Research Solid Earth, 103(B12): 30205-30230.The GRACE satellite mission, scheduled for launch in 2001, is designed to map out the Earth's gravity field to high accuracy every 2 4 weeks over a nominal lifetime of 5 years. Changes in the gravity field are caused by the redistribution of mass within the Earth and on or above its surface. GRACE will thus be able to constrain processes that involve mass redistribution. In this paper we use output from hydrological, oceanographic, and atmospheric models to estimate the variability in the gravity field (i.e., in the geoid) due to those sources. We develop a method for constructing surface mass estimates from the GRACE gravity coefficients. We show the results of simulations, where we use synthetic GRACE gravity data, constructed by combining estimated geophysical signals and simulated GRACE measurement errors, to attempt to recover hydrological and oceanographic signals. We show that GRACE may be able to recover changes in continental water storage and in seafloor pressure, at scales of a few hundred kilometers and larger and at timescales of a few weeks and longer, with accuracies approaching 2 mm in water thickness over land, and 0.1 mbar or better in seafloor pressure.

DOI

[47]
Wahr J, Swenson S, Zlotnicki V, 2004. Time-variable gravity from GRACE: First results.Geophysical Research Letter, 31(11): 293-317.

[48]
Wang J S, Chen F, Jin L,et al. 2010. Characteristics of the dry/wet trend over arid Central Asia over the past 100 years.Climate Research, 41(1): 51-59.Stretching from the Caspian Sea in the west to the western part of northeast China in the east, and central Asia is a transition belt between high latitude and low latitude areas. The and climate of this geographic region has environmental effects far beyond its borders. In this study, the dry/wet trend in and central Asia was examined over a temporal scale of 100 yr. Dry/wet change in an area is affected not only by precipitation, but also by temperature, because of its effect on potential evaporation. To more accurately describe the dry/wet trend, a drought index (DRI) was developed and calculated from gridded monthly air temperature and precipitation data from the Climate Research Unit, University of East Anglia, UK. Analysis of the DRI shows a general warm and dry trend for the region for the whole period between 1901 and 2002, A dry trend is seen in particular in the western part of Uzbekistan and Turkmenistan, central Kazakhstan, southern Xinjiang in China, and central Mongolia for the same period, while in northern Xinjiang, China, there was a weak wet trend. Over the past 100 yr, central Asia has experienced 6 wet-dry cycles: 1901-1910, 1911-1925, 1926-1935, 1936-1950, 1951-1960, and 1961-2002. The period and trend of the DRI are different from those of precipitation for the last 100 yr. The DRI can be used as an indicator of dry/wet change in and central Asia because it reflects the concurrent effects of temperature and precipitation.

DOI

[49]
Yang P, Chen Y, 2015. An analysis of terrestrial water storage variations from GRACE and GLDAS: The Tianshan Mountains and its adjacent areas, Central Asia.Quaternary International, 358(11): 106-112.The development of the social economy can benefit from the study of terrestrial water storage changes on a regional scale. To analyze water recycling and climate change, variable gravity field spherical harmonic coefficients data from GRACE (Gravity Recovery and Climate Experiment) were used to compute the terrestrial equivalent water height and then compared with data from GLDAS (Global Land Data Assimilation System) terrestrial hydrological assimilation. The data were taken from 11 years of monthly scaled measurements during the time period from January 2003 to March 2013. The investigation of the interannual and seasonal terrestrial water storage changes at the Tianshan Mountains and the surrounding areas revealed the conclusions: (1) Interannual variability, accompanied by interannual and seasonal fluctuations in terrestrial water storage, showed a decreasing trend throughout the research period, with an average reduction rate 0.4202±020.1202cm per year and with a minimal value occurred in 2009. (2) The seasonal maximum of terrestrial water storage occurred in spring (March to May), and the monthly maximum (2202mm) in April; the seasonal minimum of terrestrial water storage occurred in autumn (September to November), and the monthly minimum (612302mm) occurred in October. (3) Spatially, terrestrial water storage increased in the western portion of the study area, and decreased in the eastern and middle portions. (4) In comparing the two types of data, we see that terrestrial water storage inverted by GRACE and GLDAS shows good consistency with significant liner relations, and that the peak value of terrestrial water storage calculated by GLDAS appeared about 131 days earlier than GRACE.

DOI

[50]
Yang T, Wang C, Chen Y,et al. 2015. Climate change and water storage variability over an arid endorheic region.Journal of Hydrology, 529: 330-339.Terrestrial Water Storage (TWS) plays an important role in regional climate and water resources management, especially in arid regions under global change context. However, serious lack of in-situ measurements in remote alpine mountains is hindering our current understanding of regional TWS change in the Tarim River Basin (TRB), a large and typical arid endorheic area in Northwest China of Central Asia. To solve the problem, four different hydrology products from the Gravity Recovery and Climate Experiment (GRACE) satellite, model simulations from Global Land Data Assimilation System (GLDAS) in conjunction with in-situ measurements, are utilized to investigate patterns and underlying causes of TWS and its component changes. An excess of precipitation over evapotranspiration (ET) plus runoff contributes to an increase of TWS. The phase of Total Soil Moisture (TSM) lags that of Snow Water Equivalent (SWE), indicating a recharge from snowmelt to TSM. Increasing TWS together with decreasing SWE resulted in an increase of subsurface water. Our results are of great value to amend basin-wide water management and conservation strategies for the similar arid regions considering climate change.

DOI

[51]
Yang T, Wang C, Yu Z,et al. 2013. Characterization of spatio-temporal patterns for various GRACE- and GLDAS-born estimates for changes of global terrestrial water storage.Global and Planetary Change, 109(4): 30-37.Since the launch in March 2002, the Gravity Recovery and Climate Experiment (GRACE) satellite mission has provided us with a new method to estimate terrestrial water storage (TWS) variations by measuring earth gravity change with unprecedented accuracy. Thus far, a number of standardized GRACE-born TWS products are published by different international research teams. However, no characterization of spatio-temporal patterns for different GRACE hydrology products from the global perspective could be found. It is still a big challenge for the science community to identify the reliable global measurement of TWS anomalies due to our limited knowledge on the true value. Hence, it is urgently necessary to evaluate the uncertainty for various global estimates of the GRACE-born TWS changes by a number of international research organizations. Toward this end, this article presents an in-depth analysis for various GRACE-born and GLDAS-based estimates for changes of global terrestrial water storage. The work characterizes the inter-annual and intra-annual variability, probability density variations, and spatial patterns among different GRACE-born TWS estimates over six major continents, and compares them with results from GLDAS simulations. The underlying causes of inconsistency between GRACE- and GLDAS-born TWS estimates are thoroughly analyzed with an aim to improve our current knowledge in monitoring global TWS change. With a comprehensive consideration of the advantages and disadvantages among GRACE- and GLDAS-born TWS anomalies, a summary is thereafter recommended as a rapid reference for scientists, end-users, and policy-makers in the practices of global TWS change research. To our best knowledge, this work is the first attempt to characterize difference and uncertainty among various GRACE-born terrestrial water storage changes over the major continents estimated by a number of international research organizations. The results can provide beneficial reference to usage of different GRACE hydrology products to study TWS changes in different regions of the world. (c) 2013 Elsevier B.V. All rights reserved.

DOI

[52]
Zhou H, Deng Z, Xia Y,et al. 2016. A new sampling method in particle filter based on Pearson correlation coefficient.Neurocomputing, 216: 208-215.Particle filters have been proven to be very effective for nonlinear/non-Gaussian systems. However, the great disadvantage of a particle filter is its particle degeneracy and sample impoverishment. An improved particle filter based on Pearson correlation coefficient (PPC) is proposed to reduce the disadvantage. The PPC is adopted to determine whether the particles are close to the true states. By resampling the particles in the prediction step, the new PF performs better than generic PF. Finally, some simulations are carried out to illustrate the effectiveness of the proposed filter.

DOI

Outlines

/