Special Issue: Geopolitical Environment Simulation on the Belt and Road Region

Dynamic monitoring the infrastructure of major ports in Sri Lanka by using multi-temporal high spatial resolution remote sensing images

  • GE Yong , 1 ,
  • CHEN Yuehong 2 ,
  • JIA Yuanxin , 1, 3, * ,
  • GUO Xian 1 ,
  • HU Shan 4
Expand
  • 1. State Key Laboratory of Resources and Environmental Information System, Institute of Geographic Sciences and Natural Resources Research, CAS, Beijing 100101, China
  • 2. School of Earth Sciences and Engineering, Hohai University, Nanjing 210098, China
  • 3. University of Chinese Academy of Sciences, Beijing 100049, China
  • 4. College of Surveying and Mapping Science and Technology, Xi’an University of Science and Technology, Xi’an 710054, China;
*Corresponding author: Jia Yuanxin (1989-), PhD Candidate, specialized in remote-sensing image processing, super-resolution mapping. E-mail:

Author: Ge Yong (1972-), Professor, specialized in spatial data analysis and data quality assessment. E-mail:

Received date: 2017-11-02

  Online published: 2018-07-20

Supported by

Key Program of Chinese Academy of Sciences, No.ZDRW-ZS-2016-6-3-4

Strategic Priority Research Program of Chinese Academy of Sciences, No.XDA20030302

Copyright

Journal of Geographical Sciences, All Rights Reserved

Abstract

Colombo port and Hambantota port in Sri Lanka play a key role in transiting and supporting the shipping trade of “the 21st-Century Maritime Silk Road”. In recent years, Chinese enterprises have made huge investments in the infrastructure construction of Colombo port and Hambantota port. The construction progress and development trend of Colombo port and Hambantota port have been attracting the attention of Chinese investment enterprises and the society. In this paper, multi-temporal high spatial resolution remote sensing images are used to monitor the infrastructure construction condition of Colombo port and Hambantota port from 2010 to 2017. According to the interpreted infrastructure information of the two ports, the international container terminal of Colombo and Hambantota port have completed their constructions. By the end of 2017, the international container terminal of Colombo built the container yards with 28.8 ha and roads with 32.6 ha. At the south of the international container terminal of Colombo, the 62.2 ha of reclamation area were built for the planned port city. In Hambantota port, 77 ha of container yards, 48 ha of roads and 2.9 ha of oil storage areas were constructed during this period. Meanwhile, the analysis of potential storage capacity of Colombo port and Hambantota port shows that the throughput of Colombo port may increase by 3 million tons per year while the throughput of Hambantota port will be over its designed 2.5 million tons per year. These analysis results are able to provide a useful reference for Chinese investment enterprises and the related research of “the Belt and Road”.

Cite this article

GE Yong , CHEN Yuehong , JIA Yuanxin , GUO Xian , HU Shan . Dynamic monitoring the infrastructure of major ports in Sri Lanka by using multi-temporal high spatial resolution remote sensing images[J]. Journal of Geographical Sciences, 2018 , 28(7) : 973 -984 . DOI: 10.1007/s11442-018-1516-7

1 Introduction

In 2013, Xi Jinping, President of China, proposed “the Silk Road Economic Belt” and “the 21st-Century Maritime Silk Road” during the state visit to Kazakhstan and Indonesia, together now referred as “the Belt and Road Initiative” (Liu, 2015; Qiu et al., 2015). Subsequently, it attracted considerable attention and gained worldwide recognition. “The Belt and Road” is a new framework of international and regional economic cooperation to promote the development of economic globalization, aiming at mutual benefit, mutual learning and win-win development within the countries along this belt (Liu, 2015). “The 21st-Century Maritime Silk Road” is planned to connect the market of ASEAN (Association of Southeast Asian Nations), South Asia, West Asia, North Africa, Europe and other major economic sectors by maritime trade and shipment, whose route will pass through Melaka Gateway port, Hambantota port, Colombo port, Gwadar port, Djibouti port and other important foreign ports. Among them, Colombo port and Hambantota port, which belong to Sri Lanka locates in Indian Ocean passage between the Middle East and East Asia, are important pivot points on “the 21st-Century Maritime Silk Road” (Lin, 2017). In recent years, the economic and trade cooperation between China and Sri Lanka has been developing rapidly, and in the meanwhile, Chinese enterprises have expanded their investment in Sri Lanka (Qiu et al., 2015; Yang and Tan, 2017). By the end of 2016, the construction contracts Chinese enterprises have signed in Sri Lanka value $18 billion in total, with the turnover of $12 billion, covering roads, railways, airports, ports and other key projects (Tang, 2015). Among them the south Colombo port container terminal project, which is the biggest Chinese investment project in Sri Lanka so far (Qi, 2017), and the Hambantota port infrastructure construction project, which values about $1.4 billion (Sun 2017), are the most key projects. The construction of Hambantota Port and Colombo Port plays a key role in transiting and supporting the shipping trade of “the 21st-Century Maritime Silk Road”, and is the focus of Chinese investment enterprises and the society.
Therefore, this article uses multi-temporal high spatial resolution remote sensing images to monitor the construction progress and development trend of Colombo port and Hambantota port from 2010 to 2017. First, we interpret infrastructure elements (including the total area of the port construction, reclamation area, container yards, oil tank yards, roads, excavated area, and supporting built-up of ports) of the Hambantota port and Colombo port in each year. Second, the total area for each infrastructure element of the two ports in each year is calculated according to the spatial distribution of the port infrastructure elements. Last, the construction speed and the potential storage capacity of the two ports in Sri Lanka are analyzed.

2 Data and method

2.1 Study area and data

Sri Lanka is located in Indian Ocean. Colombo port is situated in its west and Hambantota port in south, as shown in Figure 1a. Figure 1b presents the local details of Colombo port and Hambantota port. Colombo port is the biggest port in Sri Lanka. For a long time, the growth rate of container throughput in Colombo port is between 1% and 2% because of the civil war of Sri Lanka. On August 5, 2013, the international container terminal of Colombo, which was built by the China Merchants Group, began to use. The designed container throughput of the international container terminal of Colombo is 2,400,000 TEU (twenty-foot equivalent unit) per year. Its container throughput significantly increased from 675,000 TEU in 2014 to 2,010,000 TEU in 2016. Three years later, its container throughput has a potential that will be over 3,200,000 TEU. Hambantota port is close to the international main channel of Indian Ocean, which is only 10 nautical miles apart. Hambantota port is planned as the international transportation center by the president of Sri Lanka in 2009. This port includes two phases of construction. The first phase aims to build the 100,000-ton container terminals, oil wharfs, lighter berths and supporting facilities. The second phase will construct the 100,000-ton container berths, the 100,000-ton multi-functional berths and other facilities. The expected container throughput of Hambantota port is two million TEU per year. The expansion of Colombo port and the construction of Hambantota port will play a critical role in improving the shipping trade of Indian Ocean, and thus they can effectively promote the development of “the 21st-Century Maritime Silk Road”.
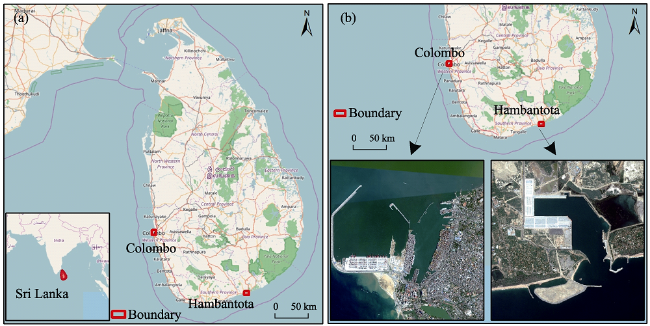
Figure 1 Study areas. (a) Spatial location of Colombo port and Hambantota port in Sri Lanka; (b) Local details of Colombo port and Hambantota port
High spatial resolution remote sensing images from 2010 to 2017 were collected for Colombo port and Hambantota port. There are several types of high spatial resolution remote sensing images, including Pleiades, WorldView-2 (WV-2), Beijing-2 (BJ-2), CNES Airbus, and Digital Globe. The acquisition time of these images was shown in Table 1.
Table 1 Information about high spatial resolution remote sensing images
Port Source of images Acquisition date
Colombo Digital Globe March 11, 2010
Digital Globe November 12, 2011
Digital Globe October 13, 2012
Digital Globe October 13, 2013
Digital Globe November 7, 2014
Digital Globe February 16, 2015
WV-2 December 22, 2015
Digital Globe April 25, 2016
BJ-2 February 3, 2017
Port Source of images Acquisition date
Hambantota Digital Globe July 26, 2010
Digital Globe May 7, 2012
CNES Airbus July 16, 2014
WV-2 October 7, 2015
BJ-2 July 19, 2016
Pleiades January 5, 2017

2.2 Method

To investigate the dynamic changes of the infrastructure construction of Colombo port and Hambantota port, three main steps were conducted, including: (1) image registration for high spatial resolution remote sensing images; (2) extraction of land cover maps and thematic maps of infrastructure elements in different years by manual interpretation; (3) change analysis for the thematic maps of the two ports. The corresponding flowchart is shown in Figure 2.
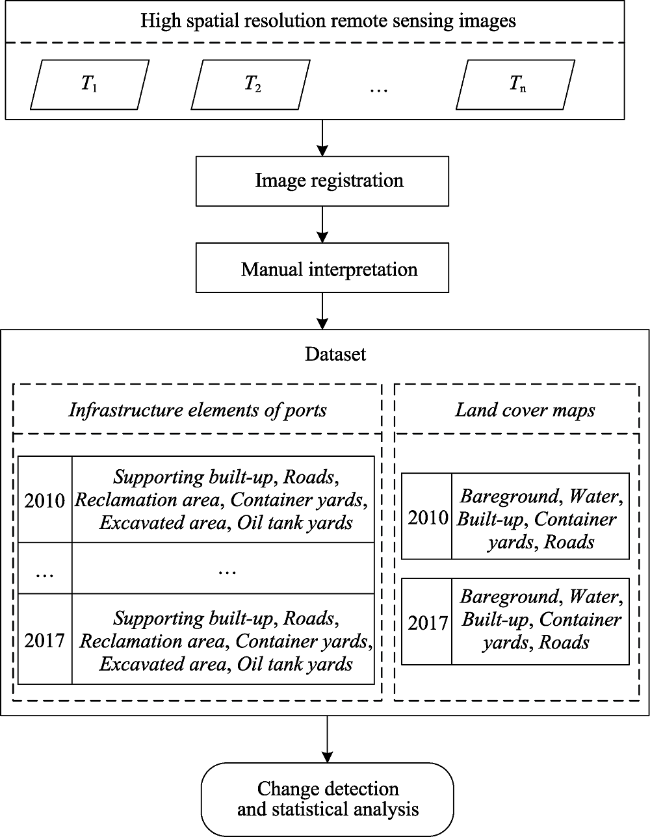
Figure 2 Flowchart of this study
(1) Image registration
Image registration is the fundamental operation in remote sensing image processing and it aims to align remote sensing images taken at different times, from different sensors (Arora, 2003; Moigne et al., 2012). For these high spatial resolution images in Colombo port and Hambantota port, image registration was conducted for each image to produce uniform images for the change analysis of infrastructure elements in the two ports. The WV-2 image taken on December 22, 2015 over Colombo port and the WV-2 image taken on October 7, 2015 over Hambantota port are used as the base images in image registration because the two WV-2 images are spatially consistent with the two ports well. Taking the WV-2 image as base image, image registration was performed in ArcMap 10.2 by selecting control points for each image to align it with the base image and the total registration error met the demand which is less than a half of the pixel size.
(2) Manual interpretation
Based on aligned remote sensing images in each port, the land cover maps in 2010 and 2017 were produced by manual interpretation to compare the land cover changes during this period. Meanwhile, the infrastructure elements of the two ports were obtained by manual interpretation for each year to present the gradual changes of infrastructure construction. During the manual interpretation, the base state with amendments model was chosen to produce the thematic maps for each year (Hu et al. 2015). That is to say, the thematic maps of land cover and infrastructure elements in 2010 were first delineated; and then, the thematic maps in last phase were modified to generate the thematic maps in next phase by comparing the changes of remote sensing images between two phases. When interpretation operation was performing, five land cover classes of bareground, water, built-up, container yards and roads were interpreted for Colombo port in 2010 and 2017 while seven land cover classes of oil tank yards, bareground, built-up, vegetation, water, container yards and roads were considered for Hambantota port. When interpreting the infrastructure elements of the two ports, four classes of supporting built-up, container yards, roads and reclamation area were considered in Colombo port whereas six classes of oil tank yards, supporting built-up, reclamation area, container yards, roads and excavated area were obtained for Hambantota port.
(3) Change analysis for the infrastructure construction of the two ports
Using the interpreted thematic maps of land cover and infrastructure elements, the total area of each class in each phase was first calculated. Then, the land cover change between 2010 and 2017 was analyzed according to the total area of each class in land cover maps. Last, the annual area changes of infrastructure elements of the two ports were calculated to evaluate the construction speed of infrastructures in the two ports.

3 Experimental results

The thematic maps of land cover and infrastructure elements for Colombo port and Hambantota port were first obtained, and then, the annual area of each element was calculated to investigate its changes.

3.1 Thematic maps of Colombo port

The land cover maps (including five classes of bareground, water, built-up, container yards and roads) of Colombo port in 2010 and 2017 were interpreted in Figures 3a and 3b, respectively. It can be seen from Figure 3 that there are lots of land cover changes in Colombo port between 2010 and 2017. Specifically, many new infrastructures were built in the western part of the port during this period. Some new jetties were built in the western part of the port and a new container yard was built on the reclamation area within the harbor of the port. There is also a large reclamation area at the south of the new container yard in 2017. From 2010 to 2017, the total areas of roads, container yards, built-up and bareground increased from 36.3 ha, 48.2 ha, 510.8 ha and 44.4 ha to 75.7 ha, 77.0 ha, 584.5 ha and 86.0 ha, respectively. These striking new infrastructures of Colombo port are mainly due to the foreign investments after the civil war of Sri Lanka in 2009 (Tang, 2015). For example, Chinese enterprises invested about $13 billion in the south Colombo port container terminal project. The planned construction area of this project is about 5.3 million m2, including the reclamation area of 276 ha.
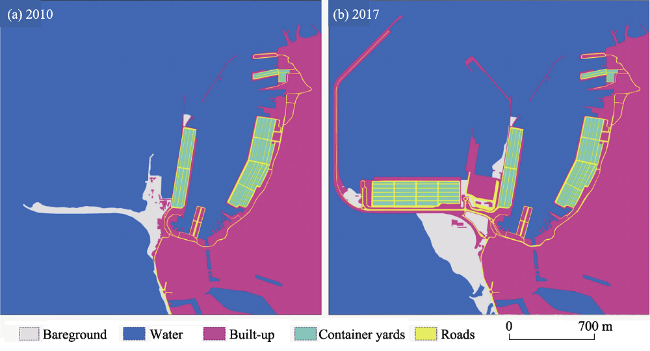
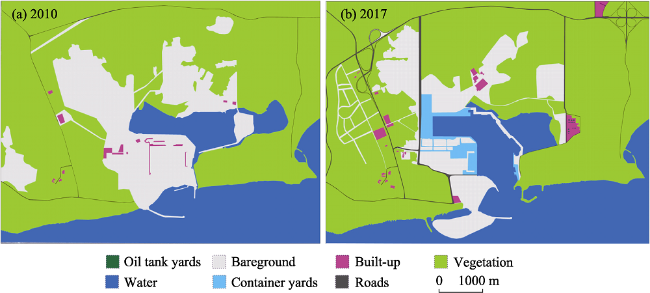
Figure 3 Land cover maps of Colombo port in 2010 (a) and 2017 (b)
Figure 4 presents the infrastructure elements (i.e., container yards, roads, reclamation area and supporting built-up of Colombo port) in different periods between 2010 to 2017. Table 2 reports the total area of each infrastructure element of Colombo port for each year. It can be observed from Figure 4 that the infrastructure construction of Colombo port mainly occurred in the period between 2010 to 2014. The first phase of reclaiming land from sea was from 2010 to 2012 and the total area of reclamation area increased from 16 ha to 44.5 ha, as shown in Figures 4a-4c and Table 2. The second phase of reclaiming land from sea was between 2014 to 2015. These reclamation areas were built for jetty and container yards. The new container yard at the west part of the port was built from 2012 to 2014 and the total area of container yards increased by 28.8 ha during this period. The total area of these supporting built-up has been extended by 65.1 ha from 2010 to 2013. The total area of roads increased by 32.6 ha from 2010 to 2014. It should be noted here that the infrastructure construction of Colombo port was stopped by Sri Lanka government from 2015 to early 2016, therefore, the change of the construction was slight from 2014 to 2017. Fortunately, the project was restarted from mid-2016, the construction speed would be quick when the reclamation area at the south of the new container yard was completed.
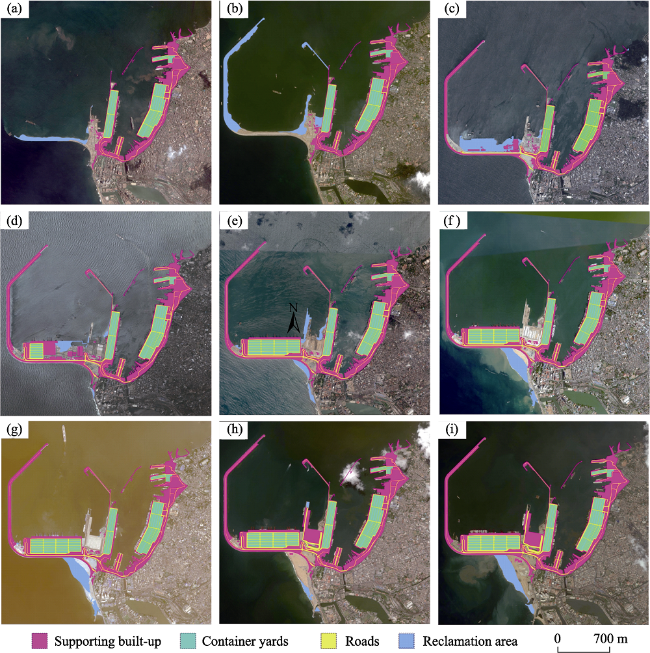
Figure 4 Infrastructure elements of Colombo port in 2010 (a), 2011 (b), 2012 (c), 2013 (d), 2014 (e), 2015 (February) (f), 2015 (December) (g), 2016 (h), and 2017 (i)
Table 2 Area of infrastructure elements of Colombo port (ha)
Element 2010 2011 2012 2013 2014 2015
(February)
2015
(December)
2016 2017
Supporting built-up 102.9 103.5 146.2 168.0 157.1 157.4 157.4 176.0 176.6
Reclamation area 16.0 53.8 44.5 20.5 21.3 28.9 28.9 5.7 27.6
Container yards 48.2 48.2 48.2 55.4 77.0 77.0 77.0 77.0 77.0
Roads 36.3 36.3 47.1 54.4 68.9 69.0 69.0 75.7 75.7

3.2 Thematic maps of Hambantota port

Figures 5a and 5b show the land cover maps of Hambantota port in 2010 and 2017, respectively. There are seven classes in the two land cover maps, including oil tank yards, bareground, built-up, vegetation, water, container yards and roads. It can be found from Figure 5 that the land cover change between 2010 and 2017 is rapid in Hambantota port. Due to the infrastructure construction of the port, container yards and supporting built-up were converted from vegetation or bareground. Meanwhile, the class of roads expanded greatly and reclamation areas appeared in the southern part of the port and the central right part (Figure 5). The total areas of container yards and oil tank yards increased by 77.6 ha and 2.9 ha, respectively. The total areas of roads, and supporting built-up increased from 16.5 ha to 84.1 ha and from 16.8 ha to 44.7 ha, respectively.
Figure 5 Land cover maps of Hambantota port in 2010 (a) and 2017 (b)
To investigate the change condition of each infrastructure element of the port from 2010 to 2017, the oil tank yards, supporting built-up of ports, reclamation area, container yards, roads and excavated area were extracted from each high spatial resolution remote sensing image in Figure 6 and the total area of each element was calculated for each year in Table 3. It can be observed from Figure 6 and Table 3 that the classes of roads, container yards and supporting built-up gradually increased from 2010 to 2017. Before 2014, the area of roads increased faster than that after 2014, as shown in Figure 6 and Table 3, especially in the northern part. The reason is that widening old roads and paving new roads are prerequisite for the port construction. At the central right part of the port, the reclamation area in 2010 was converted into supporting built-up in 2012 and the oil tank yards were also built in this area in 2012. At the center part, some bareground or reclamation areas were gradually converted into container yards of the port. At the same time, some temporary bareground or reclamation areas in the central part were gradually removed to build the channel of the port from 2010 to 2017. Especially, the two large bareground areas marked by yellow polygons in 2012 and 2016 were removed for building the channel of the port in 2017. According to Table 3, the total built-up area of Hambantota port increased from about 31 ha in 2010 to about 210 ha in 2017.
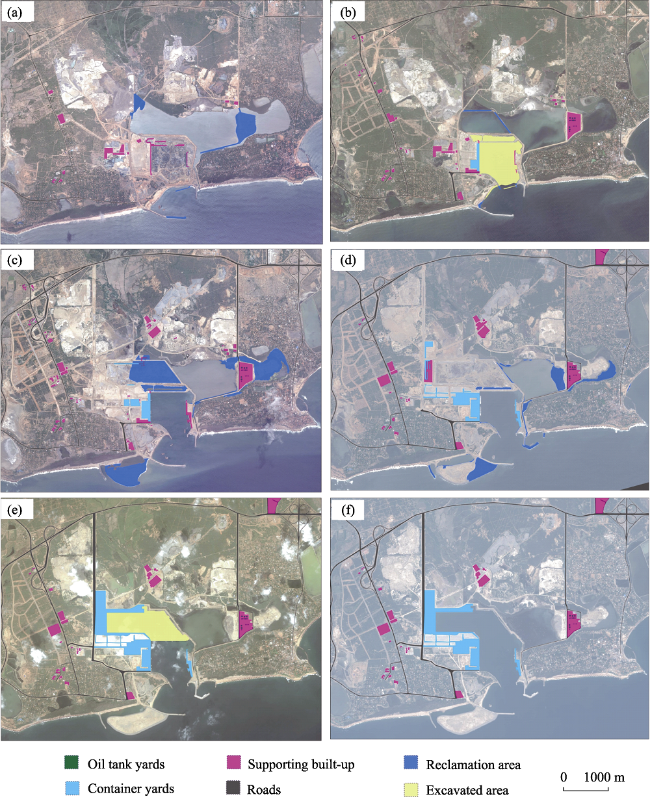
Figure 6 Infrastructure elements of Hambantota port in 2010 (a), 2012 (b), 2014 (c), 2015 (d), 2016 (e), and 2017 (f)
Table 3 Area of infrastructure elements of Hambantota port (ha)
Element 2010 2012 2014 2015 2016 2017
Oil tank yards 0.00 2.88 2.88 2.88 2.88 2.88
Supporting built-up 13.87 27.09 39.03 51.88 44.68 44.68
Reclamation area 39.72 39.72 4.96 147.21 60.83 0.00
Container yards 0.63 6.76 16.76 38.54 77.60 77.60
Roads 16.56 37.14 64.16 64.26 84.06 84.06
Excavated area 0.00 0.00 96.49 0.00 94.21 0.00

4 Discussion

4.1 The construction speed of Colombo port and Hambantota port

The infrastructure construction of Colombo port was mainly implemented during the period from 2010 to 2014 because the construction project was stopped for more than one year from early 2015. It can be found from Table 2 that the yearly construction area of Colombo port is about 17 ha. The yearly construction speed from 2010 to 2014 is more than 24 ha and it is faster than the speed from 2016 to 2017. The construction between 2010 to 2014 concentrated on reclaiming land from sea for the jetty and the new container yard at the west part of the port. The construction from 2016 would focus on the south of the new container terminal. In 2017, this area was reclaiming land from sea and the construction of this area would speed up when the reclamation project is completed.
From 2010 to 2017, there are two construction phases of Hambantota port. At early stage of this period, it concentrates on the construction preparation of the port by building reclamation areas and paving roads. In the late stage of this period, it mainly focuses on the construction of container yards, supporting built-up of the port and excavated area for building the channel of the port. It can be seen from Table 3 that the annual construction area of Hambantota port is about 25.6 ha. Although the construction speed of Hambantota port is fast and many infrastructures of the port have been built, there is a lack of various supporting facilities for the port, e.g. platform of container handling crane and various logistics equipment.

4.2 Analysis of potential storage capacity of the two ports

In 2011, the throughput of Colombo port is nearly 62 million tons and the growth rate of throughput is about 10% (Wang, 2016). There are 13 berths in Colombo port and the length of berth line is more than 4000 m in 2011. After the extension of Colombo port from 2010, the port added a new container yard at its western part in 2017 and the area of the new container yard is about a half of the total area of old container yards, as shown in Figure 4. The potential throughput of Colombo port may increase by 3 million tons per year if the new container yard and related supporting facilities were finished to increase its storage and distributing capacity.
Compared with Colombo port, Hambantota port is a relatively new one. In 2017, the infrastructure construction of Hambantota port at its western part almost finished, as shown in Figure 6. There are five berths and the length of berth line is about 1000 m in 2017. The predicted throughput of Hambantota port is about or over 2.5 million tons if these storages and distributing facilities of Hambantota port in 2017 were successfully used (CCCC-FHDI Engineering Co., 2010).
Colombo port and Hambantota port are planned to be developed as the internationally famous transit port (Lin, 2017). Although these two ports have improved their infrastructures, there are some planned storage projects needed to be built in future to increase their throughput. For example, the port city of Colombo port stopped its construction from 2015 to 2016 and the port city includes various facilities of the port trade and transportation, such as container yards and berths. Meanwhile, Hambantota port can be further extended and the planned construction area of container yards is about three times of its current area of container yards according to its comprehensive planning. Therefore, the throughput of the two ports may significantly increase in future so as to benefit from the shipping trade of “the 21st-Century Maritime Silk Road”.

4.3 Suggestions for development of the two ports

Port Hambantota is located 10 nautical miles away from Main International Maritime Channel. Nevertheless, the best developing path for Hambantota port is International Transfer Port due to its weak industrial foundation and constraints of Colombo South Port (Wang and Xi, 2016). Considering the current established construction in Hambantota, it has been equipped with relatively mature port storage and transportation facilities with absence of corresponding ancillary facilities. From the perspective of development outlook, the port should strive to develop supporting facilities, for instance, shipping repairs and supply service, storage and transfer service and commerce to attract international shipment, taking advantage of Main International Maritime Channel.
The completion of Colombo South Port enables it avert the imbalance between port storage and transportation capacity and commodity demand (Yuan, 2017). In addition, the Sri Lankan government’s jointly sea port city project has entered the stage of reclaiming land from the sea. A combination of commercial, housing and business in the Central Business District would be formed in 20 years. According to the released development strategy, Colombo South Port is sure to provide consolidated support for “The Belt and the Road Initiative”.

5 Conclusions

“The Belt and Road Initiative” aims to promote international and regional economic cooperation between countries along “the Belt and Road”. Colombo port and Hambantota port in Sri Lanka are two key nodes in transiting and supporting the shipping trade of “the 21st-Century Maritime Silk Road”. This paper presents a study to dynamically monitor the infrastructure construction condition of Colombo port and Hambantota port by using multi-temporal high spatial resolution remote sensing images from 2010 to 2017. The interpreted infrastructure information of the two ports shows that the international container terminal of Colombo and Hambantota port have completed by the end of 2017. The international container terminal of Colombo built the container yards with 28.8 ha and roads with 32.6 ha between 2010 and 2013. Meanwhile, 62.2 ha of reclamation areas are built from 2013 to 2016 for the port city. Moreover, 77 ha of container yards, 48 ha of roads and 2.9 ha of oil storage areas are constructed for Hambantota port from 2010 to 2017. The potential storage capacity of the two ports is predicted that the throughput of Colombo port may increase by 3 million tons per year while the throughput of Hambantota port will be over its designed 2.5 million tons per year. These analysis results provide a useful reference for Chinese investment enterprises and the related research of “the Belt and Road”. The multi-temporal high resolution remote sensing imageries are used to monitor the construction condition of Colombo port and Hambantota port. In the future, we will extend this study to monitor the water depth around the two ports as water depth of ports plays a key role in docking of cargo ships.

The authors have declared that no competing interests exist.

[1]
Arora M K, 2003. Mutual information-based image registration for remote sensing data.International Journal of Remote Sensing, 24: 3701-3706.Registration is a fundamental operation in image processing to align images taken at different times, from different sensors or from different viewing angles. Automatic image registration procedures are gaining importance to efficiently register the large volumes of remote sensing data available these days. In this Letter, we investigate an automated mutual information-based registration technique for remote sensing data. The performance of a number of interpolation algorithms to compute mutual information for registration of multi-sensor and multi-resolution Landsat TM, Radarsat SAR and IRS PAN images is evaluated.

DOI

[2]
CCCC-FHDI Engineering Co. 2010. Feasibility study for Hambantota port development project (Phase II). In: L. CCCC-FHDI Engineering Co. (Ed.). Guangzhou.

[3]
Hu Y, Wu H, Zhu H, 2015. The application of base state with amendments model in land survey data management.Communications in Computer & Information Science, 482: 715-723.With the launch of the first and second national land surveys, it has obtained the massive historical data of land survey. However, the key condition is how to manage the mass land survey data effectively. In accordance with these problems that the current base state amendments model exists high data redundancy and low history backtracking, based on the analysis on the strengths and weaknesses of existing base state amending model, combining the characteristics of changing trivially in land survey data, this paper puts forward a new base state with amendments model which is suitable for land survey data management. The model changes the general base state as a snapshot storage mode, only stores the initial base state of the file, reducing the amount of data storage; It dynamically establishes base state and improves the retrieval efficiency. The application results show that the improved model can save, manage and backtrack land survey data with low redundancy and high efficiency.

DOI

[4]
Lin M, 2017. The Belt and Road in South Asia: Position, progress and prospect.Contemporary World and Socialism, 154-162. (in Chinese)

[5]
Liu W D, 2015. Scientific understanding of the Belt and Road Initiative of China and related research themes.Progress in Geography, 34: 538-544. (in Chinese)The Belt and Road Initiative here the "Belt" stands for the Silk Road Economic Belt and the "Road" stands for the 21 st Century Maritime Silk Road s a call of China for new modes of regional economic cooperation under the trend of development of economic globalization. It targets at promoting orderly and free flow of economic factors, efficient allocation of resources, and deep integration of markets; enabling the countries along the Belt and Road to achieve economic policy coordination and carry out broader, deeper, and more efficient economic cooperation; and jointly building an open, inclusive, and balanced regional economic cooperation architecture. Thus the Belt and Road Initiative is an alternative road to further economic globalization, but contains ideas that are different from the past, that is, the spirit of the Silk Road "peace and cooperation, openness and inclusiveness, mutual learning and win-win." Based on such an understanding, this article first analyzes the general background of the Belt and Road Initiative against economic globalization and the changing configurations of the world, and then discusses the Initiative's spatial connotation by revealing its multi-scalar and transscalar characteristics. The article points out that the Belt and Road Initiative is a national strategy, rather than a regional strategy, to coordinate all-around opening of China to the world and promote further integration of the country into the global economy. Last, the article suggests several research themes in geography that are brought about by the Belt and Road Initiative, including geopolitical studies, geography of countries of the region to explore cooperation opportunities, foreign direct investment theories advanced by the Belt and Road Initiative, and optimization of transcontinental transportation.

[6]
Moigne J L, Netanyahu N S, Eastman R D, 2012. Image Registration for Remote Sensing. UK: Cambridge University Press.

[7]
Qi L, 2017. The Belt and Road Initiative leads the cooperation of China-Sri Lanka upgraded.China’s Foreign Trade, 17-20. (in Chinese)

[8]
Qiu H, Liu N, Wei Y,et al. 2015. Building China-Sri Lanka science & education cooperation center under the Belt and Road Initiative.Bulletin of Chinese Academy of Sciences, 30(421-425): 280. (in Chinese)

[9]
Sun Y, 2017. Study on China’s investment strategy and infrastructure construction for Belt and Road countries: Case study for Sri Lanka Hambantota Port.China Journal of Commerce, 53-54. (in Chinese)

[10]
Tang P, 2015. Political and economic risks in implementing the OBAOR: China’s investment in Sri Lanka. South Asian Studies Quarterly, 102-106: 106. (in Chinese)

[11]
Wang F, 2016. Research on General Layout for Hambantota Port Development Project (Phase II). In: Dalian University of Technology.

[12]
Wang J, Xi F, 2016. Hanbatuota Port: The pivot of Maritime Silk Road.China Ports, (1): 58-59. (in Chinese)

[13]
Yang Y, Tan S, 2017. Overall external expansion pattern of the Belt and Road.Journal of South China Normal University (Social Science Edition#): 1-5. (in Chinese)

[14]
Yuan J, 2017. Sea reclamation, Chinese enterprises built new town for Colombo Port. China Daily. (in Chinese)

Outlines

/