Special Issue: Geopolitical Environment Simulation on the Belt and Road Region

Maritime network dynamics before and after international events

  • FANG Zhixiang , 1, 3 ,
  • YU Hongchu , 1, * ,
  • LU Feng 2 ,
  • FENG Mingxiang 1 ,
  • HUANG Meng 1
Expand
  • 1. State Key Laboratory of Information Engineering in Surveying, Mapping and Remote Sensing, Wuhan University, Wuhan 430079, China
  • 2. State Key Laboratory of Resources and Environmental Information System, Institute of Geographic Sciences and Natural Resources Research, CAS, Beijing 100101, China
  • 3. Collaborative Innovation Center of Geospatial Technology, Wuhan 430079, China
*Corresponding author: Yu Hongchu (1990-), PhD Candidate, specializing in spatiotemporal data analysis in maritime transportation. E-mail:

Author: Fang Zhixiang (1977-), Professor, specializing in transport geography, human behavior modeling, space-time GIS and intelligent navigation. E-mail:

Received date: 2017-10-17

  Online published: 2018-07-20

Supported by

Key Project of the Chinese Academy of Sciences, No.ZDRW-ZS-2016-6-3

The National Key Research and Development Program of China, No.2017YFB0503802

National Natural Science Foundation of China, No.40971233, No.41771473

LIESMARS Special Research Funding

Copyright

Journal of Geographical Sciences, All Rights Reserved

Abstract

Investigating the influence of international events on global maritime networks is a challenging task that must comprehensively incorporate geographical, political, and maritime sciences. Understanding global maritime network dynamics is an initial and critical step in this investigation. This study proposes an automatic identification system (AIS)-based approach to understanding maritime network dynamics before and after international events. In this approach, a spatiotemporal modeling method is introduced to measure the similarity in shipping trends before and after international events. Then, a spatiotemporal analytic framework is proposed to understand the maritime network dynamics by grouping similar situation, and assessing possible indirect effects within a network. Finally, three case studies of international events, military conflict, lifted economic sanctions, and government elections, were used to investigate the observed network dynamics possibly affected by international events. The results indicate that container, tanker, and bulk shipping between India and its connected countries all declined more than 69% after military conflicts between India and Pakistan in August 2015. Tanker shipping between Iran and the United Arab Emirates increased 51% after economic sanctions on Iran were lifted. Container shipping between Sri Lanka and Singapore, Malaysia, and India increased more than 74% after the general election in Sri Lanka. These investigations demonstrate the feasibility of the proposed approach in assessing the possible effects of international events on maritime network dynamics.

Cite this article

FANG Zhixiang , YU Hongchu , LU Feng , FENG Mingxiang , HUANG Meng . Maritime network dynamics before and after international events[J]. Journal of Geographical Sciences, 2018 , 28(7) : 937 -956 . DOI: 10.1007/s11442-018-1514-9

1 Introduction

Understanding network dynamics is a challenge in physics, geography, economics, and network sciences. The maritime network, one of the most important networks in international trade, acts as a fundamental transportation mode for strategic goods and materials critical to economic development worldwide. A better understanding of maritime network dynamics would help evaluate the potential implications of international events; this would be an asset to policy makers designing effective national strategies, including for investing, developing regional relationships, optimizing the global maritime logistics network, and even improving national competition.
Previous researches on maritime networks focused on structure, flows, maritime transportation efficiency, and maritime safety (see Table 1). The few studies that have researched dynamic properties of maritime networks include the changing hierarchies of ports (Ducruet and Notteboom, 2012), multiplex network dynamics of maritime flows (Ducruet, 2017), and co-evolutionary dynamics of ports and cities in the global maritime network (Ducruet, 2016). These efforts help us understand the hierarchical structure, regional characteristics, and several dynamics properties in regional or global maritime networks. In addition, some studies have explained international events from the perspectives of international relations (King and Zeng, 2001), economics, and finance (MacKinlay, 1997). Some work has evaluated the influence of these international events, for example, Schinas and Westarp (2017) assessed the impact of the Maritime Silk Road on existing maritime liner services. However, a large gap remains in our understanding of maritime network dynamics effected by international events between countries, such as military conflicts, economic sanctions, and government elections.
Table 1 Summary of research on maritime networks
Research category Research contents
Structure and dynamics Spatial structure (Xu et al., 2015); regional dynamics (Ducruet and Notteboom 2012; ; Yu et al., 2017); time dynamics (Ducruet, 2016); spatial heterogeneity (Liu et al., 2017; Li et al., 2016); reachability (Li et al., 2014b), and local strength and global weakness (Ducruet et al., 2009).
Network and flows Network diversity and maritime flows (Ducruet, 2013; Dinwoodie et al., 2013); statistical properties, including distribution extent, correlations, weight distribution, strength distribution, average shortest path length, line length distribution, and centrality measures (Hu and Zhu, 2009; Fugazza, 2017); centrality and vulnerability (Laxe et al., 2012; Viljoen and Joubert, 2016; Wu et al., 2017; Wang et al., 2016); connectivity and complexity (Jiang et al., 2015; Tian et al., 2007; Liu and Hu et al., 2017); inequality (Xu et al., 2015a); and evaluations of robustness (Peng et al., 2017).
Maritime transport
and efficiency
Direct port-to-port service, hub, and spoke networks (Fremont, 2007; Wang and Wang, 2011); maritime economics (Stopford, 2009); logistics (Rodrigue and Browne, 2002; Song and Lee, 2009; Davarzani et al., 2016); transportation (Guerrero and Rodrigue, 2014; Gagatsi et al., 2017); transport network design (Angeloudis et al., 2015; Karsten et al., 2017) and their network efficiency (Song et al., 2005; Tai and Hwang, 2005; Zeng and Yang, 2002; Fahmiasari and Parikesit, 2017); intermediacy (Rodrigue, 2017); maritime transport chain choice (Talley and Ng, 2013; Lam and Yam, 2011) and interactions (Knappett et al., 2008); and oligopolistic and competitive carrier behavior (Lee et al., 2012).
Maritime safety Risk (Akhtar and Utne, 2014; Lam et al., 2014a); safety (Hänninen et al., 2014); and maritime search and rescue operations (Bezgodov and Esin, 2014a)
This study proposes a spatiotemporal analysis approach to understand maritime network dynamics before and after international events. A global tracking dataset of ships collected through the automatic identification system (AIS) (Høye et al., 2008) is used to demonstrate the feasibility of the proposed approach. The AIS is designed to exchange information between ships or ship and shore facilities, including vessel real-time location, speed, and course information. The AIS data can be used to derive the time-varying global maritime network automatically by recovering ship trajectories. The proposed approach is summarized as follows:
Spatiotemporal modeling method is proposed to measure the similarity in shipping trend curves before and after international events. The curves for any link in the maritime network are divided into crests and troughs to find the same trend between two lines. Similarity is measured by integrating the total time of parallel trends and minimum crossing area between curves. This method identifies similar dynamics in terms of voyage number or tonnage between any two maritime network nodes.
A spatiotemporal analytic framework is used to model the maritime network dynamics. The maritime network dynamics are derived from AIS data to determine the potential effects of international events based on measured similarity, for example, the affected link within the network and possible indirect effect on dynamics.
Three international event scenarios, i.e., military conflict, and government election, were used to investigate the possible effect of international events on maritime network dynamics. The results demonstrate that the proposed framework is feasible and useful to help evaluate this effect.
The remainder of this paper is organized as follows. Section 2 reviews the literature describing the spatiotemporal dynamics of maritime networks. Section 3 describes the proposed spatiotemporal approach for understanding maritime network dynamics before and after international events. Section 4 introduces the case studies and discusses the possible effects of these international events.

2 Literature review

The spatiotemporal dynamics of maritime networks are reviewed from the perspectives of flow and spatial structure, regional dynamics, time and behavior dynamics.
In terms of flow and spatial structure, various researches have described the hub-and-spoke structure in the Atlantic container shipping system (Ducruet et al., 2010), maritime cluster organization (Viederyte, 2013), coastal maritime clusters (Doloreux et al., 2016), regional maritime connectivity (Mohamed-Chérif and Ducruet, 2016), multilayer dynamics of complex spatial networks in global maritime flows (Ducruet, 2017), transshipment hub flows and gateway flows (Ducruet and Notteboom, 2012), maritime oil freight flows (Dinwoodie et al., 2013), seasonal characteristics of maritime traffic (Campana et al., 2017), and collaborative maritime transportation (Silva, 2013). These studies provide context for the structure and flow characteristics of maritime networks. However, the characteristics of maritime network dynamics affected by international events remain an open research topic in this area.
In terms of regional dynamics, Guerrero and Rodrigue (2014) suggested that there were five main successive waves of containerization in the maritime network and indicated a shift from advanced economies to developing economies in some regions, i.e., East Asia and South America. van Leeuwen (2015) discussed the polycentric governance system dynamics in the European Union. Xu et al. (2015) investigated the evolution of regional inequality in the global shipping network. These dynamics analyses could reveal the changing regional role in maritime networks. However, few studies have focused on identifying regional dynamics effects in maritime networks in response to international events.
In terms of time dynamics, a recent book Maritime Network Spatial Structures and Time Dynamics edited by Ducruet (2016) comprehensively reviewed the geo-history of maritime networks, past maritime network modeling, maritime network monitoring, time considerations in complex maritime networks, and progress in the regional development of maritime studies, and co-evolutionary dynamics of port and cities in the global maritime network. These prior studies have provided some time characteristics of maritime network dynamics. However, a time-series analysis approach is required to understand the time-dependent effects of local changes on links in regional maritime networks to reveal the effects on nodes or countries in regional or global maritime networks. This approach would enable logical decisions for international strategies to improve economic development and national relationships.
Finally, recent works have focused on behavior dynamics in the maritime network, such as the oligopolistic and competitive behavior of carriers in maritime freight transportation networks (Lee et al., 2012), port choice behavior (Kim, 2014), cooperative carrier behavior (Lee et al., 2014), and anomaly behavior (Lei, 2016). Castaldo et al. (2015) used Bayesian techniques to focus on micro-level dynamics and the effect of micro behaviors on dynamics in the global maritime network.
In summary, investigating the effect of international events on the spatiotemporal dynamics of maritime network remains a relatively unexplored research topic. This study proposes a spatiotemporal analysis approach to understand maritime network dynamics before and after international events. We think that this work will be helpful for national strategies that address the effects of international events on maritime network dynamics.

3 Methodology

3.1 Overview of the proposed analytic framework

Figure 1 provides an overview of the proposed analytic framework to understand maritime network dynamics before and after international events. This framework integrates port location data and AIS trajectory data to build a global or regional maritime network, which can be derived from origins and destinations between countries. Second, the time an international event occurs is used to separate the AIS trajectory dataset and construct the before-event and after-event networks. The spatiotemporal trend curves for each link in the before- and after-event networks are generated to identify similar spatiotemporal changes between countries. Third, this framework constructs a subnetwork with similar spatiotemporal changes by grouping countries with similar changes. Finally, this framework evaluates the possible effects of international events on the maritime network by comparing the possible affected countries and their connected countries. Detailed descriptions of these steps are given in the following subsections.
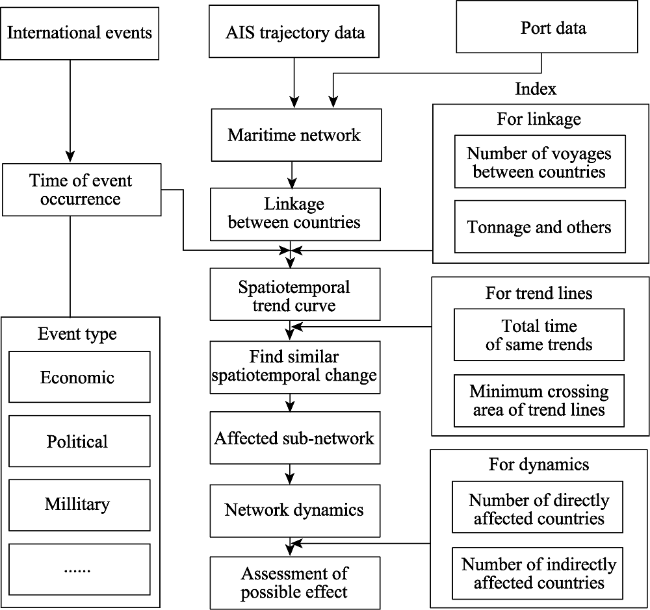
Figure 1 Proposed analytic framework

3.2 Building the maritime network

The time-varying maritime network was constructed using AIS data. The raw AIS data content was introduced by Fiorini et al. (2016), which includes vessel identification (MMSI, Maritime Mobile Service Identity), navigation status (at anchor, under way using engines, or not under command), rate of turn, ground speed, position accuracy, longitude and latitude, ground course, true heading, and time stamps. The AIS transmitter sends additional information, such as IMO (International Maritime Organization) ship identification number, international radio call sign, vessel name, type of ship/cargo, ship dimensions, type of positioning system, ship draught, destination, and estimated time of arrival at destination via the AIS system. Among them, the longitude and latitude information in each raw data entry represents the vessel location, as the AIS points for ships 1 and 2 plotted in Figure 2a. Therefore, the time-series locations of this vessel between ports could be viewed as the vessel trajectory. For example, there are some trajectories between ports AB, BC, DC, DE, and EA for ship 1, and between ports AC, CB, BE, BD, DE, and AE for ship 2. Therefore, a time-varying maritime network between ports is created by connecting each port pair in trajectories as links within any time period unit, such as day, month, season, year, or multiple years. Each link includes attributes, such as voyage number and tonnage, where the voyage number represents the total number of times vessels voyage between two linked ports. For example, numbers 1 or 2 is plotted near the links in Figure 2b. The next step is to combine ports in a country to construct country-based maritime networks. For example, Figure 2c shows the maritime network between countries. Here, the time-varying maritime network between countries is constructed using the month time unit because this study explores the network dynamics before and after international events within several years.
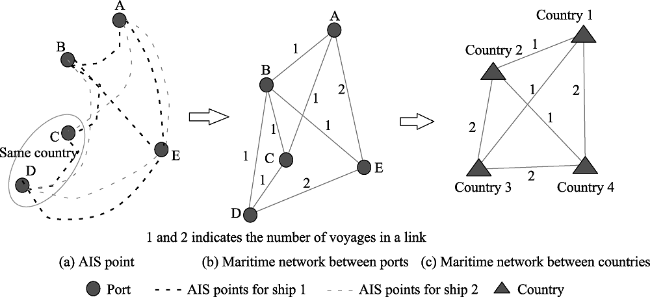
Figure 2 Constructing maritime network from AIS data

3.3 Measuring trend similarities between links

Before measuring trend similarities between links in a maritime network, trend curves need to be fitted. There are two popular methods for fitting curves: the multivariate locally polynomial fitting approach (LOESS) (Cleveland et al., 1988) and autoregressive moving average (ARMA) models (Box et al., 1976). LOESS is a very popular local regression method with favorable statistical and computational properties. It combines the simplicity of traditional linear regression and flexibility of non-linear regression. The primary advantage is that determining a predefined regression function is not required for any data, but the drawback is the intensive computation. The ARMA model is a widely used forecast approach for fitting time-series data using discrete-time filtering methods, which provides a parsimonious description of a (weakly) stationary stochastic process in terms of two polynomials, one for the autoregression and another for the moving average. The ARMA model is parameter-dependent, and adjusting parameters for any unknown maritime network is challenging. Therefore, this study uses the LOESS model to generate fitting curves for the time-series link attributes; for example, curve parts a and b are trend curves before and after Event A in Figure 3a. If a link has m statistical variants {v1, vz, …, vm}, it creates m corresponding trend curves {c1, cz, …, cm}.
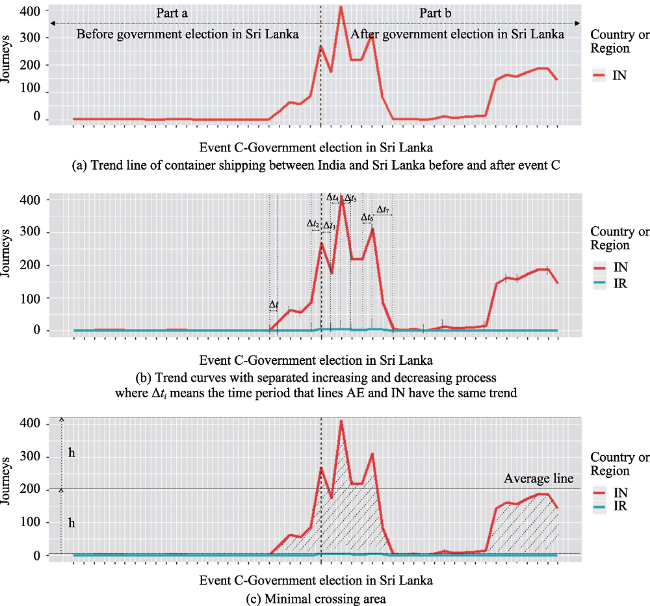
Figure 3 Indicators used to find similar spatiotemporal trend curves
The similarity of the trends for variant vj (i.e., voyage number or tonnage) is defined by two indicators: the total time for the same trends and the minimum crossing area between curves. Figure 3b illustrates the segment divisions for curves 1 and 2 based on curve crest or trough. Each segment monotonically increases, decreases, or remains unchanged in trend. Therefore, the total time of the same trends (t) for vj (see Figure 3b) is defined as:
$t_{{}}^{j}=\Delta {{t}_{1}}+\Delta {{t}_{2}}+\Delta {{t}_{3}}+\cdot \cdot \cdot +\Delta {{t}_{i}}+\Delta {{t}_{i+1}}+\Delta {{t}_{i+2}}+\cdot \cdot \cdot +\Delta {{t}_{n}}=\sum\limits_{i\le n}{\Delta {{t}_{i}}}$ (1)
where $\Delta {{t}_{i}}$ is the time span when the two curves have the same trend, monotonically increasing, decreasing, or unchanging.
The second indicator is the minimum crossing area between curves. Figure 3c shows the crossing area between curves, which is calculated as:
$\Delta A_{1,2}^{j}=\int_{t={{t}_{0}}}^{t={{t}_{1}}}{(f(c_{1}^{j},t)-f(c_{2}^{j},t))dt=}\sum\limits_{t={{t}_{0}}}^{t={{t}_{1}}}{\{f(c_{1}^{j},t)-f(c_{2}^{j},t)}\}\Delta t$ (2)
where $f(c_{1}^{j},t)$ and $f(c_{2}^{j},t)$ are the functions for curves $c_{1}^{j}$ and $c_{2}^{j},$respectively. The values t0 and t1 are the start and end times in the analysis task.
Here, one curve (see curve IR in Figure 3c) is moved to find the minimum crossing area. Determining the moving distance for a curve is critical for finding this minimum crossing area. In this study, a binary search strategy is used to solve the problem. The “average line” in Figure 3c represents the line where y is the average value of all points in the curve. Curve IR is moved by aligning the average lines of the two curves. Once moved, the curves can be used to find the upper and lower limits for each. The maximum moving distance for curve IR is h. Then, equation (2) is used to calculate the crossing area between curves IN and IR while moving curve IR distance Δh from the average line. The binary search strategy first calculates the crossing areas for Δh=0, h/2, h. Then, if the minimum area is located at Δh=0, the next search will use the parameters Δh=0, h/4, h/2. If the minimal area is located atΔh=0, h/2, the next search will use the parameters Δh=0, h/4, h/2, 3h/4. If the minimum area is located at Δh=h, the next search will use the parameters Δh=h/2, 3h/4, h. This search process isrepeated when the search meets the requirement of a predefined minimum value of variant y. Such a strategy finds the minimum crossing area by comparing the minimum values from the average line to the upper and lower limits.
The similarity index for variable vj in two links l1, l2 is defined based on the following rule:if the trend curves for variable vj in these two links has longer t j and smaller$\Delta A_{1,2}^{j},$ they aremore similar. To reflect the effect of t j and $\Delta A_{\text{ }1,2}^{\text{ }j}$ on a single similarity index, we normalizetheir values to (0, 1) and the similarity of two links is measured as follows:
$sim({{v}_{j}},{{l}_{1}},{{l}_{2}})=\frac{N({{t}^{j}})}{N(\Delta A_{1,2}^{j})}$ (3)
$N({{t}^{j}})=\frac{{{t}^{j}}}{{{t}_{1}}-{{t}_{0}}}$ (4)
$N(\Delta A_{1,2}^{j})=\frac{\Delta A_{1,2}^{j}}{\max (\Delta A_{1,2}^{j})}$ (5)
where N(t j) is the normalized value of t j,$N(\Delta A_{1,2}^{j})$ is the normalized value of $\Delta A_{1,2}^{j},$ and $sim({{v}_{j}},{{l}_{1}},{{l}_{2}})$ represents the similarity of time-varying changes in variant vj in links l1, and l2.

3.4 Grouping links by similar dynamics in maritime network links

Every link in the maritime network has spatiotemporal dynamics observable in its event curve. When exploring the effect of international Event A in a country, e.g., Sri Lanka (Figure 4a), we divide the links connected with Sri Lanka into two parts, those with and without clear trend changes. The division rules are explained in Figure 4c, where da and db are the maximum change distance in the trend curve before and after Event A and v1, v2, v3, v4, v5, v6, v7, v8, v9, v10, and v11 are the change speeds for the curve segment divided by the crest or trough. We use da and db, max {v1, v2, v3}, and max {v4, v5, v6, v7, v8, v9, v10, v11} to find the links with differing trends (see Group 2 in Figure 4e). The other links without clear trend changes are included in Group 1 (Figure 4d).
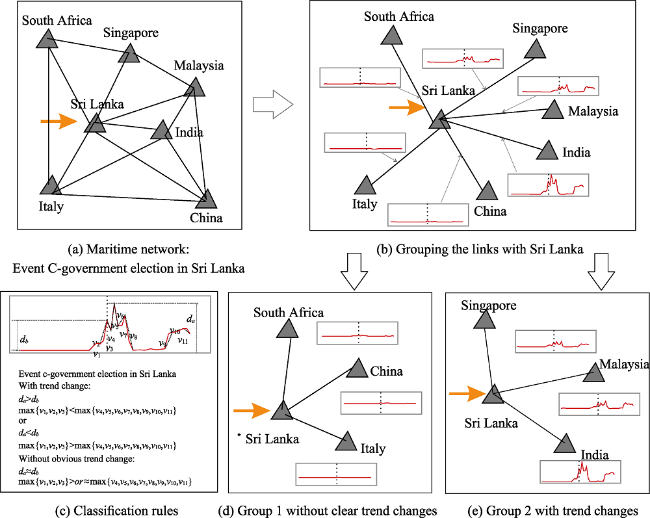
Figure 4 Grouping links with similar dynamics
After grouping these links, the well-known K-means (Lloyd, 1982; MacQueen, 1967; Borgwardt et al., 2017) method was used to classify the links in Group 2 to identify highly similar patterns in this group. This approach uses the similarity of time-varying changes in variant vj in these links as the clustering distance. The drawbacks of the K-means algorithm are the difficulty in finding the K-value and high dependency on initial partitions of the dataset (Arora1 et al., 2016). A recently developed efficient K-means clustering filtering algorithm (Kumar and Reddy, 2017) was used to solve this problem; it uses density-based initial cluster centers, which improves the performance of the K-means filtering by locating seed points at dense areas in the dataset. The dense areas are identified by representing the data points in a kd-tree. This approach can overcome the drawbacks of the well-known K-means when used to classify links in maritime networks. As a result, in this study, classified clusters were generated with different similar trend changes, and each cluster could be used to assess the possible effect of international events, as described in the next subsection.

3.5 Evaluating possible affected countries via maritime network dynamics

Evaluating the effects of international events on maritime networks is challenging because there is no direct evidence to prove a causal relationship. Therefore, in this study, we evaluate possible effects of international events using maritime network dynamics based on two perspectives: the directly affected countries and the indirect effect on linked countries. In addition, due to different types of vessels recorded in the AIS data, such as, tanker, container, and bulk, we created corresponding trend curves for each link in the maritime network.
This study considers a country as possibly affected by international events in a particular country if the links connected with this particular country have trend changes for at least one type of vessel. For example, in Figure 5, the curve for the link between India and Sri Lanka indicates a trend change after the international event. Therefore, India is one of the possible directly affected countries.
Figure 5 Evaluating countries potentially affected by an international event
If the next link to a country has similar trend changes for the same time period, the following country can be considered a potential indirectly affected country. For example, in Figure 5, the curve in the link between India and United Arab Emirates is similar to that between India and Sri Lanka, DLK_IN > or < DIN_AE, and the time t for the peak point in this curve is approximately the same. Therefore, the United Arab Emirates is viewed as a possible indirectly affected country. We term this phenomenon the indirect effect. If there are no similar trends in the curves for other links between countries, these linked countries are considered unaffected countries, and there is no indirect effect.
Using this categorization, we can assess potentially affected countries for each type of vessel in the maritime network.

4 Study area and results

4.1 Study area and dataset

A global AIS dataset for the period between January 1, 2013 and December 31, 2016 (http://www.myships.com/myships/) was used to derive an Origin-Destination (OD) dataset for 20864 vessels and 3685 connecting ports worldwide. The data categories for each vessel are listed in Table 1. All AIS points for each vessel were simplified as a sequence of ports according to the records in the dataset.
Table 1 Data categories in the vessel OD dataset
Item Meaning
MMSI Unique ID for the vessel
Start time (Ship entering the port)/End time
(Ship leaving the port)
Second-level timestamp (e.g., 2015-06-10 01:16:58)
Port’s location Longitude and latitude of the port location
World_port_index_number Index number for a port
Region_index Index number for a region
Port_name Name of the port
Wpi_country_code Code for the port country
Vessel_type Type of vessel (bulk / container / tanker)
Vessel_name Name of the vessel
The global maritime network derived from AIS data for container, bulk, and tanker ships is shown in Figure 6. The high volumes of vessel voyages are highlighted individually in Figures 6a, 6b and 6c. These figures show clearly different connection patterns for the three types of vessels. The maritime networks generated for 2013, 2014, 2015, and 2016 are used to evaluate the effect of international events.
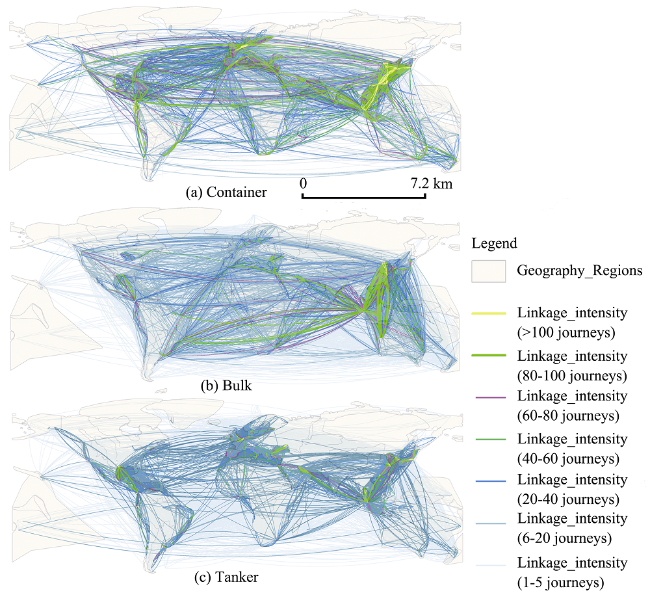
Figure 6 Maritime network derived from AIS data for 2015

4.2 Maritime network dynamics before and after events

This section explores the maritime network dynamics before and after three selected typical international events: military conflicts between India and Pakistan in August, 2015 (Event A), lifting economic sanctions on Iran (Event B), and government elections in Sri Lanka(Event C).
4.2.1 Military conflict between India and Pakistan in August 2015 (Event A)
A military conflict between India and Pakistan occurred in August 2015. In the border area between India and Pakistan, the Indian military fired on Pakistan, with the Pakistani military immediately fighting back. The fighting killed at least six Pakistani civilians and injured 46 people. This event was large enough to bring international scrutiny.
To evaluate the effects of this event, we clustered the top 20 maritime links connecting India based on tanker, bulk, and container ships, and then grouped them according to the proposed similarity measurement approach. Evaluating tanker shipping links, three groups were identified, a large fluctuation pattern (increase - slow down - slow down - increase - decrease) (Figure 7a-1), a small fluctuation pattern (small fluctuations - smooth increase) (Figure 7a-2), and a smooth pattern (Figure 7a-3). The United Arab Emirates (AE), Sri Lanka (LK), Pakistan (PK), and Singapore (SG) showed the large fluctuation pattern. In this pattern, there was a sharp decline in May 2015, and the tanker number in these countries decreased from August to December 2015. This pattern indicates that the event may have affected tanker shipping trade between India and these countries. Egypt (EG), Malaysia (MY), and Saudi Arabia (SA) showed a small fluctuation from 2013 to 2016. The fluctuation between January and August 2015 was greater than that after the military conflict, but the amplitude was small. Brazil (BR), China (CN), Indonesia (ID), Iraq (IQ), Iran (IR), Kenya (KE), Kuwait (KW), Mozambique (MZ), Oman (OM), Qatar (QA), Tanzania (TZ), Venezuela (VE), and South Africa (ZA) showed a smooth pattern, indicating that this event had no effect on these countries for tanker ships.
Figure 7 Grouped links based on similar dynamics for Event A, each panel shows international shipping trends with India via three types of ships: (a) tanker, (b) bulk, and (c) container. Columns 1-3 indicate the different groupings based on trade behavior before and after the event.
Three patterns emerged for bulk shipping: small fluctuations with small growth (Figure 7b-1), large fluctuations (Figure 7b-2), and an overall smooth pattern (Figure 7b-3). The combined small fluctuations and small growth appeared in United Arab Emirates (AE), Australia (AU), Brazil (BR), and Sri Lanka (LK). The first pattern shows that there was a small fluctuation before Event A, and a relatively gentle fluctuation after Event A, and then modest growth began in 2016. This pattern indicates that Event A had no clear effect on bulk ships between India and these countries. The second pattern appeared between India (IN) and Indonesia (ID), Singapore (SG), and South Africa (ZA). There was a large fluctuation from August 2014 to August 2015, and a slight fluctuation between August and December 2015 after Event A. This phenomenon indicates that Event A did not impact on bulk ships between India and these countries. The last pattern appeared in Argentina (AR), Bangladesh (BD), China (CN), Egypt (EG), Iran (IR), Malaysia (MY), Mozambique (MZ), Oman (OM), Pakistan (PK), Qatar (QA), Saudi Arabia (SA), the United States (US), and Uruguay (UY). Their changes were gentler than previous patterns, indicating that this event had no effect on bulk shipping with these countries.
Three patterns emerged in container shipping: “fluctuating growth - sharp decline - fluctuating growth” (Figure 7c-1), “fluctuating - gently increasing” (Figure 7c-2), and an overall gentle pattern (Figure 7c-3). The first pattern appeared in the shipping with the United Arab Emirates (AE), Sri Lanka (LK), Pakistan (PK), and Saudi Arabia (SA). There was volatile growth from August 2014 to June 2015, a sharp decline from June 2015 to August, followed by fluctuating growth from September 2015 to May 2016. The second pattern appeared in Malaysia (MY) and Singapore (SG). The main fluctuations occurred from August 2014 to July 2015, and were followed by steady growth. The third pattern, no trends, appeared in shipping with China (CN), Djibouti (DJ), Egypt (EG), Spain (ES), Israel (IL), Iran (IR), Italy (IT), Kenya (KE), Malta (MT), Oman (OM), Seychelles (SC), Tanzania (TZ), the United States (US), and South Africa (ZA).
In summary, maritime network dynamics between India and other countries show clear differences before and after Event A. There were large fluctuations in the network dynamics for tanker, bulk, and container ships between India and the United Arab Emirates (AE), Sri Lanka (LK), and Singapore (SG). Furthermore, network dynamics for container and tanker ships between India (IN) and Pakistan (PK), Saudi Arabia (SA), and Malaysia (MY) also showed large fluctuations. The network dynamics for bulk ships between India (IN) and Australia (AU), Indonesia (ID), South Africa (ZA), Brazil (BR) showed a clear effect. The link between India (IN) and Egypt (EG) showed large fluctuations only for tanker ships.
This study also explored the maritime time network dynamics before and after Events B and C. Similar analyses were performed, and our results, i.e., the shipping trends are provided as follows.
4.2.2 Economic sanction on Iran (Event B)
On July 16, 2015, the United States (US), the United Kingdom (UK), France (FR), Russia (RU), China (CN), Germany (DE), and Iran (IR) reached comprehensive agreement on the issue of Iranian nuclear materials. Subsequently, the Western countries began to lift economic sanctions against Iran. Investigating the effect of this event on global maritime network dynamics is important because Iran is an important member of the Organization of Petroleum Exporting Countries (OPEC).
Figure 8a illustrates the seasonal fluctuation pattern of bulk shipping for the United Arab Emirates (AE), China (CN), Indonesia (ID), India (IN), Iraq (IQ), Kuwait (KW), Oman (OM), Pakistan (PK), Qatar (QA), Saudi Arabia (SA), and South Africa (ZA) linked with Iran. There were clear seasonal fluctuations between January 2013 and July 2015, which continued after Event B. However, this trend did not show significant changes from August 2015 to December 2016. This indicates that Event B did not affect the bulk trade between these countries.
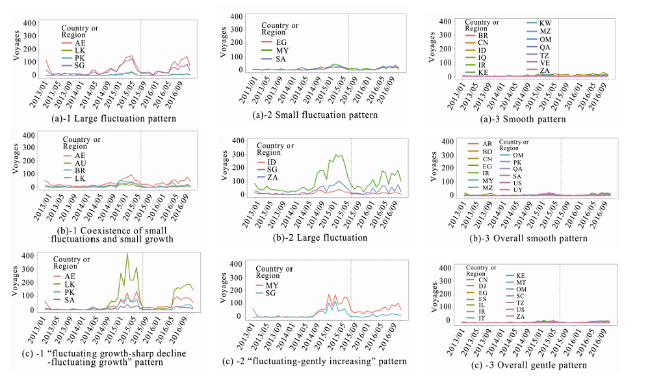
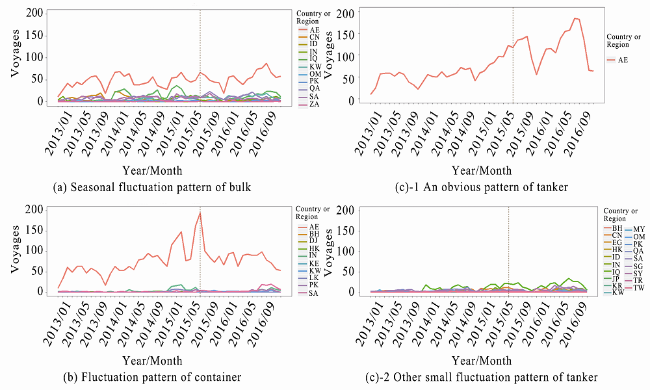
Figure 8 Variations in the number of (a) bulk, (b) container, and (c)-1 and (c)-2 tanker shipping voyages between Iran and linked countries (regions) before and after Event B
Figure 8b shows the typical container shipping patterns with Iran before and after Event B for the United Arab Emirates (AE), Bahrain (BH), Djibouti (DJ), Hong Kong (China), India (IN), Kenya (KE), Kuwait (KW), Sri Lanka (LK), Pakistan (PK), and Saudi Arabia (SA). Container shipping had a fluctuating, but increasing from January to July 2015 (before Event B). From August to September 2015 there was a slight decline and then continued fluctuations, indicating that the lifted economic sanctions did not immediately promote Iran’s container shipping network with these countries (regions).
Figures 8c-1 and 8c-2 illustrate the tanker shipping before and after Event B between Iran and linked countries (regions). Figure 8c-1 only includes the United Arab Emirates, where there was a growth trend from January to July 2015. After Event B, the trend continued to increase, but with large fluctuations; there were also clear seasonal effects, with decreases every 10-12 months. The number of tanker voyages clearly increased after this event, so this event played a role in promoting the tanker network between these two countries (regions). Figure 8c-2 includes Bahrain (BH), China (CN), Egypt (EG), Hong Kong (China), Indonesia (ID), India (IN), Iraq (IQ), Japan (JP), Korea (KR), Kuwait (KW), Malaysia (MY), Oman (OM), Pakistan (PK), Qatar (QA), Saudi Arabia (SA), Singapore (SG), Syria (SY), Turkey (TR), and Taiwan (China). Before and after this event, the tanker maintained the same trend, indicating that there was no significant impact on Iran’s tanker maritime network with those countries (regions).
In summary, lifting Iran’s economic sanctions had no obvious effect on Iran’s bulk, container, and tanker shipping network with other countries (regions); one of the few exceptions was the increase in tanker shipping between Iran and the United Arab Emirates.
4.2.3 Government election in Sri Lanka (Event C)
In the presidential election of 2015 in Sri Lanka, Rajapaksa was defeated and Sirisena was elected as the new President. In February 2015, President Sirisena visited India; subsequently, on March 5 of the same year, the Sri Lankan government decided to halt the construction of the Colombo Port temporarily, an investment location for Chinese enterprises. This event was at the intersection of politics, economics, and maritime activity, so investigating the effect of this event on global maritime network dynamics is important.
Figure 9 illustrates the changes in bulk, container, and tanker shipping for Sri Lanka before and after Event C. Figures 9a and 9b show no clear changes in bulk and tanker shipping between Sri Lanka and other countries. However, clear changes appeared in container shipping with India (IN), Malaysia (MY), and Singapore (SG). In Figures 9c-1 and 9c-2, an obvious overall increasing trend in container shipping occurred from March to August 2015, followed by a decrease to a low level between August 2015 and May 2016, below that of August 2014. This observation indicates that the event potentially played a role in promoting container shipping connections between Sri Lanka (LK) and India (IN), Malaysia (MY), and Singapore (SG).
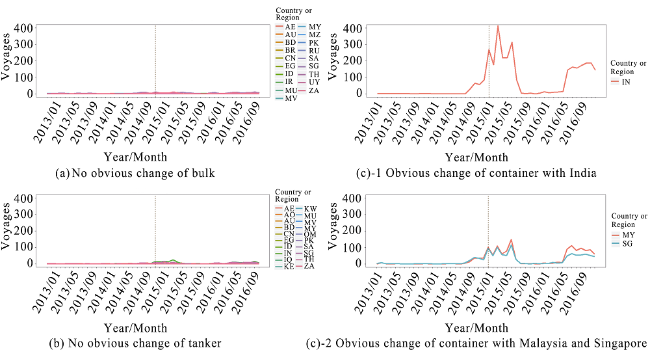
Figure 9 Variations in the number of bulk, container, and tanker shipping voyages before and after Event C between Sri Lanka and countries linked by shipping, (a) bulk shipping linked with major countries and regions, (b) tanker shipping linked with major countries and regions, (c)-1 container shipping linked with India, and (c)-2 container shipping linked with Malaysia and Singapore

4.3 Assessing possible indirect effects

We also evaluated possible indirect effects by exploring similar patterns in adjacent links in the maritime networks using the proposed method.
Figure 10 illustrates the derived maritime network between countries with variations in network dynamics or similar fluctuations before and after Event A. The figure is used to demonstrate the type of vessel affected by Event A. The figure shows India is the first country used to explore the maritime network dynamics, although Pakistan was also involved in this event. South Africa, Malaysia, Indonesia, Sri Lanka, Singapore, Australia, Saudi Arabia, Egypt, the United Arab Emirates, and Brazil are linked to India (orange ovals, termed the direct connected link) and show fluctuations in vessel types. The countries with green and orange ovals share similar network dynamics, termed the indirect connected links. From the figure, several observations can be made:
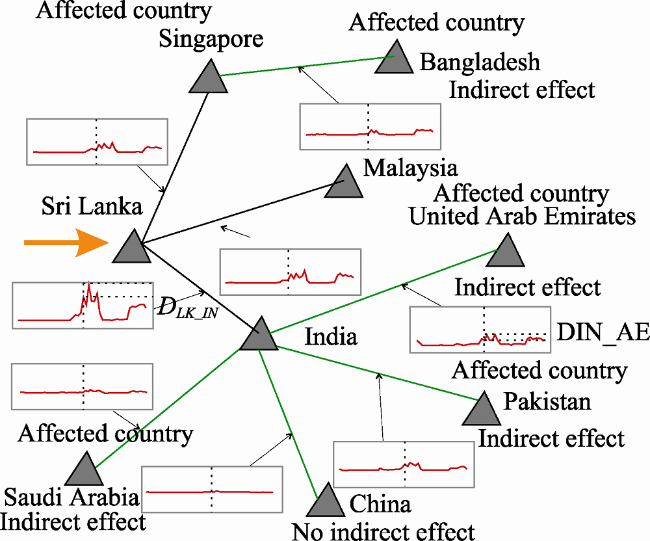
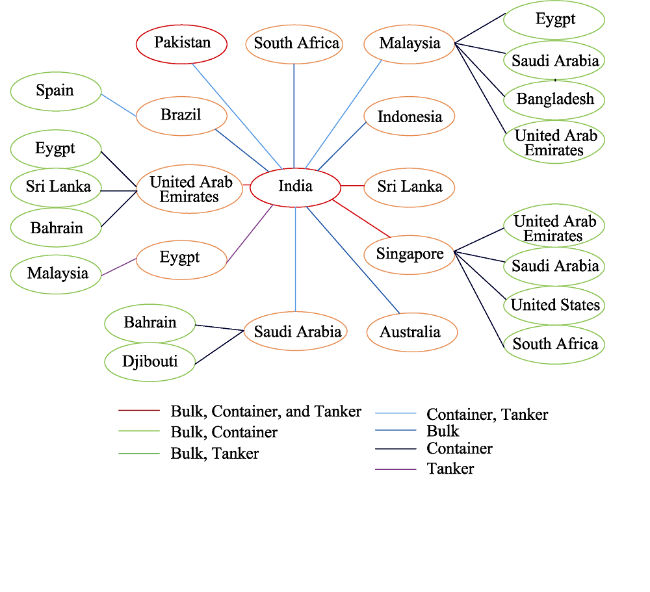
Figure 10 The countries possibly affected by Event A and their shipping linkages in terms of different types of shipping
i) The United Arab Emirates, Singapore, Saudi Arabia, and Malaysia are linked to some indirect affected countries with similar fluctuation dynamics as their links with India for container shipping. Also, Egypt and Brazil are linked to some indirect affected countries with similar fluctuation dynamics as their link with India for tanker shipping. This situation is evidence of a possible indirect effect for these vessel types. Figure 11 shows the spatial distribution of countries potentially affected by Event A.
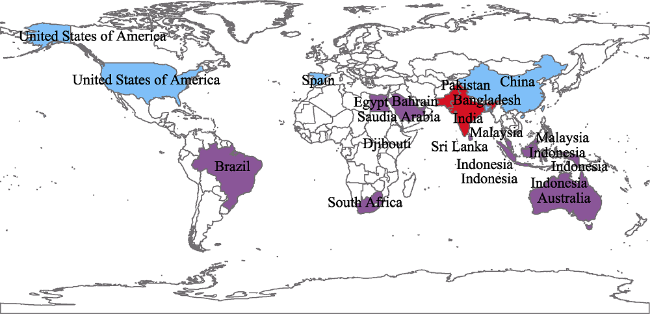
Figure 11 Spatial distribution of countries possibly affected by Event A
ii) Australia, South Africa, and Indonesia did not have indirect connected links, i.e., their linkages to other countries had significantly different dynamics patterns from their links with India. Malaysia, Singapore, the United Arab Emirates, and Saudi Arabia only had indirect connected links for containers, and did not have similar fluctuation dynamics for bulk and tanker shipping. This phenomenon indicates that it is possible for these countries to show an indirect effect only for container shipping.
Based on countries potentially affected by Event A in Figure 10, we analyzed the observed changes in network dynamics and found that after Event A the average container shipping voyages between India and United Arab Emirates, Sri Lanka, Pakistan, Saudi Arabia, Malaysia, and Singapore declined by 79.7%, 97.8%, 99.5%, 95.2%, 69.1%, and 92.0%, respectively. The average tanker shipping voyages between India and United Arab Emirates, Sri Lanka, Pakistan, Singapore, Egypt, Malaysia, Saudi Arabia declined by 85.1%, 95.7%, 99.0%, 73.9%, 93.8%, 69.1%, and 94.9%, respectively. The average bulk shipping between India and United Arab Emirates, Australia, Sri Lanka, Indonesia, Singapore, South Africa, and Brazil declined by 69.3%, 83.9%, 97.1%, 72.1%, 77.2%, 86.1%, and 80.1%, respectively.
Table 2 provides details for the derived maritime network between countries that showedvariations in network dynamics or similar fluctuations before and after Event B. Only the United Arab Emirates showed clear fluctuations in shipping with Iran, and only for tanker shipping. The actual changes in the network dynamics indicate that tanker shipping between Iran and the United Arab Emirates increased by 51%, i.e., the average voyages increased from 59.806 to 121.176 after lifting economic sanctions on Iran. In addition, the link between the United Arab Emirates and Indonesia had similar fluctuation dynamics (0.473) to that between Iran and the United Arab Emirates.
Table 2 Countries potentially affected by Event B
Link Highest number of voyages and time period Lowest number of voyages and time period Average voyages before Event B Average voyages after Event B Minimum crossing area after standardi-
zation
Time period for the same trend after standardi-
zation
Similarity of time-varying changes (1/journeys)
Iran-United Arab Emirates 143
(2015-10)
64
(2015-01)
59.806 121.176 0.353 0.167 0.473
United Arab Emirates- Indonesia 17
(2015-10)
3
(2015-02)
5.871 12.294
Table 3 provides details of the derived maritime network between countries that have variations in network dynamics or similar fluctuations before and after Event C. Only India, Malaysia, and Singapore showed clear fluctuations in shipping with Sri Lanka. The actual changes in network dynamics show that the container shipping between Sri Lanka and Singapore, Malaysia, and India increased by 73.6%, 78.9%, and 85.8%, respectively, after Event C; the average increases in voyages are provided in Table 3. Similar fluctuation dynamics between the direct connected links and indirect connected links are found for the United Arab Emirates (0.811), Saudi Arabia (0.489), Pakistan (0.741), and Bangladesh (0762) for container shipping. All adjacent connected links with Malaysia had different fluctuation dynamics from the link between India and Malaysia, so they did not show a possible indirect effect.
Table 3 Countries potentially affected by Event C
Link Highest number of voyages and time period Lowest number of voyages and time period Average voyages before Event
C
Average voyages after
Event
C
Minimum crossing
area after standardi-
zation
Time period of the same trend after standardi-
zation
Similarity
of time-
varying changes (1/journeys)
Sri Lanka-India 412 (2015-03) 0 (2014-07) 34.286 241.286
India-United
Arab Emirates
136 (2015-06) 0 (2014-07) 15.571 85.857 0.444 0.361 0.811
India-Saudi Arabia 39 (2015-03) 0 (2014-06) 4.429 23.857 0.530 0.259 0.489
India-Pakistan 91 (2015-03) 3 (2014-06) 10.286 59.571 0.250 0.185 0.741
Sri Lanka-Singapore 114 (2015-06) 1 (2014-07) 18.571 70.429 0.413 0.315 0.762
Singapore-Bangladesh 50 (2015-03) 1 (2014-07) 8.833 23.714
Sri Lanka-Malaysia 148 (2015-06) 0 (2014-07) 17.571 83.143

5 Conclusions and future work

This study proposed an AIS-based approach to explore maritime network dynamics before and after international events. This approach provides a mechanism for comparing time-series variations in maritime networks driven by international events and identifying connected links with similar dynamics close in time to the events. The results show that container, tanker, bulk shipping between India and other countries all declined by more than 69% after the military conflict between India and Pakistan in August 2015. Tanker shipping between Iran and the United Arab Emirates increased by 51% after the lifting of economic sanctions on Iran, and container shipping between Sri Lanka and Singapore, Malaysia, and India increased by more than 74% after the government election in Sri Lanka. These case studies demonstrate the feasibility and capability of this approach in understanding maritime network dynamics.
Although this work is an initial step for investigating the effect of international events on spatiotemporal dynamics of maritime network, it could be helpful for developing national strategies in combination with economics, customs, geography, and political information. In the future, this approach could be improved by integrating such comprehensive information. Furthermore, introducing and understanding the mechanisms driving structural and regional dynamics in global maritime networks, analyzing the industries affected by events, and linking them with the corresponding types of maritime network will be promising.

The authors have declared that no competing interests exist.

[1]
Akhtar M J, Utne I B, 2014. Human fatigue’s effect on the risk of maritime groundings: A Bayesian network modeling approach.Safety Science, 62: 427-440.The article introduces a general method for developing a Bayesian Network (BN) for modeling the risk of maritime ship accidents. A BN of human fatigue in the bridge management team and the risk of ship grounding is proposed. The qualitative part of the BN has been structured based on modifying the Human Factor Analysis and Classification System (HFACS). The quantitative part is based upon correlation analysis of fatigue-related factors identified from 93 accident investigation reports. The BN model shows that fatigue has a significant effect on the probability of grounding. A fatigued operator raises the probability of grounding of a large ship in long transit with 23%. Compared to the two watch system (6–6 and 12–12), the 8–4–4–8 watch system seems to generate the least fatigue. However, when manning level, which is influenced by the various watch schemes, is taken into account, the two watch system is preferable, leading to less fatigue and fewer groundings. The strongest fatigue-related factors related to top management are vessel certifications, manning resources, and quality control.

DOI

[2]
Angeloudis P, Greco L, Bell M G, 2015. Strategic maritime container transport design in Oligopolistic markets.Transportation Research Procedia, 9: 269-282.

DOI

[3]
Arora1 P, Deepali D, Varshney S, 2016. Analysis of K-means and K-medoids algorithm for big data.Procedia Computer Science, 78: 507-512Clustering plays a very vital role in exploring data, creating predictions and to overcome the anomalies in the data. Clusters that contain collateral, identical characteristics in a dataset are grouped using reiterative techniques. As the data in real world is growing day by day so very large datasets with little or no background knowledge can be identified into interesting patterns with clustering. So, in this paper the two most popular clustering algorithms K-Means and K-Medoids are evaluated on dataset transaction10k of KEEL. The input to these algorithms are randomly distributed data points and based on their similarity clusters has been generated. The comparison results show that time taken in cluster head selection and space complexity of overlapping of cluster is much better in K-Medoids than K-Means. Also K-Medoids is better in terms of execution time, non sensitive to outliers and reduces noise as compared to K-Means as it minimizes the sum of dissimilarities of data objects.

DOI

[4]
Bezgodov A, Esin D, 2014. Complex network modeling for maritime search and rescue operations.Procedia Computer Science, 29: 2325-2335.This paper introduces a complex network model for collective behavior of floating drifters at sea. Direct simulat ion method for floating objects on irregular waves is used to express the network dynamics. The features of co llect ive behavior (such as the network destruction) are considered. The model is applied to study of efficiency of maritime search and rescue operations at sea.

DOI

[5]
Borgwardt S, Brieden A, Gritzmann P, 2017. An LP-based K-means algorithm for balancing weighted point sets.European Journal of Operational Research, 263: 349-355.For example, while finite termination of all k -means variants for unweighted point sets is a simple consequence of the existence of only finitely many partitions of a given set of points, the situation is more involved for weighted point sets, as there are infinitely many partial membership clusterings. Using polyhedral theory, we show that the number of iterations of weight-balanced k -means is bounded above by n O ( dk ) , so in particular it is polynomial for fixed k and d . This is similar to the known worst-case upper bound for classical k -means for unweighted point sets and unrestricted cluster sizes, despite the much more general framework. We conclude with the discussion of some additional favorable properties of our method.

DOI

[6]
Box G E, Jenkins G M, Reinsel G C,et al. 1976. Time Series Analysis: Forecasting and Control. San Francisco: Holden-Day.

[7]
Campana I, Angeletti D, Crosti R,et al. 2017. Seasonal characterisation of maritime traffic and the relationship with Cetacean presence in the Western Mediterranean Sea.Marine Pollution Bulletin, 115: 282-291.Abstract Seasonal maritime traffic was investigated in relation to cetaceans, through direct observations (July 2013 une 2015) along three fixed transects in Western Mediterranean. Visually obtained vessel abundance was compared with Automatic Identification System data to explore if the two methods provided different results. Traffic intensity and composition were characterised by seasons and vessel categories. Finally, cetacean presence was investigated in relation to traffic by measuring the difference of vessel abundance in the presence and absence of animal sightings. Results showed that visual sampling was consistent with AIS data, providing more information on small-medium vessels. Traffic was more intense and diverse in Spring/Summer, and the highest vessel abundance and seasonal variations in composition emerged for inshore subareas. The difference of traffic in the presence and absence of cetaceans was higher in most offshore subareas in Spring/Summer, verified for B. physalus and S. coeruleoalba; in inshore waters, mostly occupied by T. truncatus, no significant differences emerged.

DOI PMID

[8]
Castaldo F, Palmieri F A, Regazzoni C, 2015. Application of Bayesian techniques to behavior analysis in maritime environments. In: Advances in Neural Networks: Computational and Theoretical Issues. Switzerland: Springer, 175-183.

[9]
Cleveland W S, Devlin S J, Grosse E, 1988. Regression by local fitting: Methods, properties, and computational algorithms.Journal of Econometrics, 37(1): 87-114.

DOI

[10]
Davarzani H, Fahimnia B, Bell M,et al. 2016. Greening ports and maritime logistics: A review.Transportation Research Part D, 48: 473-487.This paper aims to examine the past and present research on ‘green ports and maritime logistics’ in order to identify established research streams and fertile research areas with potential for future investigations. Using rigorous bibliometric and network analysis tools, the paper completes a systemic mapping of the existing literature and identifies the key investigators, collaboration patterns, research clusters and interrelationships, and the “seminal research areas” that have provided the field with the foundational knowledge, concepts, theories, tools, and techniques. Major articles within each seminal research area are also identified. This will allow new researchers to quickly build understanding in a particular sub-field by reading these major articles. The findings obtained from the evolution of seminal research areas over time are important from both research and practice perspectives and can help the field grow in many dimensions.

DOI

[11]
Dinwoodie J, Tuck S, Rigot-Müller P, 2013. Maritime oil freight flows to 2050: Delphi perceptions of maritime specialists.Energy Policy, 63: 553-561.61Local sourcing, Arctic seaways and fossil fuel intolerance lessen oil freight work.61Oil hauls lengthen if ships re-route to avoid Emission Control Areas and piracy.61Conservative perceptions of established specialists match early career views.61Carbon emission reduction policies imply significantly reduced oil shipments.61Attitude change in maritime professionals will require education and marketing.

DOI

[12]
Doloreux D, Shearmur R, Figueiredo D, 2016. Québec’ coastal maritime cluster: Its impact on regional economic development, 2001-2011. Marine Policy, 71: 201-209.The notion of clusters has increasingly been integrated into regional economic development policies. This paper examines the extent to which maritime cluster policy strategies in Qu bec's coastal region are associated with employment growth in the region, and more specifically, science-based, skill-intensive employment. Whilst early evaluations conducted about a decade ago suggested that cluster policies implemented from the mid-1990s onwards had little effect, the question addressed in this paper concerns their effect over the long term. Based on descriptive statistics and trend analysis, the results reveal that the sectors targeted by the cluster policies have tended to grow more slowly within the cluster, and that jobs in the cluster are decreasingly science-intensive. At best, cluster policies have had a weak and diffused effect. This is in keeping with other recent work on clusters, and calls into question policy attempts to generate cluster dynamics in regions where these do not emerge spontaneously.

DOI

[13]
Ducruet C, 2013. Network diversity and maritime flows.Journal of Transport Geography, 30: 77-88.Coupled and interdependent networks constitute a relatively recent research field that has been so far little invested by port and maritime specialists. The extent to which certain ports benefit from being connected to multiple commodity flows in the maritime network has in fact been poorly addressed. A global database of merchant vessel inter-port movements that occurred in October and November 2004 allows building the respective weighted graphs of solid bulk, liquid bulk, container, general cargo, and passenger/vehicles. Main results underline a very strong influence of commodity diversity on the distribution of maritime traffics among ports and links between them. The research also underlines the role of different regional settings in the specialization of traffic flows.

DOI

[14]
Ducruet C, 2016. Maritime Network Spatial Structure and Time Dynamics. New York: Routledge.

[15]
Ducruet C, 2017. Multilayer dynamics of complex spatial networks: The case of global maritime flows (1977-2008).Journal of Transport Geography, 60: 47-58.This article investigates the degree of overlap among the different layers of circulation composing global maritime flows in recent decades. Mobilizing several methods originating from complex networks allows us to shed new light on specialization and diversification dynamics affecting the evolution of ports and shipping. The principal confirm the strong and path-dependent influence of multiplexity on traffic volume, range of interaction and centrality from various perspectives, such as matrices correlations, homophily, assortativity, and single linkage analysis. While the network grows and concentrates around large hubs over time, traffic distribution is also place-dependent due to the reinforced position of already established nodes.

DOI

[16]
Ducruet C, Lee S W, Ng A K, 2010. Centrality and vulnerability in liner shipping networks: Revisiting the Northeast Asian port hierarchy.Maritime Policy Management, 37(1): 17-36.This article is essentially an empirical investigation in the network analysis of inter-port traffic flows. Based on a database of vessel movements, it applies conventional techniques of network analysis to the graph of Northeast Asian liner networks in 1996 and 2006. Such an approach proves particularly helpful for analyzing the changing position of major hub ports and for revealing their respective tributary areas within the region. Despite rapid traffic growth at Chinese ports during the period under study, the latter seem to remain polarized by established hubs such as Korean ports and Hong Kong. This research reveals the strong relation between local port policies and the evolution of shipping network design.

DOI

[17]
Ducruet C, Lee S W, Roussin S, 2009. Local strength and global weakness: A maritime network perspective on South Korea as Northeast Asia's logistics hub.International Journal of Maritime Affairs and Fisheries, 1(1): 32-50.

[18]
Ducruet C, Notteboom T, 2012. The worldwide maritime network of container shipping: Spatial structure and regional dynamics.Global Networks, 12(3): 395-423.Port and maritime studies dealing with containerization have observed traffic concentration and dispersion throughout the world. Globalization, intermodal transportation, and technological revolutions in the shipping industry have resulted in both network extension and rationalization. However, lack of precise data on inter-port relations prevent the application of wider network theories to global maritime container networks, which are often examined through case studies of specific firms or regions. In this article, we present an analysis of the global liner shipping network in 1996 and 2006, a period of rapid change in port hierarchies and liner service configurations. While we refer to literature on port system development, shipping networks, and port selection, the article is one of the only analyses of the properties of the global container shipping network. We analyse the relative position of ports in the global network through indicators of centrality. The results reveal a certain level of robustness in the global shipping network. While transhipment hub flows and gateway flows might slightly shift among nodes in the network, the network properties remain rather stable in terms of the main nodes polarizing the network and the overall structure of the system. In addition, mapping the changing centrality of ports confirms the impacts of global trade and logistics shifts on the port hierarchy and indicates that changes are predominantly geographic.

DOI

[19]
Fahmiasari H, Parikesit D, 2017. Container shipping network efficiency comparison in Indonesia: Nusantara Pendulum and Sea Tollway.The Asian Journal of Shipping and Logistics, 33(2): 79-84.The disparity of the trading activities in Indonesia has triggered Indonesia Port Corporation to come up with the plan of Nusantara Pendulum, the future network of container shipping in Indonesia. The Sea Tollway plan is the modification of Nusantara Pendulum that is also envisioned by Indonesia President for Indonesia future backbone container plan. Both networks were designed to increase Indonesia container shipping flow from west to east and vice versa like a pendulum, thus results the reduced transport cost. This paper depicts the comparison of network efficiency analysis between these networks: Nusantara Pendulum, Sea Tollway, and the existing network. Two main methods that are used are Nagurney-Qiang and Jenelius-Peterson-Mattson. Mainly, these two methods use the efficiency calculation by considering parameters of demand (goods flow) between each region and maritime transportation cost. It is concluded afterward that: 1) Sea Tollway is 8% more efficient than Nusantara Pendulum; 2) Sea Tollway and Nusantara Pendulum are ten times more efficient than current network; 3) Eastern ports in Indonesia (Bitung and Sorong) urgently requisite a development.

DOI

[20]
Fiorini M, Capata A, Bloisi D D, 2016. AIS data visualization for maritime spatial planning (MSP).International Journal of e-Navigation and Maritime Economy, 5: 45-60.The constant increase in marine traffic and the simultaneous growth of the demand for exploiting marine areas (e.g., installing offshore wind power plants) require an adequate planning strategy for managing high traffic volumes. Maritime Spatial Planning (MSP) is the process of public development of an allocation plan for distributing, both spatially and temporally, human activities in marine areas. The adoption of e-Navigation is a possible solution for improving safety and security at sea by integrating maritime information on board and ashore. Automatic Identification System (AIS) data represents a fundamental source of information, since the analysis of AIS data can highlight the presence of congested areas as well as of illegal actions, such as smuggling, pollution, and unauthorized phishing in protected areas. Indeed, those activities are often characterized by abnormal manoeuvres that can be recognized by analyzing the routes of the vessels. However, the huge dimension of the AIS data to process requires the adoption of careful strategies for the data visualization. In this paper, we present a complete pipeline for visualizing ship routes from raw AIS data, which is a fundamental pre-requisite for carrying out a significant AIS-based route analysis, and describe a real case study, where 90 million AIS records, corresponding to one month of world-wide observations, are visualized using only open-source software.

DOI

[21]
Fremont A, 2007. Global maritime networks: The case of Maersk.Journal of Transport Geography, 15: 431-442.

DOI

[22]
Fugazza M, Hoffmann J, 2017. Liner shipping connectivity as determinant of trade.Journal of Shipping and Trade, 2(1): 1.Transport connectivity is a crucial determinant of bilateral exports. This paper presents an empirical assessment of the relationship between bilateral maritime liner shipping connectivity and exports in containerizable goods during the period 2006–2013. Making use of probed “gravity” type trade models, the paper incorporates new data on different measurements of maritime distance, as well as a unique new dataset and new bilateral connectivity indices developed by UNCTAD. The empirical investigations unequivocally show that lacking a direct maritime connection with a trade partner is associated with lower values of exports; any additional transshipment is associated with a 40% lower value of bilateral exports. Other indicators of liner shipping connectivity incorporated in the research take into consideration levels of competition and container vessel sizes. Results also indicate that the quality of bilateral connectivity as measured by several composite indices is a crucial determinant of bilateral exports. All empirical results suggest that in the absence of a bilateral connectivity indicator the impact of distance on bilateral exports in classical gravity models is likely to be overestimated.

DOI

[23]
Gagatsi E, Giannopoulos G, Aifantopoulou Get al., 2017. Stakeholders-based multi-criteria policy analysis in maritime transport: From theory to practice.Transportation Research Procedia, 22: 655-664.This paper discusses on the applicability of a combined multi-actors multi-criteria method developed to facilitate policy making in the area of maritime transport. The methodology exploits the operational synergy of two MCDA techniques (PROMETHEE and AHP) in a multi-actors evaluation environment. This combination seeks to improve both methods’ applicability and decrease their potential deficiencies and limitations while their application in a Group Decision environment facilitates the building of consensus among the involved stakeholders through the provision of a transparent participatory policy selection mechanism. The methodology is applied on a real case involving a stakeholders’ - based evaluation of 4 key policies for supporting the Greek coastal maritime sector. The results of the case study regarding the Multi-criteria evaluation of the examined policies, the experts and the individual stakeholder’ groups preferences and priorities, as well as the opinion of the Greek coastal maritime transport stakeholders in relation to the necessity, the usability and the applicability of this group decision multi-criteria mechanism are analyzed and discussed.

DOI

[24]
Guerrero D, Rodrigue J P, 2014. The waves of containerization: Shifts in global maritime transportation.Journal of Transport Geography, 34: 151-164.This paper provides evidence of the cyclic behavior of containerization through an analysis of the phases of a Kondratieff wave (K-wave) of global container ports development. The container, like any technical innovation, has a functional (within transport chains) and geographical diffusion potential where a phase of maturity is eventually reached. Evidence from the global container port system suggests five main successive waves of containerization with a shift of the momentum from advanced economies to developing economies, but also within specific regions. These waves are illustrative of major macroeconomic, technological and sometimes political shifts within the global economy. They do not explain the causes, but simply the consequences in the distribution in container traffic and growth (or decline). Yet, they provide strong evidence that containerization has a cyclic behavior and that inflection points are eventually reached, marking the end of the diffusion of containerization in a specific port or port range. Future expectations about the growth of containerization thus need to be assessed within an economic cycle perspective instead of the rather linear perspectives.

DOI

[25]
Hänninen M, Banda O A V, Kujala P, 2014. Bayesian network model of maritime safety management.Expert Systems with Applications, 41: 7837-7846.This paper presents a model of maritime safety management and its subareas. Furthermore, the paper links the safety management to the maritime traffic safety indicated by accident involvement, incidents reported by Vessel Traffic Service and the results from Port State Control inspections. Bayesian belief networks are applied as the modeling technique and the model parameters are based on expert elicitation and learning from historical data. The results from this new application domain of a Bayesian network based expert system suggest that, although several its subareas are functioning properly, the current status of the safety management on vessels navigating in the Finnish waters has room for improvement; the probability of zero poor safety management subareas is only 0.13. Furthermore, according to the model a good IT system for the safety management is the strongest safety-management related signal of an adequate overall safety management level. If no deficiencies have been discovered during a Port State Control inspection, the adequacy of the safety management is almost twice as probable as without knowledge on the inspection history. The resulted model could be applied to performing several safety management related queries and it thus provides support for maritime safety related decision making.

DOI

[26]
Hu Y H, Zhu D L, 2009. Empirical analysis of the worldwide maritime transportation network.Physica A, 388: 2061-2071.In this paper we present an empirical study of the worldwide maritime transportation network (WMN) in which the nodes are ports and links are container liners connecting the ports. Using the different representations of network topology the spaces L and P, we study the statistical properties of WMN including degree distribution, degree correlations, weight distribution, strength distribution, average shortest path length, line length distribution and centrality measures. We find that WMN is a small-world network with power law behavior. Important nodes are identified based on different centrality measures. Through analyzing weighted clustering coefficient and weighted average nearest neighbors degree, we reveal the hierarchy structure and rich-club phenomenon in the network.

DOI

[27]
Høye G K, Eriksen T, Meland B Jet al., 2008. Space-based AIS for global maritime traffic monitoring. Acta Astronautica, 62: 240-245.The universal shipborne automatic identification system (AIS) is a recently introduced system for traffic monitoring and safety at sea. In this paper we investigate the possibility of extending the system to space for global maritime surveillance, and give suggestions for how the system can be optimized for long-range identification and tracking (LRIT).

DOI

[28]
Jiang J, Lee L H, Chew E Pet al., 2015. Port connectivity study: An analysis framework from a global container liner shipping network perspective.Transportation Research Part E, 73: 47-64.This paper introduces an analysis framework for port connectivity from a global container liner shipping network perspective: it is defined in terms of the impact on the transportation network when the transshipment service is not available at the evaluated port. Under this framework, two models for port connectivity are introduced from transportation time and capacity. Compared with existing measures, the strength of our framework and models is not only that it provides scientific methods to compute port connectivity, but it is able to capture a global effect on how port connectivity contributes to the overall network for given shipping services.

DOI

[29]
Karsten C V, Brouer B D, Pisinger D, 2017. Competitive liner shipping network design.Computers & Operations Research, 87: 125-136.We present a solution method for the liner shipping network design problem which is a core strategic planning problem faced by container carriers. We propose the first practical algorithm which explicitly handles transshipment time limits for all demands. Individual sailing speeds at each service leg are used to balance sailing speed against operational costs, hence ensuring that the found network is competitive on both transit time and cost. We present a matheuristic for the problem where a MIP is used to select which ports should be inserted or removed on a route. Computational results are presented showing very promising results for realistic global liner shipping networks. Due to a number of algorithmic enhancements, the obtained solutions can be found within the same time frame as used by previous algorithms not handling time constraints. Furthermore, we present a sensitivity analysis on fluctuations in bunker price which confirms the applicability of the algorithm.

DOI

[30]
Kim J Y, 2014. Port user typology and representations of port choice behavior: A Q-methodological study.Maritime Economics & Logistics, 16: 165-187.Research has identified many criteria that contribute to selecting a sea port, yet not much is known about how port users look at these criteria and how they argue on the factors that contribute to their port choice behavior. This study uses the Q methodology to explore the typology of port choice in conjunction with the port users own representations of their choice behavior. We employ an in-depth methodology that incorporates both quantitative and qualitative methods for an investigation of port choice behavior among port users particularly in South Korea. The analysis revealed four main types: Service- and corporation-oriented; Location and cost saver; On-time and task achiever; and Capacity and infrastructure friendly type. The results provide some implications and guidance for formulating policies and effective strategies for improving the competitiveness of port authorities and port operators.

DOI

[31]
King G, Zeng L C, 2001. Explaining rare events in international relations.International Organization, 55(3): 693-715.

DOI

[32]
Knappett C, Evans T, Rivers R, 2008. Modelling maritime interaction in the Aegean Bronze Age.Antiquity, 82: 1009-1024.

DOI

[33]
Kumar K M, Reddy A R M, 2017. An efficient K-means clustering filtering algorithm using density based initial cluster centers.Information Sciences, 418: 286-301.k -means is a preeminent partitional based clustering method that finds k clusters from the given dataset by computing distances from each point to k cluster centers iteratively. The filtering algorithm improves the performance of k -means by imposing an index structure on the dataset and reduces the number of cluster centers searched while finding the nearest center of a point. The performance of filtering algorithm is influenced by the degree of separation between initial cluster centers. In this paper, we propose an efficient initial seed selection method, RDBI, to improve the performance of k -means filtering method by locating the seed points at dense areas of the dataset and well separated. The dense areas are identified by representing the data points in a kd -tree. A comprehensive experimental analysis is performed to evaluate the performance efficiency of proposed method and state-of-the-art initialization methods and shown that the proposed method is efficient in terms of both running time and clustering accuracy.

DOI

[34]
Lam J S L, Yap W Y, 2011. Dynamics of liner shipping network and port connectivity in supply chain systems: Analysis on East Asia.Journal of Transport Geography, 19(6): 1272-1281.The study of ports in supply chain systems is an emerging area of importance which has drawn more attention from researchers in recent years. This paper presents a new perspective in this research area by examining the calling patterns of container shipping services in order to understand the dynamics of port connectivity and inter-port relationships in the supply chains. Empirical evidence is drawn from four major ports in East Asia, namely Shanghai, Busan, Kaohsiung and Ningbo. The study identifies the shipping capacity, trade routes and geographical regions connected to the ports, shipping lines involved, and the extensity and intensity of inter-port relationships among the four container ports from liner shipping network perspective. The findings show that most of the shipping capacity employed on the major east est trade routes became non-exclusive and involved calls at two or more of the four ports. Port planners, terminal operators and carriers could capitalise on opportunities through exploitation of complementary relationships that exist among the selected ports, such as offering a package for shipping lines to call at a portfolio of terminals owned by the same terminal operator. Policy and research implications as well as recommendations are discussed for various stakeholders concerned with port planning and regional development.Highlights? We examine the calling patterns of container shipping services connected to East Asia. ? Inter-port relationships include both port competition and complementarity in supply chain systems. ? Complementarity in port calls existed in Shanghai, Busan, Kaohsiung and Ningbo.

DOI

[35]
Laxe F G, Seoane M J F, Montes C P, 2012. Maritime degree, centrality and vulnerability: Port hierarchies and emerging areas in containerized transport (2008-2010).Journal of Transport Geography, 24: 33-44.The reaction to the financial and economic crisis has shown a new redesign of scenarios taking into account the changes made by maritime companies choosing different ports. In this research, containerized traffic evolution in 2008 and 2010 is described, both in big ports and geographic regions as from the emergent port activity areas. Database used is a sample of the world containership fleet movements that have called in some Chinese port in the years analysed. Calculus methodologies based on Graph Theory are applied to this set of data, able to give information about the global and local importance of a port given. Containerized goods transportation network have been contracted between 2008 and 2010 respect the port throughput, but there no contraction in the distribution capacity of the main hub ports, which seem to have adopted commercial diversification strategies and foreland expansion. On the other hand, port emergent regions placed in the entrance and exit of Panama Canal will have important business opportunities.

DOI

[36]
Lee H, Boile M, Theofanis S,et al. 2012. Modeling the oligopolistic and competitive behavior of carriers in maritime freight transportation networks.Procedia - Social and Behavioral Sciences, 54: 1080-1094.The paper presents a novel multi-level hierarchical approach which models the oligopolistic and competitive behavior of carriers and their relationships in maritime freight transportation networks. With the merger of the carriers industry and some dominant carriers in a shipping market, the carrier competition frequently exhibits an oligopolistic nature. Three types of carriers are considered herein; ocean carriers, land carriers and port terminal operators. The oligopolistic ocean carriers, land carriers and port terminal operators compete with each other in their pricing and routing decisions, respectively. The carriers determine service charges and delivery routes at different parts of the multimodal freight network, having hierarchical interactions. In a game theoretic approach, ocean carriers are regarded as the leaders in an oligopoly shipping market. Port terminal operators are the followers of ocean carriers as well as the leaders of land carriers. For the individual carrier problems, Nash equilibrium is used to find the optimal decisions for which each carrier obtains the greatest profit. A three evel model is formulated to capture the interactions among different types of carriers. A numerical example is presented to demonstrate the validity and capability of the model.

DOI

[37]
Lee H, Moile M, Theofanis Set al., 2014. Game theoretical models of the cooperative carrier behavior.KSCE Journal of Civil Engineering, 18(5): 1528-1538.This paper presents a multi-level modeling approach which captures the cooperative behavior of carriers in maritime freight transportation networks. Ocean carriers, land carriers and port terminal operators are considered. Port terminal operators are regarded as a special type of carrier for modeling purposes. Ocean carriers are the leaders in a maritime shipping market. Port terminal operators are the followers of ocean carriers as well as the leaders of land carriers. For cooperating ocean and land carriers, compensation principle is used to find the optimal service charge and routing pattern that maximize their total profit, while port terminal operators act competitively. The concept of Stackelberg game is applied to a multi-level game, assuming a single ocean shipping company (leader) through an alliance. Subsequently, the paper considers cooperation between ocean carriers and port terminal operators, while individual carriers within the same group are considered to act competitively. Cooperative games within the same carrier group and between different groups of carriers are examined and compared with competitive games. A numerical example is presented to demonstrate the validity of the developed model.

DOI

[38]
Lei P R, 2016. A framework for anomaly detection in maritime trajectory behavior.Knowledge and Information Systems, 47(1): 189-214.Rapid growth in location data acquisition techniques has led to a proliferation of trajectory data related to moving objects. This large body of data has expanded the scope for trajectory research...

DOI

[39]
Li K X, Yin J, Bang H S,et al. 2014a. Bayesian network with quantitative input for maritime risk analysis.Transportmetrica A: Transport Science, 10(2): 89-118.This article presents an innovative approach towards integrating logistic regression and Bayesian networks (BNs) into maritime risk assessment. The approach has been developed and applied to a case study in the maritime industry, but has the potential for being adapted to other industries. Various applications of BNs as a modelling tool in maritime risk analysis have been widely seen in relevant literature. However, a common criticism of the Bayesian approach is that it requires too much information in the form of prior probabilities, and that such information is often difficult, if not impossible, to obtain in risk assessment. The traditional and common way to estimate prior probability of an accident is to use expert estimation (inputs) as a measure of uncertainty in risk analysis. In order to address the inherited problems associated with subjective probability (expert estimation), this study develops a binary logistic regression method of providing input for a BN, making use of different maritime accident data resources. Relevant risk assessment results have been achieved by measuring the safety levels of different types of vessels in different situations.

DOI

[40]
Li Z F, Li H, Xu M Qet al., 2014b. Comparison research on reachability of the global shipping network.Journal of Dalian Maritime University, 40(1): 101-104. (in Chinese)To study the role of Arctic shipping routes in the developing of global shipping network,a more suitable model based on the Gravity model from the perspective of reachability was proposed. Comparative study on the effects of the Suez Canal,the Panama Canal and the Arctic shipping routes on the world shipping network show that fully-opened Arctic routes will bring unprecedented changes for the world. This paper can provide the basis for further studies focusing on the evolution of global shipping network.

[41]
Li Z F, Shi Y L, Xu M Qet al., 2016. Heterogeneity of global shipping network.China Science Paper, 11(7): 793-797. (in Chinese)Basing on the container shipping routes and ports data from 17 major liner companies,aglobal shipping network was developed.Topological structure of shipping network was analyzed using complex network theory.The results of degree and degree distribution,clustering coefficient,average path length and betweenness show that,shipping network was a scale-free network with clustering feature and small-world feature,which has hierarchical structure.Lorenz curves and Gini coefficient which are used to measure equality of income distribution in economics were applied to quantitatively analyze heterogeneity of global shipping network.The Gini coefficient of global shipping network was 0.554,which indicated the heterogeneity level of the network was very high.

[42]
Liu C L, Wang J Q, Zhang H, 2017. Spatial heterogeneity of ports in the global maritime network detected by weighted ego network analysis.Maritime Policy & Management, 1-16.More extensive attention has been paid to the heterogeneity of maritime transport network in topological rather than in spatial aspects. However, the importance of links and the roles of neighbors of a node has been ignored if not all. To fill this gap, this article introduced the approach of weighted ego network analysis (WENA) to visualize the spatial heterogeneity of the maritime network at global and local levels. The topological connectivity graph of the global marine network was derived, and its structural properties were analyzed. It is found out that the values of the degree of ports follow power-law distribution, which indicates that the global marine network is scale-free, that is, there are few well-connected ports and a majority of less connected ports. The spatial disparities of the network can be described by a core eriphery pattern. In global, most of the hubs or ports with extremely high values of degree locate in the big-three maritime regions including Far East, North America, and West Europe. Along the peripheral belts of the three regions, there are lots of less connected small ports. A different hierarchical structure of six continents was captured by WENA. It is found that Europe, Asia, North America, and Africa showcase a pyramid-shaped hierarchical structure with a scale-free feature similar to the entire network, while South America and Oceania exhibit the fusiform hierarchy like small-world networks. It is proposed that such spatial inequality and heterogeneity were caused by the geographical environments such as the hub-and-spoke organization, the embedded trade pattern, and the proximity of location. These findings help us to understand the characteristics of the international trade pattern and shed light on the strategies of development for the industry stakeholders.

DOI

[43]
Liu C J, Hu Z H, 2017. Hierarchy system research about the maritime silk road shipping network.Economic Geography, 37(7): 26-32. (in Chinese)Based on the 777 ports' route connecting data of the top 10 global container liner shipping companies,maritime transport links among the 26 countries along the Maritime Silk Road was collected. Using countries as the nodes, construct route number weighted network and trade frequency weighted network. Hierarchical structure of the Maritime Silk Road network in twenty-first century is analyzed through a combination of dominant flows and significant flows. The results show that route number weighted network has an obvious hierarchical structure, and the trade frequency weighted network has a certain hierarchical structure too, but it is not obvious. In the two kinds of weighted network, the United Arab Emirates is in the first level, which is the core country of the Maritime Silk Road network.China and Singapore, two world-class shipping countries are both in the second level of the Maritime Silk Road network according to the multiple analysis results.

[44]
Lloyd S P, 1982. Least squares quantization in PCM. IEEE Transactions on Information Theory, 28(2): 129-137.

DOI

[45]
MacKinlay A C, 1997. Event studies in economics and finance.Journal of Economic Literature, 35(1): 13-39.The event study is an important research tool in economics and finance. The goal of an event study is to measure the effects of an economic event on the value of firms. Event study methods exploit the fact that, given rationality in the marketplace, the effects of an event will be reflected immediately in security prices. Thus the impact can be measured by examining security prices surrounding the event. In this paper event study methods are described including some of the potential complications. An example is included to illustrate the approach.

DOI

[46]
MacQueen J B, 1967. Some methods of classification and analysis of multivariate observations. In: Proceedings of the Fifth Berkeley Symposium on Mathematical Statistics and Probability, 281-297.

[47]
Mohamed-Chérif F, Ducruet C, 2016. Regional integration and maritime connectivity across the Maghreb seaport system.Journal of Transport Geography, 51: 280-293.Models and empirical studies of port system evolution dominantly focus on land-based dynamics. Hence, it is traditionally recognized that such dynamics condition the evolution of ports and their relations as well as wider regional integration processes. The Maghreb region (Algeria, Morocco, and Tunisia), which is currently responsible for no less than one-third of all African port throughputs, offers a fertile ground to test the possibility for regional integration to occur through maritime linkages despite limited trade integration and land-based transport connectivity. Main results highlight the increase of trans-Maghreb maritime connectivity but this occurs mostly at the periphery of the system based on transit flows. Logistical integration versus trade integration is discussed in light of the recent evolution of Maghreb ports and of the region in general.

DOI

[48]
Peng P, Cheng S F, Liu X Let al., 2017. The robustness evaluation of global maritime transportation networks. Acta Geographica Sinica, 72(12): 2241-2251. (in Chinese)The structural robustness of maritime transportation network describes the antijamming ability of maritime transportation system,which is closely related to the transportation efficiency.Current researches on the robustness of maritime transportation networks mainly focus on the container transportation network,but ignore the type difference of cargo ships or even ports.This paper builds a more complete global maritime transportation network with the AIS data of the global cargo ships in 2015.Then,for the three transportation modes,namely oil tanker,container and bulk carrier,it proves that the three networks are complex networks with topological structures following the power law distribution,and three attack strategies including a random attack and two intentional attacks are conducted to evaluate the survivability of the corresponding transportation networks in different situations.The results show that:(1) in sharp comparison to the transportation network based on OD information of container liners,the networks constructed with the AIS data of the cargo ships fully reflect the global cargo transportation pattern and process;(2) The robustness of different maritime transportation networks differs greatly,with the container transportation network being the weakest and the bulk carrier transportation network the strongest.(3) Small intentional attacks may exert greater impact on the integrity of the container transportation network,but have less impact on bulk carrier transportation network and oil tanker transportation network.It is argued that these conclusions can help to improve decision support capabilities on maritime transportation planning and emergency response,which facilitates the establishment of a more reliable maritime transportation system.

[49]
Rodrigue J P, 2017. The governance of intermediacy: The insertion of Panama in the global liner shipping network.Research in Transportation Business and Management, 22: 21-26.The paper investigates the emergence of Panama as a major intermediary location in the global liner shipping network and the associated governance changes. From its initial function of a point of transit, Panama became a tollbooth with the setting of the Panama Canal mostly servicing intercoastal networks. Then, with the growth of transpacific trade and increasing ship sizes Panama became a major transshipment hub, a process facilitated by reforms of its port governance with setting of a landlord port authority model and concessions to private terminal operators. With the emergence of Panama as a logistics platform, governance has gone beyond the realm of the port. The setting of a national Logistics Cabinet in 2014 is illustrative of that trend aiming at coordinating the operations of the Panama Canal (with its expanded locks), port activities focusing on transshipment and the setting of port centric logistics zones. Still, the intermediary location of Panama is facing some risk in the post expansion era since shipping lines are no longer forced to use Panama and could elect for other transshipment hubs. In light of the emerging commercial context, it remains to be seen how the connectivity of Panama will fit within global supply chain strategies.

DOI

[50]
Rodrigue J P, Browne M, 2002. International Maritime Freight Movements and Logistics.Transport Geographies: An Introduction, 156-178.

[51]
Schinas O, von Westarp A G, 2017. Assessing the impact of the maritime silk road.Journal of Ocean Engineering and Science, 2(3): 186-195.

DOI

[52]
Silva V M D, 2013. The dynamics of the collaborative maritime transportation.Proceedings Volumes, 46(24): 79-86.A model is presented to analyse the systemic effects of collaboration among manufacturing industries that use maritime transportation for export purposes. A study was conducted about System Dynamics (SD). The proposed model analysed the systemic effects from the collaborative policies of manufacturing industries, which increase bargaining power when the industries are allied to each other and can reduced maritime freight rates. This work contributed to elucidate the importance of using an interdisciplinary approach to address problems in maritime transportation.

DOI

[53]
Song D P, Zhang J, Carter J,et al. 2005. On cost efficiency of the global container shipping network,Maritime Policy and Management, 32(1): 15-30.

DOI

[54]
Song D W, Lee P T W, 2009. Maritime logistics in the global supply chain.International Journal of Logistics Research and Applications: A Leading Journal of Supply Chain Management, 12(2): 83-84.

[55]
Stopford M, 2009. Maritime Economics. London and New York: Routledge.

[56]
Tai H H, Hwang C C, 2005. Analysis of hub port choice for container trunk lines in East Asia.Journal of the Eastern Asia Society for Transportation Studies, 6: 907-919.

[57]
Talley W K, Ng M W, 2013. Maritime transport chain choice by carriers, ports and shippers.International Journal of Production Economics, 142: 311-316.A maritime transport chain is a network over which carriers, ports and shippers are involved in the movement of cargo. This paper formally deduces that the port choice literature is included in the maritime transport chain choice literature. Specifically, it demonstrates that determinants of the port choice by shipping lines and shippers found in the literature and determinants of shipping line and shipper choice by ports are also determinants of maritime transport chain choice. Further, a maritime transport chain is formalized as an equilibrium model. Existence and uniqueness results for the proposed maritime transport chain model are derived. (C) 2012 Elsevier B.V. All rights reserved.

DOI

[58]
Tian W, Deng S G, Wu P Jet al., 2007. Analysis of complexity in global shipping network.Journal-Dalian University of Technology, 47(4): 605. (in Chinese)Shipping system can be defined abstractly as a network composed of ports and sea routes.The structure and the geometric characteristics of the network have important effects on the layout and management of ports and sea routes.Based on the brief summarization of the development,properties and representative research achievements of complex networks,an empirical analysis in Maersk-Sealand group global sea routes network is made.It focuses on the small-world effect,scale-free properties,analyzing the reasons accounting for some individuality of the network.The research is designed to provide the government and shipping enterprises with scientific research methods and theoretical support for the management of the ports and the programming of sea routes in the future.

DOI

[59]
van Leeuwen J, 2015. The regionalization of maritime governance: Towards a polycentric governance system for sustainable shipping in the European Union.Ocean & Coastal Management, 117: 23-31.61Maritime governance is subject to processes of regionalization.61IMO's ambition level, level of enforcement and the global nature of standards are contested.61The EU and the Paris MoU on Port State Control have become loci of authority next to IMO.61Maritime governance has become more polycentric in nature.

DOI

[60]
Viederyte R, 2013. Maritime cluster organizations: Enhancing role of maritime industry development.Procedia: Social and Behavioral Sciences, 81: 624-631.This paper analyzes Maritime Cluster Organizations importance for Maritime Industry future development by comparing Sector Associations and Maritime Cluster organizations, those structures, innovation, specialization levels and future perspective approach. Sector associations are mostly members of cluster organizations in order to cooperate on the realization of common interests. The main differences established between the characteristics of maritime cluster organizations are based upon the following areas: the initiative (top-down vs. bottom-up), budget resources and geographical scope. Cluster issues need to be handled within the cluster organizations based on transparency, communication and on the presence of leading individuals within the Cluster Organization.

DOI

[61]
Viljoen N M, Joubert J W, 2016. The vulnerability of the global container shipping network to targeted link disruption.Physica A, 462: 396-409.61The global maritime network is robust, remaining functional and connected after multiple disruptions.61Network flexibility is impeded by both strategies, with transshipment implications.61The betweenness strategy is more effective in reducing flexibility.61The salience strategy significantly reduces commonality among the shortest path sets.61Salience reduces the effectiveness of the underlying disruption strategies.

DOI

[62]
Wang C J, Wang J E, 2011. Spatial pattern of the global shipping network and its hub-and-spoke system.Research in Transportation Economics, 32(1): 54-63.Port system is a research focus of transport geography, and most studies believe carriers are important factors in the development and concentration of the port system. Since the 1990s, carriers have played an important role in organizing the global shipping network and reorganizing the port system. But there isn a perfect method to evaluate carriers influence and the roles of each port in the maritime shipping networks. In this paper, we use the monthly schedule table of international carriers to describe and model the spatial pattern of the global shipping network and identify its hub-and-spoke system. The result shows that a hierarchical structure exists in the global shipping network. The North Hemisphere, especially the East Asia and the Southeast Asia, is a dominant region of the worldwide shipping network. East Asia, Southeast Asia, Northeast Europe, and East coast of the USA are the concentration regions of worldwide shipping lines. The ports of Hong Kong, Singapore, Shenzhen, Shanghai, and Kaohsiung etc have advanced capacity for maritime shipping and high potentials for being hub ports in the global shipping network. Today, the worldwide shipping network is transforming from the multi-port calling system to 44 regional hub-and-spoke systems. Meanwhile, the sub-networks with hub ports of Antwerp, Singapore, and Hong Kong have become the most important ones and dominate the whole global shipping network.

DOI

[63]
Wang N, Dong L L, Wu N,et al. 2016. The change of global container shipping network vulnerability under intentional attack.Acta Geographica Sinica, 71(2): 293-303. (in Chinese)

[64]
Wu D, Wang N, Wu Net al., 2017. The impact of main channel interruption on vulnerability of container shipping network and China container shipping.Geographical Research, 36(4): 719-730. (in Chinese)The Malacca Strait, the Suez Canal and the Panama Canal are the main channels in the global container shipping network. As the dependence of the world economy on container shipping constantly increases and terrorism wantonly spread, research of the impact of main channel interruption on the global container shipping network and China container shipping is of great significance in analyzing the vulnerability of the global container shipping network,establishing and improving the security mechanism of the global economy operation and guaranteeing unobstructed container shipping between China and other regions. To study the impact, we performed a statistical analysis of all ports and shipping lines that are operated by the top 100 container shipping companies in 2015, which occupy 93% of the global container shipping capacity. The results indicate that there are 2827 shipping lines and 734 ports in the global container shipping network. Based on the statistics, we calculated the change rates of network average degree, isolated-node proportion, clustering coefficient, network average shortest-path length and network efficiency of the network when the main channels are attacked respectively. The average of the change rates of the network's metrics are 5.61%,3.50% and 1.89% when the Malacca Strait, the Suez Canal and the Panama Canal are attacked respectively. So the network is sensitive to the three main channels, and the Malacca Strait is the most influential channel, followed by the Suez Canal and the Panama Canal. At the same time, we analyzed the impact on China container shipping by combining the characteristics of global marine geography. The node degrees of 12, 6 and 6 ports in China decrease when the main channels are attacked respectively, and the network shortest-path lengths between the affected ports in China and other ports in the world increase in varying degrees, so the transport efficiency decreases obviously. Finally, to guarantee unobstructed container shipping between China and other regions, we present the alternative shipping lines by detour transportation or sea-land multimodal transportation according to different main channels, and make corresponding policies from the maritime security perspective.

[65]
Xu M Q, Li Z F, Shi Y L,et al. 2015a. Evolution of regional inequality in the global shipping network.Journal of Transport Geography, 44: 1-12.Global shipping is a backbone of the global economy, and as such, it evolves alongside the development of trade and the elaboration of commodity chains. This paper investigates the evolution of regional inequality in the global shipping network by analyzing the changing positions of world regions during the period from 2001 to 2012. This was a period of both prosperity and recession in maritime shipping. Using data on inter-regional flow connections, the positions of seventeen regions in the global shipping network are analyzed in terms of their traffic development, centrality, dominance and vulnerability. The East Asian, Northwest European and Europe Mediterranean regions have consistently held the highest positions, while East African and North African regions have held the lowest positions. By commanding the largest flows in the network, East Asia assumes a dominant position. The Australasian, North American West Coast, Northwest European and Southern African regions show an increasing dependency on East Asia. The analysis also identifies a few emerging regions that have had the highest growth rates in total traffic volume and connectivity for the studied period, namely South American North Coast, South American East Coast, West Africa, Southern Africa and West Asia. The empirical results of this paper supplement existing research on global shipping network evolution. One implication of the analysis is that the traffic growth of East Asia does not imply that, there is an equivalent improvement in its position in the global shipping network. The paper also shows that indicators from network analysis may be used to provide a more nuanced understanding of port-regional development than existing measures based solely on total traffic volume.

DOI

[66]
Xu M Q, Li Z F, Shi Y L,et al. 2015b. Spatial linkage of global container shipping network.Journal of Shanghai Maritime University, 36(3): 6-12. (in Chinese)

[67]
Yu H C, Fang Z X, Peng G J,et al. 2017. Revealing the linkage network dynamic structures of Chinese maritime ports through automatic information system data.Sustainability, 9(10): 1913.

DOI

[68]
Zeng Z B, Yang Z, 2002. Dynamic programming of port position and scale in the hierarchized container ports network.Maritime Policy and Management, 29(2): 163-177.A hierarchized container ports network, with several super hubs and many multilevel hub ports, will be established, mainly serving transshipment and carrying out most of its business in the hub-spoke mode. This paper sums up a programming model, in which the elementary statistic units, cost and expense of every phase of any shipment are the straight objects, and the minimum cost of the whole network is taken as the objective. This is established based on a dynamic system to make out the hierarchical structure of the container ports network, i.e. the trunk hub and feeder hubs can be planned in a economic zone, then the optimal scale vector can also be obtained for all container ports concerned with the network. The vector is a standard measurement to decide a port's position and their scale distribution in the whole network.

DOI

Outlines

/